55
I. Crop Insurance Overview II. Geographic and Intertemporal Smoothing Considerations III. Public Policy Discussion Organization of Presentation
| Date post: | 01-Jan-2016 |
| Category: |
Documents |
| Upload: | oswald-lambert |
| View: | 214 times |
| Download: | 0 times |
I. Crop Insurance Overview II. Geographic and Intertemporal
Smoothing Considerations III. Public Policy Discussion
Organization of Presentation

I. Crop Insurance Overview
A. Legislative History B. Crop Insurance Coverages C. Public/Private Partnership
A. Legislative History1938 - 1990
• Issuance of federally subsidized crop insurance policies originated with 1938 legislation
• Current authorizing legislation is 1980 Federal Crop Insurance Act (FCIA) – first time use of private insurance carriers is authorized
• FCIA amended periodically through annual appropriations legislation and 1985 and 1990 Farm Bills

Legislative History• Federal Crop Insurance Reform and
Department of Agriculture Reorganization Act of 1994 authorizes issuance of CAT, Limited and Additional coverage policies
Legislative History
• Federal Agriculture Improvement and Reform Act of 1996 (Freedom to Farm) directed USDA Secretary to transition all CAT policy sales and servicing to private insurance carriers
Legislative History• Agricultural Research, Extension and
Education Reform Act of 1998 authorizes permanent program funding, reduces private carrier reimbursements and increases producer administrative fees

948,883,471
1,543,065,324
1,838,783,282
1,768,746,276
1,871,784,716
2,304,570,725
-
500,000,000
1,000,000,000
1,500,000,000
2,000,000,000
2,500,000,000
PR
EM
IUM
S
1994 1995 1996 1997 1998 1999CROPYEAR
Multiple Peril Crop InsuranceAll Industry Premium Totals
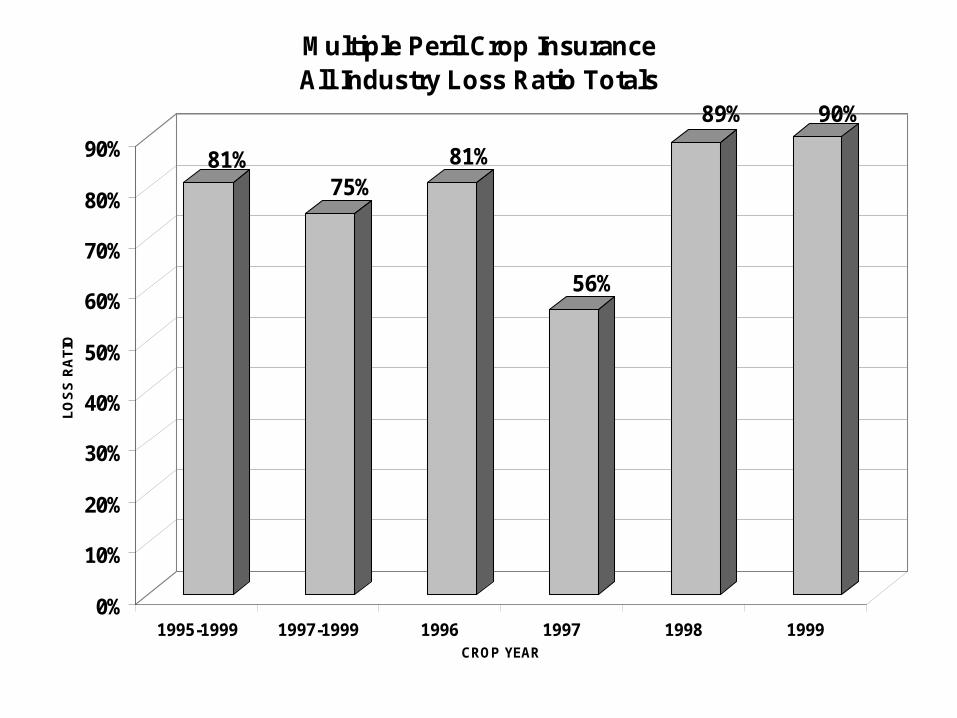
81%75%
81%
56%
89% 90%
0%
10%
20%
30%
40%
50%
60%
70%
80%
90%
LO
SS
RA
TIO
1995-1999 1997-1999 1996 1997 1998 1999CROP YEAR
Multiple Peril Crop Insurance All Industry Loss Ratio Totals

National Crop Insurance ServicesCrop Insurance 1998 Premium
CRC13%
GRP1%
IP0%
OTHER REVENUE0%
RA0%
CROP HAIL23%
MPCI63%
CRC GRP IP MPCI OTHER REVENUE RA CROP HAIL
8/5/1999
Source: RMA Summary of Business - 8/5/99
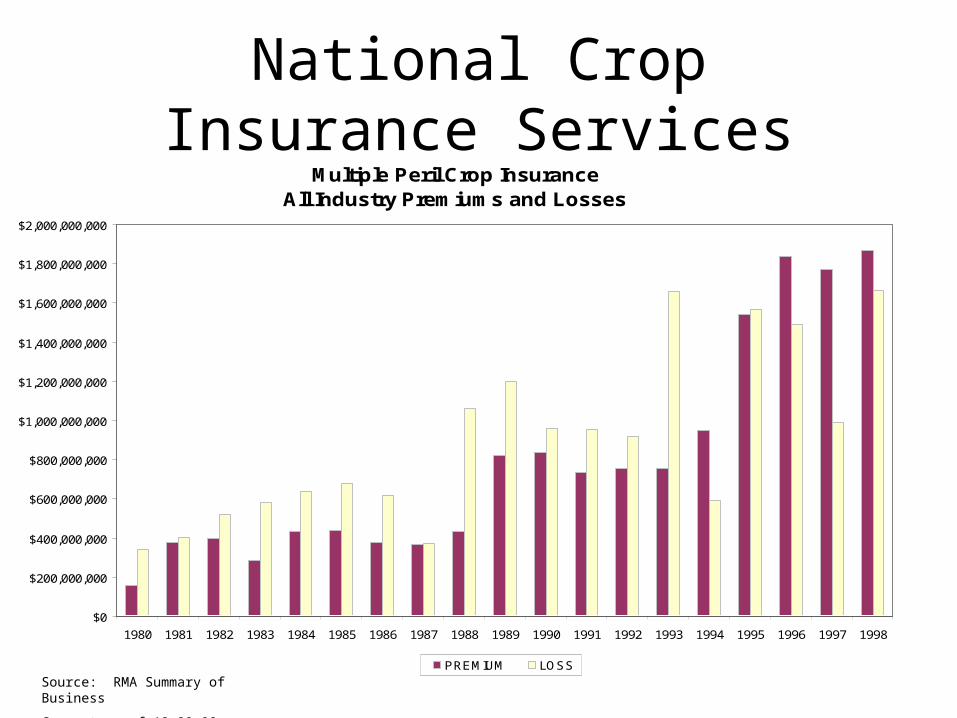
National Crop Insurance ServicesMultiple Peril Crop Insurance
All Industry Premiums and Losses
$0
$200,000,000
$400,000,000
$600,000,000
$800,000,000
$1,000,000,000
$1,200,000,000
$1,400,000,000
$1,600,000,000
$1,800,000,000
$2,000,000,000
1980 1981 1982 1983 1984 1985 1986 1987 1988 1989 1990 1991 1992 1993 1994 1995 1996 1997 1998
PREMIUM LOSS
Source: RMA Summary of Business
Current as of 12-29-98

Multi Peril Crop Insurance
MPCI
B. Crop Insurance Coverages

MPCI Basic Terms
• APH (Actual Production History)
• Coverage Options – Catastrophic (CAT) Coverage (50/60)
• Provide indemnity only for losses in excess of 50% of the guarantee at 60% of the price set for the crop
– Buy-Up Coverage: Refers to the levels available above the CAT level. (50%, 55%, 60%, 65%, 70%, 75%)
American Agrisurance, Inc., Marketing with Crop Revenue Coverage, p. 2 - 4

MPCI Basic Terms (continued)
• Price Election – May select 60% to 100% of the Market Price
• Market Price – Price per unit of production as determined by
RMA.– Price is set before sales closing date for the
crop
American Agrisurance, Inc., Marketing with Crop Revenue Coverage, p. 2 - 4

MPCI Basic Terms (continued)
• Production Guarantee (PG) The number of bushels or tons per acre determined by multiplying the APH times the elected coverage level (APH * CL)
• Production to Count (PTC) The actual bushels or tons per acre produced during the season.
American Agrisurance, Inc., Marketing with Crop Revenue Coverage, p. 2 - 4

MPCI Basic Terms (continued)
• Loss paid when production to count (PTC) falls below select coverage level (Production Guarantee)
• Formula: – PMT=[ACRES*PE*(YG - PTC)], +– When PMT is positive, a loss is paid
American Agrisurance, Inc., Marketing with Crop Revenue Coverage, p. 2 - 4

Catastrophic (CAT) Coverage
Catastrophic (CAT) crop insurance coverage in the U.S. indemnifies production losses
exceeding 50% of the producer’s 4-10 year average production history (APH) at
55% of the estimated market price established by the USDA’s Risk
Management Agency (RMA)

Catastrophic (CAT) Coverage
• CAT premium is 100% subsidized by RMA
• Producer pays a $60 administrative fee, which is collected by the insurance carrier at harvest (generally after October 1 for spring planted crops), who in turn pays the fee to RMA as part of the monthly accounting process
• Administrative fee is paid by RMA for farmers with limited resources
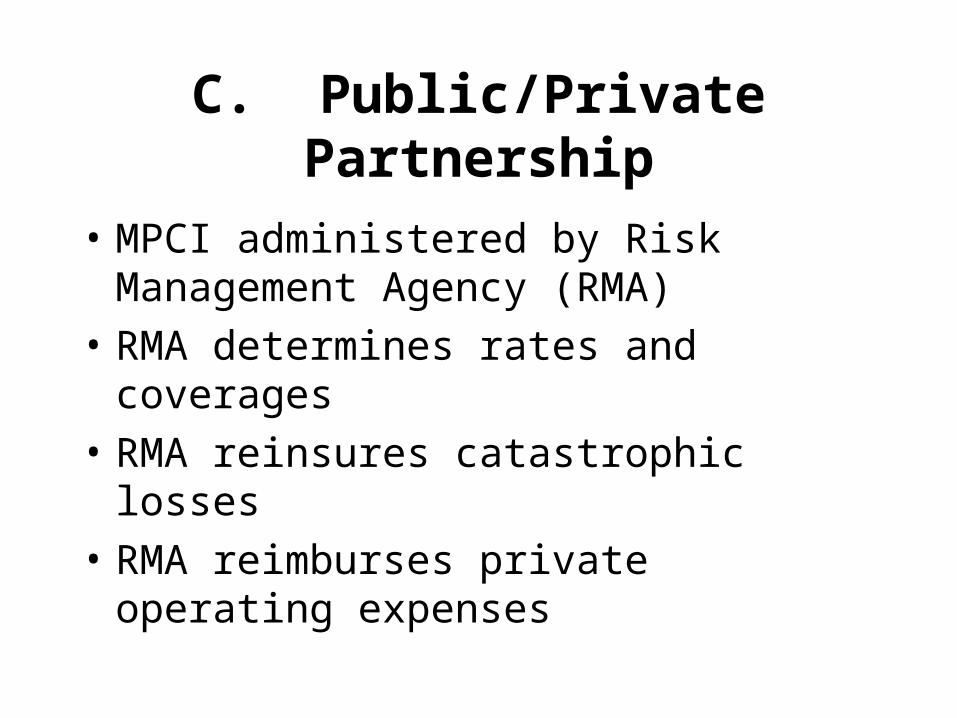
C. Public/Private Partnership
• MPCI administered by Risk Management Agency (RMA)
• RMA determines rates and coverages
• RMA reinsures catastrophic losses
• RMA reimburses private operating expenses

Public/Private PartnershipCompany Responsibilities
• Use of private agent network for sales and service
• Shares in crop loss with government
• Private sector loss adjustment

National Crop Insurance Services
• Over 75 years with NCIS and predecessor organizations– CHIAA– NCIA
• NCIS was established in 1989

National Crop Insurance Services
• Statistical Organization• Develop loss adjustment methods and
adjuster training• Fund agricultural research• Develop and maintain education/training
standards and materials• Coordinate national and regional education
and training activities
II. Geographic and Intertemporal Smoothing Considerations
i.e., County ratemaking
Presented by Frank Schnapp
National Crop Insurance Services
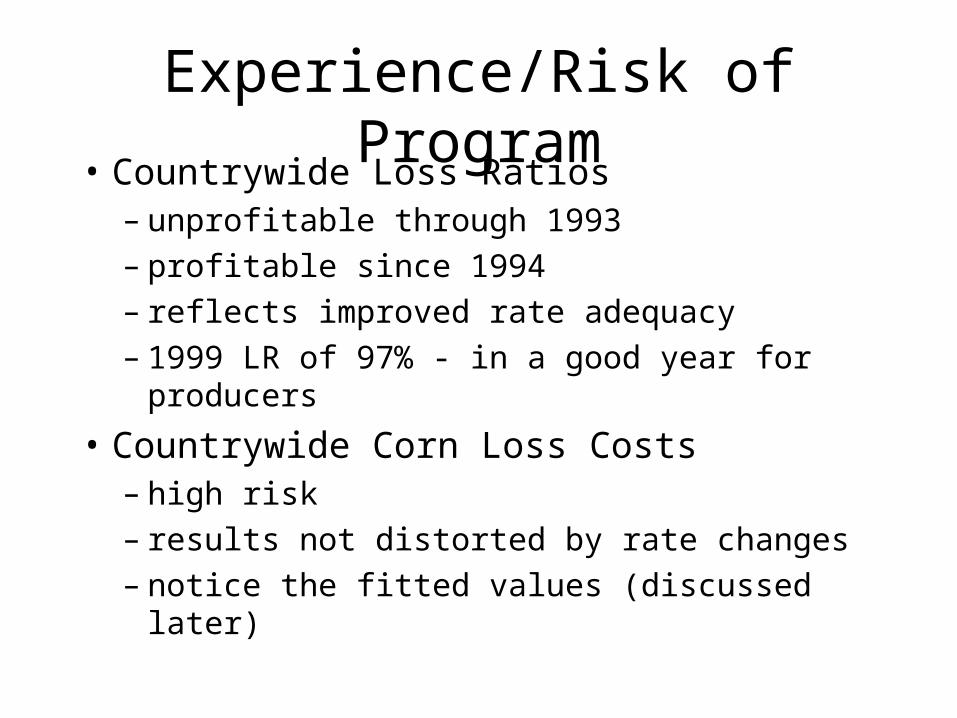
Experience/Risk of Program• Countrywide Loss Ratios
– unprofitable through 1993– profitable since 1994– reflects improved rate adequacy– 1999 LR of 97% - in a good year for producers
• Countrywide Corn Loss Costs– high risk– results not distorted by rate changes– notice the fitted values (discussed later)


Agronomic Considerations
• Planting season may vary by crop
• Perils may differ during course of a year
• Crops may differ in their response to drought and other perils
==> Be cautious in combining the experience of different crops
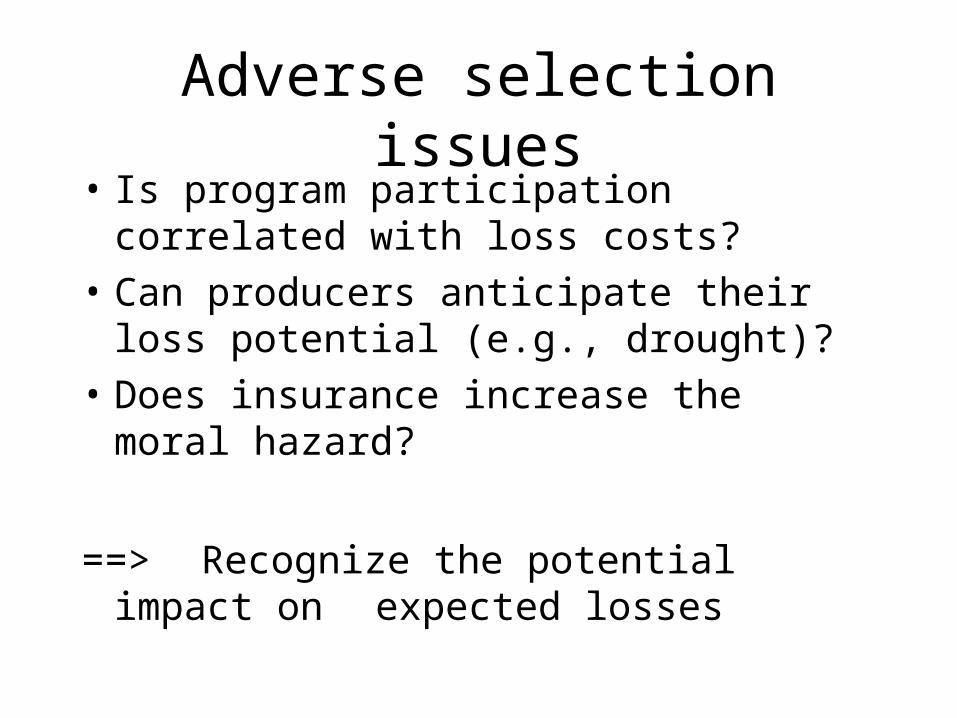
Adverse selection issues• Is program participation correlated with loss
costs?
• Can producers anticipate their loss potential (e.g., drought)?
• Does insurance increase the moral hazard?
==> Recognize the potential impact on expected losses
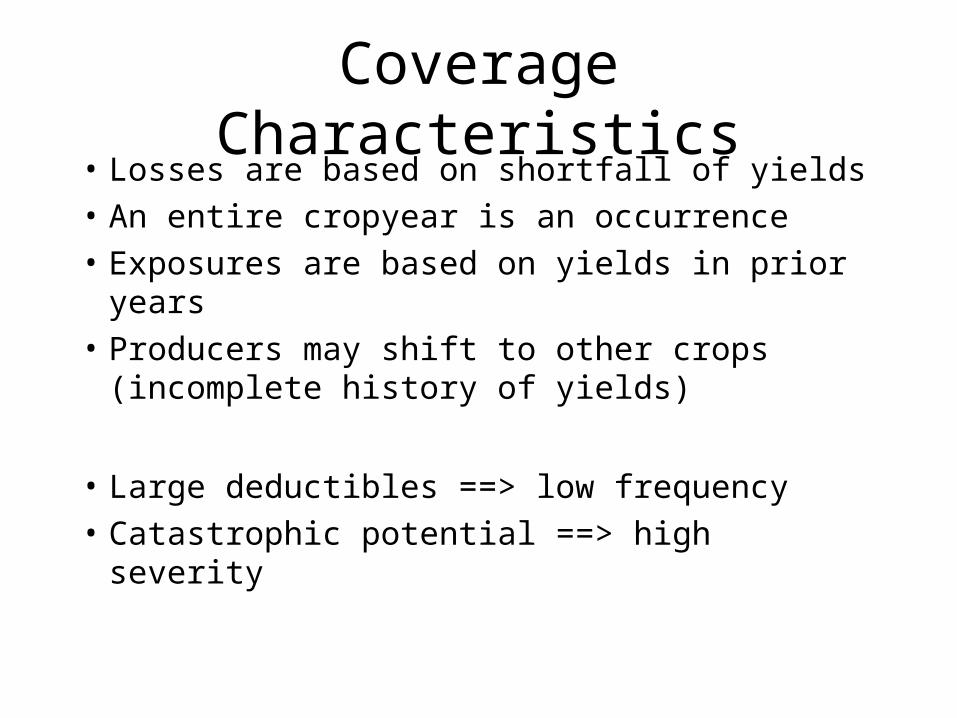
Coverage Characteristics• Losses are based on shortfall of yields
• An entire cropyear is an occurrence
• Exposures are based on yields in prior years
• Producers may shift to other crops (incomplete history of yields)
• Large deductibles ==> low frequency
• Catastrophic potential ==> high severity
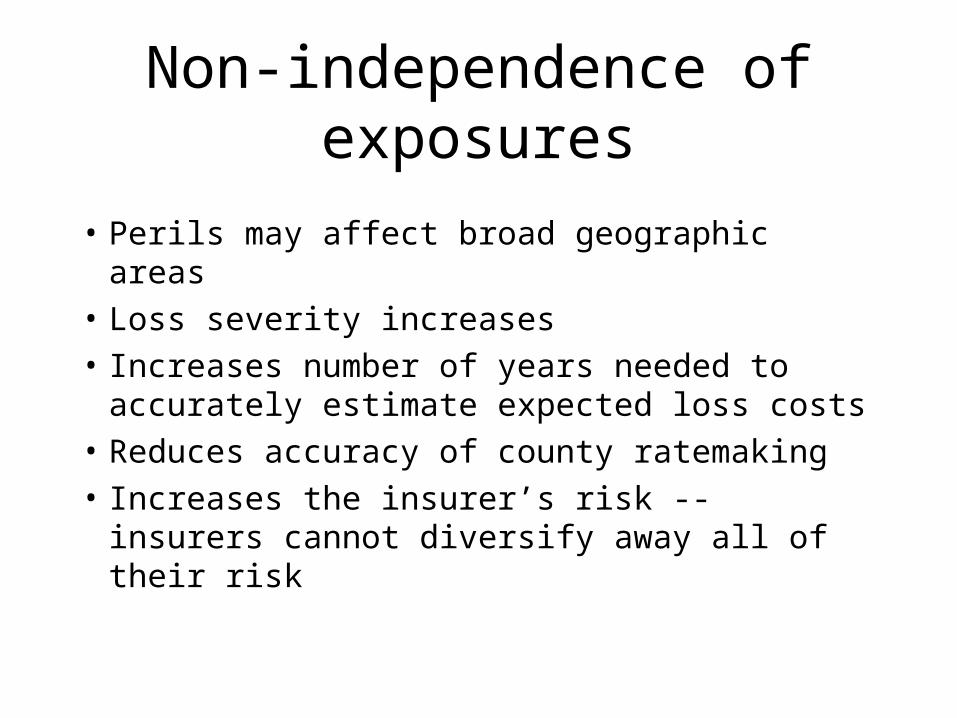
Non-independence of exposures
• Perils may affect broad geographic areas
• Loss severity increases
• Increases number of years needed to accurately estimate expected loss costs
• Reduces accuracy of county ratemaking
• Increases the insurer’s risk -- insurers cannot diversify away all of their risk


County Experience
• Iowa Corn chart– low frequency of loss– damages can approach 100%
• Texas Cotton chart– high frequency– damages are moderate but can approach 100%


MPCI Ratemaking Objectives
• Rates must be sufficient to pay expected losses and build a reasonable reserve
• No expense component in the rate
• Target Loss Ratio is 107.5%
• Rate stability - cap all increases at +20%
• Appropriate recognition of differences in risk between producers
Ratemaking Techniques• Judgment
– used when historical data is not available
• Loss Ratio method– This is a method for correcting an existing rate– Cannot determine MPCI current rate level
factors due to changes in rating structure– Low credibility of individual counties implies:
• county rate change statewide rate change
• pricing errors may not self-correct over time

Ratemaking Techniques (continued)
• Pure Premium method– used for pricing of standard MPCI coverages
• Statistical modeling– used for pricing of revenue coverages

Overview of Ratemaking
• 20+ years of experience
• 80/20 capping of county loss costs– consider Iowa Corn
• Spatial smoothing (concentric circle)
• Load for reasonable contingency reserve
• Load for excluded losses (capping; other perils)

Overview of Ratemaking (continued)
• Divide final county loss cost by current Rate to get loss ratio
• Compare to target LR of 107.5% to get rate change– Caps all rate increases at +20%– Determine final rate– Compute final rates for all coverage levels, etc.


Modeling using Annual Aggregates
• LR vs. Yield
• LC vs. Yield– See chart for Countrywide Corn, Fitted Values
• High aggregate yield ==>– High yields for individual producers (due to
high correlation of experience)– Low losses for individual producers– Low aggregate losses

Modeling using Variation of Yields
• LC vs. Coefficient of Variation of Yield– MPCI provides benefits when yields are low– Variation of yield is more relevant than average– Condense entire yield history into Coefficient
of Variation of Yield– Use CV of Yield to model county Loss Costs– See chart of Iowa Corn -- County Data

Modeling using Distribution of Producers’ Yields
• Fit distribution of yields for each year to a known probability distribution
• Predict effect of lower yields on frequency and severity
• Predict effect of redefining APH (average yield) on expected losses
• Simpler than modeling individual producer experience


Spatial Smoothing
• Concentric circle technique
• Fixed territory groupings (e.g., Crop Reporting Districts consisting of counties)
• Top down: State to CRD to County
• Loess, penalized least squares, etc.– Spatial regressions– Spatial least squares with restrictions– See charts of Hail loss costs before and after
smoothing


Spatial Smoothing (continued)• Spatial Credibility
– Best Linear Unbiased Estimator– Intertemporal Correlation: Nearby counties are
exposed to the same perils (drought, storms)– Spatial Correlation: Nearby counties have
similar agricultural characteristics, so should have similar loss costs
– May first need to model LC vs. CV of yields to remove explainable differences in loss costs
– Justifies concentric circle smoothing

Can we do better than the standard ratemaking procedures?
• Examine data using various approaches
• Consider non-insurance experience (yields, rainfall, temperature, soil types)
• Consider applicability of past experience
• Use redundant information from other counties
III. Public Policy Discussion
Crop Insurance Protection Bonus
• The Agriculture, Rural Development, Food and Drug Administration, and Related Agencies Appropriations Act, 1999 (Public Law 105-277), authorized $2.375 billion to assist farmers suffering from crop and economic losses
• $400 million of this used to provide an incentive for producers to purchase buy-up coverage by offering an additional 30% premium discount
• Additional crop insurance premium discount of $30 million was offered for producers who suffered multiple occurrences of scab and/or vomitoxin damage

Crop Insurance Protection Bonus
• 170,000 farmers increased crop insurance protection:– 91,000 CAT policies converted to buy-up policies
– 43,000 new Buy-up policies purchased
– 17% increase in crop insurance protection from $28 billion to $33 billion
• Renewal of the $400 million premium discount is provided for in pending legislation for USDA’s fiscal year 2000 appropriations


