ICS 139W Critical Writing on Information Technology Lecture 3 Emily Navarro Duplication of course material for any commercial purpose without the explicit written permission of the professor is prohibited Some slides in this lecture adapted from http://www.writing.engr.psu.edu/handbook/v isuals.html
Transcript
ICS 139WCritical Writing on Information
Technology
Lecture 3Emily Navarro
Duplication of course material for any commercial purpose without the explicit written permission of
the professor is prohibitedSome slides in this lecture adapted from http://www.writing.engr.psu.edu/handbook/visuals.html
Today’s Lecture
• Three Laws of Professional Communication
• Typography
• Illustration/Data visualization
Three Laws of Professional Communication
• Doumont, J-L. (2002). The three laws of professional communication. Professional Communication, IEEE Transactions on, 45(4), 291-296
Three Laws of Robotics (Asimov)
First law A robot may not injure a human being, or, through inaction, allow a human being to come to harm
Second law A robot must obey the orders given it by human beings except where such orders would conflict with the first law
Third law A robot must protect its own existence as long as such protection does not conflict with the first or second laws
Three Laws of Thermodynamics
First law Energy can transform, but cannot be created or destroyed.
Second law The entropy of a closed system always increases in time.
Third law By no finite series of processes is the absolute zero attainable
Three Laws of Professional Communication
1. Adapt to your audience
2. Maximize the signal/noise ratio
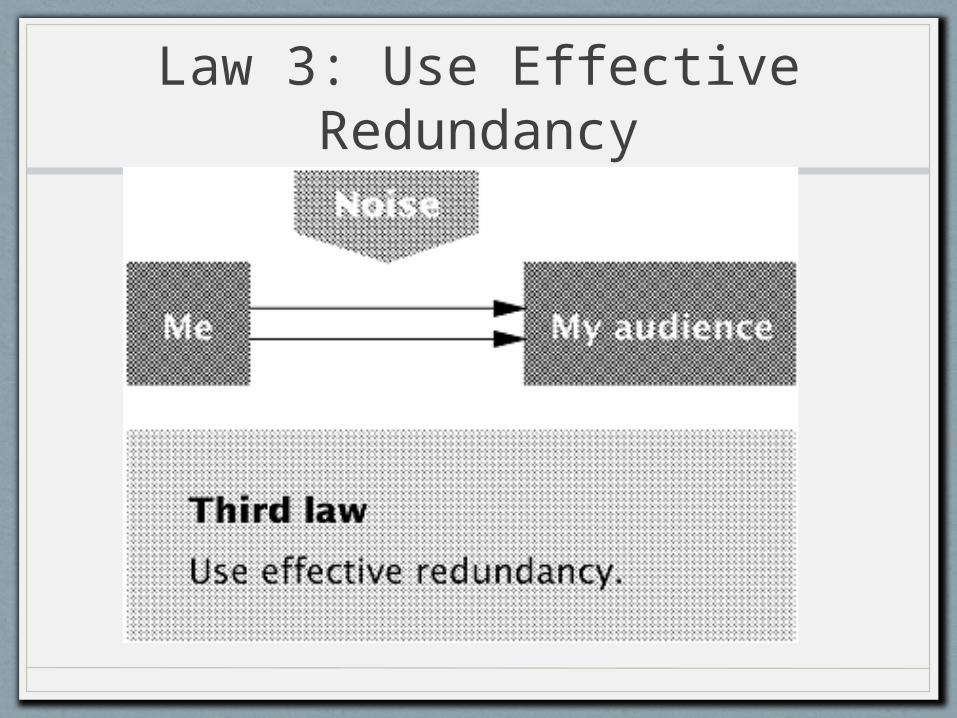
3. Use effective redundancy
*Three laws apply to both spoke and written communication
Premise: Optimize Under Constraints
• Get your audience to:• pay attention to,• understand,• (be able to) act upon
WORDS SET IN ALL CAPS USE MORE SPACE THAN TEXT SET IN LOWERCASE.
Words set in all caps use more space than words set in lowercase.
TYPE IS TO READ
Type is to read
Morton-Thiokol Presentation to NASAJanuary 27, 1986
PRIMARY CONCERNS -
FIELD JOINT - HIGHEST CONCERN
• EROSION PENETRATION OF PRIMARY SEAL REQUIRES RELIABLE SECONDARY SEAL FOR PRESSURE INTEGRITY• IGNITION TRANSIENT - (0-600 MS)
• (0-170 MS) HIGH PROBABILITY OF RELIABLE SECONDARY SEAL• (170-330 MS) REDUCED PROBABILITY OF RELIABLE SECONDARY
SEAL• (330-600 MS) HIGH PROBABILITY OF NO SECONDARY SEAL
CAPABILITY
• STEADY STATE - (600 MS - 2 MINUTES)• IF EROSION PENETRATES PRIMARY O-RING SEAL - HIGH PROBABILITY OF
NO SECONDARY SEAL CAPABILITY• BENCH TESTING SHOWED O-RING NOT CAPABLE OF MAINTAINING
CONTACTWITH METAL PARTS GAP OPERATING TO MEOP
• BENCH TESTING SHOWED CAPABILITY TO MAINTAIN O-RING CONTACT DURING
INITIAL PHASE (0 - 170 MS) OF TRANSIENT
Morton-Thiokol Presentation to NASAJanuary 27, 1986
Primary Concerns -
Field Joint - Highest Concern
• Erosion penetration of primary seal requires reliable secondary seal for pressure integrity• Ignition transient - (0-600 MS)
• (0-170 MS) High probability of reliable secondary seal
• (170-330 MS) Reduced probability of reliable secondary seal
• (330-600 MS) High probability of no secondary seal capability
• Steady State - (600 MS - 2 MINUTES)• If erosion penetrates primary O-ring seal – high probability of no secondary seal capability • Bench testing showed O-ring not capable of maintaining contact with metal parts gap operating to meop• Bench testing showed capability to maintain O-ring contact during initial phase (0 – 170 MS) of transient
Choose a type size that is easy to read
48 point
36 point
24 point
18 point
14 point
12 point
10 point
8 point
posters
presentation slides
titles
text
footnotes
Use white space for association, emphasis, and hierarchy
space for margins
space forillustrations
space forheadings
Follow the format that is expected or required for the situation
Illustration/Data Visualization
Table 1. Reactor power levels in Chernobyl accident [Wolfson, 1991].
Date Time Power Level
4/25 1:00 am 3200 MW
4/25 2:00 pm 1600 MW
4/25 11:10 pm 1600 MW
4/26 1:00 am 30 MW
4/26 1:19 am 200 MW
4/26 1:23 am 2,000,000 MW Figure 1. Simplified diagram of nuclear reactor [Wolfson, 1991].
CoolantLoss Reactor
Vessel
Core
Pressurizer
SteamGenerator
Two types of illustrations exist: tables and figures
Table 2. Sequence of events in the Chernobyl accident [Wolfson, 1991].
April 25
April 25
April 25
April 26
April 26
April 26
Date Time Power Level Event
1:00 a.m.
2:00 p.m.
11:10 p.m.
1:00 a.m.
1:19 a.m.
1:23 a.m.
3200 MW
1600 MW
1600 MW
30 MW
200 MW
2,000,000 MW
Operators begin power descent
Power descent delayed for 9 hoursEmergency core-cooling system disconnected
Operators switch off automatic controlPower descent resumed
When presenting images, you choose between photographs,
drawings, and diagrams
The main advantage of photographs is realism
Figure 2. Space Shuttle Challenger, from about 59 seconds to 60 seconds into launch (January 28, 1986). On the right rocket, flame first becomes visible and then impinges on tank.
59 seconds
59.5 seconds
60 seconds
One advantage of drawings is control of detail
SecondaryFlow
PrimaryFlow
SecondaryFlow
Turbine Vanes
Combustor Simulator
Dilution Jet
Film-Cooling Holes
The main advantage of a diagram is the ability to show flow of a variable
through a system
Figure 8. Flow of Information Through the Parts of a von Neumann Machine
Figure 5. Schematic of thermalstorage system.
RECEIVER
FLASHTANK
HPHTR
DEAR-ATOR
HOTWELL
TSSG
TURBINE
TSU
DSPH
TSH
FT
The thermal storage system stores heat in a huge, steel-walled tank. Steam from the solar receiver passes through heat exchangersto heat the thermal oil, which is pumped into the tank. The tank then provides energy to run a steam generator to produce electricity. A schematic of this system is shown in Figure 5.
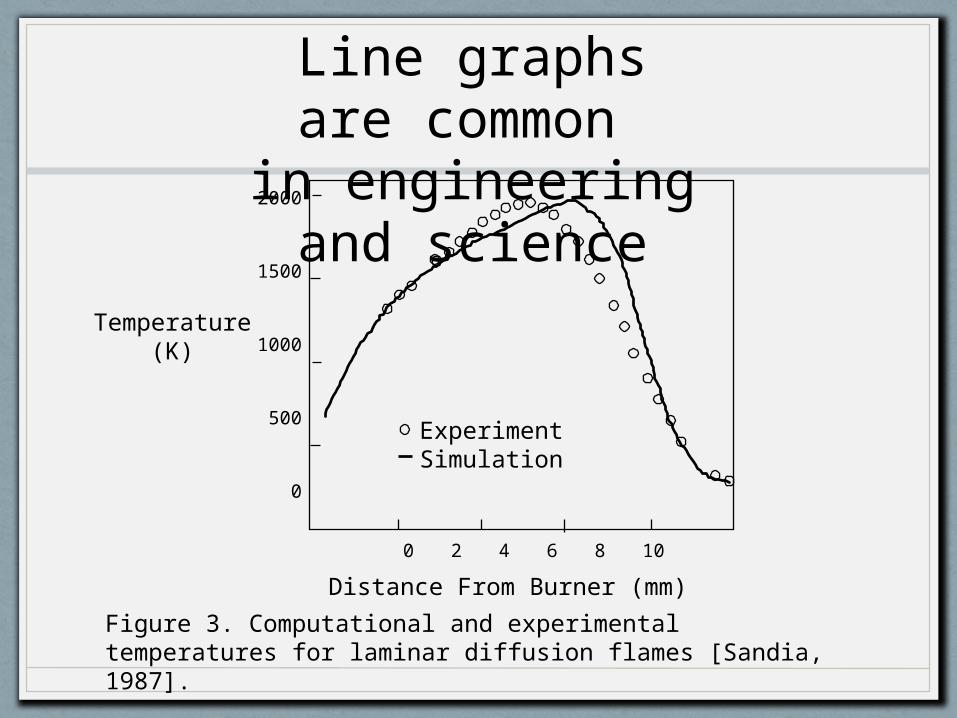
Scientists and engineers often use illustrations that are too complex
for the text
The thermal storage system, shown in Figure 6, stores heat in a huge, steel-walled tank. Steam from the solar receiver heats a thermal oil, which is pumped into the tank. The tank then provides energy to run a steam generator to produce electricity.
Figure 6. Schematic of thermal storage system for the solar power plant.
steamgenerator
650°F 580°F
425°F435°F
solarreceiver
575°F
425°F
530°F
250°F
ThermalTank
HeatExchanger
HeatExchanger
The precision of the illustrations
should reflect the precision of the text
Figure 7. Title of figure. Some formats allow you extra sentences to explain unusual details.
..., as shown in Figure 7….
For clarity, you should introduce and
explain illustrations in the text
The testing hardware of the rocket shown in Figure 8 has five main components: camera, digitizer, computer, I/O interface, and mechanical interface. Commands are generated by the computer, then passed through the I/O interface to the mechanized interface where the keyboard of the ICU is operated. The display of the ICU is read with a television camera and then digitized. This information is then manipulated by the computer to direct the next command.
PRINTERCONTROLTERMINAL
COMPUTERDIGITIZER
CAMERA
ELECTRO-MECHANICALINTERFACE
ROCKET
Figure 8. Testing hardware.
Inconsistencies between text and
images disrupt fluidity
Our system for testing the launch controls of the rocket consists of four main parts: computer, electro-mechanical interface, camera, and digitizer. In this system (shown in Figure 9), the computer generates test commands to the rocket through the electro-mechanical interface. The test results are read with a television camera, and then digitized. The computer receives the information from the digitizer, and then directs the next test command.
Figure 9. System to test launch controls for rocket.
CameraDigitizer
Computer
Electro-MechanicalInterface
1 2
34
Rocket
Illustration is the meshing of words with images
Summary – Three Laws
1. Adapt to your audience
2. Maximize the signal/noise ratio
3. Use effective redundancy
Summary – Typography/Illustration
• Good typography helps readers distinguish between elements on a page/slide/diagram
• Illustration is the meshing of words with images• Graphs• Charts• Tables• Diagrams• Photographs