ICS Financial Systems LTD (ICSFS) / HP Benchmark Project Optimization and high-watermark benchmarking of ICS BANKS ® on HP-UX Platform An HP White Paper Released March 2015 ICS BANKS Benchmark on HP-UX Platform Page 1
Transcript
ICS Financial Systems LTD (ICSFS) / HP Benchmark Project Optimization and high-watermark benchmarking of ICS BANKS®
on HP-UX Platform
An HP White Paper Released March 2015
ICS BANKS Benchmark on HP-UX Platform Page 1
TABLE OF CONTENTS
EXECUTIVE SUMMARY 3
OVERVIEW & BACKGROUND 3
ENVIRONMENT BUILD 4
TEST PLAN 7
TEST RESULTS 14
TEST FINDINGS 48
CONCLUSION 51
ICS BANKS Benchmark on HP-UX Platform Page 2
Executive Summary In February 2014 ICS Financial Systems (ICSFS) benchmarked their ICS BANKS® software suite on an HP Superdome 2 i4 HP-UX environment, achieving their best benchmarking results to-date. These results have enabled both HP & ICSFS to derive competitive benchmark data that demonstrates the powerful combination of ICS BANKS® and HP-UX running on Integrity i4 servers.
Overview & Background In 1978, International Computer Systems (London) Ltd. - (ICS (London) Ltd.) was established in UK as a system integrator and turn-key solutions provider to many industries. ICS Financial Systems (ICSFS), part of the ICS (London) Ltd. group, was founded in 2004 as a leading provider of modular, universal core banking systems. ICSFS’ primary offering is the multiple awards winning solution ICS BANKS® which serves and supports customers across the globe. ICS BANKS is a state-of-the-art software that delivers maximum value to banking clients of all sizes. This universal software is a complete suite of banking business modules with a rich sweep of functionality and features addressing business needs foremost, and automating accounting processes as needed, to enhance a customer’s business performance. ICS BANKS uses the latest technologies to cover all business areas such as Core banking, Remittances, Trade Finance, Lending, Credit Facilities & Risk Groups, Finance Leasing, Investment and Islamic Banking. The use of the latest technologies to provide availability, scalability and best performance is one of the goals achieved by implementing ICS BANKS. ICS BANKS is scalable and modular; each of its modules is parameterized to quickly support a client’s unique workflow, as many of its modules are designed to stand-alone, as implementation of any module can be separately accomplished. Therefore, each module can be integrated seamlessly with other business modules, on any platform, and can quickly interface with legacy system, and its open architecture capabilities to quickly interface with third-party applications. This design of the ICS BANKS system modules eliminates the need for any additional interface between modules and the core system, and streamlines data flow within the system, providing faster and easy-to-use software and insuring real STP. Finally, ICS BANKS gives the user the facility to deploy modules at any level, whether head office, branch or external delivery channels, such as Internet banking or Kiosks ICSFS is an HP AllianceOne partner with their ICS BANKS product.
This range of tests have been conducted jointly by ICSFS & HP in order to have comparative benchmark data of an HP hardware environment running ICS BANKS application to support customer requirements.
The Benchmark testing was undertaken at HP’s Atlanta Solution Centre by an ICSFS team in partnership with HP.
ICS BANKS Benchmark on HP-UX Platform Page 3
Environment Build The following hardware and software environment was built at HP’s Atlanta Solution Centre on joint specification with ICSFS:
• The Database tier comprises an HP Superdome 2 i4 split into 2 nodes providing 16 processors with 2048GB RAM. This was loaded with Oracle Database Enterprise edition 11gR2, Oracle RAC option and ICS BANKS® database.
• The Application Tier comprises 4 ProLiant DL380p Gen8 servers. These were loaded with Oracle WebLogic Server, Oracle Forms and Reports as well as the latest version of ICS BANKS®.
• A Test injection suite of HP SL355’s was loaded with Oracle OATS and used for test simulation. • The network/ SAN infrastructure was managed by an HP 3PAR 7450.
The database was loaded by ICSFS with anonymised Bank data to simulate a typical Tier 1 and Tier 2 Bank.
• Ghassan I. Sarsak, Project Manager, Research & Development Manager • Ra'ad M. Malkawi, Senior Java EE Architect, Research & Development • Tariq B. Saffarini, Executive Director, Research & Development • Ahmad M. Abu Shosheh, Senior Java EE Developer, Research & Development • Nabil A. Haj Omar, Business Development Manager, Operating System Infrastructure
From HP team were:
• On-site by Jeffrey English, System Architect • Remotely by Petra Kinsman, Project Manager, Solution Technology Services (STS) and Mark Bailey, Manager, ISV Business
Development (FSI)
ICS BANKS Benchmark on HP-UX Platform Page 6
Test Plan
Test Data: For the benchmarking exercise, ICSFS generated ICS BANKS data representative of a bank with 145M accounts, 3,000 branches and around 40,000 concurrent users. ICSFS team generated the following ICS BANKS data:
• 45M Customers • 145M Accounts consisting of the following types:
Test Methodology • ICSFS was responsible for preparing and running each test. ICSFS validated test results from a functional point of view. • HP was responsible for collecting information for each test to build both technical and summary white papers. • Tests were considered valid if:
- All components have a stable behavior (no CPU peaks, no peak in response time, stable throughput over a period of 30 minutes at minimum)
- Rate of failed transactions lower than 2% - No transaction failure due to ICS BANKS application.
Test Metrology: The metrics for each test were gathered using the following tools:
• TPS (Financial Transactions per Second) was be measured through Oracle Enterprise Manager. • Oracle AWR & ADDM reports • Average Transaction throughput was calculated over a period of 10 minutes of stable state using SQL query • ICSFS checked to ensure that transactions are properly passed. • HP ran certain tools for each test to gather performance and system information on all tiers (Database, Application, Storage, Network)
ICS BANKS Benchmark on HP-UX Platform Page 8
Test 1: 40K Concurrent Users (High-Watermark) The purpose of this test is to achieve high watermark results with high number of connected users and massive injection of financial transactions. In this test, OATS was used to simulate 40 000 concurrent ICS BANKS users during a ramp up time of around 60 minutes. Then the test ran for around 40 minutes where all test information and figures were collected. This test covers the following major daily banking operations: TPS Total Cash Withdrawal POS Purchase Loan Disbursement Open LC Open Time Deposit Outward Transfer Cash Deposit Cheque Clearing IBS/PBS Transaction ATM Transaction Transfer between customers Open LG
ICS BANKS Benchmark on HP-UX Platform Page 9
Test 2: ATM & E-channels The purpose of this test is to achieve high watermark results for delivery channel transactions. In this test, ICSFS Injector was used to inject the following financial transactions (FT) in a round robin way and the test ran for around 20 minutes:
- Internet Banking Fund Transfer - POS Purchase - ATM Cash Withdrawal
1 Balance Inquiry is issued every 5 FT’s The injector ran multi threads and each thread worked on different branches and different set of accounts.
Test 3: Capitalization Batch The purpose of this test is to achieve high watermark results for End of Month Interest Capitalization Batch. In this test, ICSFS launched the batch to process 145M accounts and the elapsed time was measured to calculate number of accounts processing per second.
Test 4: Internet Banking High-Watermark (TPS & Users) The purpose of this test is to achieve high watermark results for ICS BANKS Internet Banking System (IBS) in terms of throughput and number of concurrent online users. In this test, OATS was used to simulate 35,000 concurrent online users during a ramp up time of around 60 minutes. The test ran for around 20 minutes where all test information and figures was collected.
ICS BANKS Benchmark on HP-UX Platform Page 10
The following financial transactions mix are injected: Transaction Type Transfer between customers’ accounts Outward Transfer Open LC Payment Orders Transfer to another customers inside the bank Bills payment Cheque Book Request Salary Payments Standing Instructions Stop ATM card Stop CC card Credit Card Settlement
ICS BANKS Benchmark on HP-UX Platform Page 11
Test 5: Internet Banking High-Watermark (Users & Web Page visits) The purpose of this test is to achieve high watermark results for ICS BANKS Internet Banking System (IBS) in terms of concurrent online users and web page visits within a period of 30 minutes. This test measured the scalability and sustainability of ICS BANKS IBS to serve massive clients over 30 minutes while still ensuring efficient service delivery without any loss of speed or quality of service.
Test Expected Results:
Criteria Targeted Results
Concurrent ICS BANKS Users 40K
No. of ACCOUNTS 145 millions
No. of CUSTOMERS 45 millions
No. of BRANCHES 3,000
Test 1: ICS BANKS® High-watermark TPS 20K
Test 2: ATM & E-channels TPS 70K
Test 3:EOM Interest Capitalization Batch 60K interest capitalization per second
Test 4: IBS High-Watermark 1K TPS & 35K concurrent users
Test 5: IBS Users & Web page visits within 30 minutes
200K users & 3M web page visits
ICS BANKS Benchmark on HP-UX Platform Page 12
Project Timeline: Week 1:
- Kick off meeting - Loading Test Data ( 3000 Branches , 145M Accounts , 45M Customers) - Installing and configuring the injection tier (80 injectors)
Week 2:
- Finalize data loading and Injector configurations. - Pre-Tests validation - Test 1 – Final (in all tests, ICSFS will provide the test results for each test & HP to collect the needed information to build both technical
and summary white papers). - Test 2 - Final
Week 3:
- Test 3 – Final - Deploying Internet Banking software on the same Application Servers used for the core banking.
Week 4:
- Test 4 – Final - Test 5 – Final - Finalized all tests and ensured all test information was collected by HP to build both technical and summary white papers.
ICS BANKS Benchmark on HP-UX Platform Page 13
Test Results
Test 1: 42K Concurrent Users (High-Watermark) The purpose of this test is to achieve high watermark results with high number of connected users and massive injection of financial transactions. We were able to simulate 42k (42210) concurrent ICS BANKS users during a ramp up time of around 120 minutes. The test lasted for 35 minutes and the infrastructure did not show any bottleneck in that period. The following results and information were gathered during this period: Test Begin time 13:52pm 18 Feb 2014 Test End Time 14:26pm 18 Feb 2014 Concurrent ICS BANKS users 42k (42210) TPS (Financial Transactions) An average throughput of 22k (22056) financial transactions per second is sustained during the
test period of 35 minutes. TPS is gathered from Oracle Enterprise Manager and from the AWR reports from both nodes. Also Business Transaction Mix is shown in Table 1 below.
ICS BANKS Benchmark on HP-UX Platform Page 14
Transaction Mix TPS Total 22056 Cash Withdrawal 2707 POS Purchase 2707 Loan Disbursement 52 Open LC 51 Open Time Deposit 54 Outward Transfer 54 Cash Deposit 2844 Cheque Clearing 2707 IBS/PBS Transaction 2707 ATM Transaction 5415 Transfer between customers 2707 Open LG 51 Table 1: Transaction Mix
Infrastructure Results CPU usage on every server of the dedicated infrastructure – 20% CPU usage for the Database servers and less than 30% CPU usage for the Application servers.
The peak of the busiest disk during the test did not exceed 25% on the two Database servers.
The storage array has good response time: around 1 millisecond for read services and less than 0.8 millisecond for write services.
Infrastructure Resource Usage – Storage usage for Database servers
0
5
10
15
20
25
1:35:00PM
1:40:00PM
1:45:00PM
1:50:00PM
1:55:00PM
2:00:00PM
2:05:00PM
2:10:00PM
2:15:00PM
2:20:00PM
2:25:00PM
2:30:00PM
disk%
Peak of the busiest disk
db1
db2
ICS BANKS Benchmark on HP-UX Platform Page 18
Infrastructure Resource Usage – Storage usage for Database servers
0
500
1000
1500
2000
2500
3000
3500
0
20000
40000
60000
80000
100000
120000
IO/s
KB/s
I/O disk traffic
Bandwidth KBs
IOps
ICS BANKS Benchmark on HP-UX Platform Page 19
Infrastructure Resource Usage – Storage usage for Database servers
0
0.2
0.4
0.6
0.8
1
1.2
1.4
ms
response time
Read Service time
Write Service time
Total Service time
ICS BANKS Benchmark on HP-UX Platform Page 20
Infrastructure Resource Usage – Sub-components usage during the test
0
5
10
15
20
25
30
app1 app2 app3 app4 db1 db2
usage
server sub-systems
Average of cpu (%)
Average of peak disk (%)
Average of queue
Average of memory
Average of Network (x1000)
ICS BANKS Benchmark on HP-UX Platform Page 21
Test 2: ATM & E-channels (High-Watermark) The purpose of this test is to achieve high watermark results for delivery channel transactions. In this test, ICSFS E-Channels Injectors are used to inject the following financial transactions (FT) in a round robin way and the test lasted for 20 minutes taking into consideration that the injectors are posting the transactions directly to the database ( no load on application servers):
- Internet Banking Fund Transfer - POS Purchase - ATM Cash Withdrawal
1 Balance Inquiry is issued every 5 FT’s The injector started multi threads and each thread worked on different branches and different set of accounts. The following results and information were gathered during this period: Test Begin time 12:15pm 21 Feb 2014 Test End Time 12:35pm 21 Feb 2014 Test Period 20 minutes TPS (Financial Transactions & Non-Financial) An overall throughput of 63k (62936) transactions per second was
achieved during the 20 minutes test for both financial and non-financial transactions. The ratio of non-financial transactions is set to 13% of the total throughput. TPS is gathered from Oracle Enterprise Manager and from the AWR reports from both nodes. Also Business Transaction Mix is shown in Table 2 below.
ICS BANKS Benchmark on HP-UX Platform Page 22
Transaction Mix TPS Total 63k Internet Banking- Fund Transfer 29% POS 29% ATM Cash Withdrawal 29% Balance Inquiry 13% Table 2: Transaction Mix
Infrastructure Results CPU usage on every Database server of the dedicated infrastructure – less than 10% CPU usage
The peak of the busiest disk during the test is very high (near to 90%) for every Database server. Normally this would indicate a bottleneck in at least one disk drive. However as this test is a test for maximizing TPS with low CPU utilization and heavy storage transactions then we would expect to see such characteristics, especially as the infrastructure is based on SSD disks with low latency and excellent response time – see below.
The storage array has good response time: around 0.8 millisecond for read services and less than 0.6 millisecond for write services.
Infrastructure Resource usage – Storage usage for Database servers
010002000300040005000600070008000900010000
0
50000
100000
150000
200000
250000
IOPs/s
KB/s
I/O disk traffic
Bandwidth KBs
IOPs
ICS BANKS Benchmark on HP-UX Platform Page 27
Infrastructure Resource usage – Storage usage for Database servers
0
0.2
0.4
0.6
0.8
1
1.211
:31:
3411
:33:
3411
:35:
3411
:37:
3411
:39:
3411
:41:
3411
:43:
3411
:45:
3411
:47:
3411
:49:
3411
:51:
3411
:53:
3411
:55:
3411
:57:
3411
:59:
3412
:01:
3412
:03:
3412
:05:
3412
:07:
3412
:09:
3412
:11:
3412
:13:
3412
:15:
3412
:17:
3412
:19:
3412
:21:
3412
:23:
3412
:25:
3412
:27:
3412
:29:
34
ms
response time
Read service time
Write service time
Total service time
ICS BANKS Benchmark on HP-UX Platform Page 28
Sub-components usage during the test
0
10
20
30
40
50
60
70
80
90
db1 db2
usage
server sub-systems
Average of cpu (%)
Average of peak disk (%)
Average of queue
Average of memory
Average of Network (x1000)
ICS BANKS Benchmark on HP-UX Platform Page 29
Test 3: Capitalization Batch The purpose of this test is to achieve high watermark results for End of Month Interest Capitalization Batch. In this test, ICSFS launched the multithreaded capitalization batch to process 145M accounts (10% are interest accounts) and the elapsed time was measured to calculate number of accounts processed per second. Note: Batch is started on the database The following results and information were gathered during this period: Test Begin time 16:27 pm 21 Feb 2014 Test End Time 16:31 pm 21 Feb 2014 Test Period 4 minutes TPS (Interest account per second) 14.2 million Interest Accounts processed in 4 minutes
making the batch throughput 59k (59200) accounts per second if we consider only interest accounts. TPS is gathered from Oracle Enterprise Manager and from the AWR reports from both nodes.
Infrastructure Results CPU usage on every server of the dedicated infrastructure – less than 5% CPU usage for the Database servers.
The peak of the busiest disk during the test did not exceed 60% on the two Database servers. Normally this would indicate a bottleneck in at least one disk drive. However as this test is a test for maximizing TPS with low CPU utilization and heavy storage transactions then we would expect to see such characteristics, especially as the infrastructure is based on SSD disks with low latency and excellent response time – see below.
The storage array has good response time: around 1 millisecond for read and write services.
Infrastructure Resource usage – Storage usage for Database servers
0
10
20
30
40
50
60
70
4:15:00 4:20:00 4:25:00 4:30:00
disk%
Peak of the busiest disk
db1
db2
ICS BANKS Benchmark on HP-UX Platform Page 33
Infrastructure Resource usage – Storage usage for Database servers
0
1000
2000
3000
4000
5000
6000
7000
8000
0
20000
40000
60000
80000
100000
120000
140000
160000
IOPs/s
KB/s
I/O disk traffic
Bandwidth KBs
IOPs
ICS BANKS Benchmark on HP-UX Platform Page 34
Infrastructure Resource usage – Storage usage for Database servers
0
0.2
0.4
0.6
0.8
1
1.2
ms
response time
Read service time
Write service time
Total service time
ICS BANKS Benchmark on HP-UX Platform Page 35
Infrastructure Resource usage – Sub-components usage during the test
0
5
10
15
20
25
30
35
40
45
50
db1 db2
usage
server sub-systems
Average of cpu (%)
Average of peak disk (%)
Average of queue
Average of memory
Average of Network (x1000)
ICS BANKS Benchmark on HP-UX Platform Page 36
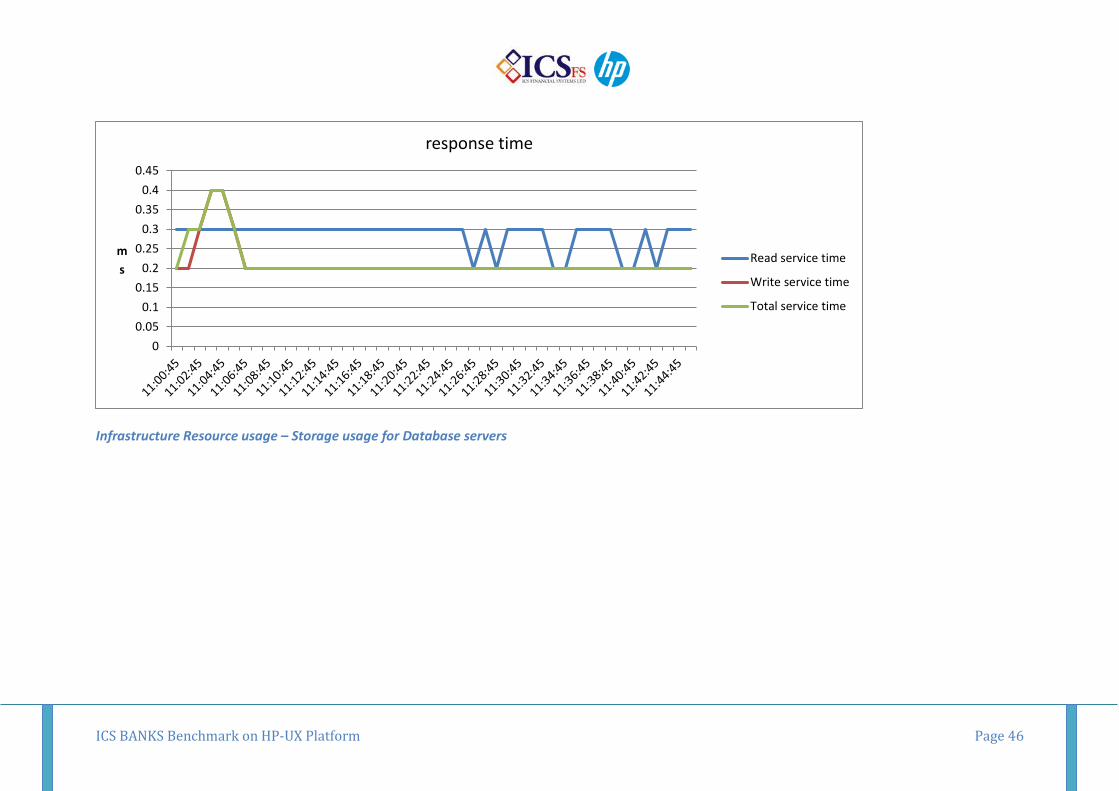
Test 4 & 5: Internet Banking – High Watermarks Test 4 is a combination of the original planned Test 4 Internet Banking High-Watermark (TPS & Users) and Test 5 Internet Banking High-Watermark (Users & Web Page visits).
The purpose of these tests is to achieve high watermark results for ICS BANKS IBS with high number of connected users and with huge number of online financial transactions. This test will measure the scalability and sustainability of ICS BANKS IBSto serve massive clients over 30 minutes while still ensuring efficient service delivery without any loss of speed or quality of service. We were able to simulate 61k (61102) concurrent ICS BANKS IBS. The test lasted for 30 minutes. The following results and information were gathered during this period: Test Begin time 11:00am 27 Feb 2014 Test End Time 11:30am 27 Feb 2014 Test Duration 30 minutes Concurrent ICS BANKS IBS users 61k (61102) Number of Internet Banking registered users 45 million Total Users log on over 30 minutes 422k TPS (Financial Transactions) An average throughput of 5.3k (5338) online financial transactions per
second is sustained resulting in 9.6 million online transactions within a 30-minute window. Business Transaction Mix is shown in Table 3 below.
Total Web Page Visits Over 30 minutes 23 million (23 751 950) as shown from Oracle WebLogic Admin Console from all application servers.
ICS BANKS Benchmark on HP-UX Platform Page 37
Transaction Mix TPS Total 5338 Balance Inquiry 23% E-statement request 3% Currency rates inquiry 1% Transfer between customers’ accounts 28% Outward Transfer 12% Open LC 1% Payment Orders 5% Transfer to another customers inside the bank 12% Bills payment 6% Cheque Book Request 3% Salary Payments 1% Standing Instructions 1% Stop ATM card 1% Stop CC card 1% Credit Card Settlement 2% Table 3: Transaction Mix
Infrastructure Results CPU usage on every server of the dedicated infrastructure – 10% CPU usage for the Database servers and 20% CPU usage for the Application servers.
The peak of the busiest disk during the test did not exceed 30% on the two Database servers.
The storage array has good response time: less than 0.3 millisecond for read and write services.
ICS BANKS Benchmark on HP-UX Platform Page 38
Test 4 & 5 Results
Oracle WebLogic Admin Console (server 10.10.0.65)
ICS BANKS Benchmark on HP-UX Platform Page 39
Oracle WebLogic Admin Console (server 10.10.0.66)
ICS BANKS Benchmark on HP-UX Platform Page 40
Oracle WebLogic Admin Console (server 10.10.0.67)
ICS BANKS Benchmark on HP-UX Platform Page 41
Oracle WebLogic Admin Console (server 10.10.0.68)
ICS BANKS Benchmark on HP-UX Platform Page 42
Infrastructure Resource usage – CPU usage
0
2
4
6
8
10
12
14
16
18
11:05:00 AM 11:10:00 AM 11:15:00 AM 11:20:00 AM 11:25:00 AM 11:30:00 AM 11:35:00 AM 11:40:00 AM
cpu%
CPU usage
app1
app2
app3
app4
db1
db2
ICS BANKS Benchmark on HP-UX Platform Page 43
Infrastructure Resource usage – Storage usage for Database servers
0
5
10
15
20
25
30
35
11:05:00 AM 11:10:00 AM 11:15:00 AM 11:20:00 AM 11:25:00 AM 11:30:00 AM 11:35:00 AM 11:40:00 AM
disk%
Peak of the busiest disk
app1
app2
app3
app4
db1
db2
ICS BANKS Benchmark on HP-UX Platform Page 44
Infrastructure Resource usage – Storage usage for Database servers
0
1000
2000
3000
4000
5000
6000
7000
8000
0
5000
10000
15000
20000
25000
30000
3500011
:00:
4511
:02:
4511
:04:
4511
:06:
4511
:08:
4511
:10:
4511
:12:
4511
:14:
4511
:16:
4511
:18:
4511
:20:
4511
:22:
4511
:24:
4511
:26:
4511
:28:
4511
:30:
4511
:32:
4511
:34:
4511
:36:
4511
:38:
4511
:40:
4511
:42:
4511
:44:
45
IO/s
KB/s
I/O disk traffic
Bandwidth KBs
IOPs
ICS BANKS Benchmark on HP-UX Platform Page 45
Infrastructure Resource usage – Storage usage for Database servers
00.05
0.10.15
0.20.25
0.30.35
0.40.45
ms
response time
Read service time
Write service time
Total service time
ICS BANKS Benchmark on HP-UX Platform Page 46
Infrastructure Resource usage – Sub-components usage during the test
0
5
10
15
20
25
30
app1 app2 app3 app4 db1 db2
usage
server sub-systems
Average of cpu (%)
Average of peak disk (%)
Average of queue
Average of memory
Average of network (x1000)
ICS BANKS Benchmark on HP-UX Platform Page 47
Test Findings
Test 1 ICSFS successfully completed the test and surpassed their expectations by achieving 42k users and 22k tps.
The infrastructure results are as follows:
- Average of the CPU : the usage is around 22% for database servers and 28% for application servers - Average of the peak disk : the busiest disk for database servers is less than 15% - Average of queue : There is only one process that is waiting for access to the CPU of the database servers (this shows number of
programs waiting to access the CPU in this case the very low number indicates that there is no waiting) - Average of Memory : there is no activity paging data from physical memory to swap space - Average network : it is the total network packets transferred between the network and the system that are generated during the test
(value on the graph has to be multiplied by 1000)
Test 2 ICSFS completed the second test (ATM & E-channels /High-Watermark) and achieved 63k overall TPS. Whilst this is lower than the original success criteria stated – it is still higher than any previous benchmark and consequently ICSFS considered this to have met their expectations.
The infrastructure results are as follows:
- Average of the CPU : the usage is less than 10% for database servers - Average of the peak disk: the busiest disk for database servers is around 90%. Normally this would indicate a bottleneck in at least one
disk drive. However as this test is a test for maximizing TPS with low CPU utilization and heavy storage transactions then we would expect to see such characteristics, especially as the infrastructure is based on SSD disks with low latency and excellent response time.
- Average of queue : There is only one process that is waiting for access to the CPU of the database servers - Average of Memory : there is no activity paging data from physical memory to swap space
Average network: it is the total network packets transferred between the network and the system that are generated during the test (value on the graph has to be multiplied by 1000)
ICS BANKS Benchmark on HP-UX Platform Page 48
Test 3 ICSFS completed the third test and achieved 59k accounts processing per second. Again whilst this is marginally lower than the original success criteria stated – it is again higher than any previous benchmark.
ICSFS believe that if they had further time available to re-configure the environment they could have achieved better results.
The infrastructure results are as follows:
- Average of the CPU : the usage is less than 5% for database servers - Average of the peak disk: the busiest disk for database servers is less than 45%. Normally this would indicate a bottleneck in at least
one disk drive. However as this test is a test for maximizing TPS with low CPU utilization and heavy storage transactions then we would expect to see such characteristics, especially as the infrastructure is based on SSD disks with low latency and excellent response time.
- Average of queue : There is only one process that is waiting for access to the CPU of the database servers - Average of Memory : there is no activity paging data from physical memory to swap space - Average network : it is the total network packets transferred between the network and the system that are generated during the test
(value on the graph has to be multiplied by 1000)
Test 4: ICSFS achieved results that exceeded their expectations and success criteria.
ICSFS managed to simulate 45 million online IBS registered users; whilst 61k concurrent users were working at the same time making a throughput of 5.3K tps; resulting in 9.6 million transactions within 30 minutes.
Test 5: ICSFS achieved results that exceeded their expectations and success criteria.
During this test the system also supported 422K user log on and 23 million web page visits within a 30-minute window.
For Tests 4 & 5 the infrastructure results are as follows:
ICS BANKS Benchmark on HP-UX Platform Page 49
- Average of the CPU : the usage is less than 15% for the servers - Average of the peak disk : the busiest disk for database servers is less than 25% - Average of queue: There is only one process that is waiting for access to the CPU of the database servers - Average of Memory : there is no activity paging data from physical memory to swap space - Average network : it is the total network packets transferred between the network and the system that are generated during the test
(value on the graph has to be multiplied by 1000) We can notice that the network activity is higher than in the other test (and especially for the Application servers) as this test simulates Web access applications.
ICS BANKS Benchmark on HP-UX Platform Page 50
Conclusion With no room for doubt, this benchmark demonstrates how ICS BANKS high performance benefited from its own unique design and architecture for on-line, end of day and delivery channels. As demonstrated by the workload testing described in this paper, ICS BANKS universal banking solution running on HP servers and infrastructure, sets a new standard of scalability and provides viable solutions for the largest banks.
Running ICS BANKS from ICSFS on HP-UX Platform is packaged as one complete solution with best-of-breed technologies, to provide banking solutions that address today’s industry challenges and demands in the most cost-effective way, while offering the agility to respond to the business and technology opportunities of tomorrow. ICSFS and HP provide a complete integrated end-to-end solution that is easy to deploy, with ongoing maintenance and address scalability without complexity. The results of this benchmark are the highest achieved up-to-date, as no public available benchmark of this kind is known to provide higher performance.