ICT, Financial Inclusion, and Growth: Evidence from African Countries 1 (Draft, September 2010) Mihasonirina Andrianaivo ([email protected]) and Kangni Kpodar ([email protected]) Abstract This paper studies the impact of information and communication technologies (ICT), especially mobile phone rollout, on economic growth in a sample of African countries from 1988 to 2007. Further, we investigate whether financial inclusion is one of the channels through which ICT influences economic growth. In estimating the model, we use a wide range of ICT indicators, including the mobile and fixed telephone penetration rates and the cost of local calls, and we address any endogeneity issues by using the System GMM estimator. Financial inclusion is captured by variables measuring access to financial services, such as the number of deposits or loans per head, compiled by Beck and others (2007) and the Consultative Group to Assist the Poor (CGAP, 2009). The results confirm that ICT, including mobile phone development, accounts for economic growth in African countries. Part of this effect comes from financial inclusion, and, at the same time, the development of mobile phones consolidates the impact of financial inclusion on economic growth, especially in countries where mobile financial services take hold. Keywords: ICT, mobile financial services, economic growth, Africa. JEL Classification: O30, O40, G20 1 The authors would like to thank Jenny Di Biase for useful editorial comments.
Transcript
ICT, Financial Inclusion, and Growth: Evidence from African Countries1
Abstract This paper studies the impact of information and communication technologies (ICT), especially mobile phone rollout, on economic growth in a sample of African countries from 1988 to 2007. Further, we investigate whether financial inclusion is one of the channels through which ICT influences economic growth. In estimating the model, we use a wide range of ICT indicators, including the mobile and fixed telephone penetration rates and the cost of local calls, and we address any endogeneity issues by using the System GMM estimator. Financial inclusion is captured by variables measuring access to financial services, such as the number of deposits or loans per head, compiled by Beck and others (2007) and the Consultative Group to Assist the Poor (CGAP, 2009). The results confirm that ICT, including mobile phone development, accounts for economic growth in African countries. Part of this effect comes from financial inclusion, and, at the same time, the development of mobile phones consolidates the impact of financial inclusion on economic growth, especially in countries where mobile financial services take hold. Keywords: ICT, mobile financial services, economic growth, Africa. JEL Classification: O30, O40, G20
1 The authors would like to thank Jenny Di Biase for useful editorial comments.
Contents Page I. Introduction ................................................................................................................................... 3
II. Theoretical Background and Empirical Studies ............................................................................. 5 III. Stylized Facts .............................................................................................................................. 8
A. Growth of ICT in African Countries and Other Developing Countries ....................................... 8 B. Growth of Mobile Technology in Africa ................................................................................... 8 C. Opportunities Offered by Mobile Financial Services ................................................................. 9
IV. Econometric Specification ......................................................................................................... 11
V. Results ........................................................................................................................................ 13
A. Impact of ICT on Economic Growth ....................................................................................... 13 B. Robustness Tests .................................................................................................................... 14
C. Financial Inclusion.................................................................................................................. 16
VI. Conclusions ............................................................................................................................... 17
Figures 1. Correlation between Mobile Penetration, Growth and Financial Inclusion .................................... 22 2. Financial Inclusion and Mobile Penetration by Type of Financial Institutions .............................. 23 3. Trends in ICT Use: International Comparison .............................................................................. 23 4. ICT Growth in Developing Countries .......................................................................................... 24 5. Trends in Fixed versus Mobile Phone Subscribers: International Comparison .............................. 24 6. Trends in Mobile Penetration: International Comparison .............................................................. 25 7. Trends in Prepaid versus Postpaid Phone Subscribers: International Comparison ......................... 25 8. Access to Financial Services in Selected African Countries .......................................................... 26 9. Bank loans and Deposits: International Comparison ..................................................................... 26 10. Bank Branches and ATMs ......................................................................................................... 27 11. Financial Infrastructure Gap in Developing Countries ................................................................ 28 12. Comparing Trends in Bank Credit and Mobile Penetration ......................................................... 28 13. Testing for the Stability of the Coefficient on Mobile Penetration Using Random Samples ........ 29 14. Recursive Estimates of the Coefficient on Mobile Penetration .................................................... 29 15. Quality of the Prediction ........................................................................................................... 30 Tables 1. Transmission Channels from ICT to Growth .................................................................................. 5 2. Impact of Mobile and Fixed Telephone Penetration on Economic Growth in Africa ..................... 31
3. Testing for Interaction Terms and other Forms of ICT ................................................................. 32 4. Robutness tests ............................................................................................................................ 33
5. Mobile Penetration, Financial Inclusion and Economic Growth in Africa ..................................... 34 Appendices 1. List of the Sample Countries ........................................................................................................ 35
2. Summary Statistics and Correlation Matrix .................................................................................. 36 3. Variable Definition and Sources .................................................................................................. 38
I. INTRODUCTION
With continuing and rapid progress in information and communication technologies (ICT) worlwide, the African continent is also experiencing significant growth in ICT deployment.2 Figures show that, in Africa, growth in telephone subscribers, personal computer users, and Internet users has been fast since the 1990s. Currently, mobile phone penetration is overcoming fixed line coverage. The coverage of mobile cellular networks is around 55 percent of the population in Sub-Saharan Africa, and more than 80 percent of the population in middle east and north African (MENA) countries between 2002 and 2007. Nonetheless, if ICT has brought modernization of finance worlwide, Africa remains challenged by a financial infrastructure gap. This is shown by the very low number of bank branches and automated teller machines (ATMs) in Africa (see Beck and others, 2007),3 but also by the very low figures of financial inclusion. According to FinMark (2009), most of the population in African countries is either using informal finance or is financially excluded (88 percent of the population in Mozambique and 41 percent in Bostwana in 2009). Bank penetration is lower than 10 percent in some regions of Africa. In fact, there will be 1.7 billion unbanked customers with mobile phones by 2012 according to the Global System for Mobile Communications Association (GSMA).4 As a consequence, a number of schemes aim at overcoming the financial insfrastructure gap by using the well-deployed ICT. Branchless banking services, like mobile financial services, are becoming increasingly popular. Therefore, it is worth investigating what ICT and these schemes can bring to financial inclusion and hence economic growth. The purpose of this paper is to shed light on the role that ICT development, especially mobile phone penetration, can play in promoting financial inclusion and economic growth. Specifically, we analyze the impact of mobile phone penetration on economic growth rates in Africa. Then we add to the model an indicator of financial inclusion to assess whether mobile phone penetration influences growth by improving financial inclusion. Further, we investigate how the interaction among mobile penetration, financial inclusion and growth is at play in countries where mobile financial services take hold. Recent literature on mobile phones and developing countries has been reviewed by Donner (2008). Jensen (2007) finds microeconomic evidence of positive impacts of mobile telephony. By providing information, mobile phones reduce price volatility and increase responsiveness of fishing businesses. Other studies focus on the microeconomic impacts of mobile phones on small and medium entreprises (SMEs) (Chowdhury, 2006, and Donner,
2 Grace, Kenny, and Qiang (2003) define ICT as tools that facilitate the production, transmission, and processing of information. ICTs consist of traditional technologies such as radios and modern communication and data delivery systems. We focus here on new information and communication technologies like telephones, computers, and the Internet. We concentrate more deeply on mobile phone technology.
3 The average number of bank branches in Sub-Saharan Africa was less than 700 in 2007, and the average number of ATMs is less than a thousand.
4 GSMA is the association representing the interests of the worldwide mobile communications industry.
4
2006), while some looked at the impacts of mobile phones on institutions and social domains (such as civil society organizations, libraries, and so forth). However, very few studies have been conducted on the macroeconomic impacts of mobile phones in developing countries. A few, such as Hardy (1980) and Waverman, Meschi, and Fuss (2005), did not focus on Africa, and to our knowledge none of them has yet analyzed the possible influence that ICT could have on financial inclusion. ICT and mobile phone penetration can indeed reduce the transaction costs of financial intermediairies including formal commercial banks, microfinance institutions, cooperatives, and so forth and therefore expand their businesses. ICT also facilitates the emergence of branchless banking by increasing the flexibility of businesses.5 Moreover, a good telecommunication network allows better information flows that reduce information asymmetries and hence ease deposit taking and access to credit. The data show that the correlation between average real GDP per capita and mobile penetration is positive in Africa. Similarly, the correlation between financial inclusion and mobile penetration is positive, suggesting that ICT rollouts could stimulate economic growth and financial inclusion (Figures 1 and 2). Fulfilling the financial infrastructure gap in Africa by using branchless banking services such as mobile financial services is seen as a promising way to increase financial inclusion.6 Therefore it is critical to assess the extent to which mobile penetration improves financial inclusion and therefore growth in Africa. We follow the works of Barro (1991) and Waverman, Meschi, and Fuss (2005) and focus on 44 African countries between 1988 and 2007. We include regressors such as initial levels of GDP to account for convergence, human capital development, government consumption, and institutional development, as well as mobile telephony variables such as penetration rates. We also use more specific indicators of financial inclusion, such as the number of deposits per head and the number of loans per head in all financial intermediairies including commercial banks, microfinance institutions, cooperatives and specialized state financial institutions. We undertake robust estimations addressing reverse causality of good telecommunication networks and growth and treating any endogeneity between other control variables and economic growth by using the System GMM estimator. We also use other variables accounting for telecommunication development by testing the effects of the prices of a three-minute fixed and mobile telephone local call on economic growth rates. As in previous literature such as Hardy (1980), Roller and Waverman (2001), Waverman, Meschi, and Fuss (2005), Sridhar and Sridhar (2004), and Lee, Levendis, and Gutierrez (2009), we find that ICT development, and notably mobile phone penetration, accounts for economic growth in Africa. We find as in Roller and Waverman (2001) and Waverman and others (2005) that mobile phones and fixed lines are substitutes and that the effect of mobiles
5 According to Rasmussen (2010), branchless banking is 26 percent cheaper than conventional banking.
6 Financial services on mobile phones or mobile financial services benefit all actors involved. They are seen by mobile network operators and banks as a tremendous opportunity to increase their respective client base. Further, clients may also find these schemes better at responding to their financial needs compared to what formal banks and informal lenders offer.
5
is higher in lower-income countries. In addition, a part of this effect goes through financial inclusion. Further, the growth effects of financial inclusion is improved by mobile phone development, especially in countries where mobile financial services are available.. The rest of the paper is organized as follows. First, we review the theory behind the economic impact of ICT on economic growth and social development. We then present some stylized facts on ICT and financial inclusion followed by the presentation of our econometric specification and the results. Our last section concludes.
II. THEORETICAL BACKGROUND AND EMPIRICAL STUDIES
In earlier research studies, ICT development was regarded as a concern only for developed economies because only these economies were capable of mobilizing resources to promote the sector, and because the growth effects of ICT are thought to materialize only when a threshold of users is reached (see Grace, Kenny, and Qiang, 2003, Roller and Waverman, 2001). However, recent research shows that the positive impacts of ICT can be felt earlier because ICT is like other utilities such as water, electricity, and transportation (Tcheng and others, 2007). As fixed investment has positive effects on economic growth, investment in public infrastructure such as telecommunications can also be growth-enhancing. For instance, Haacker (2010) notes that low and middle income countries benefit from capital deepening arising from falling prices of ICT equipment. Datta and Agarwal (2004) pointed out that the economic benefits of ICT can be direct, through increases of employment and demand, and can also be indirect, notably through social returns (see Table 1). Lewin and Sweet (2005) stress that the direct effects can come from the supply side, that is, the supply of telecommunication services. This supply of telecommunication networks generates employment for manufacturers, administrators, network builders, system managers, and also employment through new retailing networks. ICT supply also affects government revenues through income taxes on companies and on employees, VAT, and social security contributions.7 Moreover, ICT supply influences the balance of payments as it increases foreign direct investment (FDI) flows. The increase in FDI is due to new FDI in telecommunication services. Also, foreign companies are more likely to invest in countries with increased ICT development. According to Lewin and Sweet (2005), indirect social returns also come from ICT use which improves market functioning and increases trade. Investments in ICT is cost saving as communication systems lower transaction costs (Datta and Agarwal, 2004, and Waverman, Meschi, and Fuss, 2005). By reducing the costs of retrieving information, ICT improves information flows, increases arbitrage abilities, and facilitates price discovery. It allows better functioning markets and regulation of supply and demand.
7 Tcheng and others (2007) observe that in Africa, government revenues from telecommunication services are about 5 percent of GDP compared with only 2.9 percent in Europe.
6
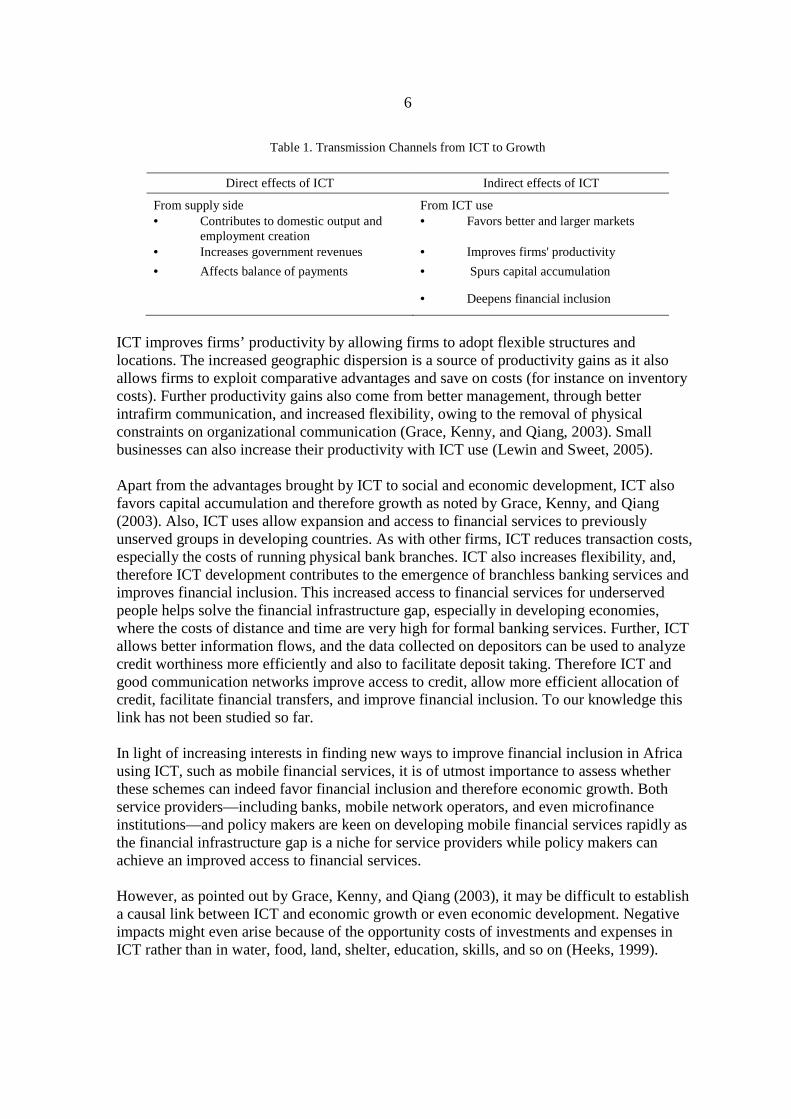
Table 1. Transmission Channels from ICT to Growth
Direct effects of ICT Indirect effects of ICT
From supply side From ICT use • Contributes to domestic output and
employment creation • Favors better and larger markets
• Increases government revenues • Improves firms' productivity
• Affects balance of payments • Spurs capital accumulation
• Deepens financial inclusion
ICT improves firms’ productivity by allowing firms to adopt flexible structures and locations. The increased geographic dispersion is a source of productivity gains as it also allows firms to exploit comparative advantages and save on costs (for instance on inventory costs). Further productivity gains also come from better management, through better intrafirm communication, and increased flexibility, owing to the removal of physical constraints on organizational communication (Grace, Kenny, and Qiang, 2003). Small businesses can also increase their productivity with ICT use (Lewin and Sweet, 2005). Apart from the advantages brought by ICT to social and economic development, ICT also favors capital accumulation and therefore growth as noted by Grace, Kenny, and Qiang (2003). Also, ICT uses allow expansion and access to financial services to previously unserved groups in developing countries. As with other firms, ICT reduces transaction costs, especially the costs of running physical bank branches. ICT also increases flexibility, and, therefore ICT development contributes to the emergence of branchless banking services and improves financial inclusion. This increased access to financial services for underserved people helps solve the financial infrastructure gap, especially in developing economies, where the costs of distance and time are very high for formal banking services. Further, ICT allows better information flows, and the data collected on depositors can be used to analyze credit worthiness more efficiently and also to facilitate deposit taking. Therefore ICT and good communication networks improve access to credit, allow more efficient allocation of credit, facilitate financial transfers, and improve financial inclusion. To our knowledge this link has not been studied so far. In light of increasing interests in finding new ways to improve financial inclusion in Africa using ICT, such as mobile financial services, it is of utmost importance to assess whether these schemes can indeed favor financial inclusion and therefore economic growth. Both service providers—including banks, mobile network operators, and even microfinance institutions—and policy makers are keen on developing mobile financial services rapidly as the financial infrastructure gap is a niche for service providers while policy makers can achieve an improved access to financial services. However, as pointed out by Grace, Kenny, and Qiang (2003), it may be difficult to establish a causal link between ICT and economic growth or even economic development. Negative impacts might even arise because of the opportunity costs of investments and expenses in ICT rather than in water, food, land, shelter, education, skills, and so on (Heeks, 1999).
7
Grace, Kenny, and Qiang (2003) also mention that some developing countries might fall in a poverty trap if there are ICT threshold effects at play. Regarding empirical studies, earlier cross-country research found a positive and significant impact of telecommunication infrastructure on economic growth. For instance, in anaylizing the impact of telecom penetration on growth, Hardy (1980) finds that the impact of radio rollout (a one-way network) on economic growth is weak as opposed to that of the telephone (a two-way network). Similarly, Norton (1992) finds that the association between telecommunication infrastructure and economic growth is positive and significant. In contrast to Hardy (1980) and Norton (1992), Roller and Waverman (2001) address the two-way causality issue by using a structural model with a hybrid production function that endogenizes the telecommunications investment on a sample of 21 Organisation for Co-operation and Development (OECD) countries and 14 developing countries over a 20-year period. They find little impact of ICT on growth once simultaneity and fixed effects are controlled for, and only a positive causal link when a critical mass of telecom infrastructure is reached. Kathuria and others (2009) reach similar conclusion for Indian states. Waverman, Meschi, and Fuss (2005) use a modified version of Roller and Waverman (2001) for 92 countries between 1980 and 2003 and show that mobiles in developing countries play the same role as fixed lines played in the 1970s and 1980s in OECD countries.The findings suggest that in developing countries, mobile and fixed phones are substitutes while in developed countries they are complements.8 In addition, their impacts on growth are positive and significant—twice as large as their impacts in developed countries. Lee, Levendis, and Gutierrez (2009) are among the rare studies that have focused on the effects of mobile phones on economic growth in Sub-Saharan Africa. They correct the potential endogeneity between economic growth and telephone expansion by using the generalized method of moments. They also consider varying degrees of substituability between mobile phones and landlines as in Waverman, Meschi, and Fuss (2005). They find indeed that the marginal impact of mobile telecommunication services is even greater where landline phones are rare. However, as in previous studies, the authors do not test for the price effect of telecommunications on growth, because in some countries telecommunications infrastructure could exist but a high access cost could dampen its use. Moreover, the channels through which telecommunications stimulate growth, financial inclusion for instance, are not investigated. Further, their regressions may be subject to statistical shortcomings because the System GMM estimator is not appropriate for annual data if the variables are not stationary. Our paper addresses some of these issues in the following sections.
8 In fact, mobile phones require less investment than fixed lines and therefore are faster and less expensive to rollout.
8
III. STYLIZED FACTS
A. Growth of ICT in African Countries and Other Developing Countries
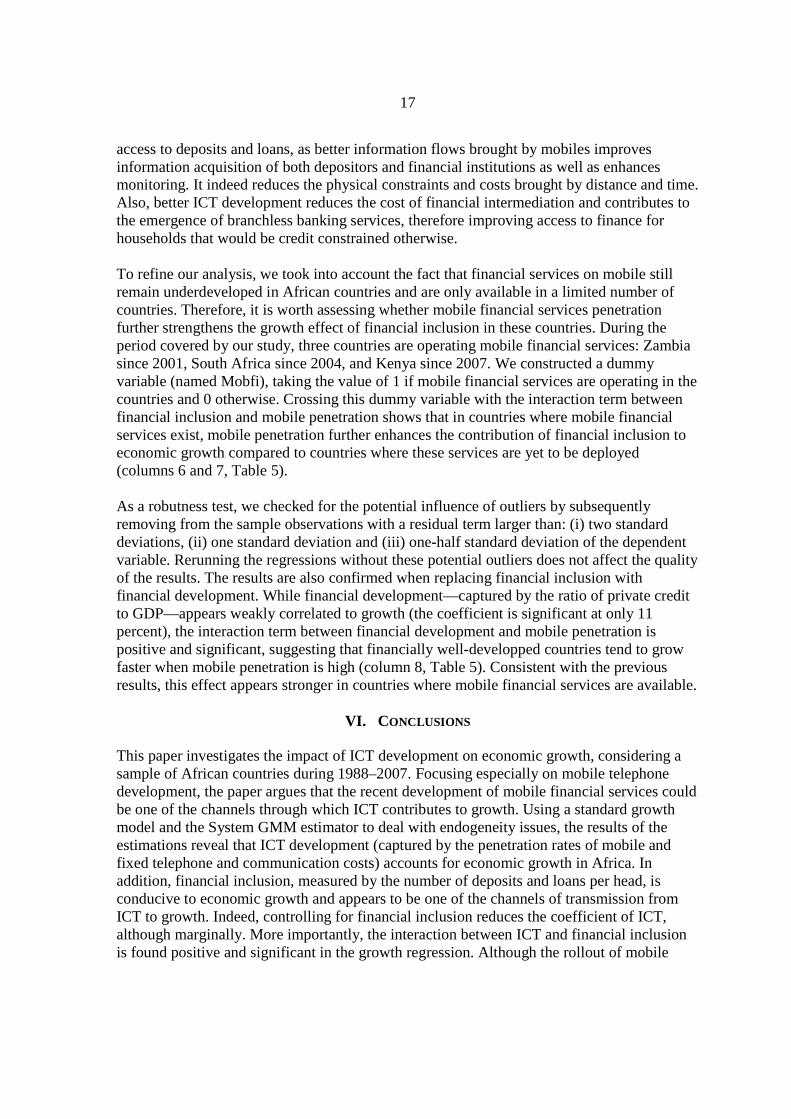
Rapid spread of ICT in all developing countries. Progress in ICT is fast, and ICT growth is not restricted to developed countries. ICT is also spreading rapidly in developing countries. Figure 3 in the appendix shows that since the 1990s, the average numbers of telephone subscribers, personal computer users, and Internet users per 100 inhabitants have increased. In fact, even though the figures are the lowest in Sub-Saharan Africa and in South Asia, the upward trend is present in these regions as well. Robust growth of telephone subscribers compared to personal computer users and Internet users. Use of telephone technology— fixed and mobile—is widespread, compared to use of personal computers and Internet use (Figure 4), although Internet use has increased drastically. Data also show that in all developing regions, the growth rates of telephone subscriptions are high compared to those of personal computers users and Internet users per 100 inhabitants, and the latter are actually decreasing in some regions like Africa after the dramatic increase in the 1990s. Africa experienced the highest growth rates of telephone subscribers. The data suggest that, although from low levels, the growth rate of telephone subscribers in Africa was the highest of all developing regions at the end of the 1990s and the beginning of the 2000s (except for South Asia in the 2000s). This could be partly explained by the two waves of telecom privatization in Africa. The first was between 1995 and 1997 and the second between 2000 and 2001.
B. Growth of Mobile Technology in Africa
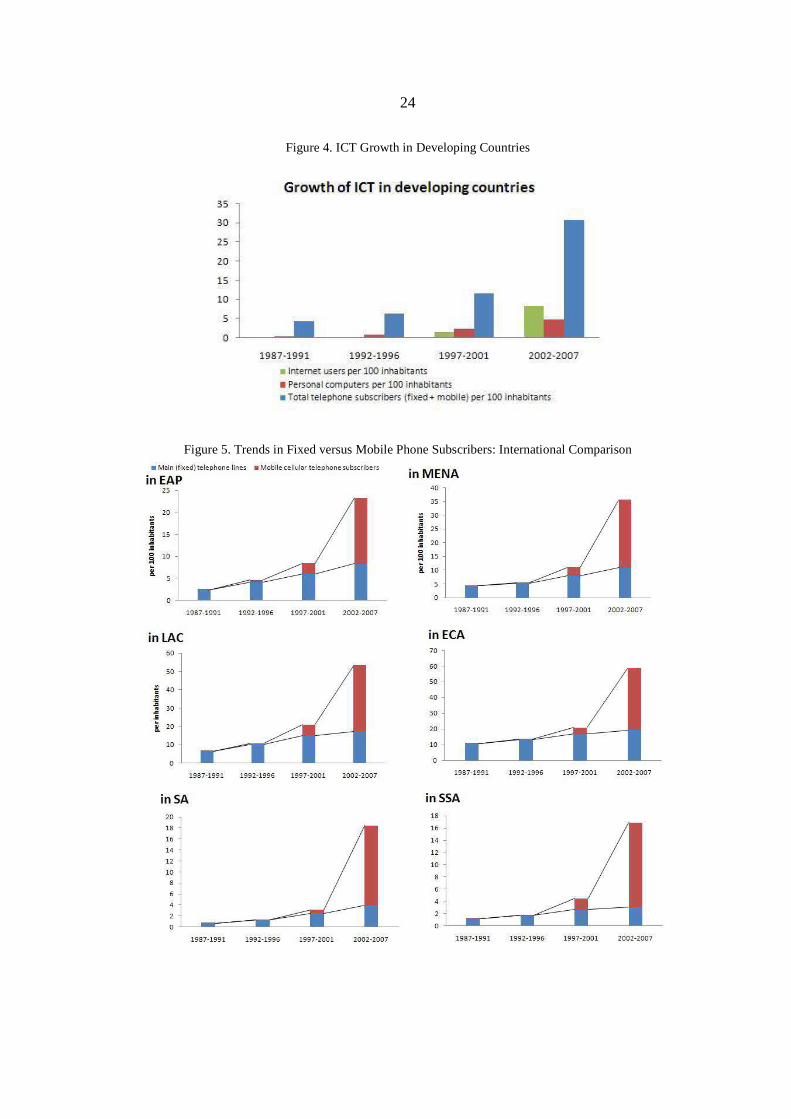
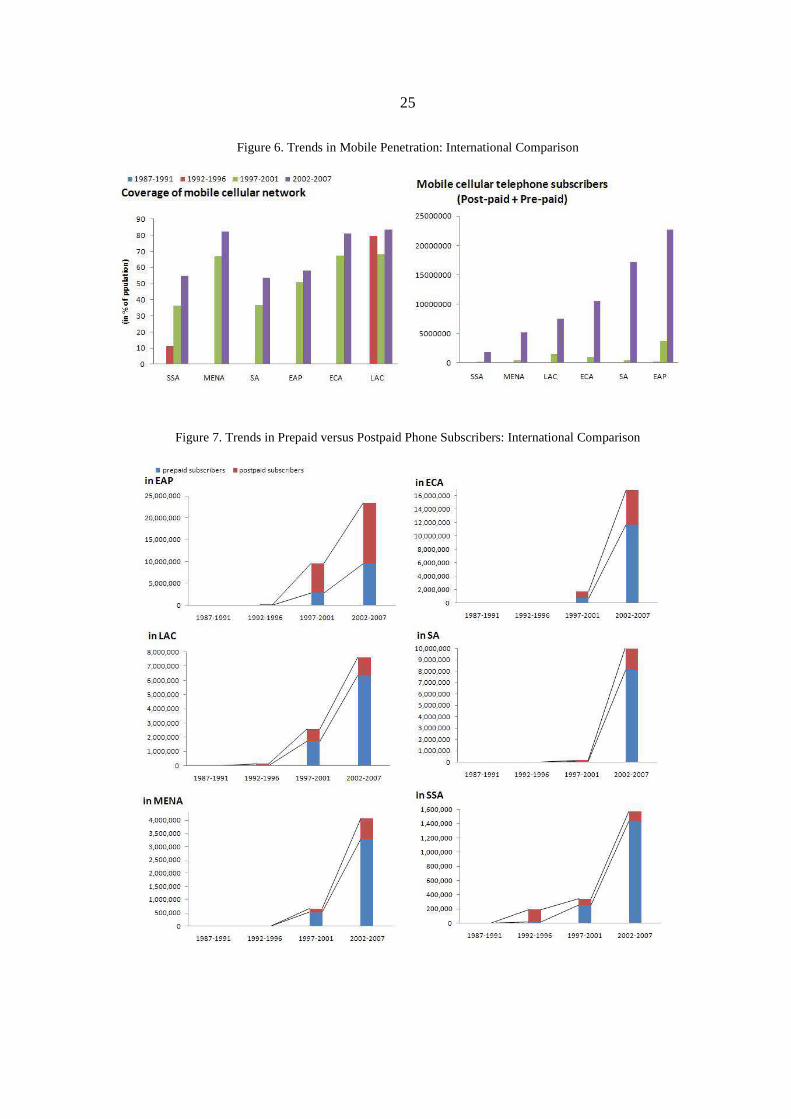
Mobile phone subscriptions are overtaking fixed lines. Figure 5 shows that in all developing regions, although mobile technology had started to spread at the end of 1990s, the number of mobile phone subscribers per 100 inhabitants is now above the number of main fixed telephone lines per 100 inhabitants. Mobile phone penetration and coverage have increased rapidly (Figure 6) probably reflecting liberalization and privatization policies and also lack of wired infrastructure in many developing countries.9
9 Do-Nascimento (2005) noted that in 2004 only 14 African countries out of 55 have not yet liberalized the telecommunications sector. With technological progress and globalization of networks, liberalization policies started to emerge in developed countries in the 1980s and 1990s. They were recommended to African countries by international financial institutions as part of structural adjustment programs in the 1990s. Other reasons are mentioned by Do-Nascimento (2005) to explain the growth of mobile penetration in Africa. Among them is the strategy of service providers who adapt their products to African consumers. For example the introduction of
(continued)
9
Positive growth perspectives in Africa. In Africa, studies have shown that people consider the investment in mobile technology necessary even though it is a significant part of their earnings. Their willingness to pay for this technology is higher than people’s willingness to spend in higher income countries,10 but the price elasticity of their demand is also higher (see Grace, Kenny, and Qiang, 2003; Waverman, Meschi, and Fuss, 2005; Kathuria and others, 2009; and Tcheng, Huet, and Romdhane, 2010). The telecommunications sector is expected to continue to grow rapidly, and the limits to this growth are uncertain (Tcheng, Huet, and Romdhane , 2010). Preference for prepaid contracts. In most developing countries prepaid contracts are more common than postpaid contracts (Figure 7). In Africa, for instance, many customers do not earn regular income and are unbanked. They are therefore less capable of affording fixed costs associated with postpaid contracts. In addition, fixed lines require monthly payments, regardless of usage. Prepaid mobiles, on the other hand, take into account usage and variability of consumption, although at a higher cost. This explains the success of prepaid mobile phones compared to postpaid offers.11
C. Opportunities Offered by Mobile Financial Services
Exclusion from formal financial services is very high in Africa. Figure 8 shows that in many African countries, a large share of the population is financially excluded or using informal financial services. Formal financial services are dominated by banks. Formal bank service is the most-used formal system in these bank-dominated countries. Figure 9 suggests that deposits are more common than loans in all regions. Although the number or loans and deposits per head is relatively low in Sub-Saharan Africa, and to a lesser extent in MENA, the average size of loans and deposits relative to GDP per capita is high in prepaid contracts to suit clients who do not have the usual and formal means of payment like checks, credit cards, and so forth. Other reasons are related to sociology. Families and friends are very close in Africa, and the social fabric is made of numerous relationships. Communication is vital to maintaining these ties, and the mobile phone overcomes travel difficulties. 10 Tcheng and others (2007) mention that in some African countries such as Namibia, Ethiopia, and Zambia, households spend up to 10 percent of their monthly income on telephone expenses, whereas the average is 3 percent in developed countries.
11 It is interesting to note, however, that fixed line contracts and postpaid contracts are more advantageous to the service provider. This is because their clients can be located by the physical address, and their revenues are more stable. Moreover, the provision of prepaid mobile contracts, compared to postpaid mobile contracts, is more costly for a service provider because the costs of producing and selling scratch cards are high.
10
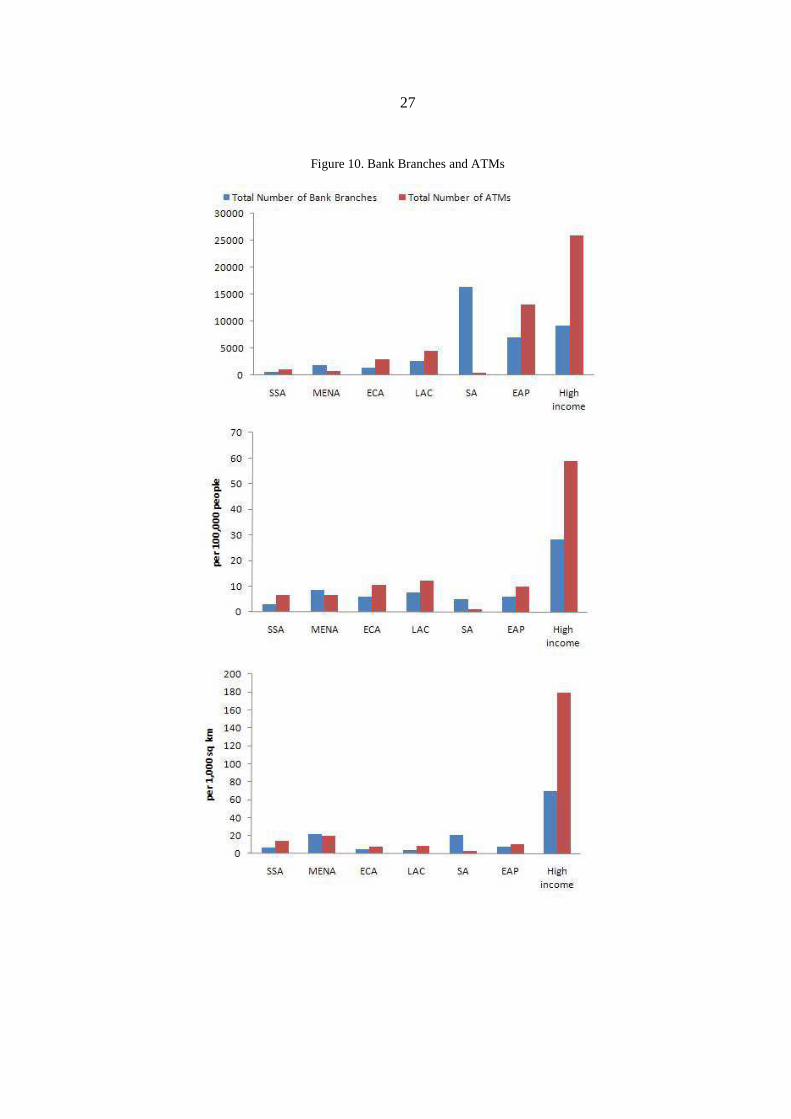
these regions. This suggests that the propensity to save in these regions is high, but constrained by lack of access to financial services or suitable financial instruments. Collins and others (2009) explain that people with low incomes lead active financial lives because they are poor not in spite of it. In developing countries, the lack of financial infrastructure is significant. Figure 10 shows that the total number of bank branches and ATMs is very low in developing countries compared to the same figures in high-income countries. Moreover, figures in Sub-Saharan Africa and MENA are among the lowest. But when looking at the geographical coverage and penetration rates of bank branches and ATMs, the picture is less clear cut. Mobile financial services could be the answer. The previous figures illustrate clearly that there is a financial infrastructure gap in developing countries where the coverage of mobile cellular is close to that of high-income countries, but bank penetration and financial inclusion are very low compared to that of the same group of countries (see Figure 11). In summary, ICT rollout especially mobile phone penetration using prepaid contracts, is growing rapidly in developing countries and especially in Africa. Nonetheless, financial development and financial inclusion are very low in these countries, and the expansion of the financial system lags behind mobile telephone development (Figure 12). Considering the growth of mobile technology—its usage and spread—and taking into account low access to financial services, mobile financial services are regarded as an opportunity to reach unbanked customers as well as a new source of profits for mobile network operators. According to GSMA and Mobile Money for the Unbanked (MMU) deployment tracking, three African countries were operating mobile financial services as of end-2007—M-PESA in Kenya, WIZZIT and MTN Mobile Money in South Africa, and CELPAY in Zambia. In these countries, branchless banking services enable households to access savings, bill payment services, and money transfers through mobile phones. These schemes are becoming more sophisticated as partnerships between mobile telephone companies and microfinance institutions strengthen and widen the range of banking services available via the mobile phone. Currently, the most common mobile financial services include domestic money transfers, air time top ups, and bill payments; but there also is a strong desire for savings (see Rasmussen, 2010). In addition, international money transfer and loan repayments are becoming widely used. In fact, following the stagnation of traditional markets in Europe and the success of M-PESA (with more than 9 million subscribers), mobile network operators are now seeking new growth engines for their sales in Africa through new services with a social dimension. Recently, mobile financial services have been launched in 16 other African countries.12
12 According to GSMA and MMU deployment tracking, 16 African countries launched financial services via mobile phones between 2008 and 2010—Uganda, Tanzania, Ghana, Cote d’Ivoire, Rwanda, Sierra Leone,
(continued)
11
Although prospects for further development of mobile financial services remain strong, they rely on the long-term strategies of stakeholders and on appropriate design of services that respond to customers’ needs. The other important factor is the ability of governments to foster innovation and channel payments (Rasmussen, 2010).
IV. ECONOMETRIC SPECIFICATION
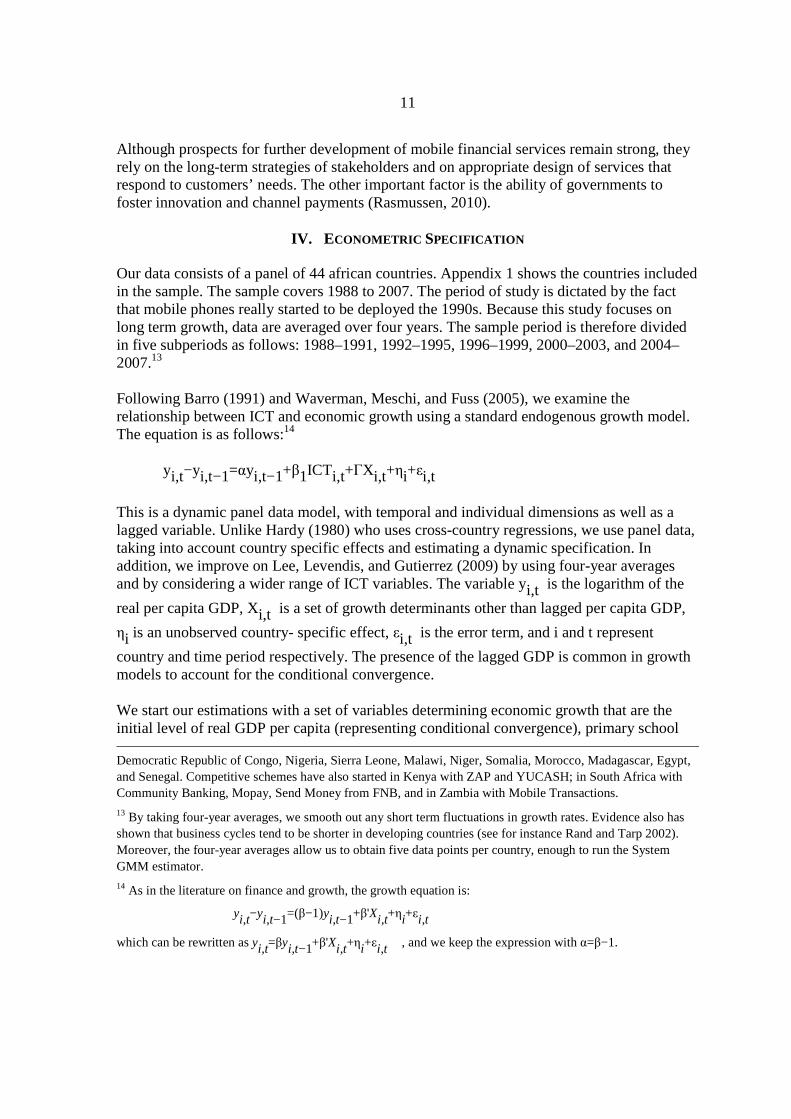
Our data consists of a panel of 44 african countries. Appendix 1 shows the countries included in the sample. The sample covers 1988 to 2007. The period of study is dictated by the fact that mobile phones really started to be deployed the 1990s. Because this study focuses on long term growth, data are averaged over four years. The sample period is therefore divided in five subperiods as follows: 1988–1991, 1992–1995, 1996–1999, 2000–2003, and 2004–2007.13 Following Barro (1991) and Waverman, Meschi, and Fuss (2005), we examine the relationship between ICT and economic growth using a standard endogenous growth model. The equation is as follows:14 yi,t−yi,t−1=αyi,t−1+β1ICTi,t+ΓXi,t+ηi+εi,t
This is a dynamic panel data model, with temporal and individual dimensions as well as a lagged variable. Unlike Hardy (1980) who uses cross-country regressions, we use panel data, taking into account country specific effects and estimating a dynamic specification. In addition, we improve on Lee, Levendis, and Gutierrez (2009) by using four-year averages and by considering a wider range of ICT variables. The variable yi,t is the logarithm of the
real per capita GDP, Xi,t is a set of growth determinants other than lagged per capita GDP,
ηi is an unobserved country- specific effect, εi,t is the error term, and i and t represent
country and time period respectively. The presence of the lagged GDP is common in growth models to account for the conditional convergence. We start our estimations with a set of variables determining economic growth that are the initial level of real GDP per capita (representing conditional convergence), primary school Democratic Republic of Congo, Nigeria, Sierra Leone, Malawi, Niger, Somalia, Morocco, Madagascar, Egypt, and Senegal. Competitive schemes have also started in Kenya with ZAP and YUCASH; in South Africa with Community Banking, Mopay, Send Money from FNB, and in Zambia with Mobile Transactions.
13 By taking four-year averages, we smooth out any short term fluctuations in growth rates. Evidence also has shown that business cycles tend to be shorter in developing countries (see for instance Rand and Tarp 2002). Moreover, the four-year averages allow us to obtain five data points per country, enough to run the System GMM estimator.
14 As in the literature on finance and growth, the growth equation is:
yi,t−yi,t−1=(β−1)yi,t−1+β'Xi,t+ηi+εi,t
which can be rewritten as yi,t=βyi,t−1+β'Xi,t+ηi+εi,t , and we keep the expression with α=β−1.
12
enrollment rate (accounting for human capital), and other control variables such as inflation, government consumption, and institutional development. Appendix 2 presents descriptive statistics for all the variables. Data are obtained mainly from the International Monetary Fund, the World Bank and the International Telecom Union databases (see Appendix 3 for variable definition and sources). The covariates (control variables) may not be strictly exogenous. They can be predetermined (correlated with past observation specific disturbances) or endogenous (correlated with past and current observation specific disturbances). Blundell and Bond (1998) (henceforth BB) develop a System GMM estimator to address issues associated with predetermined and endogenous variables. We choose the BB estimator because it performs better than Arellano and Bond’s estimator when the autoregressive coefficient is relatively high, and the number of periods is small.15 Moreover, the validity of the internal instruments used must be checked to make sure that the results are valid. As noted by Roodman (2009) the use of System GMM estimators must be done with great caution, and several checks must be done before relying on the estimation results, especially when T is small and the number of internally determined instruments is high. Because too many instruments can overfit instrumented variables—failling to remove their endogenous components and biasing the coefficient estimates (see Roodman, 2009)—, we keep the number of instruments to the minimum.16 For the lagged real GDP per capita, we use as instruments the first difference lagged one period for the equations in levels. For the equations in first difference, we use the first lagged value. For the other variables, which are assumed endogenous, we use the second lagged value as instruments. To test whether financial inclusion is one of the channels through which ICT improves growth, we retain the model in which ICT development is measured by mobile penetration and add a variable of financial inclusion in the growth model—captured by either the number of deposits or the number of loans per head—to check how the coefficient on ICT development moves. If this coefficient weakens, we can conclude that part of the beneficial impact of ICT development on growth is channeled through financial inclusion. We strengthen the analysis by including an interaction term between mobile penetration and financial inclusion. We assess whether, by improving financial inclusion, mobile penetration is at the same time reinforcing its own impact on economic growth. Similarly, this allows us to test whether the impact of financial inclusion on growth is strengthened by better ICT
15 Blundell and Bond (1998) estimation requires that the series (yi,1 , yi,2 ,...,yi,T ) are mean stationary, that is,
they have a constant mean ηi
1−α for each country i.
16 The validity of the BB estimators is checked by using the p-values of a Hansen-Sargan test of overidentifying restrictions. It tests for joint validity of the full instrument by checking whether the instruments, as a group, appear exogenous. We also check the p-values of the Arellano-Bond test for AR(2) serial correlation of the residuals.
13
infrastructure. We also refine the analysis by isolating the impact of ICT on growth through financial inclusion in countries that have implemented financial services on mobile phones.
V. RESULTS
A. Impact of ICT on Economic Growth
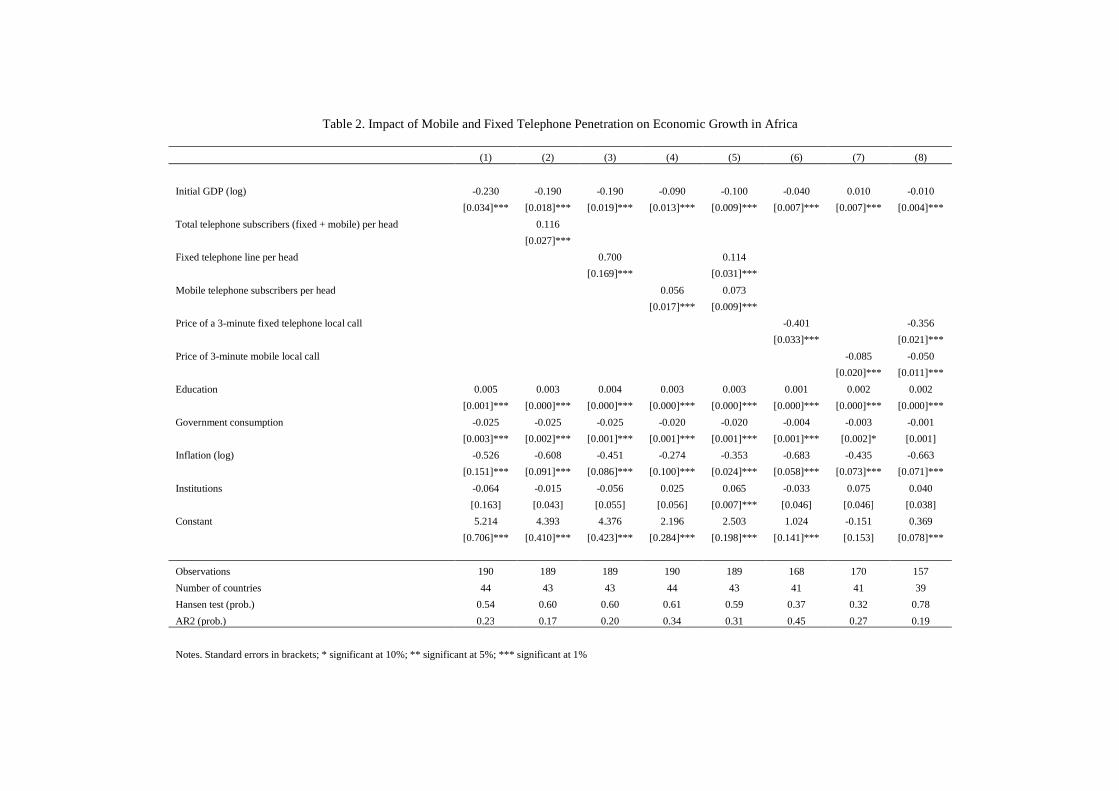
Table 2 summarizes the results of the impact of ICT on economic growth, particularly that of mobile and fixed telephones. The baseline growth model is presented in the first column. As shown by past studies, high government consumption and macroeconomic instability captured by high inflation rates dampen economic growth in African countries. The results of the baseline regression also suggest that human capital accumulation favors growth; however, the legal environment does not appear significant, probably because the civil and political liberty indexes may not capture well the strength of the law in African economies, although they have the advantage of being available for a large sample of countries during a long period.17 There is also evidence of growth convergence among African countries, suggesting that countries with lower initial income tend to growth faster than others with similar macroeconomic conditions, level of human capital, and institutions. In columns 2 through 8, we introduced a wide range of ICT variables in the baseline model. The penetration rates of fixed and mobile telephones are found to have a significant and positive impact on economic growth in Africa (column 2, Table 2), consistent with the findings of Hardy (1980) for developing and developed economies, and Roller and Waverman (2001) for OECD countries. This result holds even when including the fixed and mobile penetration rate alternatively (column 3 and 4, Table 2) or jointly (column 5, Table 2) in the baseline regression. Taking the specification in column 5, an additional 10 percentage point increase in the mobile penetration rate could lead to a 0.7 percent increase in real GDP, compared to a 1.1 percentage increase for an increase in the fixed penetration rate by the same magnitude. The marginal impact of the fixed penetration rate on economic growth appears stronger than that of the mobile penetration rate, which contrasts with previous findings (see Sridhar and Sridhar, 2004, on a sample of developing economies and Waverman, Meschi, and Fuss, 2005). This suggests that there is room to improve further the contribution of mobile phone development to economic growth in Africa.18 We improve on previous studies by considering communication costs in addition to penetration rates as alternative indicators of ICT development. The main reason is that affordable communication costs could stimulate the use of fixed and mobile telephone, and at
17 Using an alternative indicator of legal environment such as the rule of law gives a better result, but unfortunately reduces the sample size by a quarter—the reason we did not retain this indicator.
18 It is worth noting that the prospects for increasing the penetration rate of fixed telephone appear more limited than for the mobile telephone, even in Africa, underlining the importance of mobile telephone development as a source of growth.
14
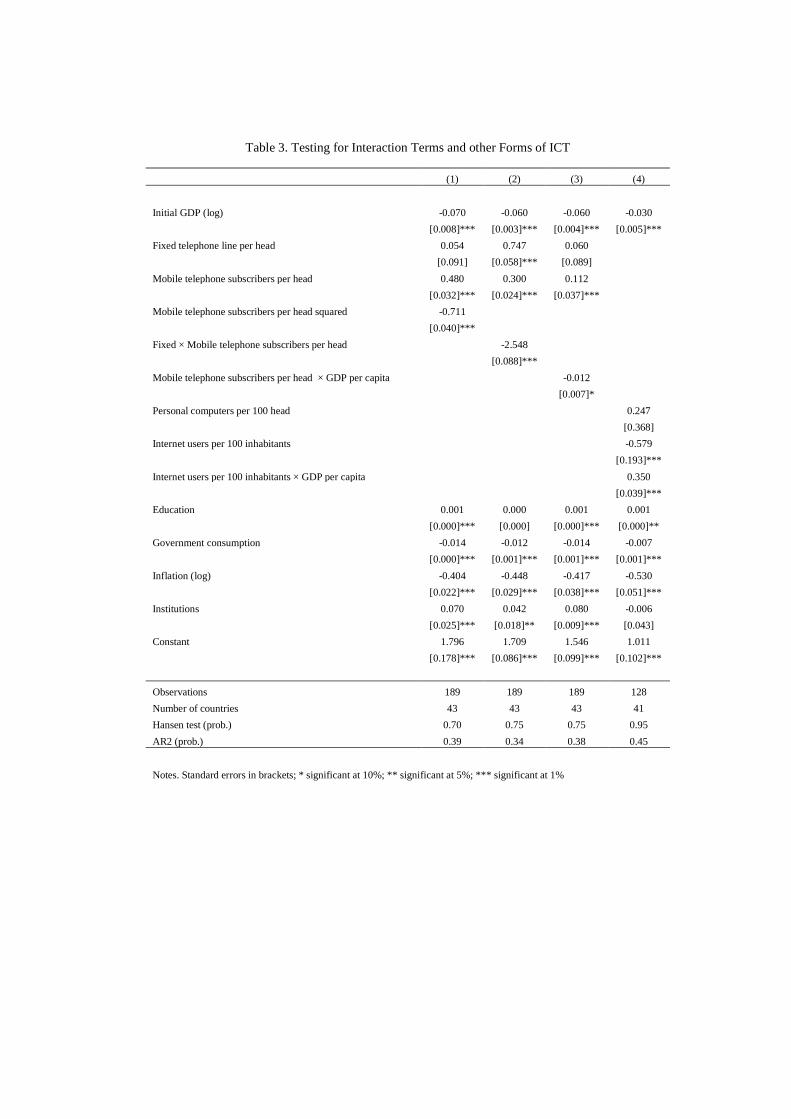
the same time a widespread use of fixed and mobile telephones leads to lower unit production cost for telephone companies that in turn could be passed on to customers. As a result, we expect a negative correlation between communication costs and the penetration rate of mobile and fixed telephone, and hence economic growth. The results confirm that the price of a 3-minute fixed or mobile telephone local call is negatively associated with economic growth (columns 6, 7, and 8, Table 2). The magnitude of the mobile price effect on growth may not be negligible. For instance in Ghana, the cost of a 3-minute mobile telephone local call dropped dramatically, by 62 percent, from US$1.18 in 1999 to US$0.46 in 2006; this would yield a 3.6 percent increase in real income over eight years. Egypt and Mozambique experienced a drop in mobile communication cost by a similar magnitude during the same period. In Table 3, we tested a nonlinear relationship between ICT and economic growth and the impact of other forms of ICT, such as computer and Internet usage. First, we tested whether mobile and fixed telephones are complements or substitutes by including in the model an interaction term between the penetration rate of mobile and fixed telephone (column 1, Table 3). As expected, the coefficient on the interaction term is negative and significant (see also Waverman, Meschi, and Fuss, 2005), suggesting that mobile telephones are a substitute for fixed telephones in Africa. Put differently, the marginal impact of mobile telephone development on growth is stronger in countries with low fixed telephone penetration rates. The substitution effect shown in African countries is not surprising given the shortage of fixed telephone lines on the continent. In this case, the substitution effect results from the lack of extensive wired infrastructure and not from a change in the demand for communication services. Second, we introduced in the model an interaction term between mobile penetration rate and GDP per capita and found that the marginal impact of mobile telephone development decreases with the level of income per capita (column 2, Table 3), probably reflecting diminishing growth returns to mobile telephone development. This is consistent with the findings of Waverman, Meschi, and Fuss (2005) who show a greater impact of mobile telephone in lower income countries. Finally, we tested the effect of computer and Internet usage on economic growth. Although the coefficient on computer usage is positive, it remains nonsignificant statistically (column 3, Table 3) probably because the penetration rate of computer use is still very low in Africa. Internet access, which is closely linked to computer access, appears to have a positive effect on economic growth only when GDP per capita is high enough, consistent with what Grace, Kenny, and Qiang (2003) called Internet traps.19
B. Robustness Tests
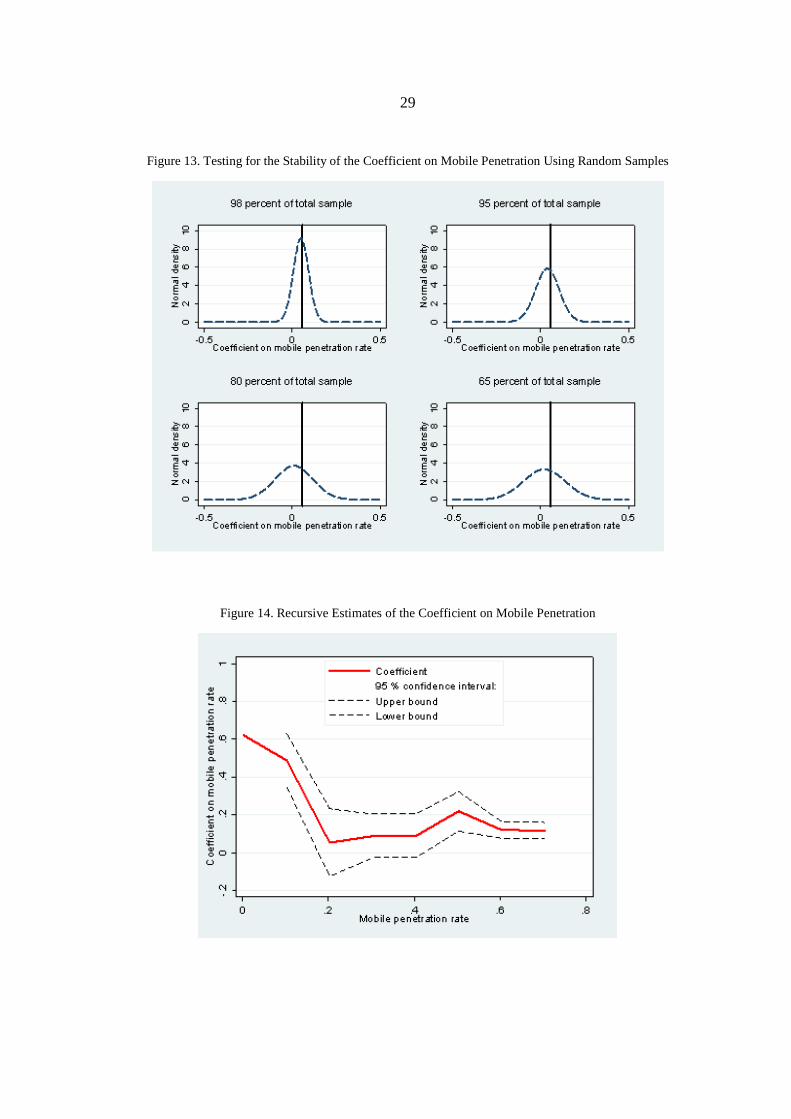
To test the robustness of our results, we checked the sensitivity of the coefficient on mobile penetration, our main variable of interest, to the composition of the sample using the specification in column 4 of Table 2. We started by selecting randomly 98 percent of the observations (without replacement) and ran the baseline regression. This process, repeated 250 times, gives values of the coefficient on mobile penetration, for which the normal 19 We also tested an interaction term between computer and Internet usage and between computer usage and education, without concluding results.
15
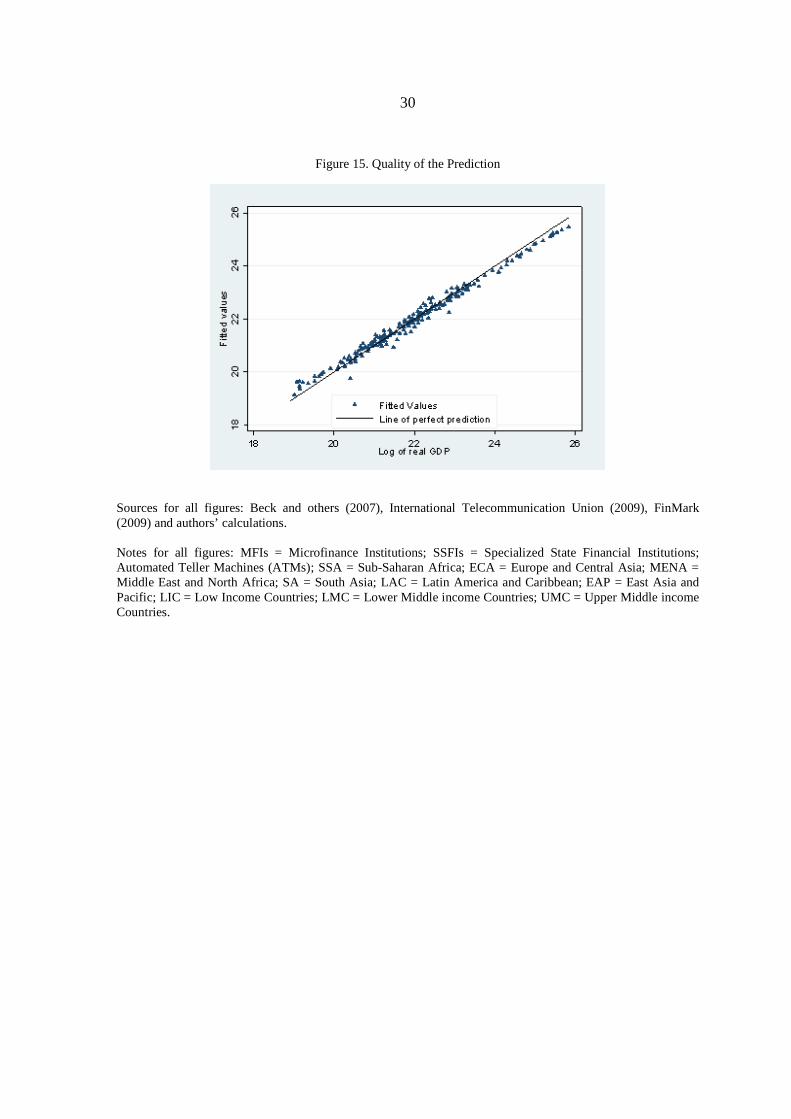
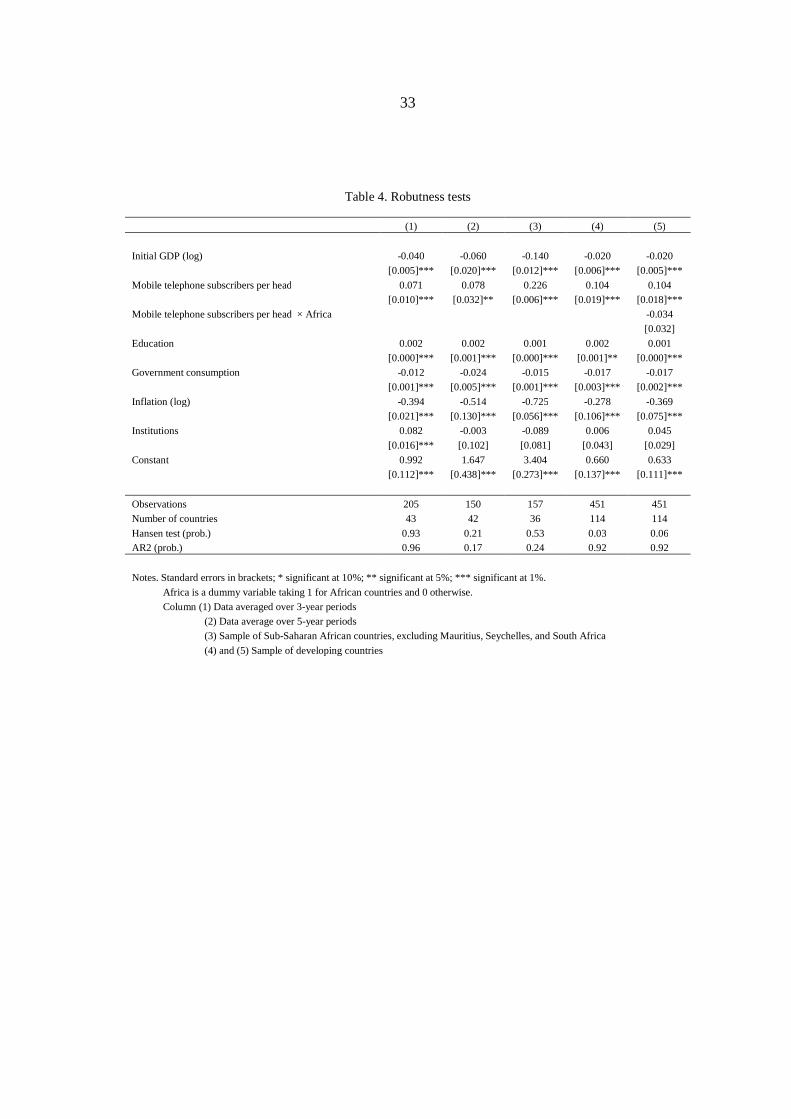
distribution is shown in Figure 13. While the average coefficient on mobile penetration remains very close to the coefficient of the full sample (represented by the vertical line, which is equivalent to sampling 100 percent of the observations), the base of the distribution widens. We used the same procedure to select randomly 95 percent of the observations. The results showed that leaving 5 percent of observations out of the sample shifted away the average coefficient on mobile penetration from the coefficient of the full sample. With 95 percent of observations, the average coefficient on mobile penetration is 0.037, compared to 0.56 for the full sample. Further reducing the size of the random sample shows that the average coefficient on mobile penetration gets closer to zero, while its distribution has a heavier tail. In other words, the probability of replicating the full sample estimate of the coefficient on mobile penetration weakens rapidly as the size of the subsample shrinks. This suggests that the coefficient estimated for the full sample hides significant country heterogeneity. This country heterogeneity could be partly explained by the nonlinear relationship between mobile penetration and growth we found earlier. Indeed, as shown in Table 3, the marginal impact of mobile penetration rates on growth is larger when income per capita is low and/or fixed telephone penetration is low. Caution is therefore needed when interpreting the results in the tables above; the growth benefits from mobile phone development may not be immediate and depend on country-specific factors that need to be accounted for. As a result, it could be useful, if data permit, to complement panel studies on the impact of ICT on growth with country-specific studies. We also conducted recursive estimations to test the stability of the coefficient on mobile penetration. The observations are first ranked in increasing order of the mobile penetration rate. Starting with a sample of low mobile penetration rates, we added subsequent observations with higher penetration rates to the sample and reran the regressions. The results show that the coefficient on mobile penetration remains positive and significant (Figure 14), but the marginal impact of mobile phones on growth is heterogeneous across the sample and declines as the mobile penetration rate increases. This may suggest a lack of network effects (see Roller and Waverman, 2001) in African countries, probably because their penetration rates are still below the threshold above which network effects are at play. Despite the country heterogeneity, the model does a good job of predicting the dependent variable (Figure 15). Within 5 percent confidence interval, the model predicts well real GDP for all countries in the sample. We performed additional robustness tests (Table 4). Averaging the data over a 3-year period increases the sample size by 8 percent, without dramatically changing the results. The coefficient on mobile phone penetration retains its positive sign and remains significant at 1 percent (column 1). Moving to a five-year average reduces the sample by 20 percent but does not affect the quality of the results (column 2). We restricted the sample to Sub-Saharan African countries, excluding the top performers in the region (Mauritius, Seychelles, and South Africa). The coefficient on mobile is positive and significant and has a larger
16
magnitude (column 3).20 Finally, the regression is run on a sample consisting of developing countries; we found that mobile telephone development stimulates economic growth and that the marginal impact for African countries is not statistically different from that of other developing economies (columns 4 and 5).
C. Financial Inclusion
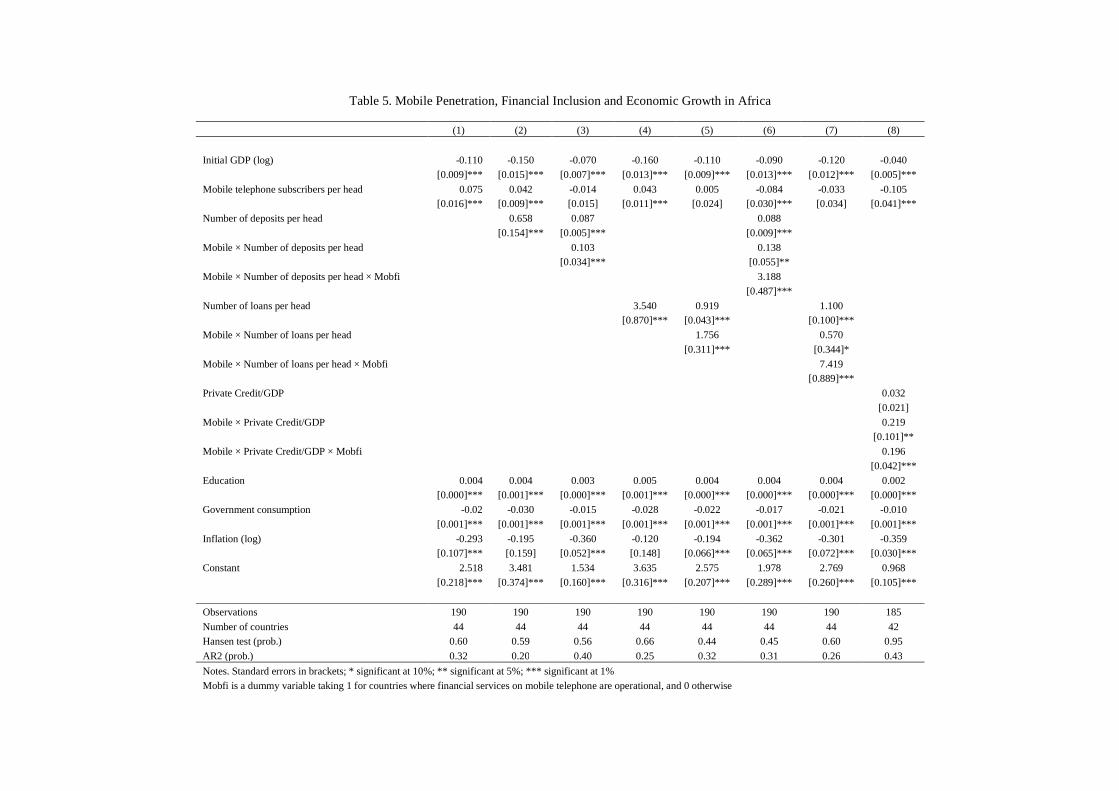
In this section, we investigate whether ICT development stimulates growth by fostering financial inclusion and whether the interaction between ICT and financial inclusion facilitate economic growth. Before turning to the regressions, one could note the challenge of measuring financial inclusion in the sense of a greater access of households to financial services. Very few measures of financial inclusion exist, and those that do lack time dimension and are available for only a limited number of countries. We retained two indicators that are relevant for our study. The first is the number of deposits per head—including deposits at commercial banks, cooperatives, microfinance institutions, and specialized state financial institutions—and the second is the number of loans per head—also including loans by all the previously mentioned financial institutions. Because these two measures appear highly correlated with the level of financial development, we do not include the latter in the model; but we will, instead, use it as a broader indicator of financial inclusion. Regarding the ICT variable, we considered the particular case of mobile telephones as shown by the baseline specification in column 1 of Table 5, which replicates the model presented in column 4 of Table 2.21 In columns 2 and 4 of Table 2, the coefficient on the number of deposits per head and that on the number of loans per head are positive and significant as expected, implying that greater financial inclusion is associated with higher economic growth in African economies. Interestingly, the coefficient on the mobile penetration rates drops when controlling for financial inclusion, suggesting that some of the positive impact of ICT on growth is channeled through financial inclusion.22 Further, the penetration of mobile telephones enhances the growth impact of financial inclusion as shown by the positive and significant coefficient on the interaction term between the mobile penetration rate and the number of deposits per head (column 3, Table 5). The same result holds for the interaction term between the mobile penetration rate and the number of loans per head (column 5, Table 5). These results confirm that mobile telephone penetration can foster economic growth, not only by facilitating financial inclusion, but also by consolidating the impact of financial inclusion on economic growth. Through higher mobile penetration, it becomes easier to have
20 Probably because the countries included in the sample have lower income per capita. The results in Table 3 (column 2) show that the marginal impact of mobile phone penetration on growth declines as income per capita increases.
21 Without the variable measuring institutions as it was not significant.
22 Note that Figure 1 shows a positive correlation between mobile penetration and financial inclusion, even after controlling for GDP per capita level.
17
access to deposits and loans, as better information flows brought by mobiles improves information acquisition of both depositors and financial institutions as well as enhances monitoring. It indeed reduces the physical constraints and costs brought by distance and time. Also, better ICT development reduces the cost of financial intermediation and contributes to the emergence of branchless banking services, therefore improving access to finance for households that would be credit constrained otherwise. To refine our analysis, we took into account the fact that financial services on mobile still remain underdeveloped in African countries and are only available in a limited number of countries. Therefore, it is worth assessing whether mobile financial services penetration further strengthens the growth effect of financial inclusion in these countries. During the period covered by our study, three countries are operating mobile financial services: Zambia since 2001, South Africa since 2004, and Kenya since 2007. We constructed a dummy variable (named Mobfi), taking the value of 1 if mobile financial services are operating in the countries and 0 otherwise. Crossing this dummy variable with the interaction term between financial inclusion and mobile penetration shows that in countries where mobile financial services exist, mobile penetration further enhances the contribution of financial inclusion to economic growth compared to countries where these services are yet to be deployed (columns 6 and 7, Table 5). As a robutness test, we checked for the potential influence of outliers by subsequently removing from the sample observations with a residual term larger than: (i) two standard deviations, (ii) one standard deviation and (iii) one-half standard deviation of the dependent variable. Rerunning the regressions without these potential outliers does not affect the quality of the results. The results are also confirmed when replacing financial inclusion with financial development. While financial development—captured by the ratio of private credit to GDP—appears weakly correlated to growth (the coefficient is significant at only 11 percent), the interaction term between financial development and mobile penetration is positive and significant, suggesting that financially well-developped countries tend to grow faster when mobile penetration is high (column 8, Table 5). Consistent with the previous results, this effect appears stronger in countries where mobile financial services are available.
VI. CONCLUSIONS
This paper investigates the impact of ICT development on economic growth, considering a sample of African countries during 1988–2007. Focusing especially on mobile telephone development, the paper argues that the recent development of mobile financial services could be one of the channels through which ICT contributes to growth. Using a standard growth model and the System GMM estimator to deal with endogeneity issues, the results of the estimations reveal that ICT development (captured by the penetration rates of mobile and fixed telephone and communication costs) accounts for economic growth in Africa. In addition, financial inclusion, measured by the number of deposits and loans per head, is conducive to economic growth and appears to be one of the channels of transmission from ICT to growth. Indeed, controlling for financial inclusion reduces the coefficient of ICT, although marginally. More importantly, the interaction between ICT and financial inclusion is found positive and significant in the growth regression. Although the rollout of mobile
18
banking is still at its early stage, the results show that in countries where such financial services are available, the joint impact of financial inclusion and ICT on growth is stronger. The findings of this paper underline the importance of ICT development, in particular mobile phone rollout, for African countries as a source of growth, and ICT’s potential to improve financial inclusion, which itself spurs growth. Therefore, the policy implications for African countries are to create an enabling regulatory environment to encourage both domestic and foreign investment in ICT to promote the development of the sector and widespread use of ICT, especially mobile telephone. Moreover, driving down the cost of communications is also critical to stimulating the diffusion of ICT and spurring growth. Therefore, increased competition in the telecommunication industry is needed. The experience of OECD countries suggests that prices have declined, and technological diffusion and introduction of new services have been rapid following the liberalization of the ICT sector. This has generated more competition (OECD, 2003). Further, ICT has the potential to foster financial inclusion by easing the provision of cost- effective financial services to the poor, as well as to the nonpoor, given the low banking coverage in African countries. Providing the appropriate framework and business environment to support greater interaction between ICT and financial sectors while addressing the challenges posed by mobile banking (security concerns, compliance with AML/CFT rules, and so forth) could improve the development of mobile banking.23 This will in turn improve households’ access to financial services, promote greater financial inclusion, and ultimately foster economic growth in Africa. Regulation should therefore be designed not to hinder the opportunities that telecommunication technology and new financial services can bring to address the infrastructure gap and the lack of access to financial services in Africa.
23 AML = Anti Money Laundering; CFT = Combating the Financing of Terrorism.
19
REFERENCES
Barro, Robert J., 1991, “Economic Growth in a Cross Section of Countries,” The Quarterly Journal of Economics, 106(2), pp. 407–43. Beck, Thorsten, Asli Demirguc-Kunt, and Maria Soledad Martinez Peria, 2007, “Reaching Out : Access to and Use of Banking Services Across Countries,” Journal of Financial Economics, 85(1), pp. 234–66. Blundell, Richard, and Stephen Bond, 1998, “Initial Conditions and Moment Restrictions in Dynamic Panel Data Models,” Journal of Econometrics, 87(1), pp. 115–43. Chowdhury, Shyamal, 2006, “Investments in ICT-Capital and Economic Performance of Small and Medium Scale Enterprises in East Africa,” Journal of International Development, Vol. 18(4), pp. 533-552. Collins, Daryl, Jonathan Morduch, Stuart Rutherford, and Orlanda Ruthven, 2009, Portfolios of the Poor: How the World's Poor Live on $2 a Day, (Princeton, N.J.: Princeton University Press). Consultative Group to Assist the Poor, 2009, Financial Access 2009—Measuring Access to Financial Services around the World, Technical Report, (Washington: CGAP). Datta, Anusua, and Sumit Agarwal, 2004, “Telecommunications and Economic Growth: A Panel Data Approach,” Applied Economics, 36(15), pp. 1649–54. Do-Nascimento, José, 2005, “Télécommunications entre biens publics et marchandises”, in Le développement du téléphone portable en Afrique, ed. by François Xavier Verschave, Djilali Benamrane, Bruno Jaffres, (Paris: Charles Léopold Mayer Eds). Donner, Jonathan, 2006, “The Use of Mobile Phones by Microentrepreneurs in Kigali, Rwanda: Changes to Social and Business Networks,” Information Technologies and International Development, Vol 3(2), pp: 3–19. Donner, Jonathan, 2008, “Research Approaches to Mobile Use in the Developing World: A Review of the Literature,” The Information Society, 24(3). FinMark, Trust, ed., 2009, FinScope South Africa 2009 (Johannesburg: FinScope). Grace, Jeremy, Charles Kenny, and Christine Zhen-Wei Qiang, 2003, “Information and Communication Technologies and Broad Based Development: A Partial Review of the Evidence,” World Bank Working Paper, Technical Report 12 (Washington, World Bank). Haacker, Markus, 2010, "ICT Equipment Investment and Growth in Low- and Lower-Middle-Income Countries," IMF Working Papers 10/66, (Washington: International Monetary Fund).
20
Hardy, Andrew P., 1980, “The Role of the Telephone in Economic Development,” Telecommunications Policy, 4(4), pp. 278–286. Heeks, Richard, 1999, “Information and Communication Technologies, Poverty and Development.” Development Informatics Working Paper Series, No.5/1999, (Manchester: Institute for Development Policy and Management). Jensen, Robert, 2007, “The Digital Provide: Information (Technology), Market Performance, and Welfare in the South Indian Fisheries Sector,” The Quarterly Journal of Economics, 122(3), pp. 879–24. Kathuria, Rajat, Uppal, Mahesh and Mamta 2009, “An Econometric Analysis of the Impact of Mobile,” The Vodafone Policy Paper Series, (9), pp 5–20. Lee, Sang H., John Levendis, and Luis Gutierrez, 2009, “Telecommunications and Economic Growth: An Empirical Analysis of Sub-Saharan Africa,” Documentos de trabajo 005512, Universidad del Rosario—Facultad de Economia, Bogota. Lewin, David, and Susan Sweet, 2005, “The Economic Impact of Mobile Services in Latin America,” Technical report, Report for the GSMA, GSM Latin America and AHCIET. Norton, Seth W., 1992, “Transaction Costs, Telecommunications, and the Microeconomics of Macroeconomic Growth,” Economic Development and Cultural Change, 41(1), pp. 175–96. OECD. ed., 2003, ICT and Economic Growth: Evidence from OECD Countries, Industries and Firms (Paris: Organisation for Economic Co-operation and Development). Rand, John and Finn Tarp, 2002, “Business Cycles in Developing Countries: Are They Different?,” World Development, Vol. 30(12), pp 2071–2088. Rasmussen, Stephen, 2010, “Mobile banking in 2020,” In CGAP Technology Program (Washinton: Consultative Group to Assist the Poor). Roller, Lars-Hendrik, and Leonard Waverman, 2001, “Telecommunications Infrastructure and Economic Development: A Simultaneous Approach,” American Economic Review, 91(4), pp. 909–23. Roodman, David, 2009, “A Note on the Theme of Too Many Instruments,” Oxford Bulletin of Economics and Statistics, 71(1), pp. 135–58. Sridhar, Kala Seetharam, and Varadharajan Sridhar, 2004, “Telecommunications Infrastructure and Economic Growth: Evidence from Developing Countries,” Working Papers 04/14 (New Delhi: National Institute of Public Finance and Policy).
21
Tcheng, Henri, Jean Michel Huet, and Mouna Romdhane, 2010, “Les enjeux financiers des télécoms en Afrique sub saharienne,”. Technical Report, (Paris: Institut Français des Relations Internationales). . Tcheng, Henri, Jean-Michel Huet, , Isabelle Viennois, and Mouna Romdhane, 2007, “Telecoms and Development in Africa: the Chicken or the Egg?” Convergence Letter No 8. Waverman, Leonard, Meloria Meschi, and Melvyn Fuss, 2005, “The Impact of Telecoms on Economic Growth in Developing Countries,” The Vodafone Policy Paper Series, (2), pp. 10–23.
22
Figure 1. Correlation between Mobile Penetration, Growth and Financial Inclusion
23
Figure 2. Financial Inclusion and Mobile Penetration by Type of Financial Institutions
Figure 3. Trends in ICT Use: International Comparison
24
Figure 4. ICT Growth in Developing Countries
Figure 5. Trends in Fixed versus Mobile Phone Subscribers: International Comparison
25
Figure 6. Trends in Mobile Penetration: International Comparison
Figure 7. Trends in Prepaid versus Postpaid Phone Subscribers: International Comparison
26
Figure 8. Access to Financial Services in Selected African Countries
(Percent of total population)
Figure 9. Bank Loans and Deposits: International Comparison
27
Figure 10. Bank Branches and ATMs
28
Figure 11. Financial Infrastructure Gap in Developing Countries
0 20 40 60 80 100
0
50
100
150
200
250
300
PVD (LIC, LMC, UMC) High income
Financial infrastructure gap
Number of Loans Per 10000 People
Number of Deposits per 10000 People
Coverage of mobile cellular network (population, in %)
Developing countries
High income countries
Figure 12. Comparing Trends in Bank Credit and Mobile Penetration
29
Figure 13. Testing for the Stability of the Coefficient on Mobile Penetration Using Random Samples
Figure 14. Recursive Estimates of the Coefficient on Mobile Penetration
30
Figure 15. Quality of the Prediction
Sources for all figures: Beck and others (2007), International Telecommunication Union (2009), FinMark (2009) and authors’ calculations. Notes for all figures: MFIs = Microfinance Institutions; SSFIs = Specialized State Financial Institutions; Automated Teller Machines (ATMs); SSA = Sub-Saharan Africa; ECA = Europe and Central Asia; MENA = Middle East and North Africa; SA = South Asia; LAC = Latin America and Caribbean; EAP = East Asia and Pacific; LIC = Low Income Countries; LMC = Lower Middle income Countries; UMC = Upper Middle income Countries.
Table 2. Impact of Mobile and Fixed Telephone Penetration on Economic Growth in Africa
Notes. Standard errors in brackets; * significant at 10%; ** significant at 5%; *** significant at 1%
Mobfi is a dummy variable taking 1 for countries where financial services on mobile telephone are operational, and 0 otherwise
Appendix 1. List of the Sample Countries
Algeria Libya Angola Madagascar Benin Malawi Botswana Mali Burkina Faso Mauritania Burundi Mauritius Cameroon Morocco Cape Verde Mozambique Central African Rep. Namibia Chad Niger Congo Rwanda Congo (Democratic Republic of the) Senegal Cote d'Ivoire Seychelles Egypt Sierra Leone Equatorial Guinea South Africa Ethiopia Sudan Gabon Swaziland Gambia Tanzania Ghana Togo Guinea-Bissau Tunisia Kenya Uganda Lesotho Zambia
36
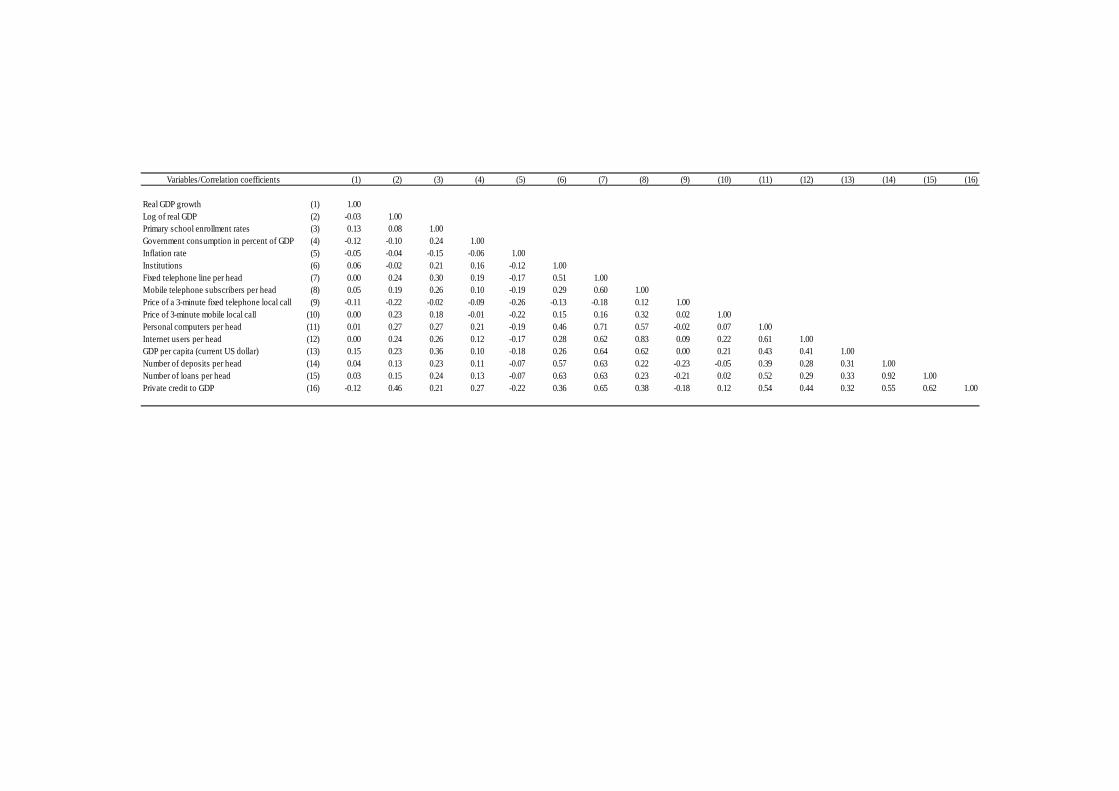
Appendix 2. Summary Statistics and Correlation Matrix
Observations Average
Standard deviation
Minimum Maximum
Real GDP growth 190 4.3 4.2 -4.9 40.9 Log of real GDP 190 22.0 1.5 19.0 25.8 Primary school enrollment rates 190 89.7 28.5 26.9 181.2 Government consumption in percent of GDP 190 14.7 5.4 2.6 35.0 Inflation rate 190 10.3 13.4 -5.9 83.6 Institutions 190 0.268 0.152 0.143 1.000 Fixed telephone line per head 189 0.028 0.049 0.0 0.286 Mobile telephone subscribers per head 190 0.063 0.136 0.0 0.792 Price of a 3-minute fixed telephone local call 168 0.114 0.094 0.014 0.774 Price of 3-minute mobile local call 170 0.498 0.476 0.0 1.853 Personal computers per head 134 0.012 0.017 0.0 0.081 Internet users per head 170 0.012 0.025 0.0 0.175 GDP per capita (current US dollar) 190 1,207 1,816 97 14,320 Number of deposits per head 190 0.064 0.129 0.0 0.739 Number of loans per head 190 0.011 0.024 0.0 0.125 Private credit to GDP 185 0.170 0.151 0.020 0.712
Notes: Due to limited data availability for the number of deposits and loans per head, we assume that the average level hold throughout the entire period.
Real GDP growth (1) 1.00Log of real GDP (2) -0.03 1.00Primary school enrollment rates (3) 0.13 0.08 1.00Government consumption in percent of GDP (4) -0.12 -0.10 0.24 1.00Inflation rate (5) -0.05 -0.04 -0.15 -0.06 1.00Institutions (6) 0.06 -0.02 0.21 0.16 -0.12 1.00Fixed telephone line per head (7) 0.00 0.24 0.30 0.19 -0.17 0.51 1.00Mobile telephone subscribers per head (8) 0.05 0.19 0.26 0.10 -0.19 0.29 0.60 1.00Price of a 3-minute fixed telephone local call (9) -0.11 -0.22 -0.02 -0.09 -0.26 -0.13 -0.18 0.12 1.00Price of 3-minute mobile local call (10) 0.00 0.23 0.18 -0.01 -0.22 0.15 0.16 0.32 0.02 1.00Personal computers per head (11) 0.01 0.27 0.27 0.21 -0.19 0.46 0.71 0.57 -0.02 0.07 1.00Internet users per head (12) 0.00 0.24 0.26 0.12 -0.17 0.28 0.62 0.83 0.09 0.22 0.61 1.00GDP per capita (current US dollar) (13) 0.15 0.23 0.36 0.10 -0.18 0.26 0.64 0.62 0.00 0.21 0.43 0.41 1.00Number of deposits per head (14) 0.04 0.13 0.23 0.11 -0.07 0.57 0.63 0.22 -0.23 -0.05 0.39 0.28 0.31 1.00Number of loans per head (15) 0.03 0.15 0.24 0.13 -0.07 0.63 0.63 0.23 -0.21 0.02 0.52 0.29 0.33 0.92 1.00Private credit to GDP (16) -0.12 0.46 0.21 0.27 -0.22 0.36 0.65 0.38 -0.18 0.12 0.54 0.44 0.32 0.55 0.62 1.00
Appendix 3. Variable Definition and Sources
Variables Definitions Sources
Real GDP growth Annual change in real Gross Domestic Product
Log of real GDP Logarithm of real Gross Domestic Product
Primary school enrollment ratesRatio of total enrollment in primary schools to the population of the age group that officially corresponds to that level of education.
Government consumption in percent of GDPGovernment current expenditure as a share of Gross Domestic Product
Inflation rate Annual change in Consumer Price Index
GDP per capita (current US dollar)Nominal Gross Domestic Product divided by total population
InstitutionsInverse of the average value of political right and civil liberty index
Freedom House
Fixed telephone line per headThe ratio of fixed-line subscribers to total population
Mobile telephone subscribers per head Mobile telephone subscribers divided by total popualtion
Price of a 3-minute fixed telephone local callPrice of a 3-minute fixed telephone local call (peak rate - US$)
Price of 3-minute mobile local call Mobile cellular - price of 3-minute local call (peak -
Personal computers per headNumber of personal computers divided by total population
Internet users per headNumber of people with access to the worldwide network divided by total population
Private Credit/GDP Private Credit by Deposit Money Banks as share of GDP
Financial Structure Database (World Bank)
Number of deposits per head
Number of deposits by commercial banks, cooperatives, specialized state financial institutions, and microfinance institutions divided by total adult population
Number of loans per head
Number of loans by commercial banks, cooperatives, specialized state financial institutions, and microfinance institutions divided by total adult population
Financial access: Measuring Access to Financial Services around the World (2009); Beck, Demirgüç-Kunt, and Martinez Peria (2007 a and b)
Word Development Indicators and International Financial Statistics