4 OCR Functional Skills Qualification in ICT at Level 2
OXFORD CAMBRIDGE AND RSA EXAMINATIONS
LEVEL 2 FUNCTIONAL SKILLS
INFORMATION AND COMMUNICATION TECHNOLOGY 09877
PART A – TASK AND ANSWER BOOKLET
This assessment may be taken within these dates
SAMPLE ASSESSMENT MATERIAL TIME: 15 MINUTES YOU NEED This task and answer booklet. Access to a computer, software and a printer. A pen with black ink. YOU HAVE 15 MINUTES TO COMPLETE THE TASK Space has been provided in this booklet for you to write your answers but you may word process
your answers if you prefer. Ensure that each answer is numbered correctly eg 1b).
Printing may be carried out after the time allocated for this assessment.
When you have finished, check that your name appears on EVERY printout. Printouts without names will be awarded no marks.
Insert your printouts into this booklet in the correct order and hand it to your supervisor when you have completed both Part A and Part B of this test.
Commentary on mark given Advice on how the candidate could improve
The candidate has provided a screen dump of the search criteria they entered into a search engine to find the required information from the internet. The candidate has only specified "village hotel" which is partially correct. The candidate has selected a map that shows where all village hotels are. This does not meet the requirements of the task but would have been awarded marks for the fact that it shows where Coventry is. 4 out of 7 marks awarded
The candidate should also have included Coventry within their search criteria to have been awarded full marks. The candidate should have found a map or diagram that shows the streets around the Village Hotel so that delegates could see exactly where it is located in Coventry.
b) Why is it important to guard against computer viruses when downloading information from the
internet? Because you could get a virus . _____________________________________________________________________
(1 mark)
Commentary on mark given Advice on how the candidate could improve
The candidate has not answered the question of why it is important to guard against viruses. 0 out of 1 mark awarded
The candidate should have explained that it is important as you could lose data from your computer or functionality of the computer system.
SAMPLE ASSESSMENT MATERIAL TIME: 1 HOUR 45 MINUTES YOU NEED This task and answer booklet. The Resource Booklet for this part of the test. Access to a computer, software and a printer. Access to the data files listed below. Your supervisor will tell you where these are stored. march 2010 newsletter text units sold 2009 units sold 2008 units sold 2010
A pen with black ink.
YOU HAVE 1 HOUR 45 MINUTES TO COMPLETE THE TASK
Printing may be carried out after the time allocated for this assessment.
When you have finished, check that your name appears on EVERY printout. Printouts without names will be awarded no marks.
Insert your printouts into this booklet in the correct order and hand it to your supervisor.
TASK 2 Ali has decided that the sales department needs a monthly newsletter. Ali wants the March 2010 newsletter to include sales data and details of the annual sales conference. Ali wants you to produce the March 2010 newsletter. He has provided the text he wants in the newsletter in a file. You need to prepare other information required for the newsletter. You will do this in steps a) and b). a) Produce a chart that shows the five regions that have sold the most units so far in 2010. The
chart should show the units sold in January and February. The data is in one of the files Ali has provided.
Evidence you must provide A printout of the chart created.
Commentary on mark given Advice on how the candidate could improve
The candidate has clearly selected the correct software to produce a chart. The candidate has selected the correct data file to use. The candidate has thought through the requirements of the task and has added the sales data for January and February together, sorted the data and charted the top 5 regions. The candidate has used a comparative bar chart to show the units sold in January and February. The candidate has not entered a chart title so has lost a number of marks. Candidates appear to struggle with producing charts with appropriate titles, labels and legend. The reader can read a value for each month but, because of the lack of axes titles, does not know of what the value is a measure. The labels and legend that are on the chart are not all meaningful (i.e. Series 1 and Series 2 in the legend mean nothing) but are clearly displayed and are spelt accurately. 11 out of 16 marks awarded
The candidate should be sufficiently familiar with the software they use to be able to enter a chart title and axes labels. The candidate should be able to compose suitable titles and labels as required by the chart they produce.
b) Produce a list showing those regions where the percentage increase in sales from January to
February 2010 was less than 2%. The list should include the units sold in both months and the percentage increase values.
(For each region, the percentage increase in sales is the units sold in February minus the
units sold in January, with this result divided by the units sold in January.)
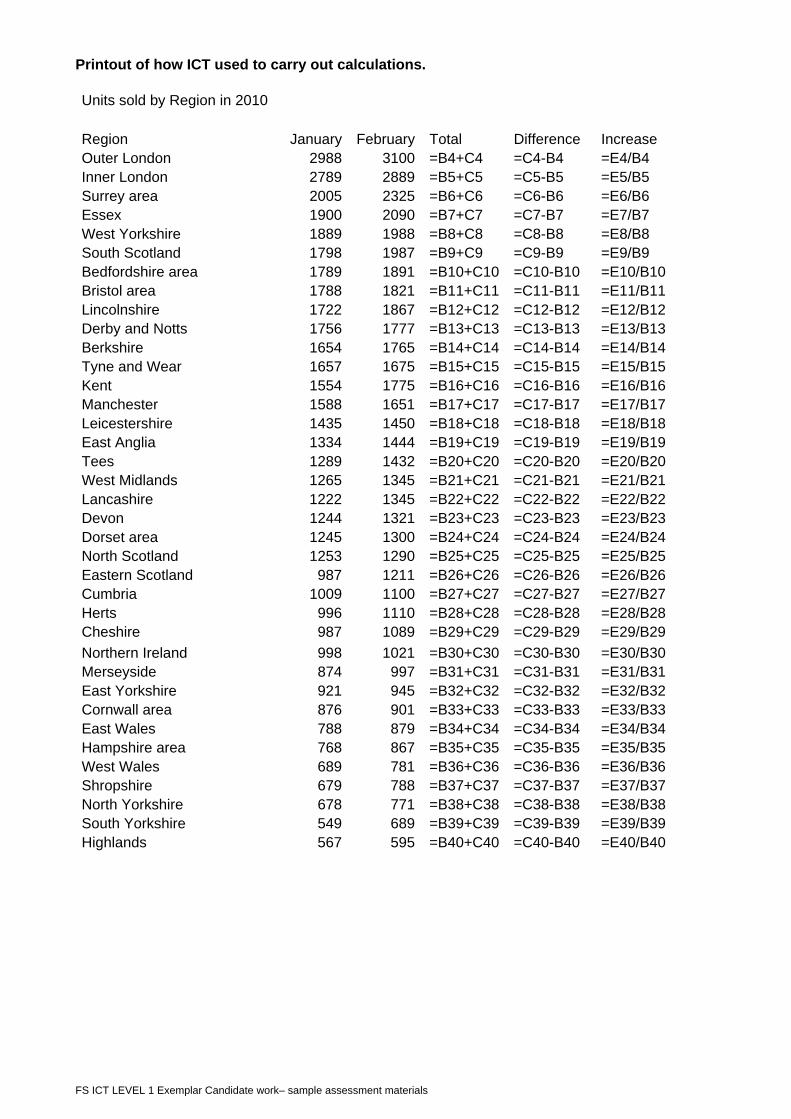
Evidence you must provide A printout showing those regions where the percentage increase in sales from January to February was less than 2%. A printout of how you used ICT to carry out your calculations i.e. a formula printout.
Printout of how ICT used to carry out calculations. Units sold by Region in 2010 Region January February Total Difference Increase Outer London 2988 3100 =B4+C4 =C4-B4 =E4/B4 Inner London 2789 2889 =B5+C5 =C5-B5 =E5/B5 Surrey area 2005 2325 =B6+C6 =C6-B6 =E6/B6 Essex 1900 2090 =B7+C7 =C7-B7 =E7/B7 West Yorkshire 1889 1988 =B8+C8 =C8-B8 =E8/B8 South Scotland 1798 1987 =B9+C9 =C9-B9 =E9/B9 Bedfordshire area 1789 1891 =B10+C10 =C10-B10 =E10/B10 Bristol area 1788 1821 =B11+C11 =C11-B11 =E11/B11 Lincolnshire 1722 1867 =B12+C12 =C12-B12 =E12/B12 Derby and Notts 1756 1777 =B13+C13 =C13-B13 =E13/B13 Berkshire 1654 1765 =B14+C14 =C14-B14 =E14/B14 Tyne and Wear 1657 1675 =B15+C15 =C15-B15 =E15/B15 Kent 1554 1775 =B16+C16 =C16-B16 =E16/B16 Manchester 1588 1651 =B17+C17 =C17-B17 =E17/B17 Leicestershire 1435 1450 =B18+C18 =C18-B18 =E18/B18 East Anglia 1334 1444 =B19+C19 =C19-B19 =E19/B19 Tees 1289 1432 =B20+C20 =C20-B20 =E20/B20 West Midlands 1265 1345 =B21+C21 =C21-B21 =E21/B21 Lancashire 1222 1345 =B22+C22 =C22-B22 =E22/B22 Devon 1244 1321 =B23+C23 =C23-B23 =E23/B23 Dorset area 1245 1300 =B24+C24 =C24-B24 =E24/B24 North Scotland 1253 1290 =B25+C25 =C25-B25 =E25/B25 Eastern Scotland 987 1211 =B26+C26 =C26-B26 =E26/B26 Cumbria 1009 1100 =B27+C27 =C27-B27 =E27/B27 Herts 996 1110 =B28+C28 =C28-B28 =E28/B28 Cheshire 987 1089 =B29+C29 =C29-B29 =E29/B29
Northern Ireland 998 1021 =B30+C30 =C30-B30 =E30/B30 Merseyside 874 997 =B31+C31 =C31-B31 =E31/B31 East Yorkshire 921 945 =B32+C32 =C32-B32 =E32/B32 Cornwall area 876 901 =B33+C33 =C33-B33 =E33/B33 East Wales 788 879 =B34+C34 =C34-B34 =E34/B34 Hampshire area 768 867 =B35+C35 =C35-B35 =E35/B35 West Wales 689 781 =B36+C36 =C36-B36 =E36/B36 Shropshire 679 788 =B37+C37 =C37-B37 =E37/B37 North Yorkshire 678 771 =B38+C38 =C38-B38 =E38/B38 South Yorkshire 549 689 =B39+C39 =C39-B39 =E39/B39 Highlands 567 595 =B40+C40 =C40-B40 =E40/B40
15 OCR Functional Skills Qualification in ICT at Level 2
Commentary on mark given Advice on how the candidate could improve
The candidate has clearly selected appropriate software to complete the task set as can be seen by the fact that they have calculated values and used formulas to do so. The candidate has planned the task to calculate the required % increase but, for some reason, has failed to sort or filter the data generated to find those regions that had a % increase less than 2% and include only those regions in their printout. The candidate has used a two step approach to find the appropriate result. This is acceptable. The candidate can break down the calculation to ensure they obtain an accurate result. The candidate has entered labels in an attempt to explain the values they have generated. While the "% Increase" label is meaningful the "Difference" label is meaningless to someone viewing the spreadsheet. It does not explain what this is the difference between. The labels that have been entered are spelt accurately. The candidate has been careful to format their results as percentage to 2 decimal places so that the data is meaningful. 13 out 19 marks awarded
The candidate should have checked the requirements of the task, i.e. to produce a list that showed only those regions that have had an increase of less than 2% and produced a list showing those regions only. The candidate should have evaluated the way they had labelled the values they had calculated to make sure that the labels clearly described the values.
c) Produce the newsletter for the sales department for March 2010. You must include in the
newsletter:
the text Ali has provided in a file the chart you have produced in Task 2a) the list you have produced in Task 2b) the map or diagram you found in Task 1a).
Ali has provided two newsletters produced by other departments for your information. These
are in your Resource Booklet.
Evidence you must provide A printout of the newsletter.
SALES DEPARTMENT NEWSLETTER – MARCH Top 5 Regions During January and February 2010 the sales department has been busy selling our products and we have been successful in securing a solid chunk of the market.
We would like to give special note to the 5 regions that have sold the most units this year so far. As can be seen from the chart their sales were good in January but are even better in February. Sales Target – 2% Increase
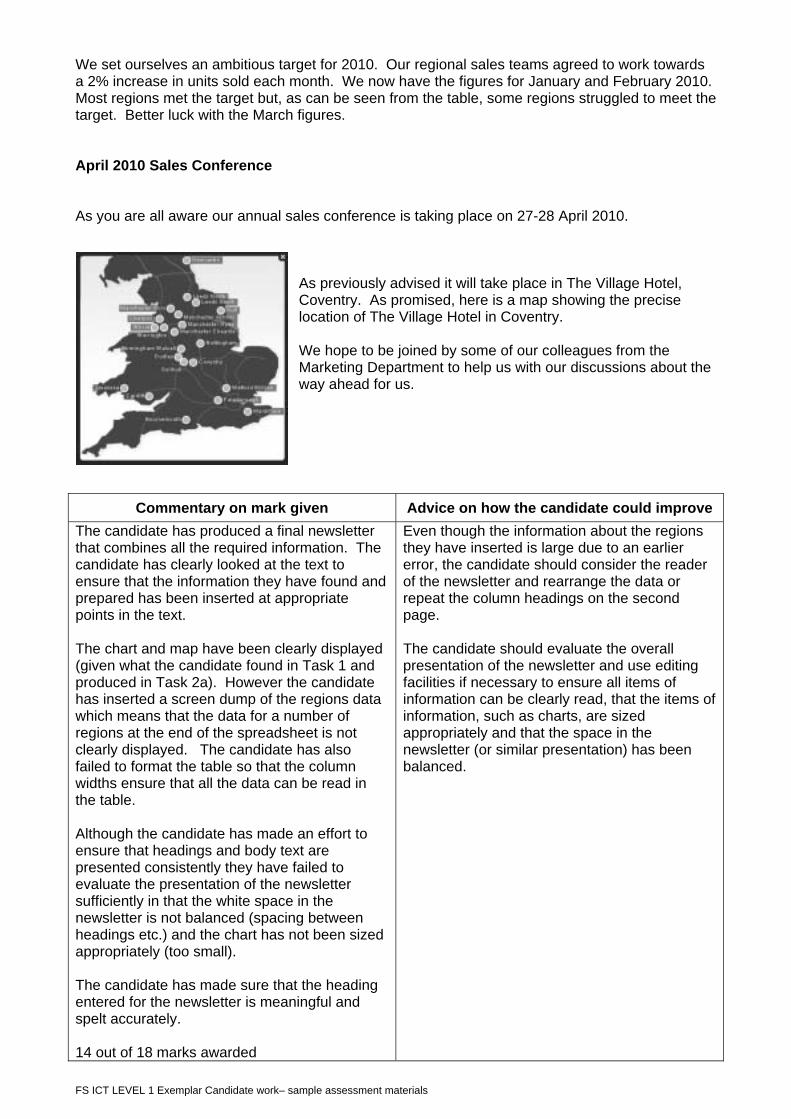
We set ourselves an ambitious target for 2010. Our regional sales teams agreed to work towards a 2% increase in units sold each month. We now have the figures for January and February 2010. Most regions met the target but, as can be seen from the table, some regions struggled to meet the target. Better luck with the March figures. April 2010 Sales Conference As you are all aware our annual sales conference is taking place on 27-28 April 2010.
As previously advised it will take place in The Village Hotel, Coventry. As promised, here is a map showing the precise location of The Village Hotel in Coventry. We hope to be joined by some of our colleagues from the Marketing Department to help us with our discussions about the way ahead for us.
Commentary on mark given Advice on how the candidate could improve
The candidate has produced a final newsletter that combines all the required information. The candidate has clearly looked at the text to ensure that the information they have found and prepared has been inserted at appropriate points in the text. The chart and map have been clearly displayed (given what the candidate found in Task 1 and produced in Task 2a). However the candidate has inserted a screen dump of the regions data which means that the data for a number of regions at the end of the spreadsheet is not clearly displayed. The candidate has also failed to format the table so that the column widths ensure that all the data can be read in the table. Although the candidate has made an effort to ensure that headings and body text are presented consistently they have failed to evaluate the presentation of the newsletter sufficiently in that the white space in the newsletter is not balanced (spacing between headings etc.) and the chart has not been sized appropriately (too small). The candidate has made sure that the heading entered for the newsletter is meaningful and spelt accurately. 14 out of 18 marks awarded
Even though the information about the regions they have inserted is large due to an earlier error, the candidate should consider the reader of the newsletter and rearrange the data or repeat the column headings on the second page. The candidate should evaluate the overall presentation of the newsletter and use editing facilities if necessary to ensure all items of information can be clearly read, that the items of information, such as charts, are sized appropriately and that the space in the newsletter (or similar presentation) has been balanced.
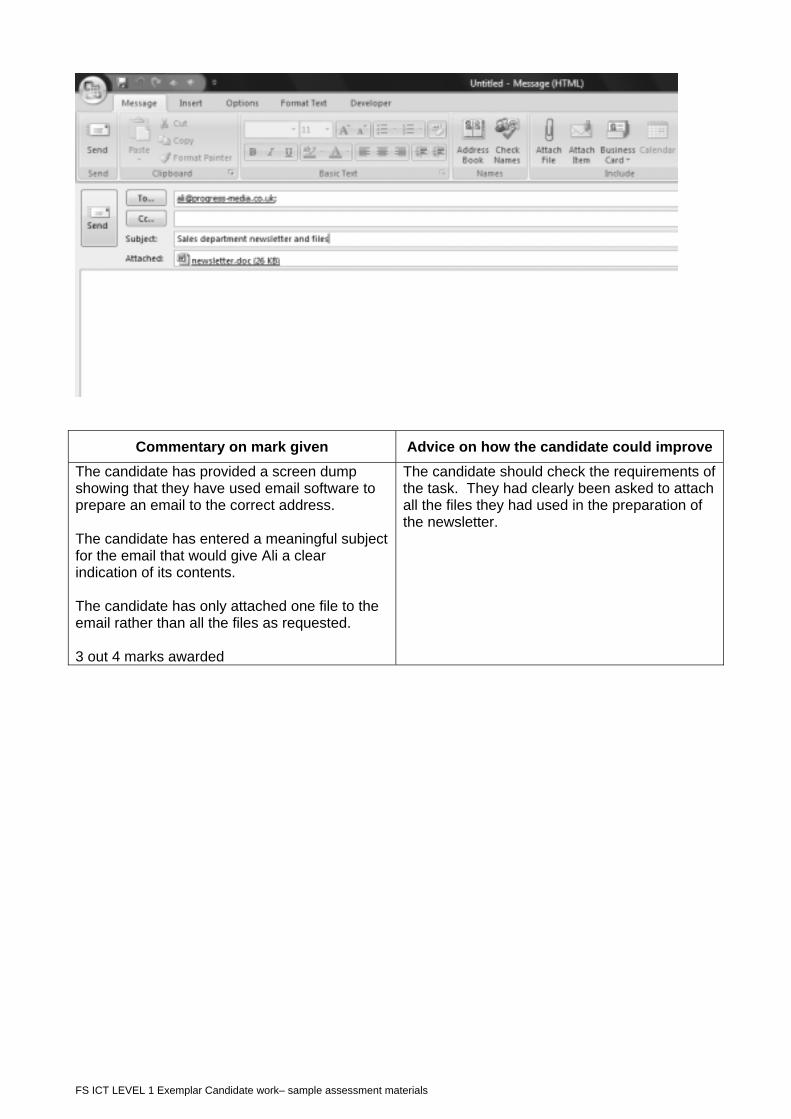
d) Prepare an email to Ali. He wants you to send him the newsletter and the files you used to
create it in case he needs to edit anything. Ali's email address is [email protected] (You just have to prepare the email. You do not have to send it).
Evidence you must provide Screen dump(s) showing the email you have prepared.
Commentary on mark given Advice on how the candidate could improve
The candidate has provided a screen dump showing that they have used email software to prepare an email to the correct address. The candidate has entered a meaningful subject for the email that would give Ali a clear indication of its contents. The candidate has only attached one file to the email rather than all the files as requested. 3 out 4 marks awarded
The candidate should check the requirements of the task. They had clearly been asked to attach all the files they had used in the preparation of the newsletter.
22
e) Organise the files you have used and those you have created so they can be found easily.
Evidence you must provide Screen dump(s) showing how you have organised all the files.
(5 marks)
23
Commentary on mark given Advice on how the candidate could improve
The candidate has provided a screen dump that shows that they have created a folder and named it with a meaningful folder name (i.e. one that summarises the contents of the folder). The candidate has put the required files into the folder. The candidate has demonstrated their ability to use a meaningful filename for the units sold file as it is saved in an appropriate format and the filename indicates that it contains an analysis of the data. The filename for the newsletter is also meaningful – but only taken in conjunction with the folder name. If this file had not been with a folder structure that made it clear that this was the March 2010 newsletter for the Sales Department then the filename "newsletter" would not be meaningful. 5 out of 5 marks awarded
This candidate has demonstrated their ability to use meaningful folder and file names. Many candidates however would consider that a folder called "Ali" and files named Task 1 and Task 2 etc would be meaningful. This is incorrect. File and folder names should indicate their contents within a real world context (i.e. not within an examination context).
24
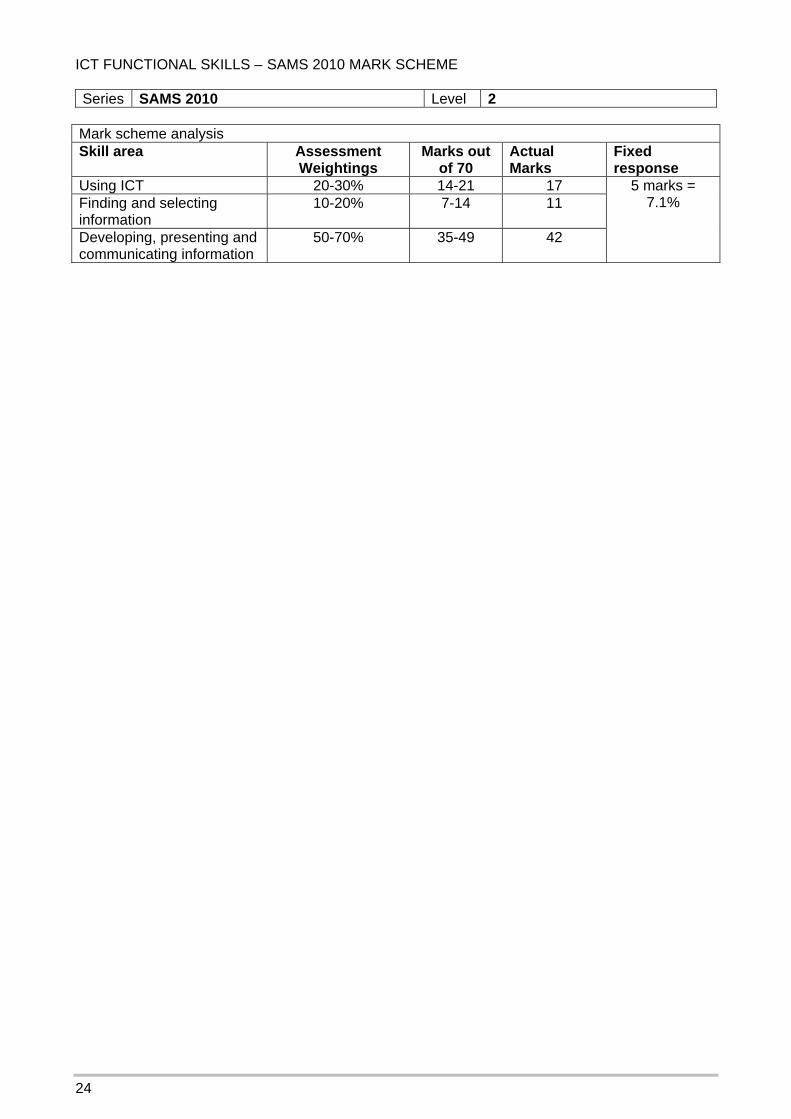
ICT FUNCTIONAL SKILLS – SAMS 2010 MARK SCHEME Series SAMS 2010 Level 2
Mark scheme analysis Skill area Assessment
Weightings Marks out
of 70 Actual Marks
Fixed response
Using ICT 20-30% 14-21 17 Finding and selecting information
10-20% 7-14 11
Developing, presenting and communicating information
50-70% 35-49 42
5 marks = 7.1%
OCR Functional Skills Qualification in ICT at Level 2
Notes to Examiners: Every printout must have a name on it.
Any printout without a name must be marked but an award of zero made. Follow through must be applied
Task Skill Standard
Coverage and Range
Mark Total
2.4 2.4.1 Evidence of search criteria used eg The Village Hotel AND Coventry Evidence of inappropriate search criteria eg hotels in Coventry – 2 marks only Evidence of URL provided – 1 mark only
31a
2.5 2.5.2 Map or diagram printed that shows precise location of The Village Hotel, Coventry Map or diagram printed that shows location The Village Hotel IN Coventry – 3 marks only Map or diagram printed that shows Coventry in context – 2 marks only Map or diagram printed that shows location of any hotel in Coventry – 1 mark only
4
1b 2.2 2.2.4 Eg - could import viruses that could cause loss of data or loss of functionality of computer system
FR 1
8
2.2 2.2.1 Appropriate software application selected - evidence provided of producing a chart
1
2.5 2.5.2 Correct data file (units sold 2010) has been selected from those provided
FR 1
2.1 2.1.1 Data charted is correct – Learner has broken down the multi-step task –carried out calculation correctly, sorted data correctly and then selected correct data to chart Data charted is incorrect – Learner has broken down the multi- step task –carried out calculation, sorted data and selected data for top 5 regions but has made an error at one of the steps – 2 marks only Data charted is incorrect – Learner has not carried out one of the steps eg calculation, sort or selection of top 5 regions – 1 mark only
3
2.7 2.7.2 Comparative bar chart used Comparative chart of any other type used – 2 marks only Attempt made to compare data sets seen eg 2 pie charts – 1 mark only
3
2.6 2.6.1 Chart title entered (1) Chart title meaningful for chart produced (1)
2
2.9 2.9.2 Chart title spelt accurately (1) 12.6 2.6.1 Units sold values can be read from the chart (1)
All required titles/labels/legend for the chart produced have been added (1)
2
2.6 2.6.1
2.10.1 2.10.1
All required titles/labels/legend are meaningful for the chart produced (1) Titles/labels do not obscure the chart data (1)
2
2a
2.9 2.9.2 All required titles/labels/legend are spelt accurately (1)
1
16
26
Task Skill Standard
Coverage and Range
Mark Total
2.2 2.2.1 Appropriate software application selected - Evidence provided of processing numbers (1) Use of formulas (1)
2
Table produced with correct % data and correct filter/sort – Learner has broken down the multi-step task – carried out correct calculations and filter/sort Table produced with % data and filter/sort applied – Learner has broken down the multi-step task – carried out calculations and filtered/sorted data with some error in the process – 2 marks only
2.1 2.1.1
Table produced with calculations or filtering/sorting applied – Learner has correctly identified some step in the process required –1 mark only
3
2.2 2.2.2 Evidence provided of changing settings to show formula
1
Effective formula(s) used to give correct results Effective formulas seen with 1 error in logic eg without parentheses – 3 marks only Effective formulas seen with 2 errors in logic eg without parentheses and incorrect cell referencing– 2 marks only Any evidence of any attempt at a formula used – 1 mark only
42.7 2.7.1
Evidence of the use of replication of formulas seen
1
2.10 2.10.1 Label(s) for any calculation(s) added in appropriate location (1) Label(s) are meaningful (1)
2
2.6 2.6.1 Numerical data is formatted appropriately eg indication of % (1) Numerical data formatted to appropriate decimal places, ie 1 or 2 dps (1)
2
2.9 2.9.2 Label(s) are accurate (1) 1
2b
2.4 2.4.1 Correct regions (<2%) selected – allow follow through based on calculations Selection of >2% – allow follow through based on calculations – 2 marks only Selection on any other identifiable criterion – 1 mark only
FR 3
19
OCR Functional Skills Qualification in ICT at Level 2
Task Skill Standard
Coverage and Range
Mark Total
2.2 2.2.1 Appropriate software application selection (combination of different types of information)
1
2.9.1 Text provided has been inserted (1) Chart inserted appropriately in relation Top 5 Regions text (1) Table inserted appropriately in relation to Sales Target text (1) Map inserted appropriately in relation to Sales Conference text (1) Chart, table and map inserted inside page margins (1)
52.9
Chart information is clearly displayed ie legends, titles etc. can be read clearly(1) Table information is clearly displayed ie all columns and row data can be read clearly (1) Table – information in columns is consistently aligned (1), Table - column widths are appropriate for data, that is, not too wide (1) Map or diagram is all clearly displayed (1) Text in newsletter has been split appropriately (1)
6
2.10 2.10.1 Candidate has evaluated the presentation of the newsletter, ie Headings are formatted consistently (1) Body text has been formatted consistently (1) White space on newsletter is balanced (1) Appropriate heading (eg Sales Department Newsletter) and March 2010 have been entered (1) Printout of map or diagram is sized/coloured appropriately to suit purpose (1)
5
2c
2.9 2.9.2 Heading and date entered accurately (1) 1
18
2.8 2.8.1 All newsletter files (eg spreadsheet, newsletter, image) attached to email Incomplete set of files attached to email – 2 marks only Evidence seen of preparing an email to Ali – 1 mark only
32d
2.8.1 Subject field is appropriate – eg Sales department newsletter, March 2010 newsletter
1
4
Task Skill Standard
Coverage and Range
Mark Total
2e 2.3 2.3.1 Evidence seen of folder(s) created (1) Evidence seen of folder(s) with appropriate folder name(s) (1) Files placed in appropriate folder(s) (1) Meaningful filenames for data processing task a) and b) used e.g. Units sold 2010 analysis (1) Meaningful filename for newsletter task d) used e.g. March 2010 newsletter (1)