Schola Europaea / Office of the Secretary-General ICT and Statistics Unit 1 / 35 Ref.: 2018-02-D-41-en-3 Orig.: FR ICT Report for 2017 Approved by the Board of Governors at its meeting of 17-19 April 2018 in Tallinn
Transcript
Schola Europaea / Office of the Secretary-General
ICT and Statistics Unit
1 / 35
Ref.: 2018-02-D-41-en-3 Orig.: FR
ICT Report for 2017 Approved by the Board of Governors at its meeting of 17-19 April 2018 in Tallinn
Schola Europaea / Office of the Secretary-General
ICT and Statistics Unit
2 / 35
2018-02-D-41-en-3
Contents
ICT Report for 2017 ..............................................................................................................1
Note of the Budgetary Committee .......................................................................................4
The year 2017 ........................................................................................................................5
1. ICT Strategy: ICT Governance Group .................................................................................. 5
2. School Management System (SMS) administrative application ........................................ 5
a. Management of school exchanges ...................................................................................... 5 b. School fees management .................................................................................................... 6
3. Statistics Platform – Business Intelligence ........................................................................ 6
4. The Central Enrolment Authority (CEA) for Brussels application ..................................... 6
7. Collaboration platform for administrative purposes .......................................................... 7
a. The OSGES’ administrative collaboration platform .............................................................. 7 b. The schools’ administrative collaboration platform .............................................................. 9
8. SAP: HEC and interfaces with banks .................................................................................. 9
9. Active Identity Management in the Active Directory (MIM project) ................................. 10
10. Operational IT system and IT infrastructure (‘System and Networks’ Sub-Unit) ........ 11
a. In general .......................................................................................................................... 11 b. From a more technical viewpoint ....................................................................................... 12
11. The ICT and Statistics Unit’s Service Desk ................................................................... 13
12. Microsoft Support Premier TIER 5 contract .................................................................. 14
13. Microsoft Office 365: TEAMS ......................................................................................... 17
14. IT purchases and contracts ............................................................................................ 18
From 2018 onwards ............................................................................................................ 18
1. ICT Strategy: ICT Governance Group ................................................................................ 18
2. Master Data management .................................................................................................. 20
3. School Management System (SMS) administrative application ...................................... 20
a. New marking scale ............................................................................................................ 20 b. Conformity with the GDPR ................................................................................................ 21
4. Statistics Platform – Business Intelligence ...................................................................... 21
Schola Europaea / Office of the Secretary-General
ICT and Statistics Unit
3 / 35
2018-02-D-41-en-3
5. Operational IT system and IT infrastructure (‘System and Networks’ Sub-Unit)............ 21
6. IT purchases and contracts ............................................................................................... 23
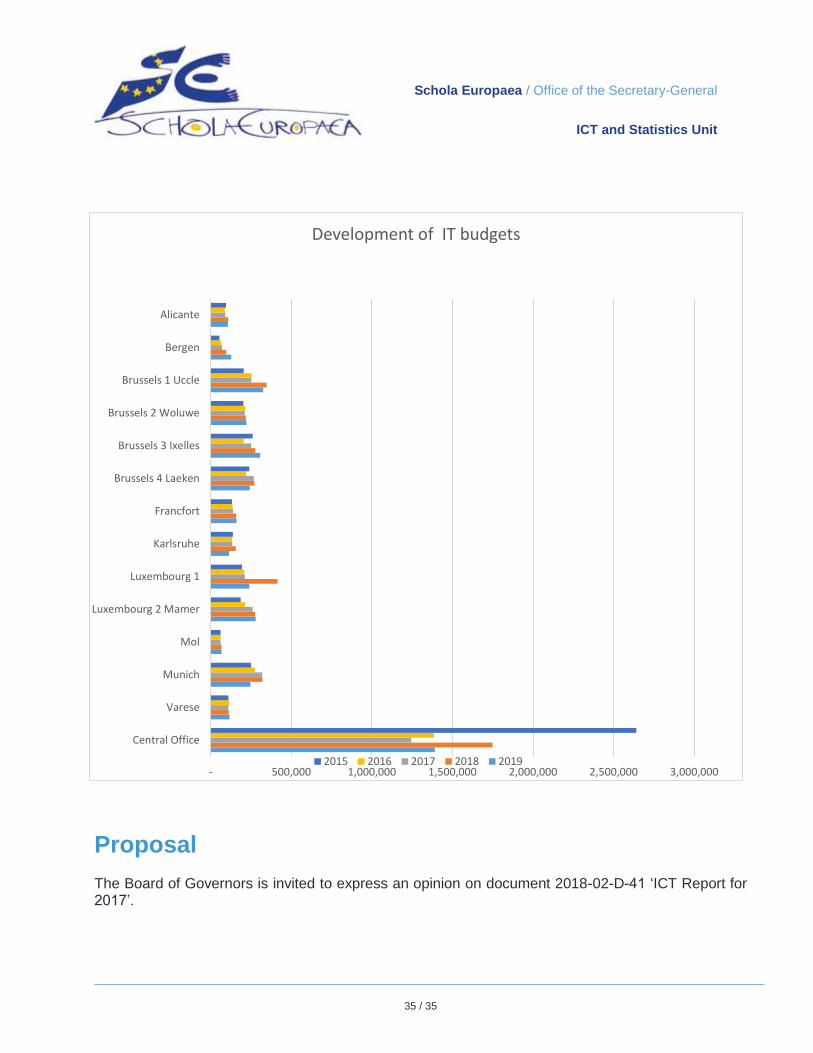
Situation of the OSGES’ ICT and Statistics unit .............................................................. 24
an overview of the significant events in the year 2017 as part of the information system (IS) of
the European Schools and its IT resources.
It also provides information about the current and future objectives.
This document is aimed at a very wide readership: heads of delegations, IT specialists, schools’
directors, bursars, colleagues, etc. Now IT is a very broad field, being a specialist area and highly
technical. In addition, there is the complexity of the European Schools’ IT infrastructure, plus its system
of operation, which is unique. This document has therefore been written, as far as possible, in
accessible language, avoiding technical terms and explanations.
This report has been produced solely by the OSGES’ ICT and Statistics Unit.
In the context of the mandate given by the Board of Governors at its December 2015 meeting, the
Pedagogical Development Unit also took charge of the organisation and follow-up on the IT-PEDA
WG, a subgroup of the IT Strategies WG, whose remit is to deal with all subjects with a pedagogical
purpose in the context of new technologies. During the year 2017, that subgroup conducted a survey
amongst 2 808 teachers in the system. The results of that survey and certain recommendations
resulting therefrom are set out in the Report of the IT-PEDA Subgroup (ref.: 2018-01-D-22).
Note of the Budgetary Committee
The Budgetary Committee took note of the report and invited the Board of Governors also to take note
of it.
Schola Europaea / Office of the Secretary-General
ICT and Statistics Unit
5 / 35
2018-02-D-41-en-3
The year 2017
1. ICT Strategy: ICT Governance Group The IT Strategy Group met on numerous occasions in 2017, consisting of:
meetings of the ADM Subgroup (chaired by the Head of the ICT Unit) for the administrative, financial and security aspects;
meetings of the PEDA Subgroup (chaired by the Head of the Pedagogical Development Unit) for all the pedagogical aspects;
joint meetings with the two Subgroups together (chaired by the Secretary-General), also for the pedagogical aspects.
A great deal of work was done to produce a proposed IT strategy for the European Schools for the coming years to be submitted to the Board of Governors. In the pedagogical area, it was very important to collect information on the European Schools’ current situation and to ascertain the teachers’ current and future needs in the context of the use of IT tools. To that end,
an online survey was conducted amongst all the system’s teachers;
a visit to the Laeken European School (school piloting the use of O365 but also their Bring Your Own Device project) was also made by the members of the IT Strategy Group (workshop).
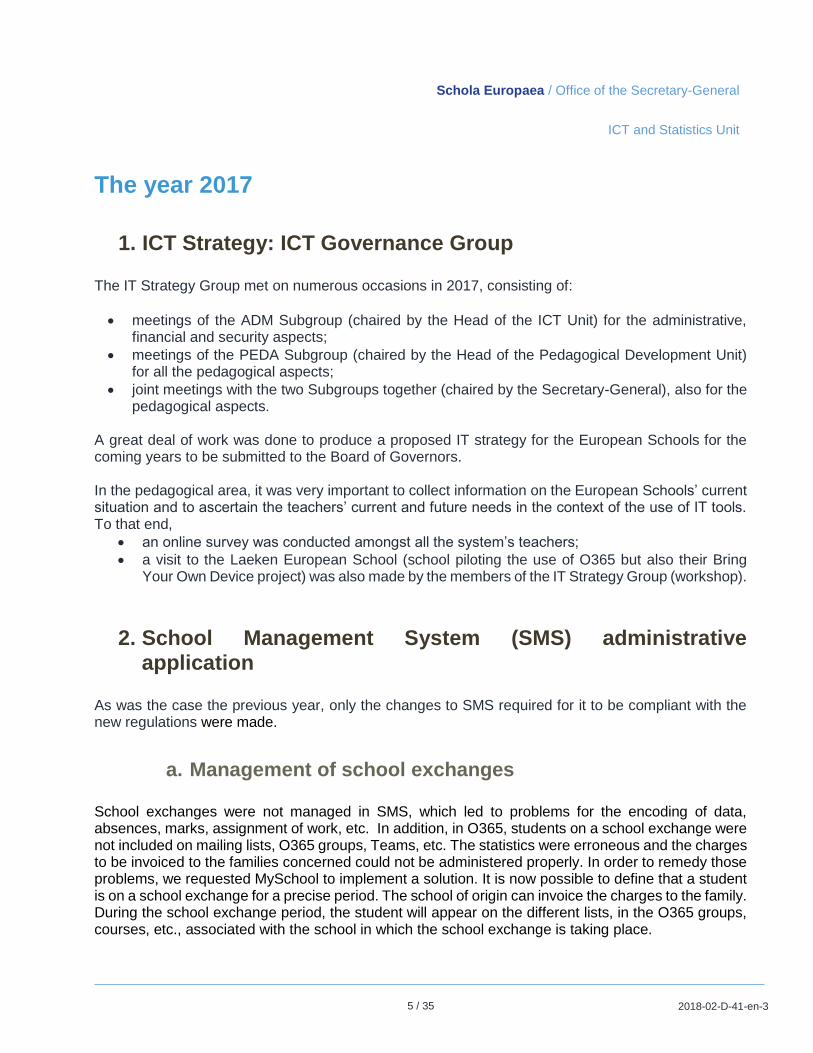
2. School Management System (SMS) administrative application
As was the case the previous year, only the changes to SMS required for it to be compliant with the new regulations were made.
a. Management of school exchanges School exchanges were not managed in SMS, which led to problems for the encoding of data, absences, marks, assignment of work, etc. In addition, in O365, students on a school exchange were not included on mailing lists, O365 groups, Teams, etc. The statistics were erroneous and the charges to be invoiced to the families concerned could not be administered properly. In order to remedy those problems, we requested MySchool to implement a solution. It is now possible to define that a student is on a school exchange for a precise period. The school of origin can invoice the charges to the family. During the school exchange period, the student will appear on the different lists, in the O365 groups, courses, etc., associated with the school in which the school exchange is taking place.
Schola Europaea / Office of the Secretary-General
ICT and Statistics Unit
6 / 35
2018-02-D-41-en-3
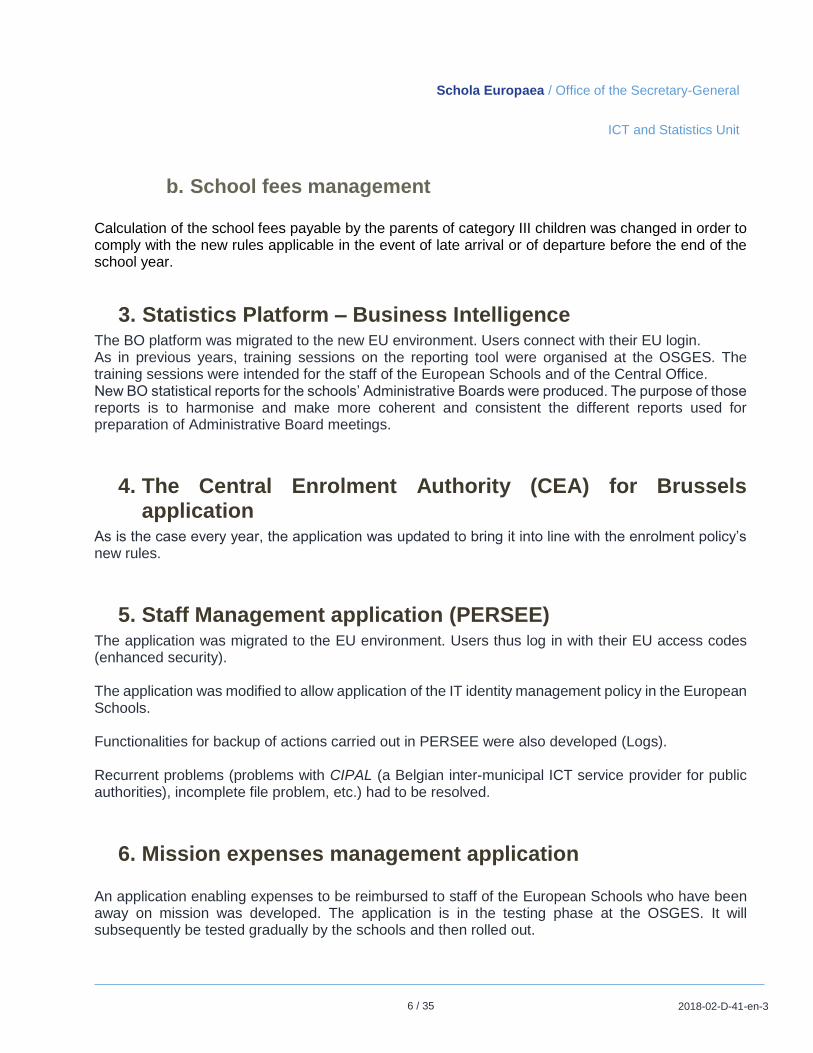
b. School fees management Calculation of the school fees payable by the parents of category III children was changed in order to comply with the new rules applicable in the event of late arrival or of departure before the end of the school year.
3. Statistics Platform – Business Intelligence The BO platform was migrated to the new EU environment. Users connect with their EU login. As in previous years, training sessions on the reporting tool were organised at the OSGES. The training sessions were intended for the staff of the European Schools and of the Central Office. New BO statistical reports for the schools’ Administrative Boards were produced. The purpose of those reports is to harmonise and make more coherent and consistent the different reports used for preparation of Administrative Board meetings.
4. The Central Enrolment Authority (CEA) for Brussels application
As is the case every year, the application was updated to bring it into line with the enrolment policy’s new rules.
5. Staff Management application (PERSEE) The application was migrated to the EU environment. Users thus log in with their EU access codes (enhanced security). The application was modified to allow application of the IT identity management policy in the European Schools. Functionalities for backup of actions carried out in PERSEE were also developed (Logs). Recurrent problems (problems with CIPAL (a Belgian inter-municipal ICT service provider for public authorities), incomplete file problem, etc.) had to be resolved.
6. Mission expenses management application An application enabling expenses to be reimbursed to staff of the European Schools who have been away on mission was developed. The application is in the testing phase at the OSGES. It will subsequently be tested gradually by the schools and then rolled out.
Schola Europaea / Office of the Secretary-General
ICT and Statistics Unit
7 / 35
2018-02-D-41-en-3
This application has the advantage of complying with the rules in force – naturally – but also of keeping a record of all the data on a mission and the consent given by the chain of command and the authorising officer.
7. Collaboration platform for administrative purposes In order to facilitate collaboration between the different members of the staff of the schools and of the OSGES, different SharePoint sites are being set up, their status being as follows:
a. The OSGES’ administrative collaboration platform
Baccalaureate Two SharePoint sites have been created for their requirements. The first is a site available internally, on which all the Baccalaureate written examinations set and taken in previous years, and model answers, can be found. Different reference data (metadata) are
Schola Europaea / Office of the Secretary-General
ICT and Statistics Unit
8 / 35
2018-02-D-41-en-3
associated with each document deposited. Those data subsequently enable filters to be created, making it easier to find the documents sought. The second is a secure site, which enables there to be collaboration with the OSGES, the schools, and the different people involved in setting the question papers for the Bac examinations. This secure site is composed of different libraries. The schools (ES and AES) deposit their proposals for questions by subject/language. Each school has access solely to its own dedicated library and is not, therefore, able to access the other schools’ libraries. Whenever the schools input the documents and associate with them all the attached metadata required, a workflow process is performed. This workflow process copies the documents in a working library. These libraries are divided up by subject/language. The work spaces are accessible solely to the Inspectors/Experts associated with the subject. When the Bac questions are finalised, the documents are copied into the ‘Ready for Printing’ library, to be validated. That part still has to be developed. A link enables access to be gained to the public site from the secure site.
Procurement Network This site was the first SharePoint site rolled out. The site was designed and developed in conjunction with a Microsoft SharePoint expert.
Tax Sub-Unit This site is divided into different libraries. Public libraries which will the schools will be able to access. Internal libraries will serve as a work space for the Tax Sub-Unit. In order to be able to establish the differential adjustment, the Tax Sub-Unit needs specific documents. These documents, which will be managed on the schools’ SharePoint site and then via an approval workflow, will be available to the Tax Sub-Unit. When calculation of the adjustment has been completed, via a workflow approval, the document containing the final calculation is sent to the school for acquiescence and then forwarded to the person whom the calculation concerns.
ICT As for the Tax Sub-Unit site, this SharePoint site comprises public libraries which will be accessible to the schools and work libraries which will be internal to the different sub-units forming part of the ICT Unit.
Schola Europaea / Office of the Secretary-General
ICT and Statistics Unit
9 / 35
2018-02-D-41-en-3
The procedures and guides will be found in the public libraries. These procedures and guides will be written in predefined templates. These templates include the different metadata associated with the libraries. Before being published in the public libraries, the documents must be approved by different people. This approval process is managed by a workflow. This site is under development.
Security and Safety The person responsible for this sub-unit took direct charge of this site and it is under development.
Internal Control Capability This site is in the development phase.
b. The schools’ administrative collaboration platform
Each school will have a SharePoint site available to it for the administrative part and another SharePoint site for the administrative part. The site diagram for the administrative part will be common to all the schools. The site for the pedagogical part will be managed by the school itself. A first school (Varese) has agreed to pilot this project. As for the other SharePoint sites, some libraries are public, i.e. the schools can access them. Others are secure and have limited access. All the documents used for Administrative Board meetings are made available to participants via this SharePoint site.
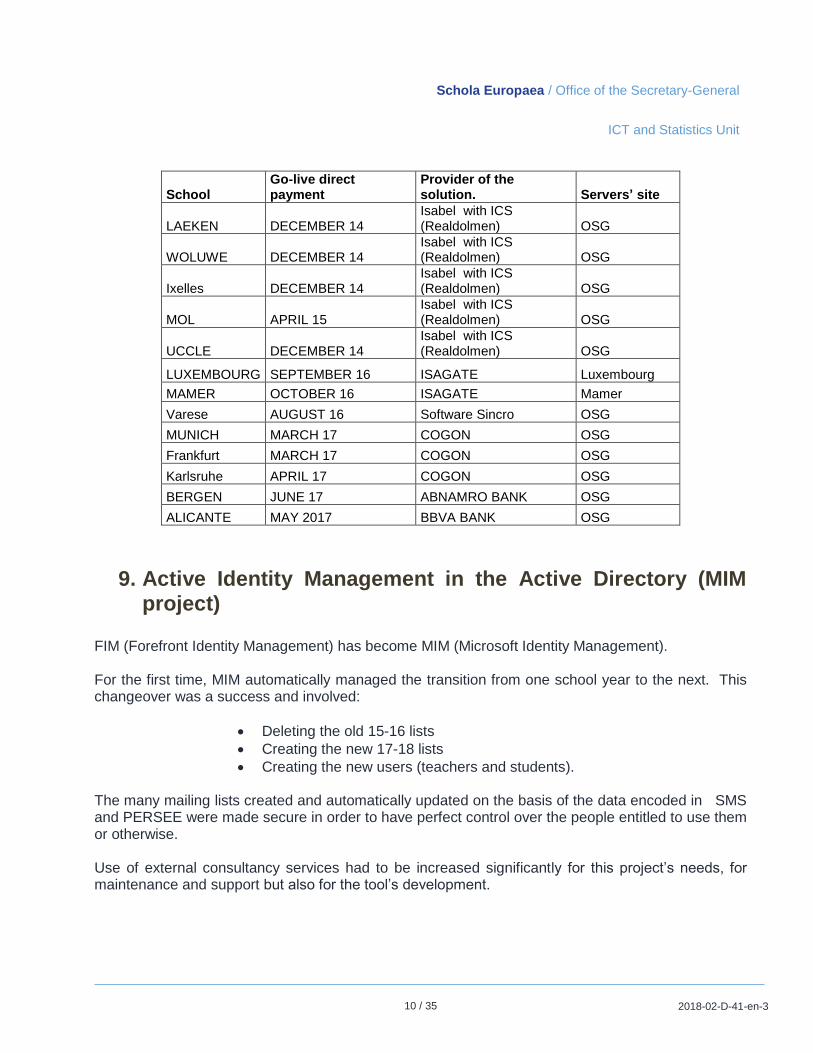
8. SAP: HEC and interfaces with banks Since May 2017, all the different payment applications used by the schools have been securely connected with the SAP ERP package:
All payment files generated by SAP are automatically transferred to the school’s payment system, with no possibility of their being intercepted, read and/or modified.
All bank statement files are also transferred direct to the SAP server, with no possibility of their being intercepted, read and/or modified.
Schola Europaea / Office of the Secretary-General
ICT and Statistics Unit
10 / 35
2018-02-D-41-en-3
School Go-live direct payment
Provider of the solution. Servers’ site
LAEKEN DECEMBER 14 Isabel with ICS (Realdolmen) OSG
WOLUWE DECEMBER 14 Isabel with ICS (Realdolmen) OSG
Ixelles DECEMBER 14 Isabel with ICS (Realdolmen) OSG
MOL APRIL 15 Isabel with ICS (Realdolmen) OSG
UCCLE DECEMBER 14 Isabel with ICS (Realdolmen) OSG
LUXEMBOURG SEPTEMBER 16 ISAGATE Luxembourg
MAMER OCTOBER 16 ISAGATE Mamer
Varese AUGUST 16 Software Sincro OSG
MUNICH MARCH 17 COGON OSG
Frankfurt MARCH 17 COGON OSG
Karlsruhe APRIL 17 COGON OSG
BERGEN JUNE 17 ABNAMRO BANK OSG
ALICANTE MAY 2017 BBVA BANK OSG
9. Active Identity Management in the Active Directory (MIM project)
FIM (Forefront Identity Management) has become MIM (Microsoft Identity Management). For the first time, MIM automatically managed the transition from one school year to the next. This changeover was a success and involved:
Deleting the old 15-16 lists
Creating the new 17-18 lists
Creating the new users (teachers and students). The many mailing lists created and automatically updated on the basis of the data encoded in SMS and PERSEE were made secure in order to have perfect control over the people entitled to use them or otherwise. Use of external consultancy services had to be increased significantly for this project’s needs, for maintenance and support but also for the tool’s development.
Schola Europaea / Office of the Secretary-General
ICT and Statistics Unit
11 / 35
2018-02-D-41-en-3
10. Operational IT system and IT infrastructure (‘System and Networks’ Sub-Unit)
a. In general In 2017, the ‘System’ Sub-Unit was faced with the harsh reality of the market and the workload which management of the environment recently put in place demands. The ‘System’ Sub-Unit, which normally comprises three people, has not managed to reach its full staff complement for more than two years. Despite publication of the posts and downgrading of the technical expectations, the ICT Unit is unable to recruit high-quality and qualified multi-skilled ICT staff. Throughout the year, two people at best had to manage the entire system and network. The warning about the critical situation announced in 2016, relating that for the European Schools’ proper operation, the services must now be available 24/7, was not heeded. The fact that the ‘System’ Sub-Unit engineers frequently have to intervene outside working hours, including when they are on leave/abroad, did not change, with direct consequences for the team and the organisation. In July 2017, the network engineer decided to leave the organisation and it has not proved possible for him to be replaced to date. Yet it is not for lack of trying (Publication, Temporary Staff, LinkedIn, companies specialising in recruitment, etc.) and when a potential good candidate is found, he or she refuses the offer as it is not deemed sufficiently attractive. Concretely, there is only one person left with a global vision of what has been put in place and who is sufficiently multi-skilled to act at all levels as required. There is quite a high risk that this person will leave as there is no longer any means of retaining specialist resources within the European Schools. Consequently, in 2017, the ‘System’ Sub-Unit focused mainly on maintenance of the services already in place and responded reactively to all the emergency situations with which it was faced. It was not possible for any significant advance to be made with respect to withdrawal of the old servers hosting ADM EURSC.ORG, LEARNING GATEWAY, LG.ADM.ORG and DOCEE. The same finding applies to introduction of the new EURSC.EU domain in the European Schools. This project is struggling to become established and the schools are making their impatience felt with the Central Office, which cannot manage to meet demand. No progress could be made with the second Data Centre to accommodate the extension of services already in place in the first Data Centre. However, two Disaster Recovery Plans were devised and tested. The first involved the Exchange 2013 environment, a messaging system for the administrative network, which went very well. The second is Active Directory Scholae for the pedagogical network, which was unsuccessful. Shortage of time and resources meant that a second attempt could not be organised. Thanks to Microsoft consultancy, a test environment was created for the European Schools’ website www.eursc.eu. No project connected with the network was followed up. In 2017, several of the European Schools’ website were victims of a ransom ware attack (malicious software taking data hostage), which encrypted EURSC.ORG file servers that had not yet migrated to EURSC.EU. The impact on resources (human and material) was fairly significant and it took several days for the situation to be restored to normal. As presented in 2016, the projects and tasks managed by the ‘System’ Sub-Unit is fairly impressive (see below ‘From a more technical viewpoint’). With the current resources, the ‘System’ Sub-Unit can just about manage to respond to emergencies. In fact, broadly speaking, it is still unable to:
Proactively monitor the services (and detect intrusions, attacks, etc.)
Respond within an appropriate time period
Move forward with the migration process
Handle backup and restoration
Carry out tests in the development environment
Test the Disaster Recovery Plan
Attend training sessions
Communicate with the schools
b. From a more technical viewpoint The ICT infrastructure includes computer (fixed and wireless) and telephony networks (universal wiring and optical fibre links), mobile telephony, network operation services (DNS, DHCP, NTP, IP routing, etc.), the servers, the data storage system (including backups), virtualisation, access management aspects, operational security, the computer hardware, the installed software base and basic ICT services. The EURSC.EU domain, based on Active Directory (Windows Server 2012 R2), successfully passed RAP (Risk and Health Assessment Program) testing. RAP is a method of evaluation of the remote environment. The data collected are encrypted then transmitted to Microsoft’s RAP servers in order to be analysed and safely stored. This allows the results of the analysis to be consulted securely online through the Microsoft portal and at any time. A certified Microsoft engineer analysed the results and made recommendations and provided a knowledge transfer. The remedial plan did not reveal any critical deficiency. The Active Directory is kept up-to-date and meets the common requirements of the European Schools and Microsoft so that it can receive adequate support if needed. This remains one of the European Schools’ imperatives. A SQL RAP was also carried out and the results were fairly positive. Otherwise, the situation is somewhat similar to 2016. Migration to Exchange 2013 was completed but the old EURSC.ORG server is still active and necessary as two applications (Learning Gateway and DOCEE) do not allow the old environment to be shut down permanently. The SQL 2012 servers were not extended to the second Data Centre because they have to be completely upgraded and migrated to SQL 2016. The member of staff who was in charge of this job unfortunately left the Central Office and it was not possible for a replacement to be found. The new operating system Windows 10 with End Point Protection (Antivirus) is being deployed at the Central Office and in two schools (Woluwé and Luxembourg) via the Configuration Manager server. In each European School, the ‘System’ Sub-Unit is experiencing difficulty in progressing on the new domain’s extension project because of lack of resources. Consequently, the DPs (Distribution Points) that were supposed to ensure harmonisation of the ICT hardware could only be deployed on two sites. The DFS (Data Files Servers), which are ready to accommodate the new file structure, have not been used yet, again because of lack of resources. They would have been capable of avoiding the ransom ware attack.
Schola Europaea / Office of the Secretary-General
ICT and Statistics Unit
13 / 35
2018-02-D-41-en-3
The identity management platform was updated from FIM (end of life) to MIM. This tool allows there to be provisioning of the entire Active Directory SCHOLAE.EU, which covers all the students and teachers. The Business Objects platform was migrated from EURSC.ORG to EURSC.EU, which is more secure. It provides greater security and it is now mandatory to use European login credentials ([email protected]). The new servers are more robust and can handle a larger workload. In addition, the new version corrected several bugs in the previous versions. All the current BO reports can be used with the new servers. The Extranet was redeployed in order to offer end users a web platform to register for training sessions organised by the Central Office, using their EURSC.EU access codes. The second OMS (Operations Management Suite) monitoring platform which was deployed on the Cloud in conjunction with SCOM On-Premises (System Center Operations Management) was not followed up. Yet OMS is a very [...] IT management solution based on the Microsoft Cloud that allows the On-Premises and Cloud Structure infrastructure to be managed and protected. OMS and SCOM work together to offer a complete hybrid management experience. But lack of resources does not allow these tools to be used proactively, i.e. to avoid and detect system failures or cyber-attacks. It was not possible for the security and communication platform to be strengthened. The objective was to move the VPN tunnels from Policy-Based to Route-Based. No hardware or software was upgraded. Preparation of the changeover from IPv4 to IPv6 did not evolve. It was not possible for migration from OSPF to OSPF v3 to take place either. As explained, at network level, there was no follow-up on any project.
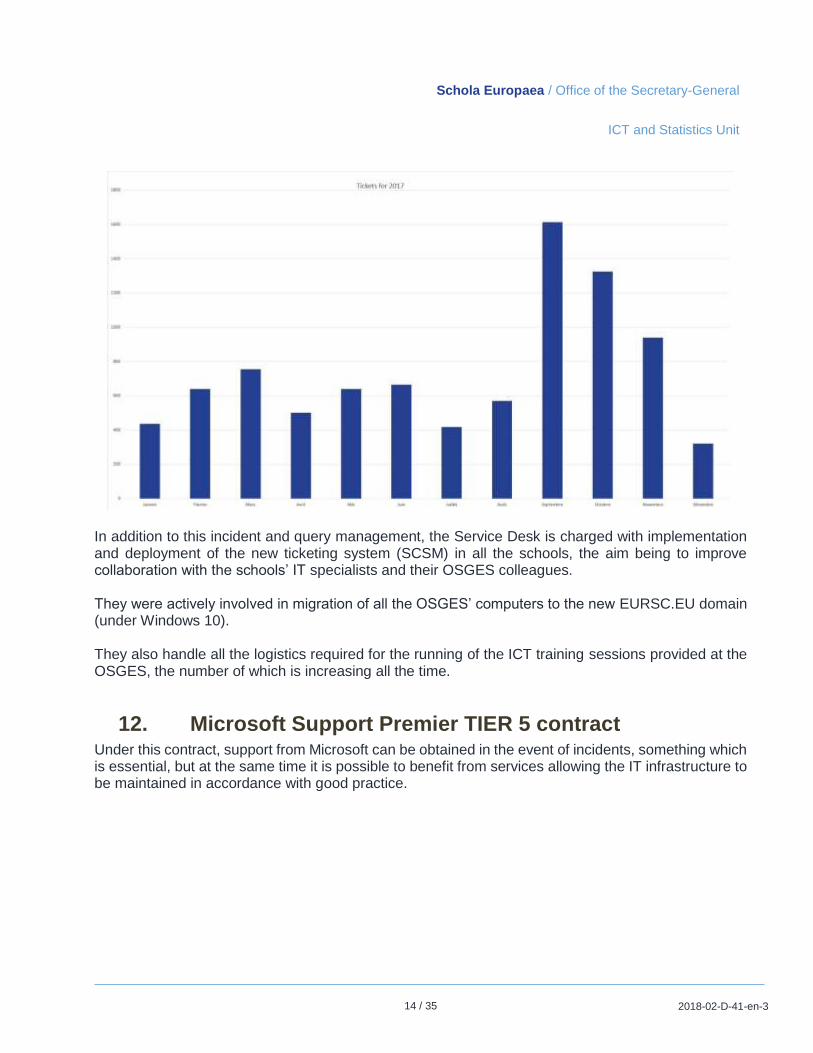
11. The ICT and Statistics Unit’s Service Desk The ICT Service Desk fielded a very large number of requests throughout the year 2017. Almost 9000 tickets were sent by the schools’ IT specialists, the members of the staff of the OSGES, the Inspectors and the Heads of delegation:
In addition to this incident and query management, the Service Desk is charged with implementation and deployment of the new ticketing system (SCSM) in all the schools, the aim being to improve collaboration with the schools’ IT specialists and their OSGES colleagues. They were actively involved in migration of all the OSGES’ computers to the new EURSC.EU domain (under Windows 10). They also handle all the logistics required for the running of the ICT training sessions provided at the OSGES, the number of which is increasing all the time.
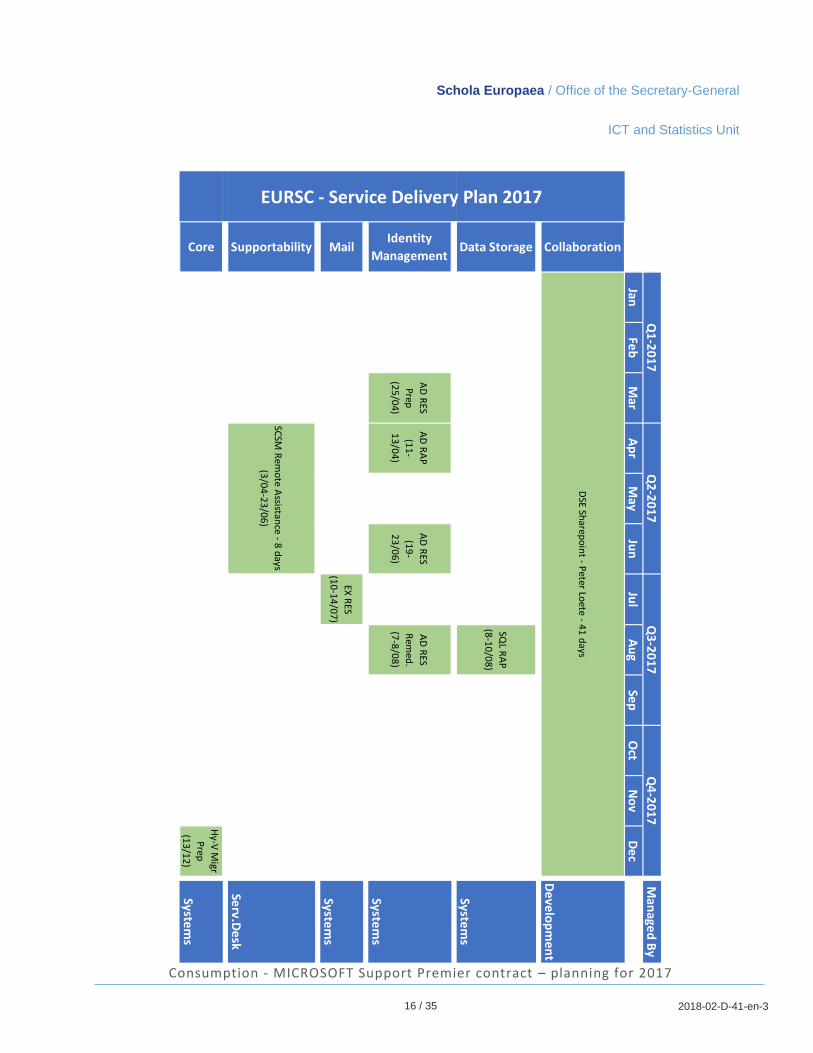
12. Microsoft Support Premier TIER 5 contract Under this contract, support from Microsoft can be obtained in the event of incidents, something which is essential, but at the same time it is possible to benefit from services allowing the IT infrastructure to be maintained in accordance with good practice.
Schola Europaea / Office of the Secretary-General
ICT and Statistics Unit
15 / 35
2018-02-D-41-en-3
Strengths and weaknesses of the European Schools according to Microsoft
Consumption of Microsoft Support Premier TIER 5 contract
Schola Europaea / Office of the Secretary-General
ICT and Statistics Unit
16 / 35
2018-02-D-41-en-3
Consumption - MICROSOFT Support Premier contract – planning for 2017
Man
aged
By
JanFe
bM
arA
pr
May
Jun
Jul
Au
gSe
pO
ctN
ov
De
c
Collaboration
De
velo
pm
en
t
Data Storage
SQL R
AP
(8-1
0/0
8)
System
s
Identity
Management
AD
RES
Prep
(25
/04
)
AD
RA
P
(11
-
13
/04
)
AD
RES
(19
-
23
/06
)
AD
RES
Rem
ed.
(7-8
/08
)
System
s
Mail
EX R
ES
(10
-14
/07
)Syste
ms
Supportability
Serv.D
esk
Core
Hy-V
Migr
Prep
(13
/12
)Syste
ms
DSE Sh
arepo
int - P
eter Loete - 4
1 d
ays
EURSC - Service Delivery Plan 2017
Q1
-20
17
Q2
-20
17
Q3
-20
17
Q4
-20
17
SCSM
Rem
ote A
ssistance - 8
days
(3/0
4-2
3/0
6)
Schola Europaea / Office of the Secretary-General
ICT and Statistics Unit
17 / 35
2018-02-D-41-en-3
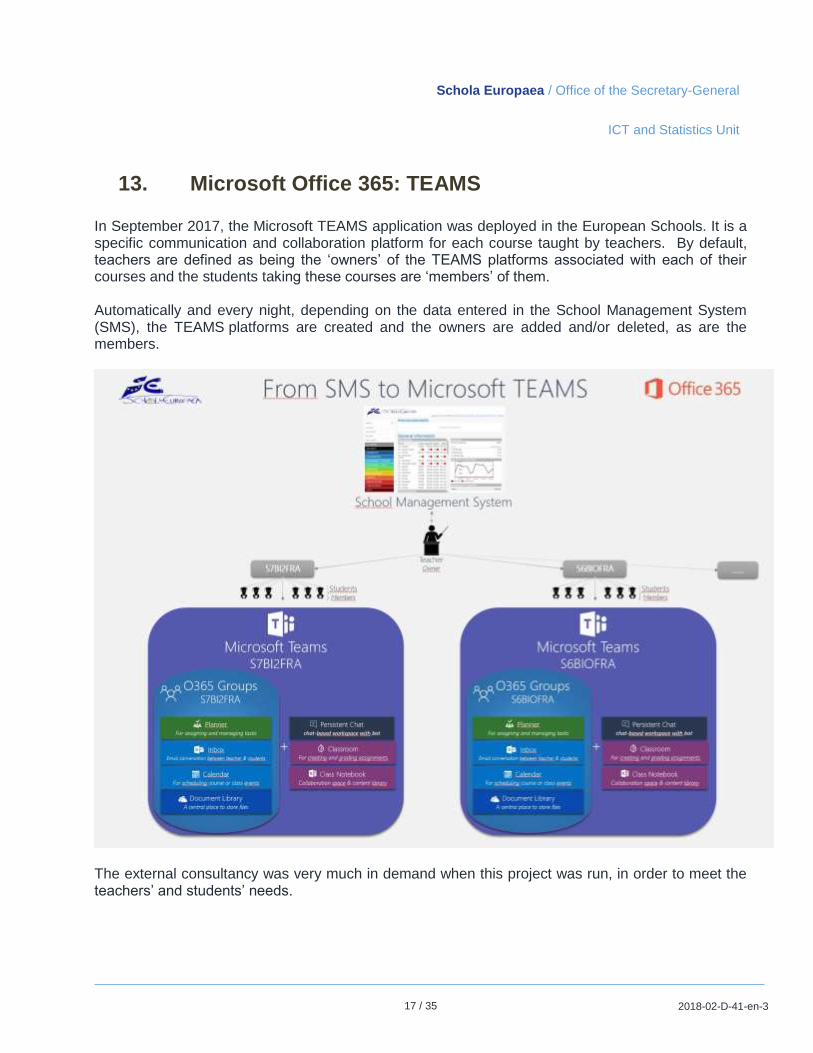
13. Microsoft Office 365: TEAMS In September 2017, the Microsoft TEAMS application was deployed in the European Schools. It is a specific communication and collaboration platform for each course taught by teachers. By default, teachers are defined as being the ‘owners’ of the TEAMS platforms associated with each of their courses and the students taking these courses are ‘members’ of them. Automatically and every night, depending on the data entered in the School Management System (SMS), the TEAMS platforms are created and the owners are added and/or deleted, as are the members.
The external consultancy was very much in demand when this project was run, in order to meet the teachers’ and students’ needs.
Schola Europaea / Office of the Secretary-General
ICT and Statistics Unit
18 / 35
2018-02-D-41-en-3
14. IT purchases and contracts The framework contracts offered by the European Commission (mainly DIGIT) are used as far as possible. In 2017, the framework contracts which were renewed or which started were:
SAP
NATACHA III Lot 1 Acquisition channel for networking, telecom and videoconferencing equipment, as well as the provision of relevant maintenance and other associated services
NATACHA III Lot 2 Complex or other than complex hardware
MTS III Mobile Telephony Communications services// Proximus Lot 1 Mobile Telephony Communications services
MTS III Mobile Telephony Communications services// Proximus Lot 2 SMS Gateway infrastructure and services
TRAINUSER III ICT Training for End Users
OAPM Lot 1 ONEPOINT SA - Provision of training sessions and workshops for IT staff in the domains of MOC sessions (Microsoft Technical Courses)
OAPM Lot 2 CAPGEMINI Educational Services BV
From 2018 onwards
1. ICT Strategy: ICT Governance Group The European Schools’ IT Strategy is coming into being at both the pedagogical and the administrative level. The very good collaboration between the two IT Strategy Subgroups (IT-PEDA and IT-ADM) ought to be instrumental in bringing about sound development of digital competence in the European Schools. For the IT-ADM Strategy Subgroup, since it was not possible for this to be done in 2017, a risk register needs to be produced and regularly updated. An action plan to respond to those risks must also be established.
Schola Europaea / Office of the Secretary-General
ICT and Statistics Unit
19 / 35
2018-02-D-41-en-3
Schola Europaea / Office of the Secretary-General
ICT and Statistics Unit
20 / 35
2018-02-D-41-en-3
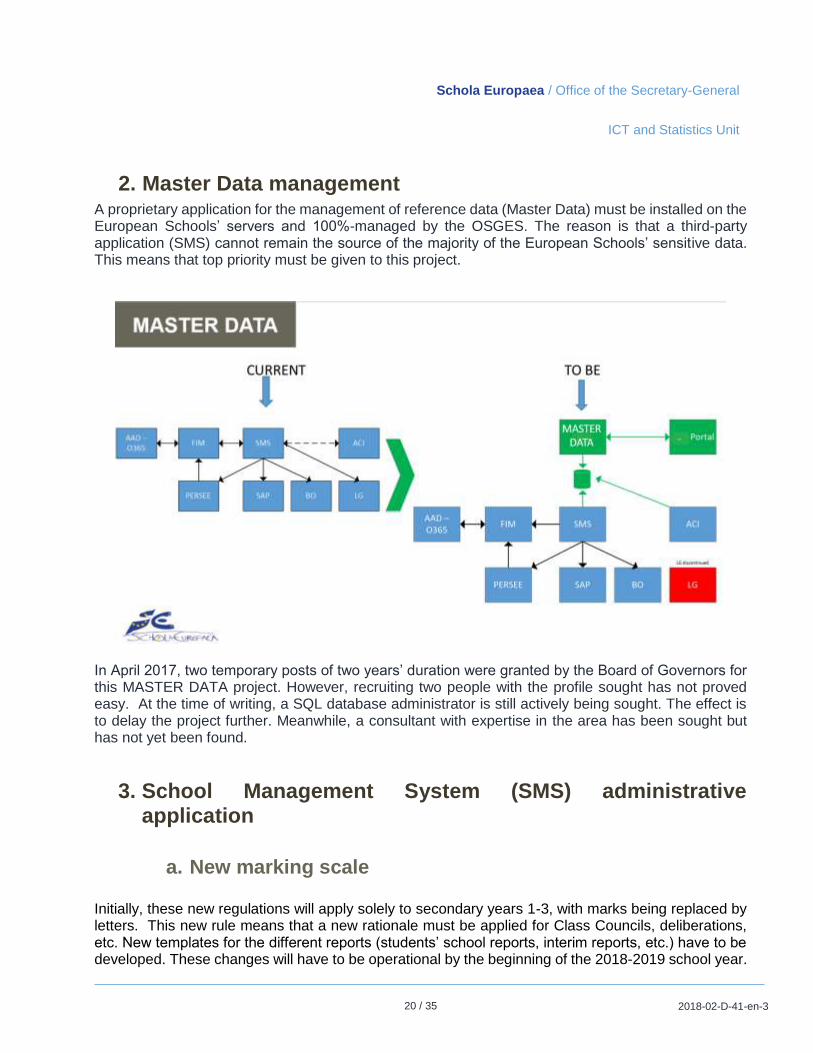
2. Master Data management A proprietary application for the management of reference data (Master Data) must be installed on the European Schools’ servers and 100%-managed by the OSGES. The reason is that a third-party application (SMS) cannot remain the source of the majority of the European Schools’ sensitive data. This means that top priority must be given to this project.
In April 2017, two temporary posts of two years’ duration were granted by the Board of Governors for this MASTER DATA project. However, recruiting two people with the profile sought has not proved easy. At the time of writing, a SQL database administrator is still actively being sought. The effect is to delay the project further. Meanwhile, a consultant with expertise in the area has been sought but has not yet been found.
3. School Management System (SMS) administrative application
a. New marking scale Initially, these new regulations will apply solely to secondary years 1-3, with marks being replaced by letters. This new rule means that a new rationale must be applied for Class Councils, deliberations, etc. New templates for the different reports (students’ school reports, interim reports, etc.) have to be developed. These changes will have to be operational by the beginning of the 2018-2019 school year.
Schola Europaea / Office of the Secretary-General
ICT and Statistics Unit
21 / 35
2018-02-D-41-en-3
b. Conformity with the GDPR In collaboration with the Data Protection Officer (DPO), the conformity of the School Management System (SMS) software with the new law on personal data protection will be evaluated and any changes will be requested of the company which owns the software. It has, however, announced that it has taken steps to ensure this conformity as from May 2018.
4. Statistics Platform – Business Intelligence The statistics platform will be maintained as it stands despite the fact that improvements are desirable for performance and security reasons. Training sessions in use of the SAP Business Objects tool will be offered to its Key Users as is the case each year.
5. Operational IT system and IT infrastructure (‘System and Networks’ Sub-Unit)
The year 2018 started with a huge project involving migration of the SAP infrastructure to deployment on Microsoft Azure. The three environments (Production, Quality and Development) will be implemented. This major step forward increases the prospect of extension of the Data Centre to Cloud Azure. The deadline has been set at 18 May 2018. This migration will allow costs to be reduced and better support to be obtained, resulting from a call for tenders procedure better meeting the Central Office’s expectations. Upgrading of the Data Centre is behind schedule and the old servers now urgently need to be replaced as they are no longer covered by a maintenance contract and are unstable. In early April, a Microsoft RAP (Risk and Health Assessment Program) of the new Hyper-V environment will be carried out jointly with Microsoft, to ensure that what will be put in place is supported and meets the standard in force. Introduction of the new Hyper-V environment. The two EURSC.EU domain controllers will also have to be installed on two new servers and updated to Windows Server 2016. The two domain controllers located in the second Data Centre will have to be updated to Windows Server 2016. Once the operation has been completed, a Microsoft RAP will be planned for 2019. The backup server is a critical point in the environment as it too operates on hardware which has no longer been covered by a maintenance contract for two years. A new server will therefore accommodate System Center Data Protection Manager (SCDPM). This intervention represents quite a sizeable challenge, given the complexity of the multiple storage areas to be taken into consideration and, de facto, all the interconnected servers. On the same basis as SCDPM, System Center Virtual Machine Manager (SCVMM) will be installed on a new server. This application enables management of the hundred or so virtual servers to be centralised. It is already being used but operates on hardware which has no longer been covered by a maintenance contract for two years. Today, the Exchange 2013 servers, which are the messaging servers for the administrative part, no longer have sufficient disk space. In addition, despite the Internal Audit Service’s recommendations, this critical service has not yet been deployed on the two Data Centres. In April and June, thanks to the Premier contract with Microsoft, the first two phases of the introduction of Exchange 2016 will start.
Schola Europaea / Office of the Secretary-General
ICT and Statistics Unit
22 / 35
2018-02-D-41-en-3
This project will replace SQL RES (deferred until 2019) as it has twice been postponed because of lack of resources. The following diagram shows all the phased planned in the complete process:
As far as reasonably possible, the Central Office ought to take back control of deployment of EURSC.EU in the schools. As each site is supposed ultimately to accommodate a brand-new infrastructure to be integrated into the infrastructure already in place at the Central Office, it will be supported and will be a better fit with the security standards. In the staff mobility context, the Central Office is working on validation of a concept based on VDI/RDS (Virtual Desktop Infrastructure/Remote Desktop Services). The first phase will involve establishing the foundations to be defined on Microsoft Azure. Secondly, a small workshop will be set up and it will be possible for adjustments to be made to meet needs. One positive point which emerged from the working group is that the architecture model in place is perfectly implemented to receive this type of service. If the project proves successful and is adopted, the model being flexible, security will be increased by additional firewalls in order to guarantee secure traffic. A full review of the network at Central Office level brought to light significant deficiencies with respect to the maintenance and replacement of hardware. Part of the network infrastructure is no longer covered by a maintenance contract as due diligence was not shown in the administrative follow-up. What is worse is that several pieces of hardware that are still operational are nearing the end of their life cycle and therefore urgently need to be replaced. Given these problems, it is essential to install a network monitoring tool to allow better oversight from a security viewpoint and better management from an administrative viewpoint. Strengthening of the security and communication platform, in the present case more particularly the DMZ (Demilitarised Zone), which could not be done in 2017, will probably be considered again. The objective is to enhance security as neither the hardware nor the software has been upgraded.
Schola Europaea / Office of the Secretary-General
ICT and Statistics Unit
23 / 35
2018-02-D-41-en-3
6. IT purchases and contracts In 2018, the following European Commission framework contracts have been or will be made available to the OSGES and/or European Schools wishing to participate:
• WACS II / Web & - Audio conference service • DCCS ex APS III/ General solutions for the fitting out of the server rooms • PrinCESSe II: Supplies of equipment, consumables and services for the printing and
digitisation of documents • MEQ IV for desktop computers, laptop computers and hybrids.
The European Schools will also need to launch their own procurement procedure to renew their acquisition contract for all the Microsoft licences at the special prices for education. At the same time, additional services will be requested in order to be able to have the tools which are absolutely essential to comply with the GDPR.
Schola Europaea / Office of the Secretary-General
ICT and Statistics Unit
24 / 35
2018-02-D-41-en-3
Situation of the OSGES’ ICT and Statistics unit
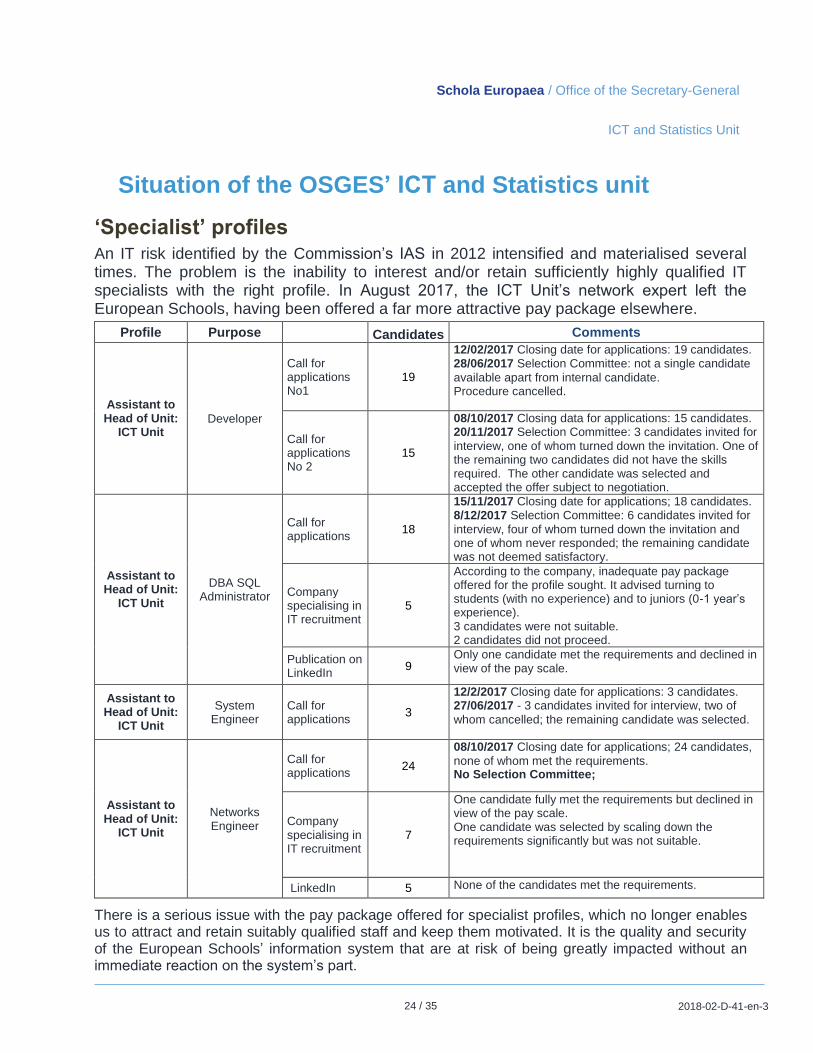
‘Specialist’ profiles An IT risk identified by the Commission’s IAS in 2012 intensified and materialised several times. The problem is the inability to interest and/or retain sufficiently highly qualified IT specialists with the right profile. In August 2017, the ICT Unit’s network expert left the European Schools, having been offered a far more attractive pay package elsewhere.
Profile Purpose Candidates Comments
Assistant to Head of Unit:
ICT Unit Developer
Call for applications No1
19
12/02/2017 Closing date for applications: 19 candidates. 28/06/2017 Selection Committee: not a single candidate
available apart from internal candidate. Procedure cancelled.
Call for applications No 2
15
08/10/2017 Closing data for applications: 15 candidates. 20/11/2017 Selection Committee: 3 candidates invited for
interview, one of whom turned down the invitation. One of the remaining two candidates did not have the skills required. The other candidate was selected and accepted the offer subject to negotiation.
Assistant to Head of Unit:
ICT Unit
DBA SQL Administrator
Call for applications
18
15/11/2017 Closing date for applications; 18 candidates. 8/12/2017 Selection Committee: 6 candidates invited for
interview, four of whom turned down the invitation and one of whom never responded; the remaining candidate was not deemed satisfactory.
Company specialising in IT recruitment
5
According to the company, inadequate pay package offered for the profile sought. It advised turning to students (with no experience) and to juniors (0-1 year’s experience). 3 candidates were not suitable. 2 candidates did not proceed.
Publication on LinkedIn
9 Only one candidate met the requirements and declined in view of the pay scale.
Assistant to Head of Unit:
ICT Unit
System Engineer
Call for applications
3
12/2/2017 Closing date for applications: 3 candidates. 27/06/2017 - 3 candidates invited for interview, two of
whom cancelled; the remaining candidate was selected.
Assistant to Head of Unit:
ICT Unit
Networks Engineer
Call for applications
24
08/10/2017 Closing date for applications; 24 candidates,
none of whom met the requirements. No Selection Committee;
Company specialising in IT recruitment
7
One candidate fully met the requirements but declined in view of the pay scale. One candidate was selected by scaling down the requirements significantly but was not suitable.
LinkedIn 5 None of the candidates met the requirements.
There is a serious issue with the pay package offered for specialist profiles, which no longer enables us to attract and retain suitably qualified staff and keep them motivated. It is the quality and security of the European Schools’ information system that are at risk of being greatly impacted without an immediate reaction on the system’s part.
Schola Europaea / Office of the Secretary-General
ICT and Statistics Unit
25 / 35
2018-02-D-41-en-3
Necessary strengthening of the ‘System and Networks’ Sub-Unit
As a result of the increase in the workload associated with extension of the range of services provided for our 14 sites, the number of IT specialists in the ‘System and Networks’ Sub-Unit (currently only three) ought to be increased, in order to be able to guarantee the maintenance, operation, development and security of the IT infrastructure in the European Schools.
In recent years, three new domains have been created:
EURSC.EU for administration
SCHOLAE.EU for pedagogy
ADNUBEM.EU for the website www.eursc.eu
For each domain, several machines (computers, servers and network hardware) have to be installed, monitored and updated.
Two new server rooms (with more than 100 servers to be managed), one located at ‘Rue de la Science’ and the other at Ixelles, have enabled security and availability to be enhanced with the establishment of a secure barrier (DMZ) divided between two sites.
The list of services provided by the ‘System and Networks’ Sub-Unit of the OSGES’ ICT Unit has steadily increased. They have made new technologies available. The following examples can be quoted.
SharePoint (website).
Microsoft Identity Manager (O365, Master Data project).
System Center Operations Manager and Operations Management Suite for monitoring.
System Center Configuration Manager for management of IT assets (deployment of images).
System Center Service Management for the Service Desk.
Skype for Business (the OSG’s telephony system that, on its own, required installation, configuration and maintenance of several servers and network systems).
Directory Files Server (for internal storage and sharing of documents).
Data Protection Manager for backups.
SAP Business Objects
Active Directory Federation Services (ADFS) for authentication. Too many technologies to be managed by only three people. The shortage of human resources does not allow knowledge to be distributed amongst several members of staff. Consequently, if a member of staff leaves or is absent for a lengthy period of time, this has a direct impact on business continuity and must be regarded as a high risk for the organisation, a risk which was already identified by the IAS in 2012 and which has since been exacerbated. In addition, the new legislation on personal data protection means that permanent checking of the information system’s security and of the means and procedures for detecting and responding in the event of cyber-attacks is essential. As the ‘System and Networks’ Sub-Unit
is fully occupied with responding (incidents) and with urgent and important projects (SAP, Skype for Business, Migration to eursc.eu), it simply does not have the human resources required to take on these proactive tasks (preventing incidents, optimising security and performance). To that end, new services will still have to be implemented. At the present time, the ‘System and Networks’ Sub-Unit’ is unable to:
respond within a reasonable time period (SLA, OLA),
make backups properly and restore them if necessary,
implement test environments,
update ‘key’ services and extend them to the second Data Centre,
attend training sessions ,
establish a maintenance plan for the servers and the network. In this context, the request for additional permanent resources, as soon as possible, seems reasonable and justified.
Delegation of powers to the schools’ local IT teams The purpose of the IT projects developed and deployed by the OSGES is to provide uniform, standardised and regulation-compliant services common to all the schools. One of the consequences of provision of these services will be to lighten the workload locally. There needs to be reflection on the feasibility of using that time to include the schools’ ICT technicians in management and maintenance of the services in question and/or the devising of new projects. Greater delegation of powers must also be given to the schools to allow them to become more independent and autonomous in routine day-to-day management of their IT infrastructure (Services, Networks, Hardware, etc.). That would also allow the workload of the central ICT Unit to be lightened. But today, such delegation of powers can only be very limited, as the current European School system is not ready for it: organisational measures, IT tools. Those reflections are included in the Multi-Annual IT Plan, handled by the IT Strategy Group.
Schola Europaea / Office of the Secretary-General
ICT and Statistics Unit
27 / 35
2018-02-D-41-en-3
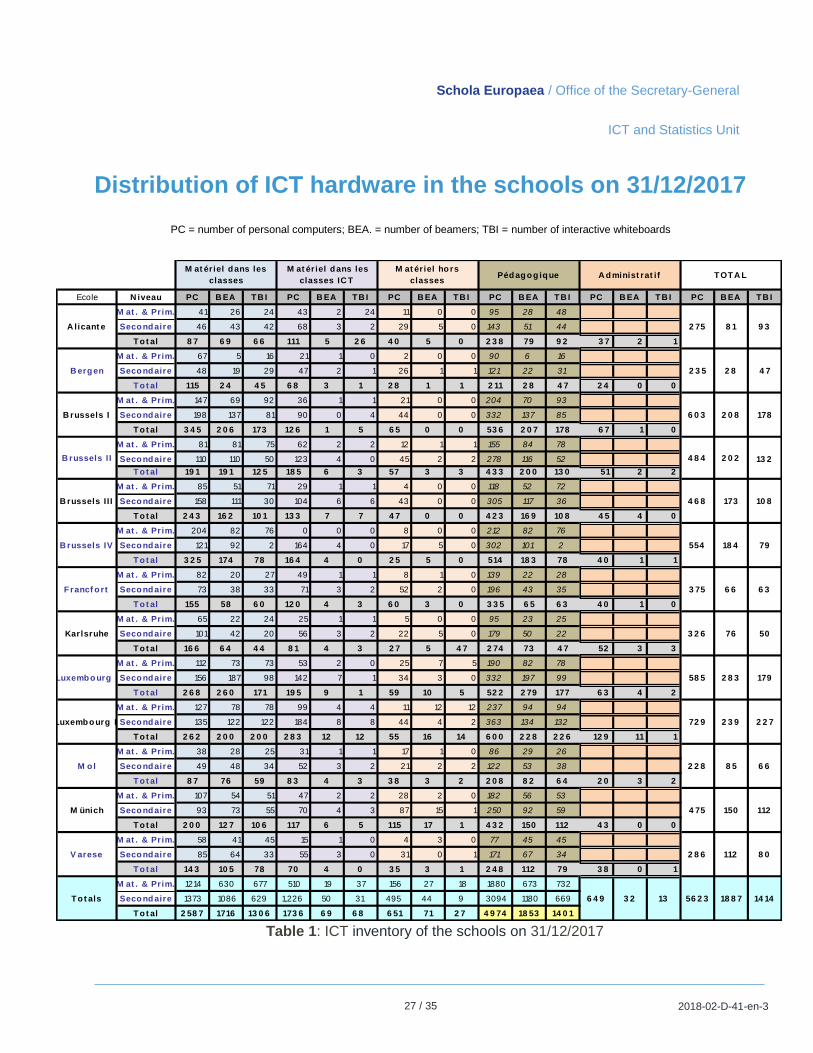
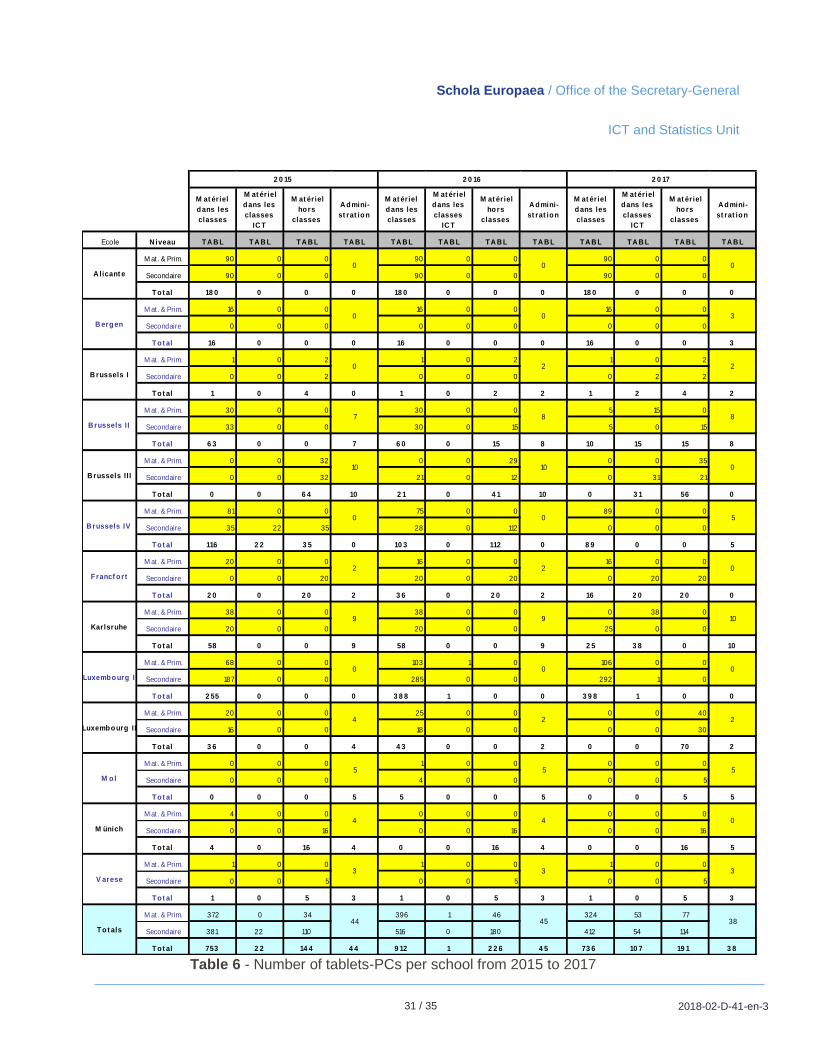
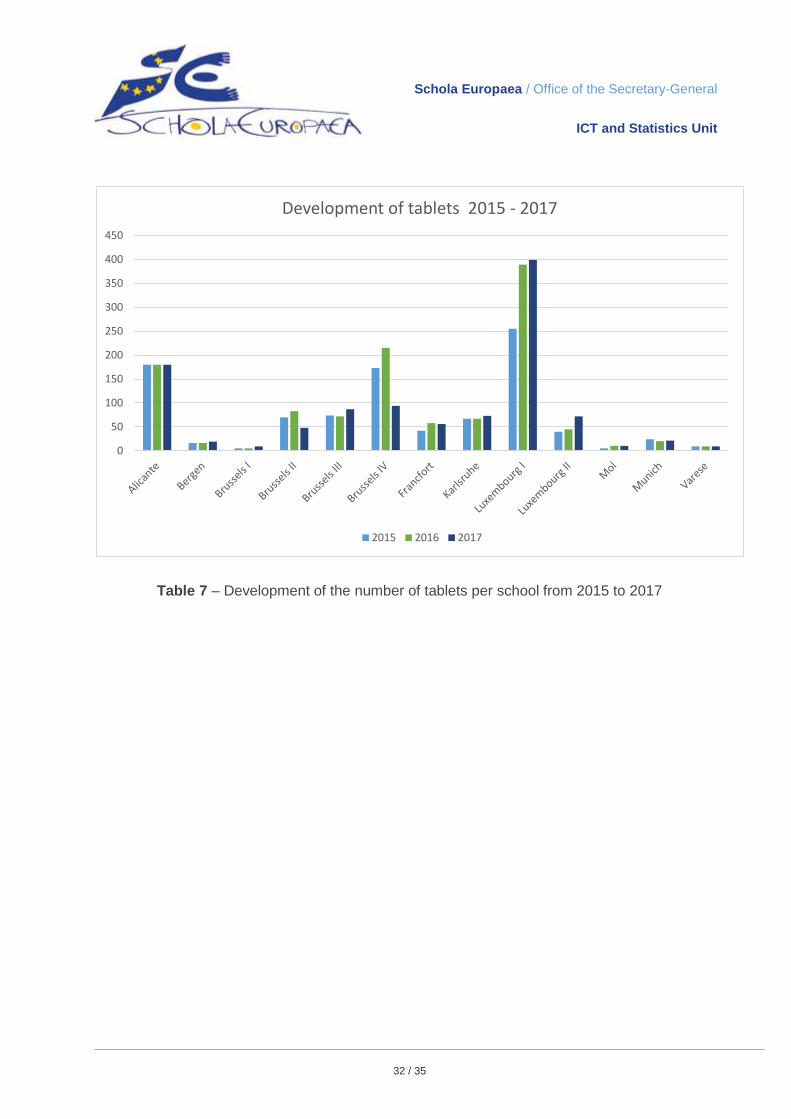
Distribution of ICT hardware in the schools on 31/12/2017
PC = number of personal computers; BEA. = number of beamers; TBI = number of interactive whiteboards
Table 1: ICT inventory of the schools on 31/12/2017
Ecole N iveau PC B EA TB I PC B EA TB I PC B EA TB I PC B EA TB I PC B EA TB I PC B EA TB I
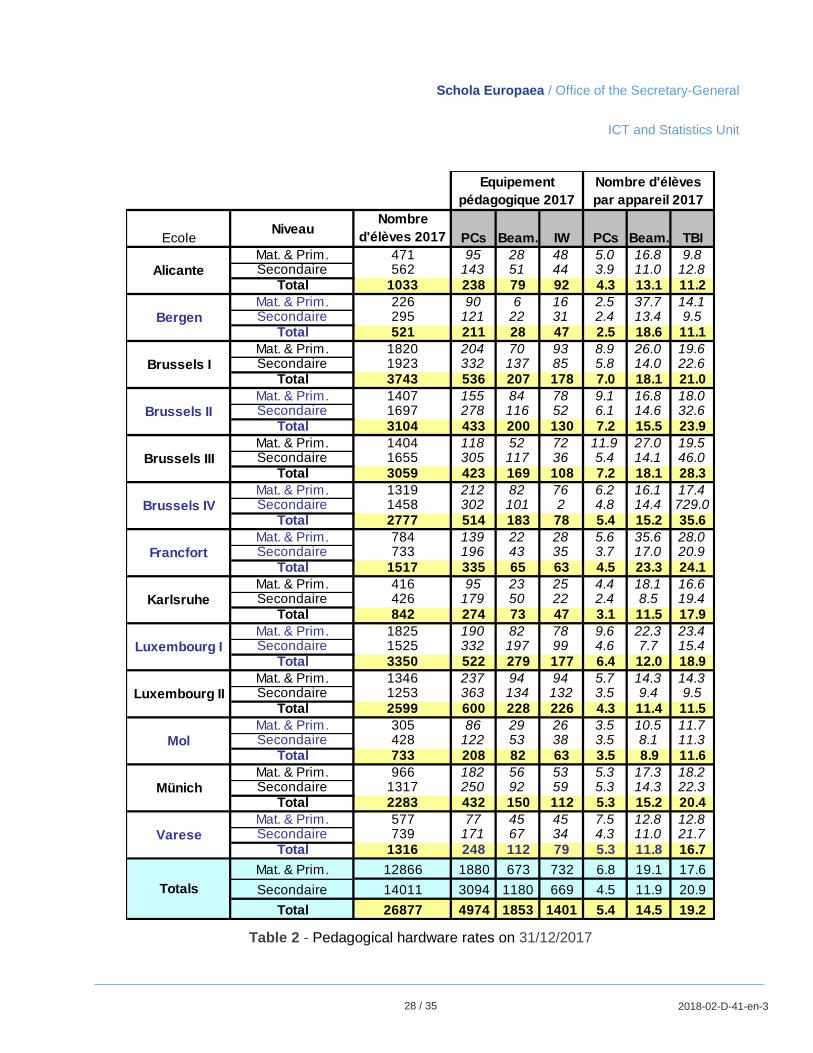
Table 3 (schools classified according to the number of pupils per device) classifies the schools according to their pupils per PC, pupils per beamer and pupils per interactive whiteboard ratios.
School Pupils per PC School
Pupils per
beamer School Pupils
per IWB
Bergen 2.5 Mol 8.9 Bergen 11.1
Karlsruhe 3.1 Luxembourg II 11.4 Alicante 11.2
Mol 3.5 Karlsruhe 11.5 Luxembourg II 11.5
Luxembourg II 4.3 Varese 11.8 Mol 11.6
Alicante 4.3 Luxembourg I 12.0 Varese 16.7
Frankfurt 4.5 Alicante 13.1 Karlsruhe 17.9
Average 4.7 Average 13.8 Average 18.0
Munich 5.3 Brussels IV 15.2 Luxembourg I 18.9
Varese 5.3 Munich 15.2 Munich 20.4
Brussels IV 5.4 Brussels II 15.5 Brussels I 21.0
Luxembourg I 6.4 Brussels I 18.1 Brussels II 23.9
Brussels I 7.0 Brussels III 18.1 Frankfurt 24.1
Brussels II 7.2 Bergen 18.6 Brussels III 28.3
Brussels III 7.2 Frankfurt 23.3 Brussels IV 35.6
Table 3 - Schools classified according to the number of pupils per device
Schola Europaea / Office of the Secretary-General
ICT and Statistics Unit
30 / 35
2018-02-D-41-en-3
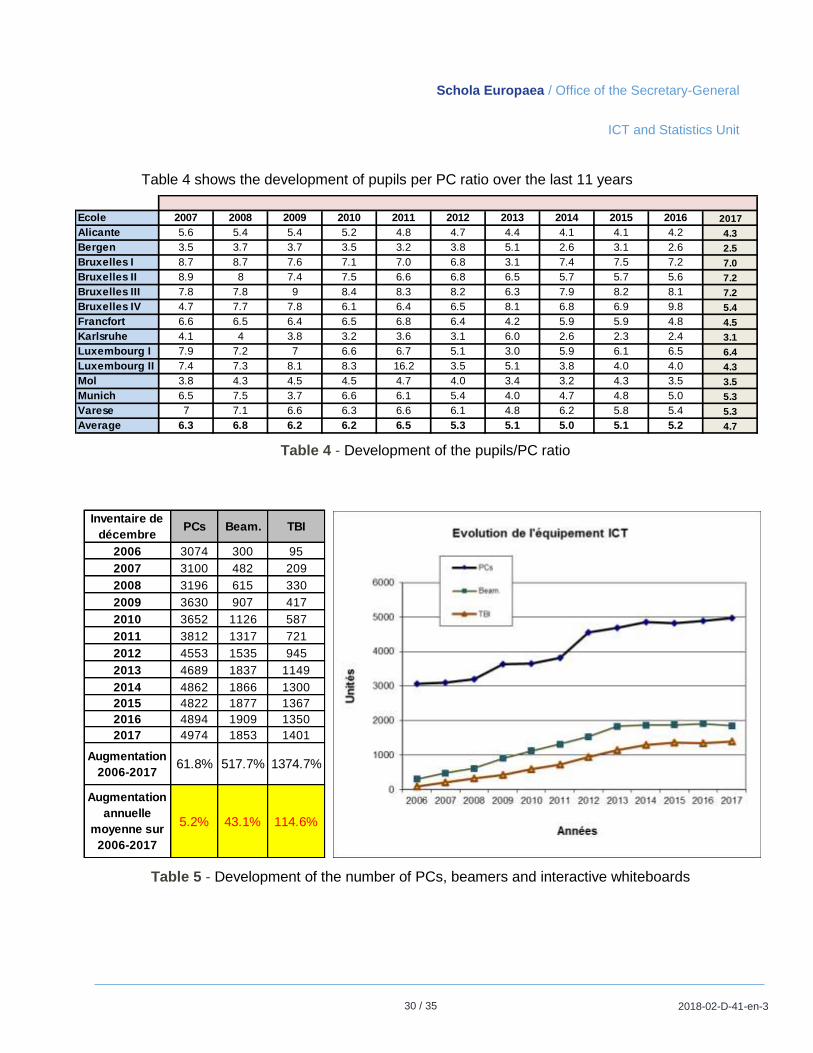
Table 4 shows the development of pupils per PC ratio over the last 11 years
Table 4 - Development of the pupils/PC ratio
Table 5 - Development of the number of PCs, beamers and interactive whiteboards
FINDINGS AND DISCUSSION .......................................................................................................................... 5
I. GENERAL INFORMATION .................................................................................................................. 5
II. ITEMS REGARDING STUDENTS’ AWARENESS OF ICT AND THEIR OPPORTUNITIES AND
WILLINGNESS TO USE THEM ..................................................................................................................... 5
III. QUESTIONS REGARDING THE TEACHERS’ COMPETENCES, ATTITUDES, PRACTICES AND
TRAINING NEEDS ....................................................................................................................................... 8
IV. QUESTIONS REGARDING THE MANAGEMENT OF THE SCHOOL AND ITS STRATEGY ON ICT ..... 12
V. QUESTIONS REGARDING ORGANISATIONAL ISSUES ....................................................................... 13
VI. QUESTIONS REGARDING THE ICT INFRASTRUCTURE PROVIDED IN THE SCHOOL ...................... 15
VII. FINAL QUESTIONS ....................................................................................................................... 16
• Schools are encouraged to deploy access points that can service any mobile client in its
coverage zone. There should no longer be any area without coverage on the campus,
except for the nursery areas.
• WiFi infrastructure should allow access policy, time policy and application policies per
user type, and bandwidth limitation, WiFi use should be monitored.
GENERAL CONCLUSIONS
The survey was conducted under constrained conditions, mainly time-wise. Bearing in mind that
the time limit almost entirely corresponded with the summer holidays, the high level of
engagement in the questionnaire is undoubtedly impressive. The active participation and
cooperation of the teachers is greatly appreciated and invaluable in terms of the activity of the IT
Strategy Working Groups, whose responsibility is to translate this evidence into concrete ideas
for policy action.
The survey has produced a generally promising and positive overall picture of the present state
of ICT in the European School system. However, in view of the constantly expanding role of the
pedagogical use of ICT, proven by the fact that it is one of the 8 key competences1 for lifelong
learning and one of the three main priorities of the Estonian presidency for the 2017-2018
school year2, there might still be opportunities for further enhancements. The question arising
from this survey is: To what extent do we wish the European Schools to be digitally competent?
Today, pupils are undeniably growing up with digital media and are using them in a most
unaffected and uncontrolled way. In terms of skills, what would we wish them to achieve from
which they could benefit in their future careers and lives?
The IT Strategy WG aims to promote and expand digital and informatics skills in all schools. In
addition to the improvement of teaching (methodically effective use of digital media in the
classroom), the emphasis should be on school development. This would suggest a
comprehensive and system-wide approach on the part of the entire school community and not
just of individual teachers.
The survey provides an excellent basis for the future cooperation of IT ADM and IT PEDA in the
devising of IT Policy. The main responsibility of the IT PEDA WG, in addition to its other areas
of activity, is to translate this evidence into concrete ideas for policy and other kinds of
recommendations (see above). Several of them will be an integral part of the IT MAP, whilst
others need further investigation and analysis concerning their feasibility and applicability.
1 See EC Recommendation 2006/962/EC on Key competences for lifelong learning: digital competence,
mathematics, scientific and technological competence, communication in mother tongue, communication in foreign
languages, learning to learn, social and civic competences, sense of initiative and entrepreneurship, cultural
awareness and expression.
http://europa.eu/legislation_summaries/education_training_youth/lifelong_learning/c11090_en.htm 2 See document ‘Pedagogical Development and Quality Assurance of the European Schools (2017-2018)’ (Ref .
2017-09-D-50-en-2) approved by the Joint Board of Inspectors at its meeting of 11 October 2017 in Brussels
The JBI expressed a favourable opinion on the progress of the two WGs in order to strengthen the use of new technologies in classrooms while takinging human and financial resources into account. An improvement in security must be reinforced concerning the students’ use of new technologies.
Opinion of the Joint Teaching Committee
The JTC expressed a favourable opinion on the Report on the IT-PEDA survey. The WG
was encouraged to continue its work, taking account of the developments at European
level. This document would be sent forward to the Board of Governors.
2018-01-D-22-en-2 21/53
ANNEX I
IT PEDA survey for teachers [1] Dear Teachers,
On behalf of the IT-PEDA Working Group, mandated by the Board of Governors, we are conducting a survey in order to form an overall picture of the pedagogical use of ICT in the European Schools. Please keep in mind that for the first time in the history of the European Schools, all the teachers are invited to participate in a survey which focuses on such an important pedagogical area. With the results of this survey, we would like to learn more about your preferences, needs and opportunities regarding this subject. This will help us make improvements to the existing ICT practices and prioritise our tasks and goals for the future. Please don’t miss this opportunity. Please note that there is no correct or incorrect answer, meaning that you should base your responses solely on your own opinion and experience. The survey should only take around 15 minutes and we would like to assure you that the questionnaire is anonymous. We really appreciate the time you are taking to offer your input.
[1]This survey is based partially on a survey on the same subject previously conducted in Estonia: “ICT in education: digital competencies, attitudes and opportunities for schools of general education and for kindergartens”
Leppik, Cenely, Haaristo, Hanna-Stella, Mägi, Eve (2017). IKT haridus: digioskuste õpetamine, hoiakud ja võimalused üldhariduskoolis ja lasteaias. Tallinn: Poliitikauuringute Keskus Praxis.
Avaible at: http://www.praxis.ee/wp-content/uploads/2016/08/IKT-hariduse-uuring_aruanne_mai2017.pdf There are 24 questions in this survey
I. General Information
[Q1]In which European School do you work? *
Check all that apply Please choose all that apply:
Check all that apply Please choose all that apply:
Nursery
Primary
Secondary
[Q3]Which subject(s) do you teach? *
Check all that apply Please choose all that apply:
Ancient Greek
Art
Biology
Chemistry
Discovery of the World
Economy
Ethics
European Hours
Geography
History
Human Sciences
ICT
2018-01-D-22-en-2 23/53
Integrated Sciences
L1
L1 SWALS
L2
L3
L4
Latin
Mathematics
Music
ONL
Philosophy
Physical Education
Physics
Recreation
Religion
Other:
[Q4]In which language section are you a teacher? *
Check all that apply Please choose all that apply:
German
English
French
Spanish
Dutch
Danish
Hungarian
Italian
Latvian
2018-01-D-22-en-2 24/53
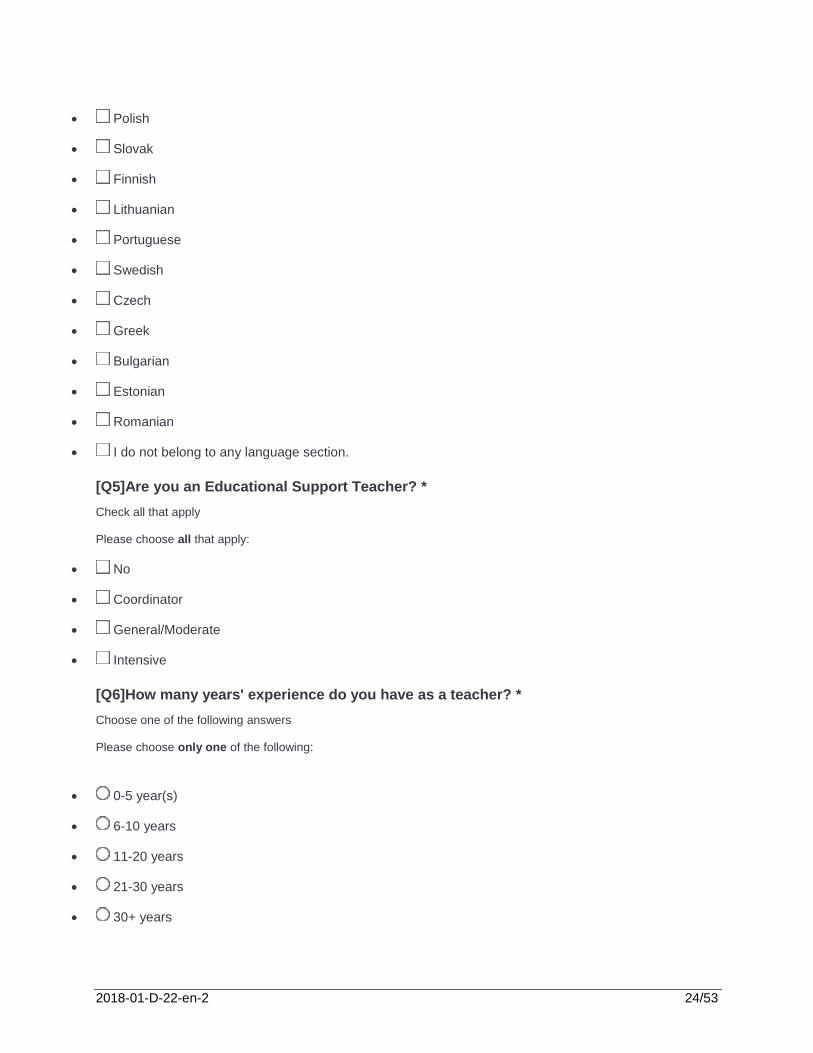
Polish
Slovak
Finnish
Lithuanian
Portuguese
Swedish
Czech
Greek
Bulgarian
Estonian
Romanian
I do not belong to any language section.
[Q5]Are you an Educational Support Teacher? *
Check all that apply Please choose all that apply:
No
Coordinator
General/Moderate
Intensive
[Q6]How many years' experience do you have as a teacher? *
Choose one of the following answers Please choose only one of the following:
0-5 year(s)
6-10 years
11-20 years
21-30 years
30+ years
2018-01-D-22-en-2 25/53
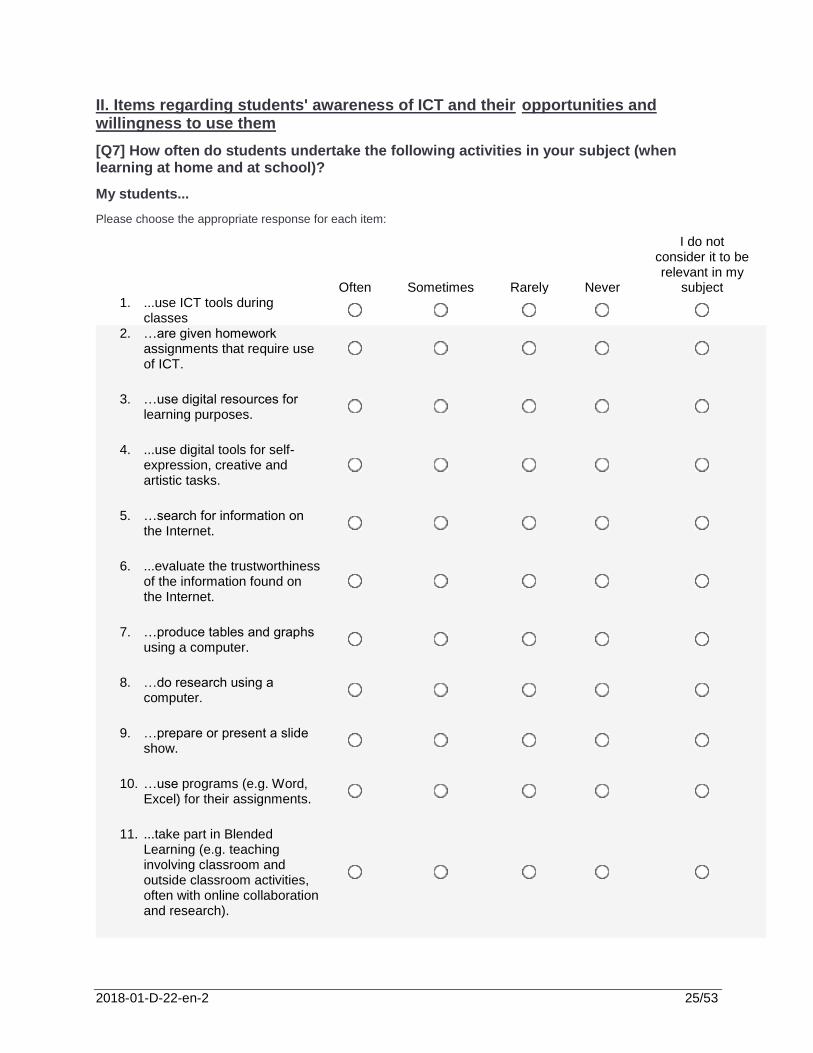
II. Items regarding students' awareness of ICT and their opportunities and willingness to use them
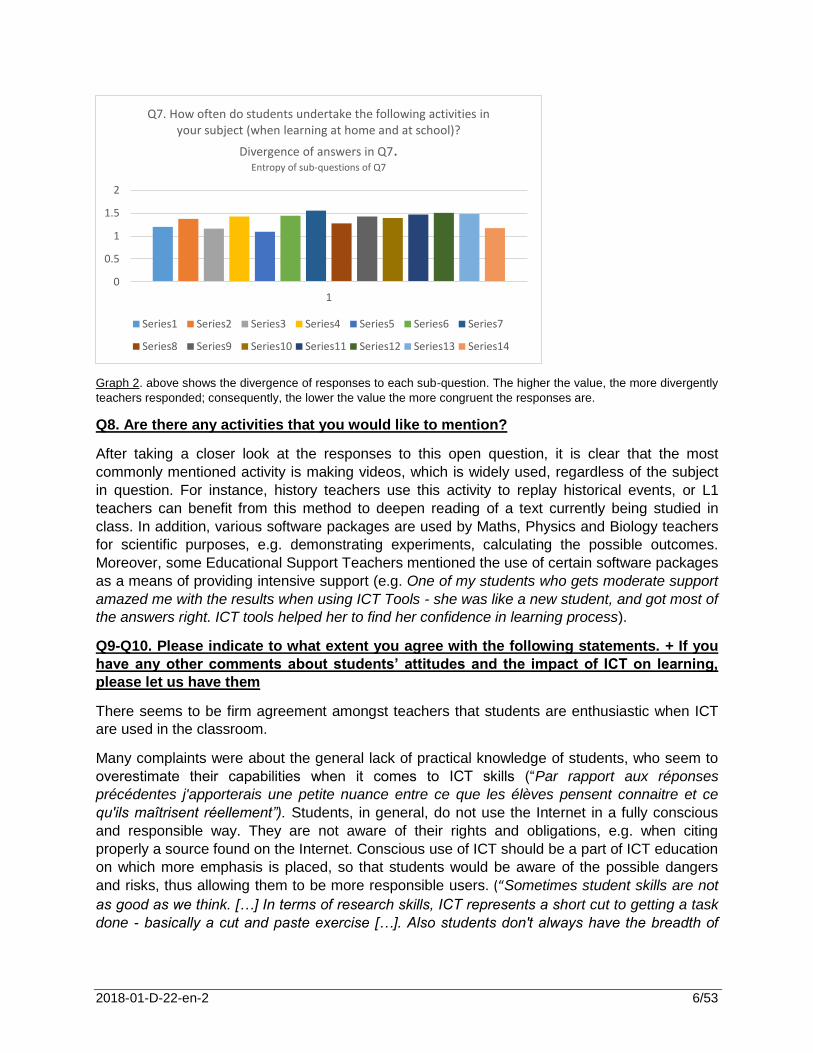
[Q7] How often do students undertake the following activities in your subject (when learning at home and at school)?
My students...
Please choose the appropriate response for each item:
Often Sometimes Rarely Never
I do not consider it to be relevant in my
subject 1. ...use ICT tools during
classes
2. …are given homework assignments that require use of ICT.
3. …use digital resources for learning purposes.
4. ...use digital tools for self-expression, creative and artistic tasks.
5. …search for information on the Internet.
6. ...evaluate the trustworthiness of the information found on the Internet.
7. …produce tables and graphs using a computer.
8. …do research using a computer.
9. …prepare or present a slide show.
10. …use programs (e.g. Word, Excel) for their assignments.
11. ...take part in Blended Learning (e.g. teaching involving classroom and outside classroom activities, often with online collaboration and research).
2018-01-D-22-en-2 26/53
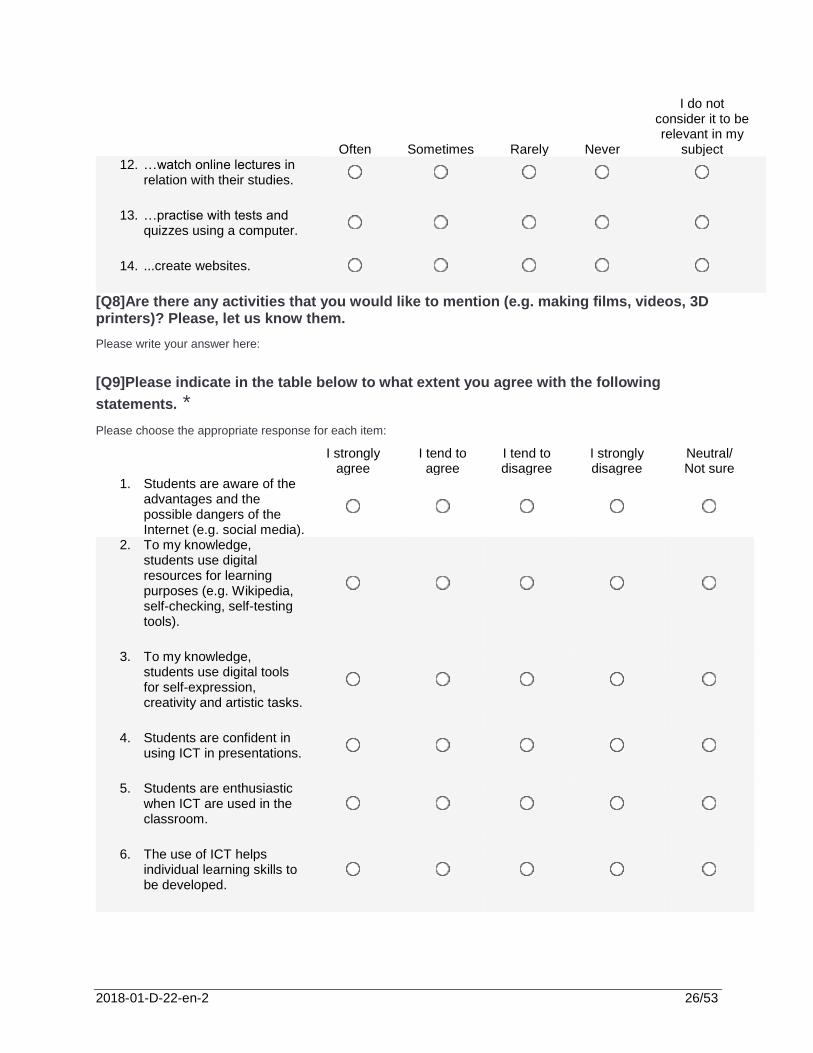
Often Sometimes Rarely Never
I do not consider it to be relevant in my
subject 12. …watch online lectures in
relation with their studies.
13. …practise with tests and quizzes using a computer.
14. ...create websites.
[Q8]Are there any activities that you would like to mention (e.g. making films, videos, 3D printers)? Please, let us know them.
Please write your answer here:
[Q9]Please indicate in the table below to what extent you agree with the following
statements. *
Please choose the appropriate response for each item:
I strongly
agree I tend to agree
I tend to disagree
I strongly disagree
Neutral/ Not sure
1. Students are aware of the advantages and the possible dangers of the Internet (e.g. social media).
2. To my knowledge, students use digital resources for learning purposes (e.g. Wikipedia, self-checking, self-testing tools).
3. To my knowledge, students use digital tools for self-expression, creativity and artistic tasks.
4. Students are confident in using ICT in presentations.
5. Students are enthusiastic when ICT are used in the classroom.
6. The use of ICT helps individual learning skills to be developed.
2018-01-D-22-en-2 27/53
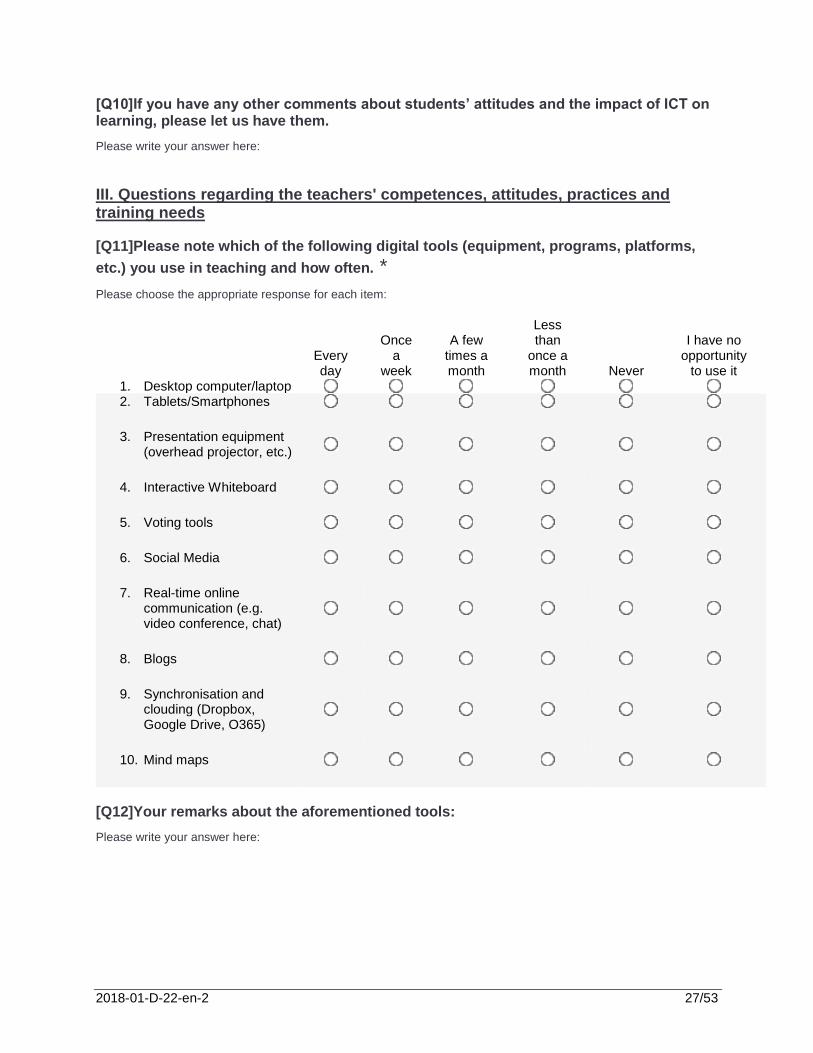
[Q10]If you have any other comments about students’ attitudes and the impact of ICT on learning, please let us have them.
Please write your answer here:
III. Questions regarding the teachers' competences, attitudes, practices and training needs
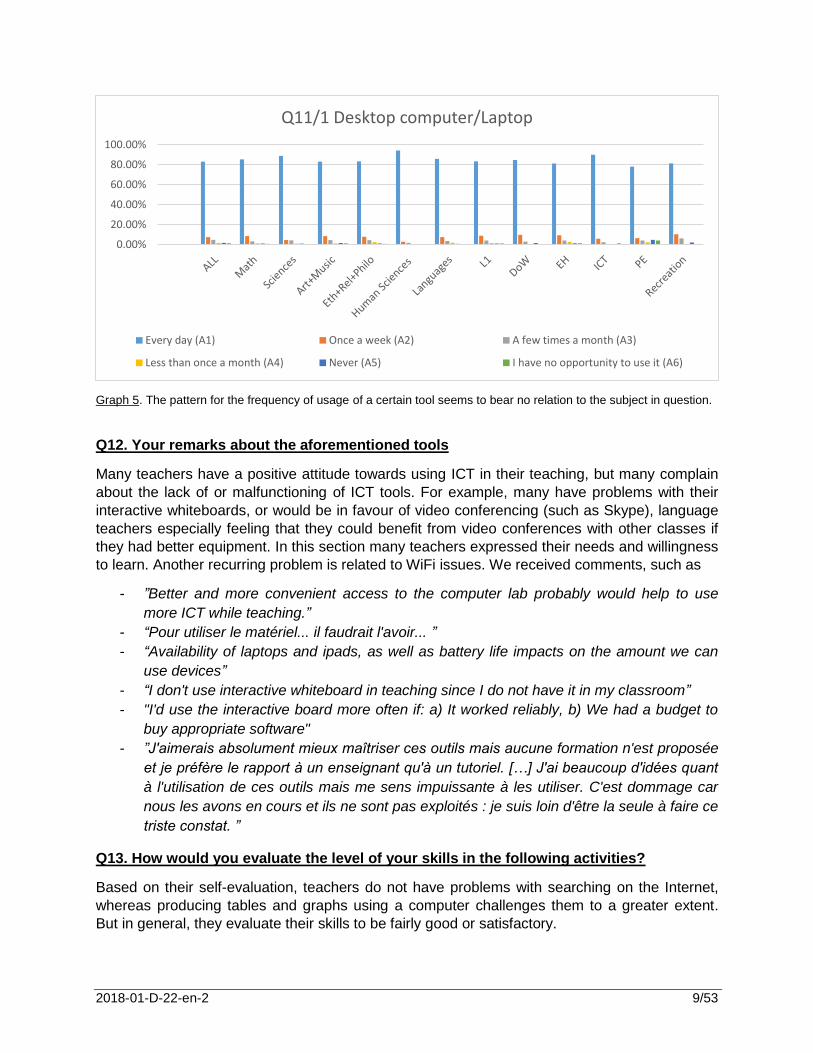
[Q11]Please note which of the following digital tools (equipment, programs, platforms,
etc.) you use in teaching and how often. *
Please choose the appropriate response for each item:
7. Real-time online communication (e.g. video conference, chat)
8. Blogs
9. Synchronisation and clouding (Dropbox, Google Drive, O365)
10. Mind maps
[Q12]Your remarks about the aforementioned tools:
Please write your answer here:
2018-01-D-22-en-2 28/53
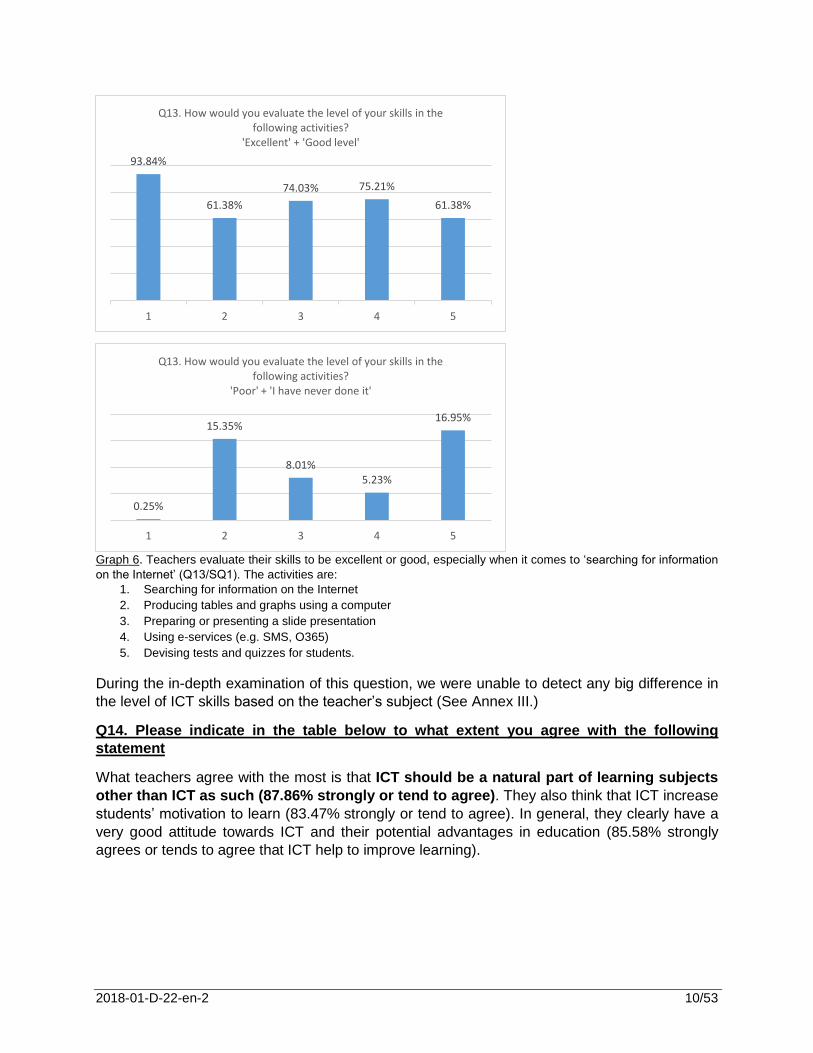
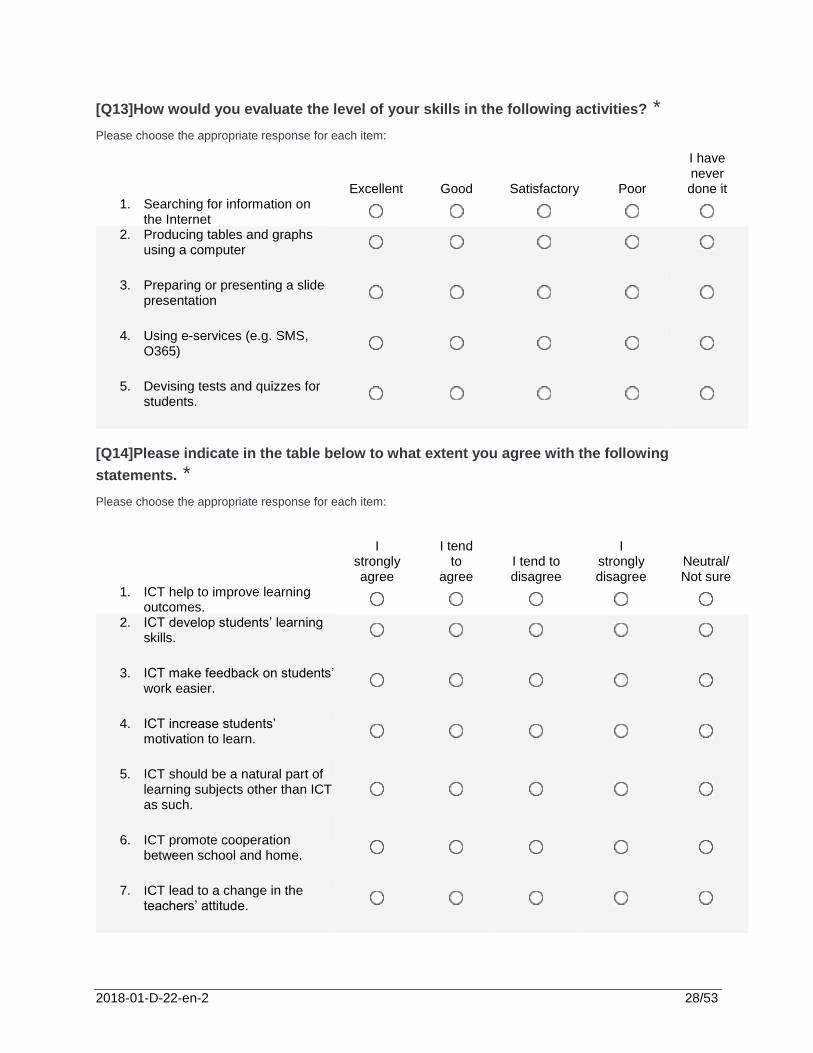
[Q13]How would you evaluate the level of your skills in the following activities? *
Please choose the appropriate response for each item:
Excellent Good Satisfactory Poor
I have never done it
1. Searching for information on the Internet
2. Producing tables and graphs using a computer
3. Preparing or presenting a slide presentation
4. Using e-services (e.g. SMS, O365)
5. Devising tests and quizzes for students.
[Q14]Please indicate in the table below to what extent you agree with the following
statements. *
Please choose the appropriate response for each item:
I
strongly agree
I tend to
agree I tend to disagree
I strongly disagree
Neutral/ Not sure
1. ICT help to improve learning outcomes.
2. ICT develop students’ learning skills.
3. ICT make feedback on students’ work easier.
4. ICT increase students’ motivation to learn.
5. ICT should be a natural part of learning subjects other than ICT as such.
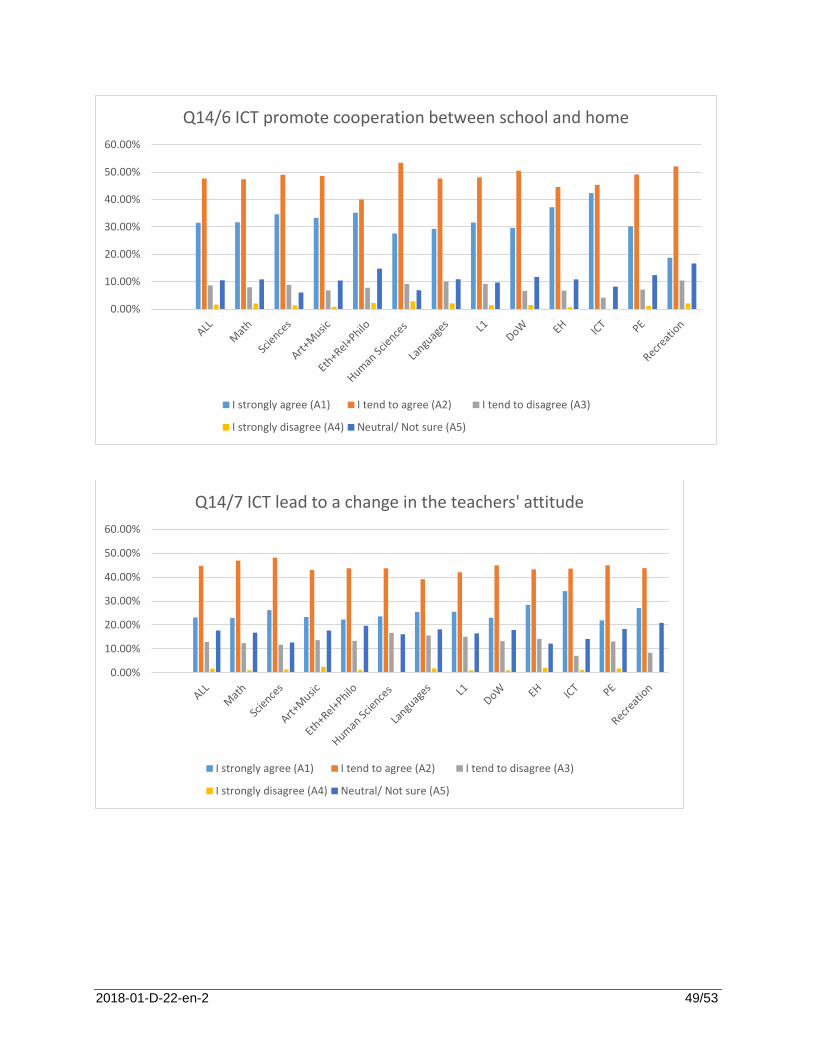
6. ICT promote cooperation between school and home.
7. ICT lead to a change in the teachers’ attitude.
2018-01-D-22-en-2 29/53
I
strongly agree
I tend to
agree I tend to disagree
I strongly disagree
Neutral/ Not sure
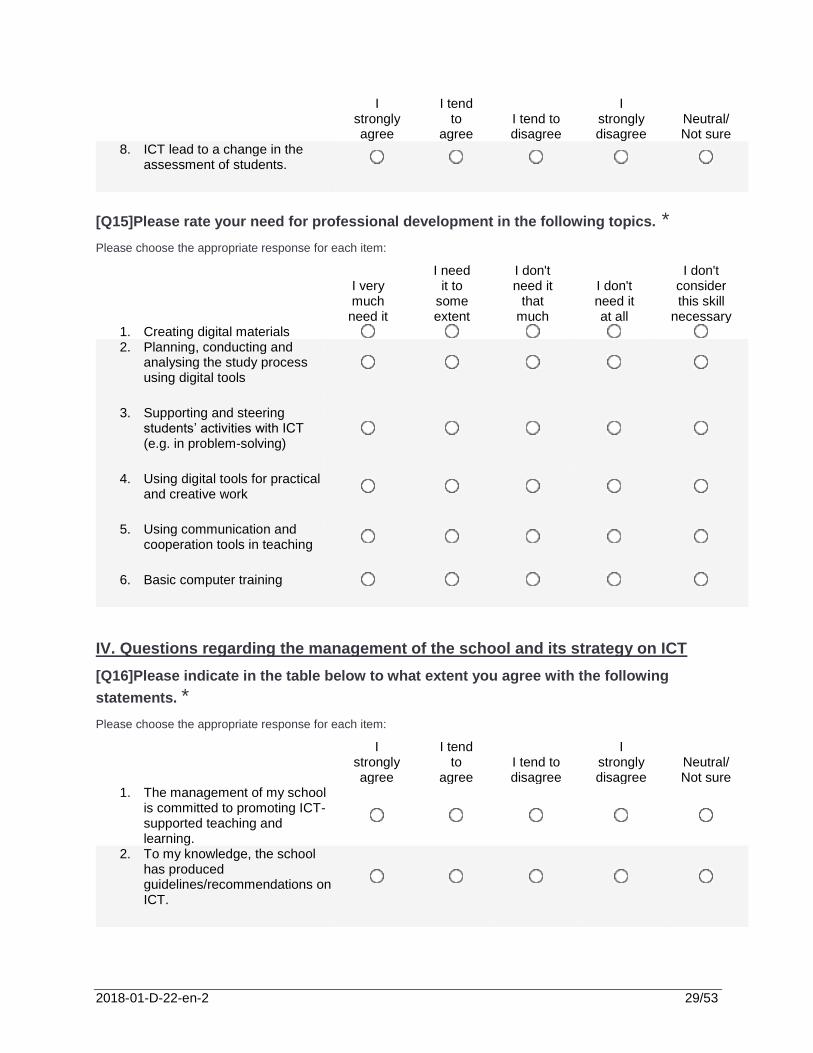
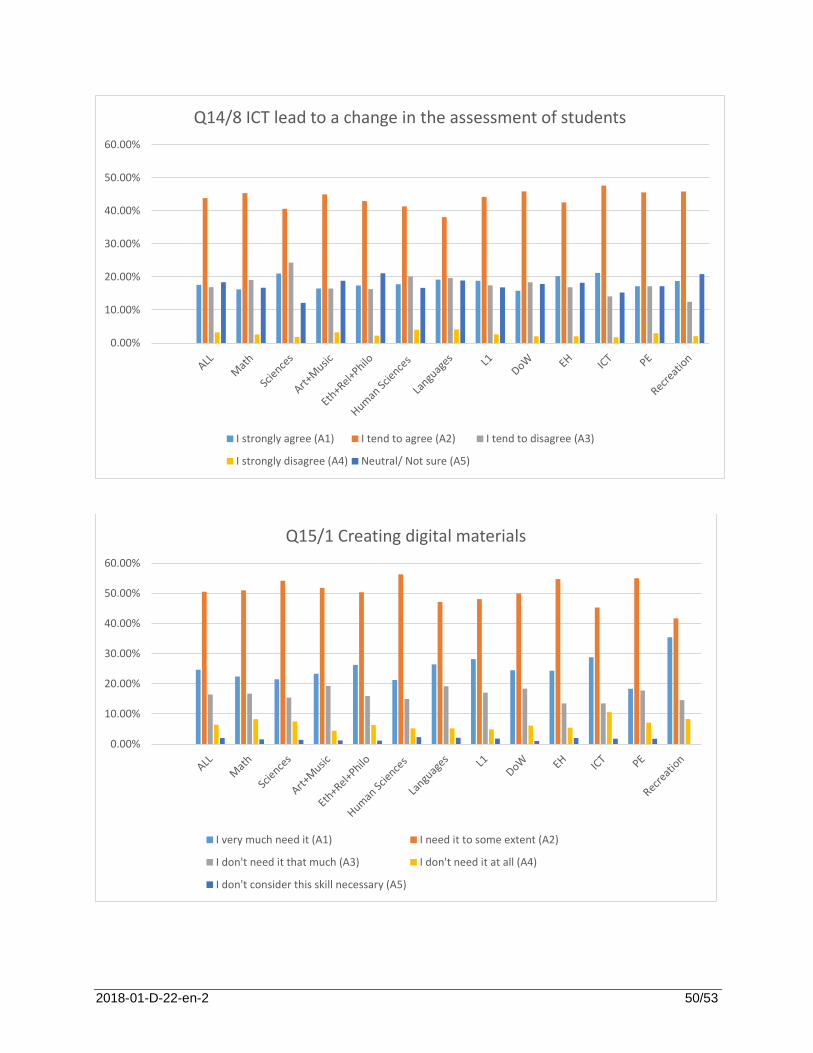
8. ICT lead to a change in the assessment of students.
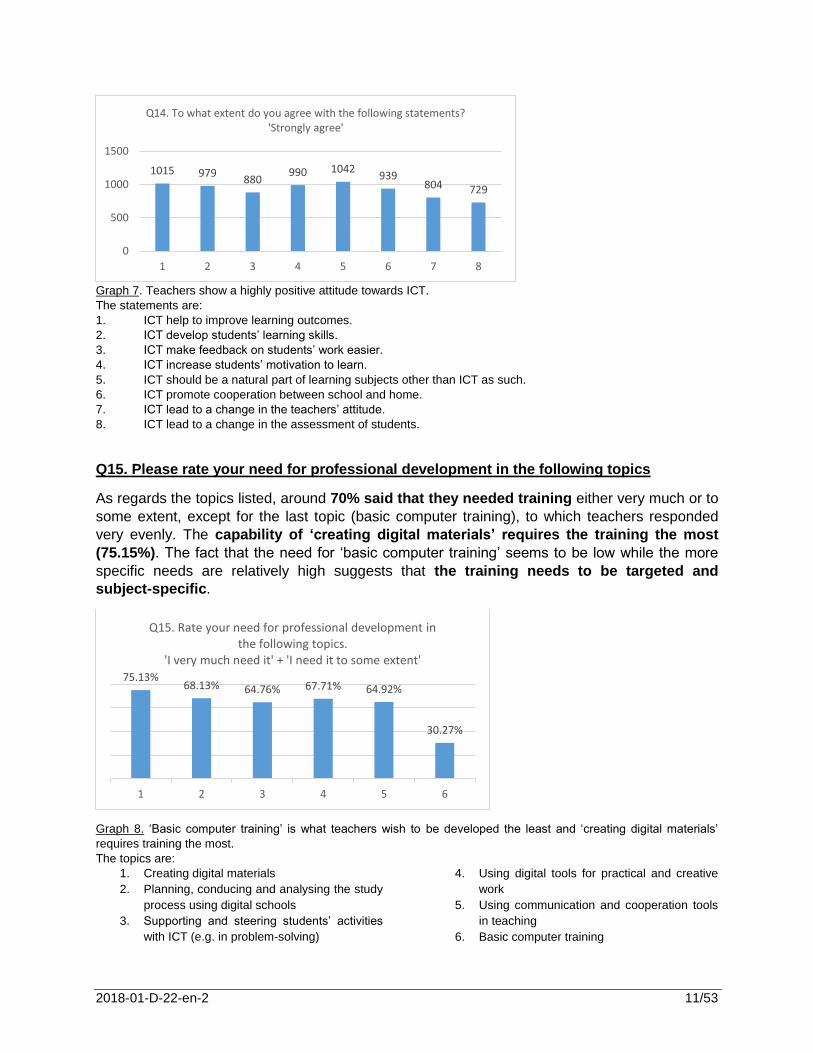
[Q15]Please rate your need for professional development in the following topics. *
Please choose the appropriate response for each item:
I very much need it
I need it to
some extent
I don't need it
that much
I don't need it at all
I don't consider this skill
necessary 1. Creating digital materials
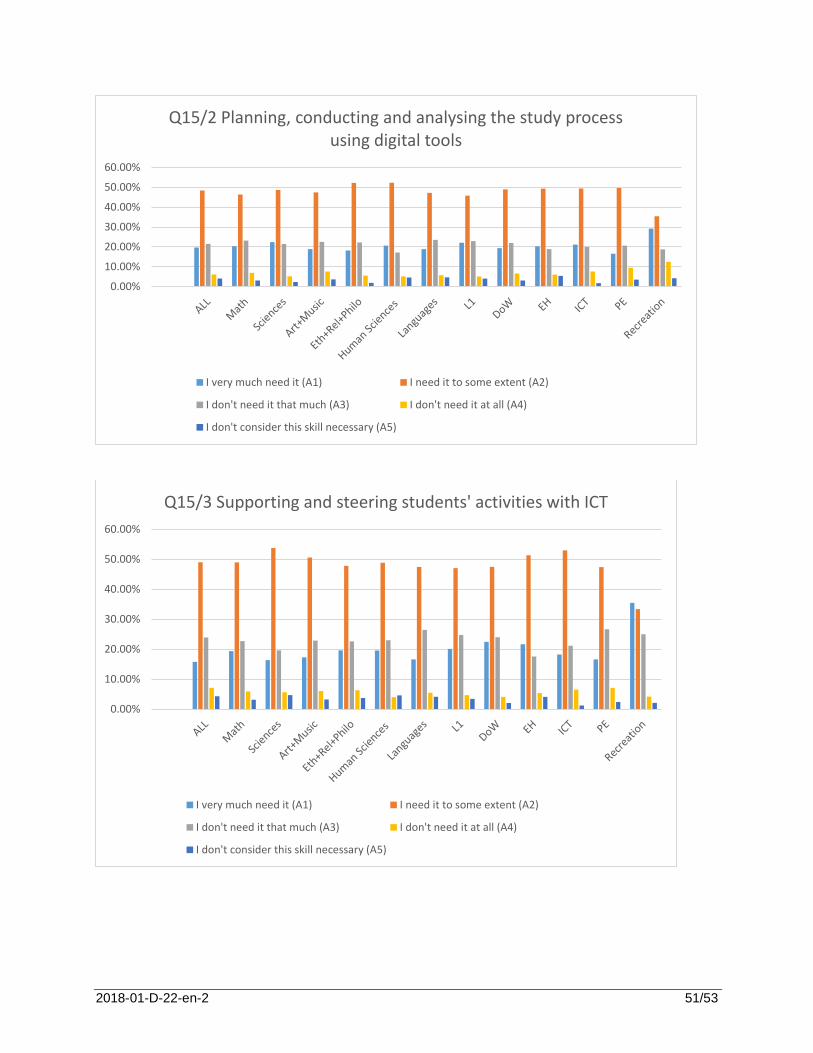
2. Planning, conducting and analysing the study process using digital tools
3. Supporting and steering students’ activities with ICT (e.g. in problem-solving)
4. Using digital tools for practical and creative work
5. Using communication and cooperation tools in teaching
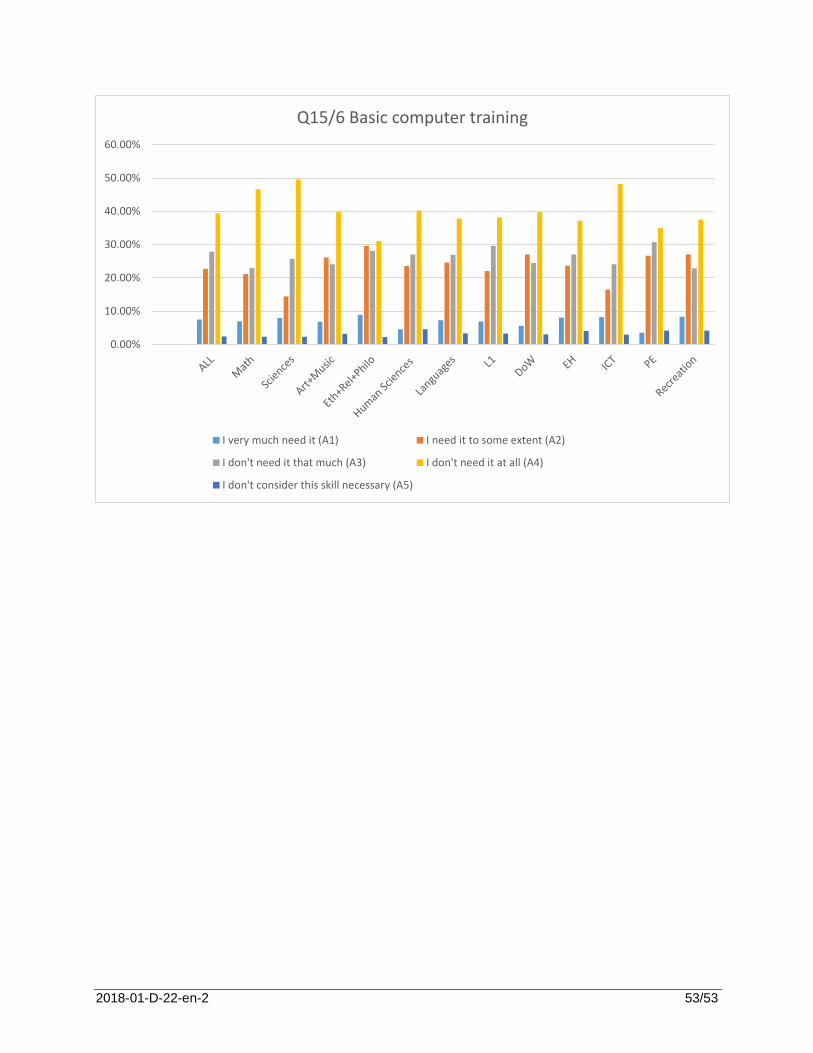
6. Basic computer training
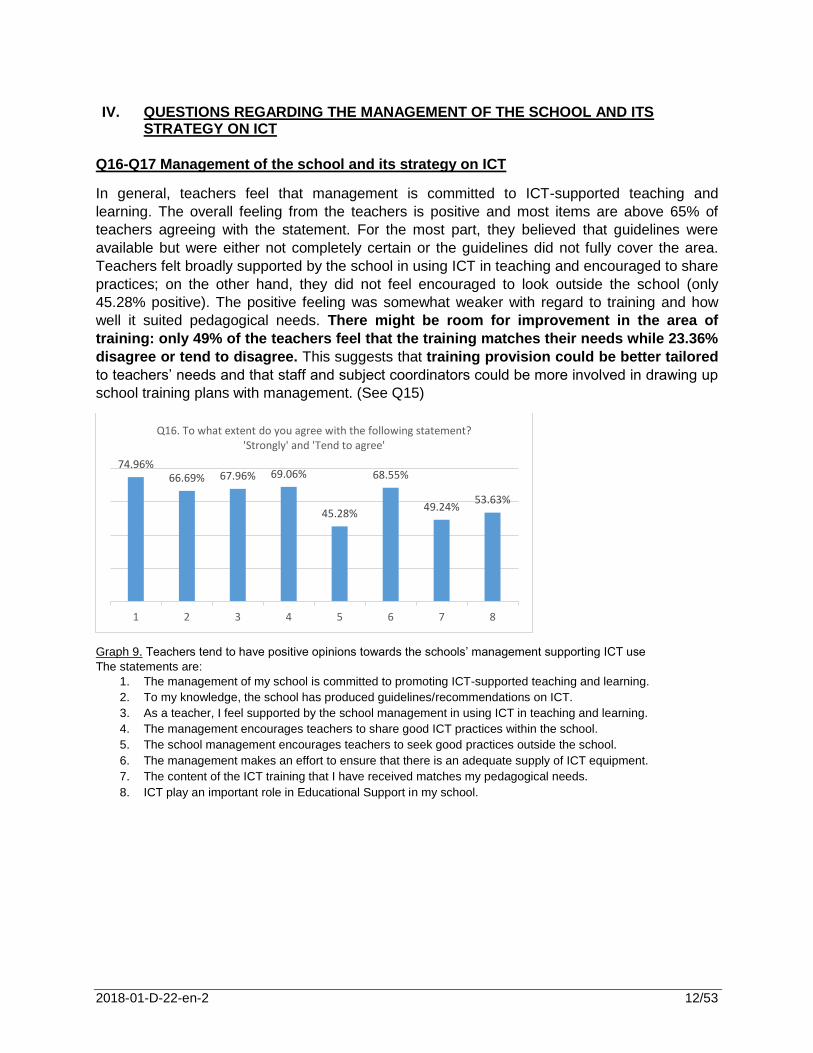
IV. Questions regarding the management of the school and its strategy on ICT
[Q16]Please indicate in the table below to what extent you agree with the following
statements. *
Please choose the appropriate response for each item:
I
strongly agree
I tend to
agree I tend to disagree
I strongly disagree
Neutral/ Not sure
1. The management of my school is committed to promoting ICT-supported teaching and learning.
2. To my knowledge, the school has produced guidelines/recommendations on ICT.
2018-01-D-22-en-2 30/53
I
strongly agree
I tend to
agree I tend to disagree
I strongly disagree
Neutral/ Not sure
3. As a teacher, I feel supported by the school management in using ICT in teaching and learning.
4. The management encourages teachers to share good ICT practices within the school.
5. The school management encourages teachers to seek good practices outside the school.
6. The management makes an effort to ensure that there is an adequate supply of ICT equipment.
7. The content of the ICT training that I have received matches my pedagogical needs.
8. ICT play an important role in Educational Support in my school.
[Q17]Please comment on or add to the statements above.
Please write your answer here:
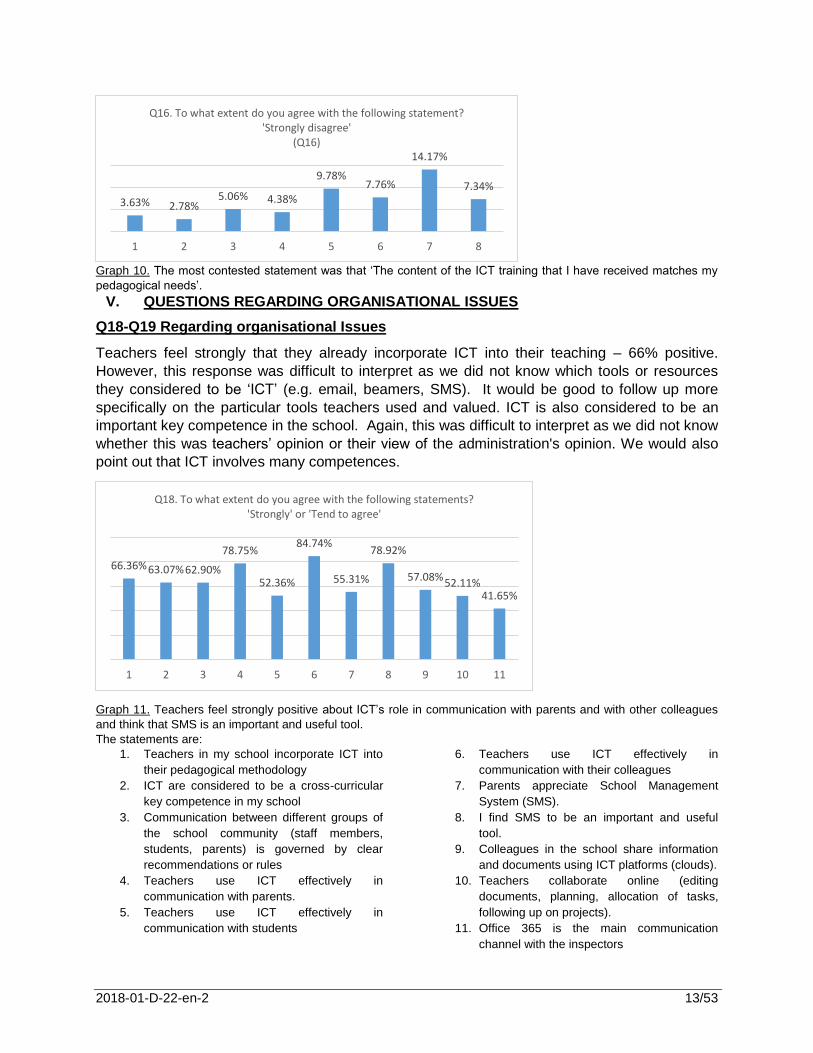
V. Questions regarding organisational issues
[Q18]Please indicate in the table below to what extent you agree with the following
statements. *
Please choose the appropriate response for each item:
I strongly agree
I tend to
agree I tend to disagree
I strongly disagree
Neutral/ Not sure
1. Teachers in my school incorporate ICT into their pedagogical methodology.
2. ICT are considered to be a cross-curricular key competence in my school.
2018-01-D-22-en-2 31/53
I strongly agree
I tend to
agree I tend to disagree
I strongly disagree
Neutral/ Not sure
3. Communication between different groups of the school community (staff members, students, parents) is governed by clear recommendations or rules.
4. Teachers use ICT effectively in communication with parents.
5. Teachers use ICT effectively in communication with students.
6. Teachers use ICT effectively in communication with their colleagues.
7. Parents appreciate School Management System (SMS).
8. I find SMS to be an important and useful tool.
9. Colleagues in the school share information and documents using ICT platforms (clouds).
10. Teachers collaborate online (editing documents, planning, allocation of tasks, following up on projects).
11. Office 365 is the main communication channel with the inspectors.
[Q19]Please share your thoughts about organisation and communication with us:
Please write your answer here:
2018-01-D-22-en-2 32/53
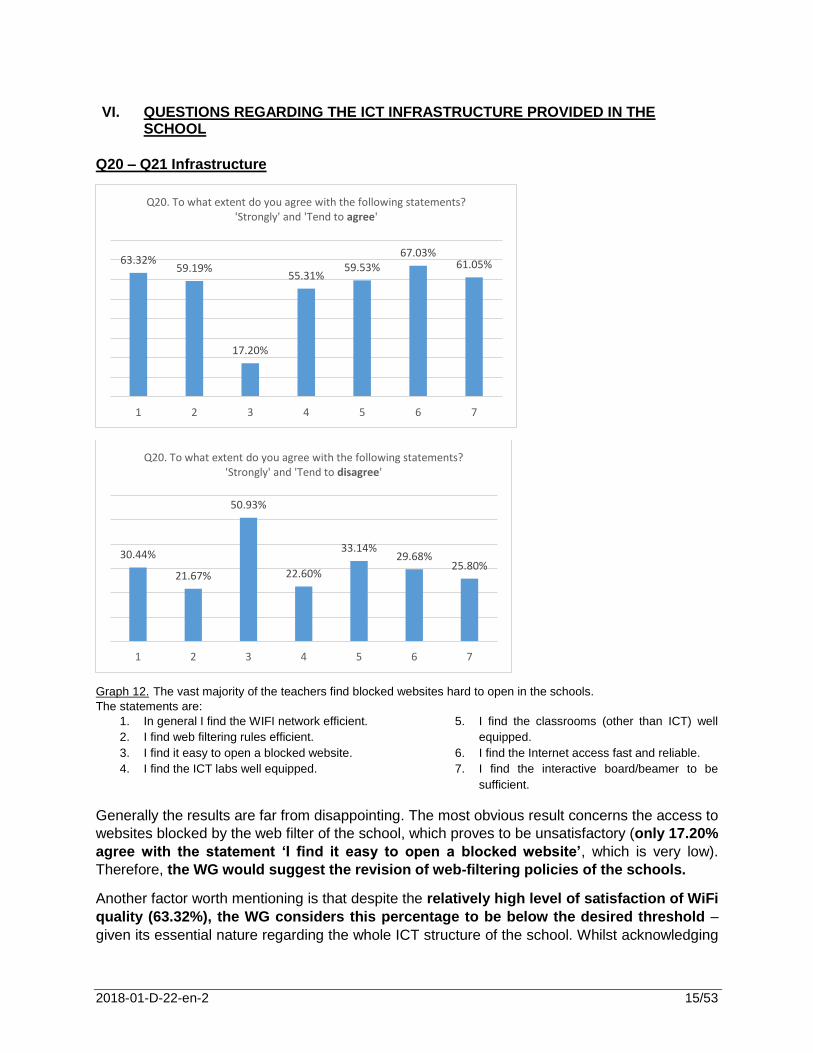
VI. Questions regarding the ICT infrastructure provided in the school
[Q20]Please indicate in the table below to what extent you agree with the following
statements. *
Please choose the appropriate response for each item:
I
strongly agree
I tend to
agree I tend to disagree
I strongly disagree
Neutral/ Not sure
1. In general I find the WIFI network efficient.
2. I find web filtering rules efficient.
3. I find it easy to open a blocked website.
4. I find the ICT labs well equipped.
5. I find the classrooms (other than ICT) well equipped.
6. I find the Internet access fast and reliable.
7. I find the interactive board/beamer to be sufficient.
[Q21]Please add your comment on the general ICT equipment of the school:
Please write your answer here:
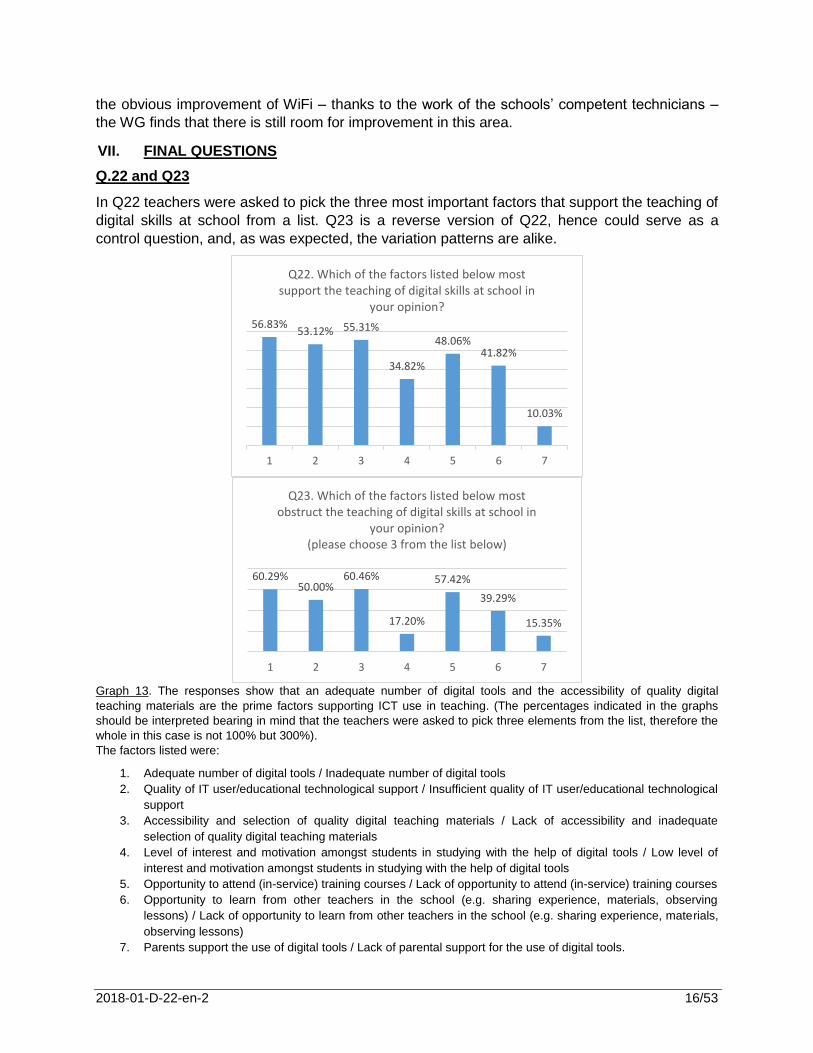
VII. Final questions
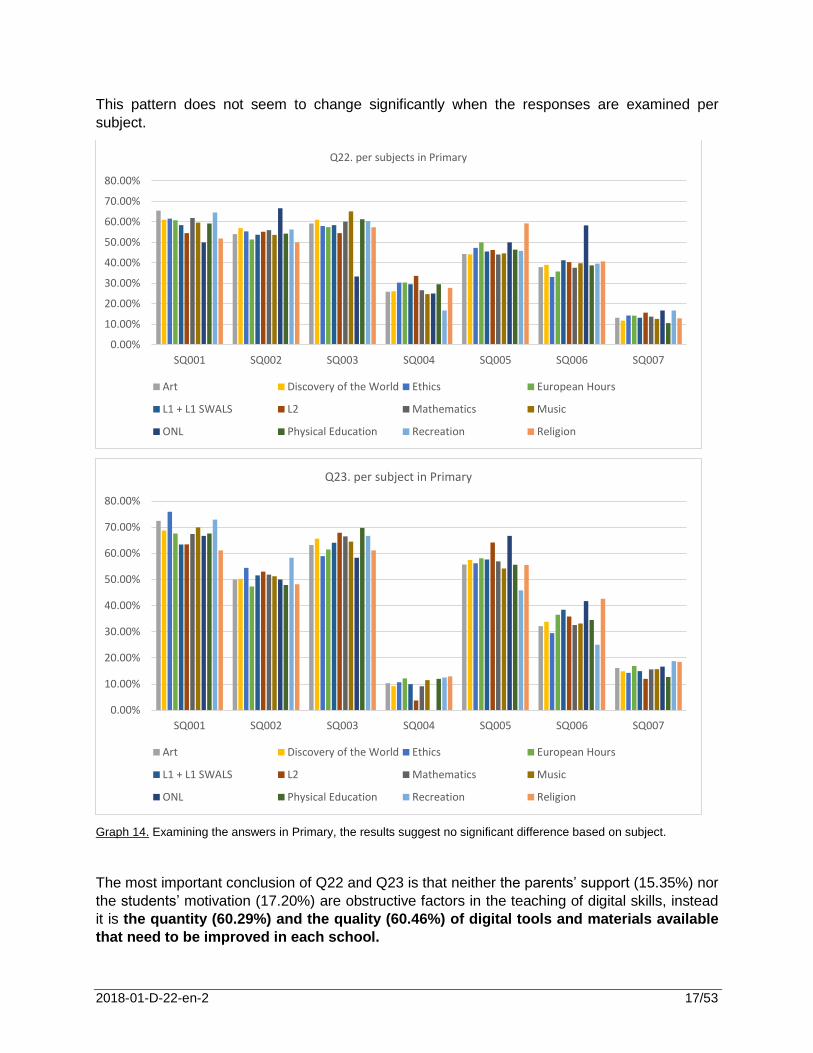
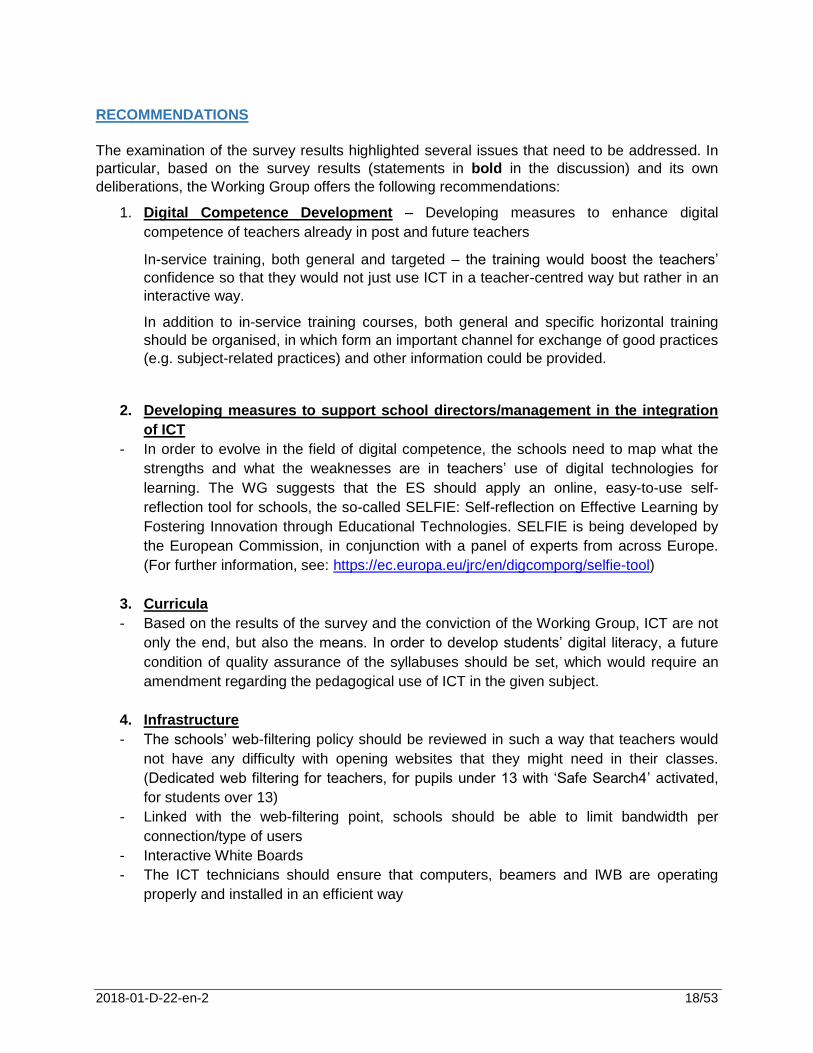
[Q22] Which of the factors listed below most support the teaching of digital skills at school in your opinion? Please choose up to three factors that you consider to be the most important.
Please choose all that apply:
1. Adequate number of digital tools
2. The quality of IT user/educational technological support
3. Accessibility and selection of quality digital teaching materials
4. The level of interest and motivation amongst students in studying with the help of digital tools
5. The opportunity to attend (in-service) training courses
2018-01-D-22-en-2 33/53
6. The opportunity to learn from other teachers in the school (e.g. sharing experience, materials,
observing lessons)
7. Parents support the use of digital tools
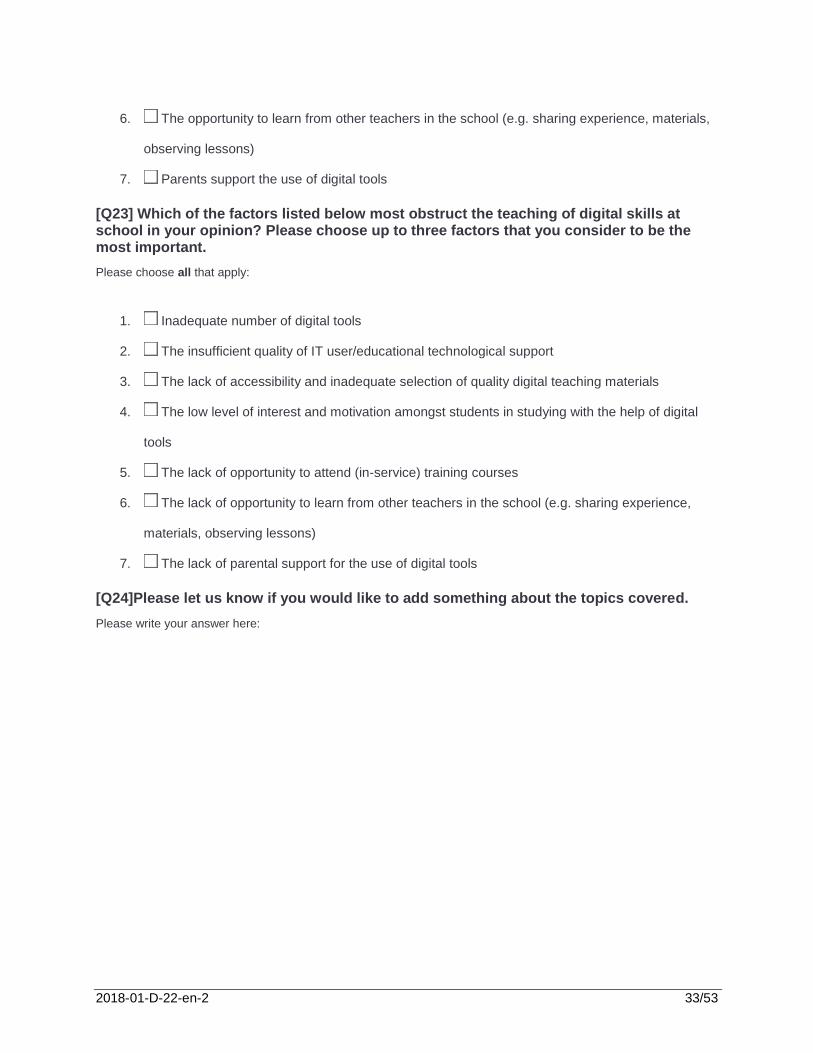
[Q23] Which of the factors listed below most obstruct the teaching of digital skills at school in your opinion? Please choose up to three factors that you consider to be the most important.
Please choose all that apply:
1. Inadequate number of digital tools
2. The insufficient quality of IT user/educational technological support
3. The lack of accessibility and inadequate selection of quality digital teaching materials
4. The low level of interest and motivation amongst students in studying with the help of digital
tools
5. The lack of opportunity to attend (in-service) training courses
6. The lack of opportunity to learn from other teachers in the school (e.g. sharing experience,
materials, observing lessons)
7. The lack of parental support for the use of digital tools
[Q24]Please let us know if you would like to add something about the topics covered.
Please write your answer here:
2018-01-D-22-en-2 34/53
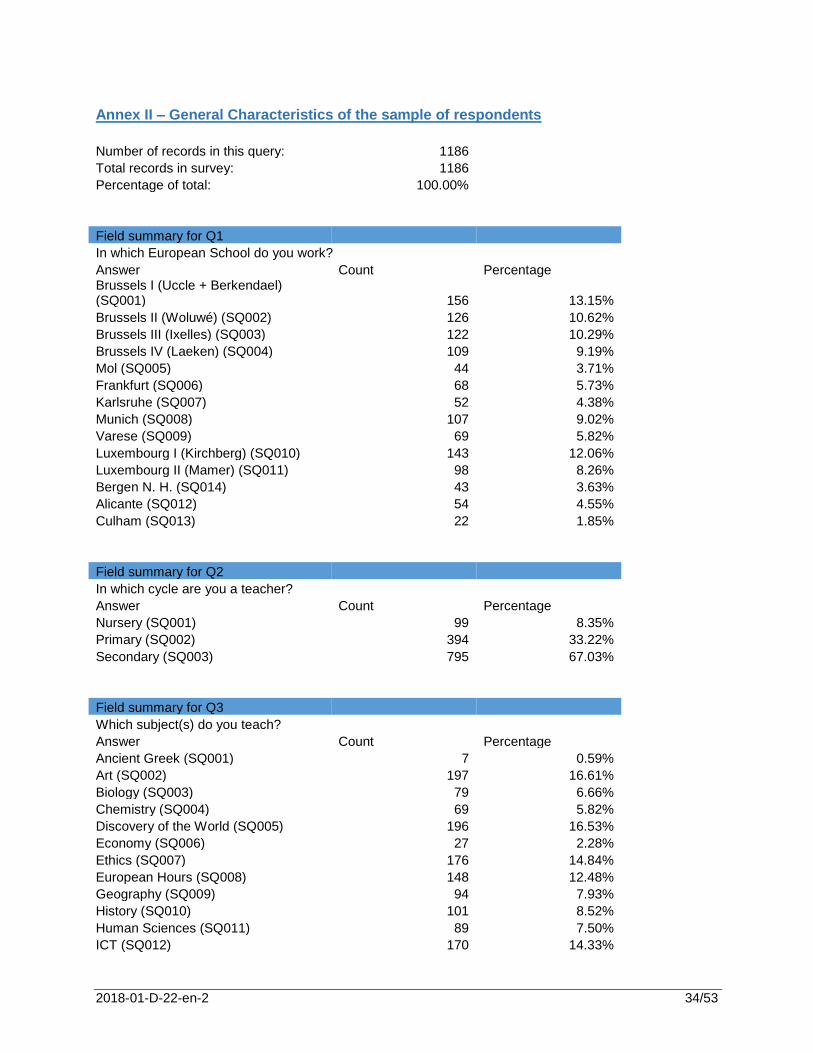
Annex II – General Characteristics of the sample of respondents
Number of records in this query: 1186 Total records in survey: 1186 Percentage of total: 100.00%
Field summary for Q1
In which European School do you work? Answer Count Percentage
Brussels I (Uccle + Berkendael) (SQ001) 156 13.15%
Brussels II (Woluwé) (SQ002) 126 10.62%
Brussels III (Ixelles) (SQ003) 122 10.29%
Brussels IV (Laeken) (SQ004) 109 9.19%
Mol (SQ005) 44 3.71%
Frankfurt (SQ006) 68 5.73%
Karlsruhe (SQ007) 52 4.38%
Munich (SQ008) 107 9.02%
Varese (SQ009) 69 5.82%
Luxembourg I (Kirchberg) (SQ010) 143 12.06%
Luxembourg II (Mamer) (SQ011) 98 8.26%
Bergen N. H. (SQ014) 43 3.63%
Alicante (SQ012) 54 4.55%
Culham (SQ013) 22 1.85%
Field summary for Q2
In which cycle are you a teacher? Answer Count Percentage
Nursery (SQ001) 99 8.35%
Primary (SQ002) 394 33.22%
Secondary (SQ003) 795 67.03%
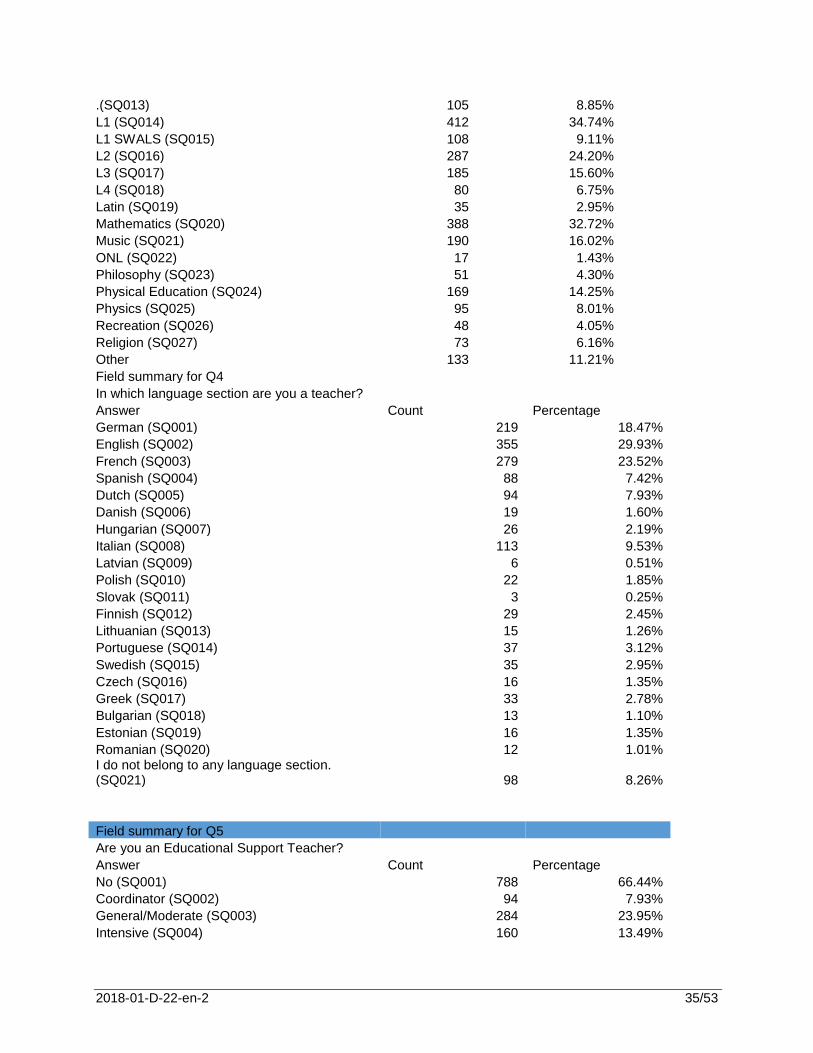
Field summary for Q3
Which subject(s) do you teach? Answer Count Percentage
Ancient Greek (SQ001) 7 0.59%
Art (SQ002) 197 16.61%
Biology (SQ003) 79 6.66%
Chemistry (SQ004) 69 5.82%
Discovery of the World (SQ005) 196 16.53%
Economy (SQ006) 27 2.28%
Ethics (SQ007) 176 14.84%
European Hours (SQ008) 148 12.48%
Geography (SQ009) 94 7.93%
History (SQ010) 101 8.52%
Human Sciences (SQ011) 89 7.50%
ICT (SQ012) 170 14.33%
2018-01-D-22-en-2 35/53
.(SQ013) 105 8.85%
L1 (SQ014) 412 34.74%
L1 SWALS (SQ015) 108 9.11%
L2 (SQ016) 287 24.20%
L3 (SQ017) 185 15.60%
L4 (SQ018) 80 6.75%
Latin (SQ019) 35 2.95%
Mathematics (SQ020) 388 32.72%
Music (SQ021) 190 16.02%
ONL (SQ022) 17 1.43%
Philosophy (SQ023) 51 4.30%
Physical Education (SQ024) 169 14.25%
Physics (SQ025) 95 8.01%
Recreation (SQ026) 48 4.05%
Religion (SQ027) 73 6.16%
Other 133 11.21%
Field summary for Q4
In which language section are you a teacher? Answer Count Percentage
German (SQ001) 219 18.47%
English (SQ002) 355 29.93%
French (SQ003) 279 23.52%
Spanish (SQ004) 88 7.42%
Dutch (SQ005) 94 7.93%
Danish (SQ006) 19 1.60%
Hungarian (SQ007) 26 2.19%
Italian (SQ008) 113 9.53%
Latvian (SQ009) 6 0.51%
Polish (SQ010) 22 1.85%
Slovak (SQ011) 3 0.25%
Finnish (SQ012) 29 2.45%
Lithuanian (SQ013) 15 1.26%
Portuguese (SQ014) 37 3.12%
Swedish (SQ015) 35 2.95%
Czech (SQ016) 16 1.35%
Greek (SQ017) 33 2.78%
Bulgarian (SQ018) 13 1.10%
Estonian (SQ019) 16 1.35%
Romanian (SQ020) 12 1.01% I do not belong to any language section. (SQ021) 98 8.26%
Field summary for Q5
Are you an Educational Support Teacher? Answer Count Percentage
No (SQ001) 788 66.44%
Coordinator (SQ002) 94 7.93%
General/Moderate (SQ003) 284 23.95%
Intensive (SQ004) 160 13.49%
2018-01-D-22-en-2 36/53
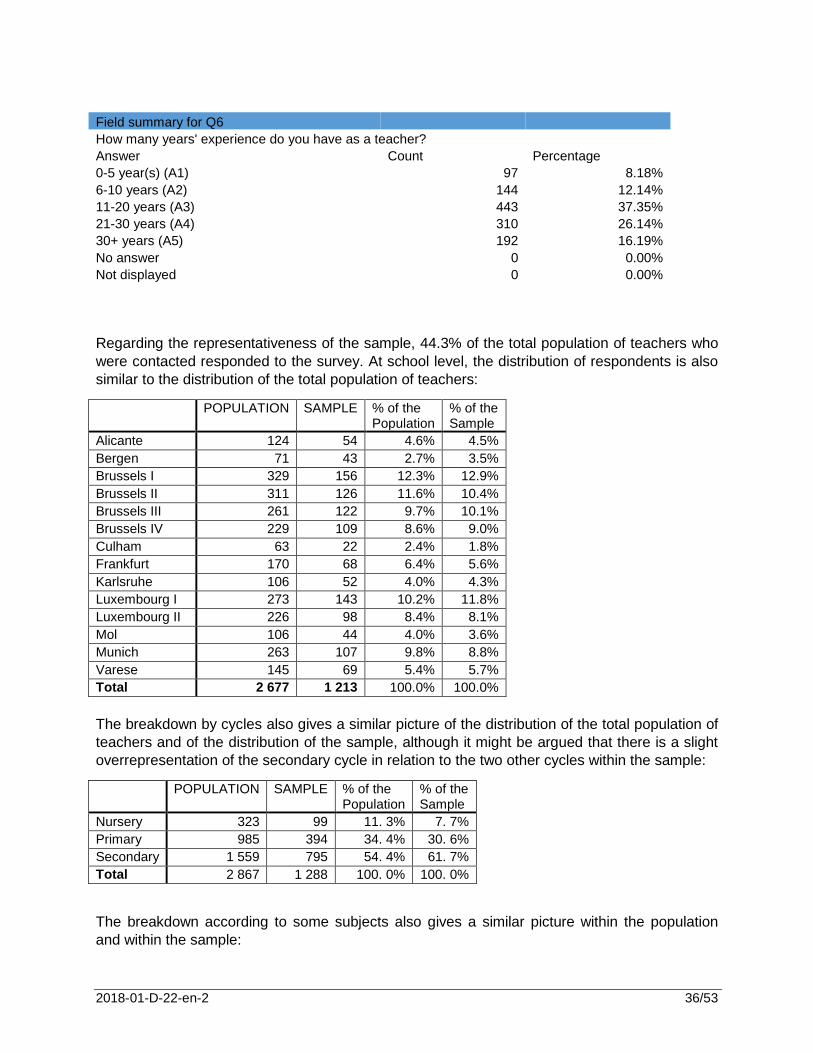
Field summary for Q6
How many years' experience do you have as a teacher?
Answer Count Percentage
0-5 year(s) (A1) 97 8.18%
6-10 years (A2) 144 12.14%
11-20 years (A3) 443 37.35%
21-30 years (A4) 310 26.14%
30+ years (A5) 192 16.19%
No answer 0 0.00%
Not displayed 0 0.00%
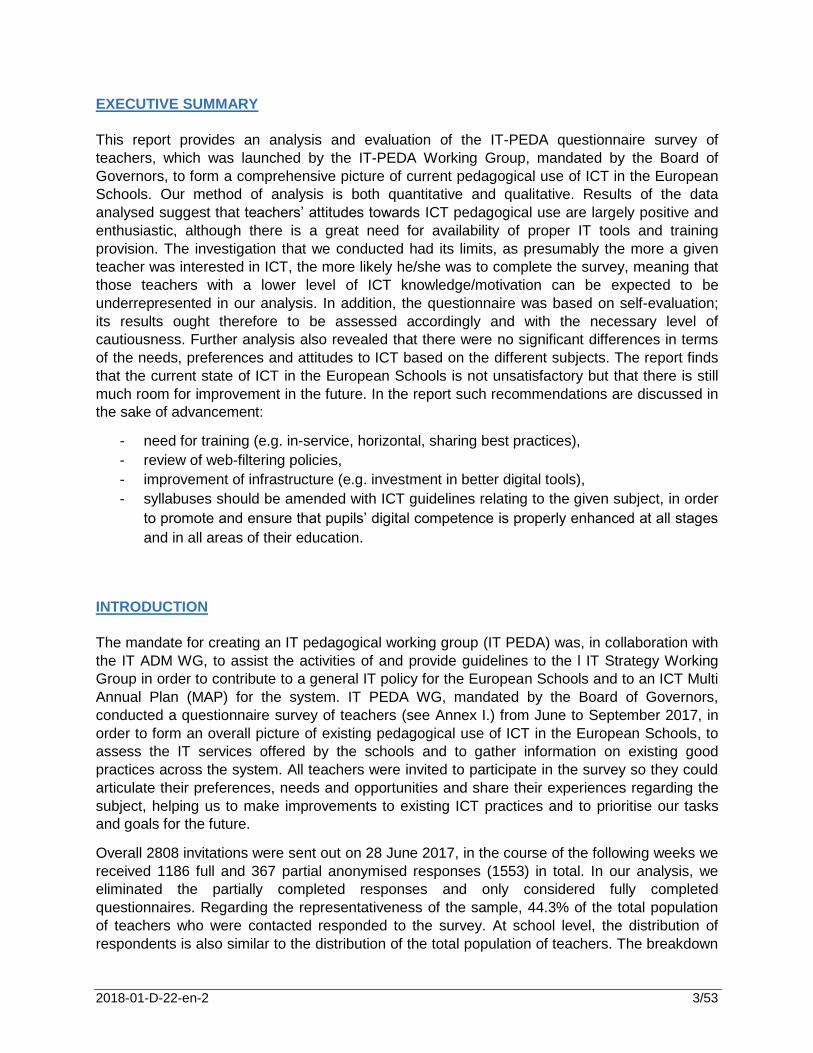
Regarding the representativeness of the sample, 44.3% of the total population of teachers who
were contacted responded to the survey. At school level, the distribution of respondents is also
similar to the distribution of the total population of teachers:
POPULATION SAMPLE % of the Population
% of the Sample
Alicante 124 54 4.6% 4.5%
Bergen 71 43 2.7% 3.5%
Brussels I 329 156 12.3% 12.9%
Brussels II 311 126 11.6% 10.4%
Brussels III 261 122 9.7% 10.1%
Brussels IV 229 109 8.6% 9.0%
Culham 63 22 2.4% 1.8%
Frankfurt 170 68 6.4% 5.6%
Karlsruhe 106 52 4.0% 4.3%
Luxembourg I 273 143 10.2% 11.8%
Luxembourg II 226 98 8.4% 8.1%
Mol 106 44 4.0% 3.6%
Munich 263 107 9.8% 8.8%
Varese 145 69 5.4% 5.7%
Total 2 677 1 213 100.0% 100.0%
The breakdown by cycles also gives a similar picture of the distribution of the total population of
teachers and of the distribution of the sample, although it might be argued that there is a slight
overrepresentation of the secondary cycle in relation to the two other cycles within the sample:
POPULATION SAMPLE % of the Population
% of the Sample
Nursery 323 99 11. 3% 7. 7%
Primary 985 394 34. 4% 30. 6%
Secondary 1 559 795 54. 4% 61. 7%
Total 2 867 1 288 100. 0% 100. 0%
The breakdown according to some subjects also gives a similar picture within the population
and within the sample:
2018-01-D-22-en-2 37/53
POPULATION SAMPLE % of the Population
% of the Sample
Ancient Greek 12 7 0.2% 0.2%
Art 530 197 6.8% 5.6%
Biology 249 79 3.2% 2.2%
Chemistry 105 69 1.3% 1.9%
Discovery of the World
456 196 5.8% 5.5%
Economy 58 27 0.7% 0.8%
Ethics 423 176 5.4% 5.0%
European Hours 286 148 3.7% 4.2%
Geography 189 94 2.4% 2.6%
History 193 101 2.5% 2.8%
Human Sciences 160 89 2.0% 2.5%
ICT* 141 170 1.8% 4.8%
Integrated Science 185 105 2.4% 3.0%
Language 1 1 074 520 13.8% 14.7%
Language 2 629 287 8.1% 8.1%
Language 3 326 185 4.2% 5.2%
Language 4 106 80 1.4% 2.3%
Latin 62 35 0.8% 1.0%
Mathematics 1 134 388 14.5% 10.9%
Music 440 190 5.6% 5.4%
ONL 45 17 0.6% 0.5%
Philosophy 122 51 1.6% 1.4%
Physical Education 546 169 7.0% 4.8%
Physics 120 95 1.5% 2.7%
Religion 219 73 2.8% 2.1%
7 810 3 548 100.0% 100.0%
*This is a paradox: the ICT teachers are overrepresented in the sample because there are more teachers who responded that they teach ICT than we have registered in the population.
This can be explained either because of the beliefs and subjectivity of the respondents and/or because some (a large number of) ICT teachers were not recorded as such in SMS.
2018-01-D-22-en-2 38/53
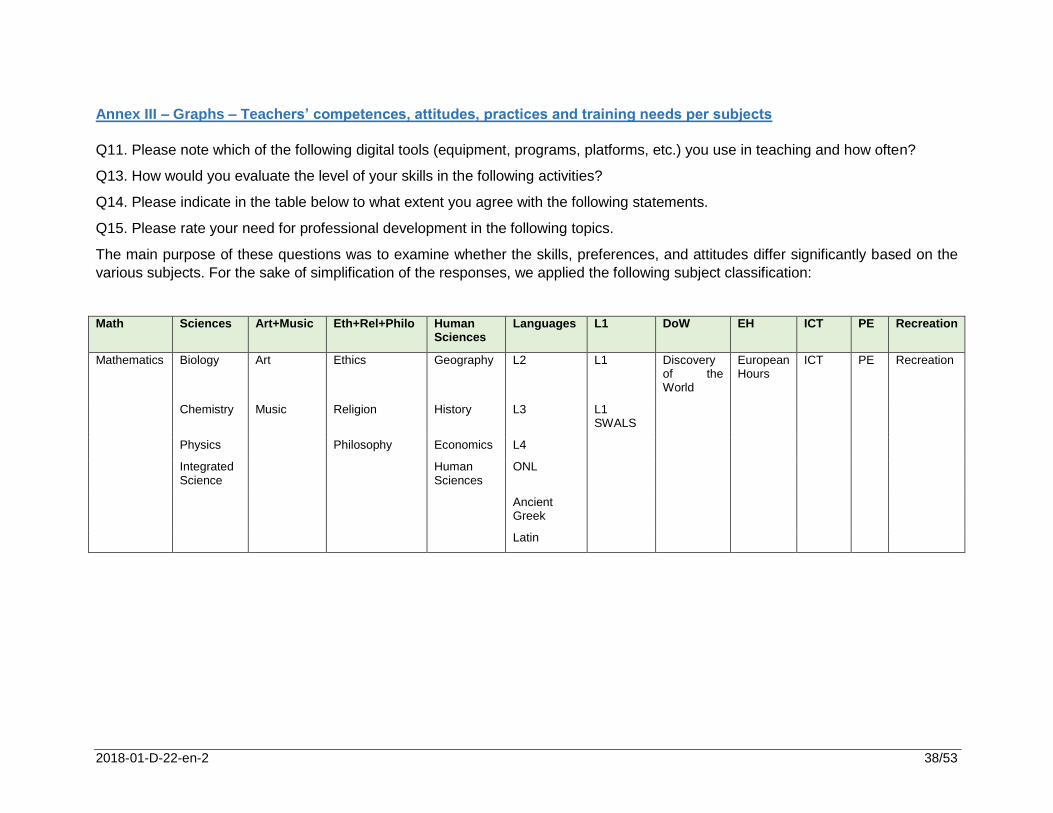
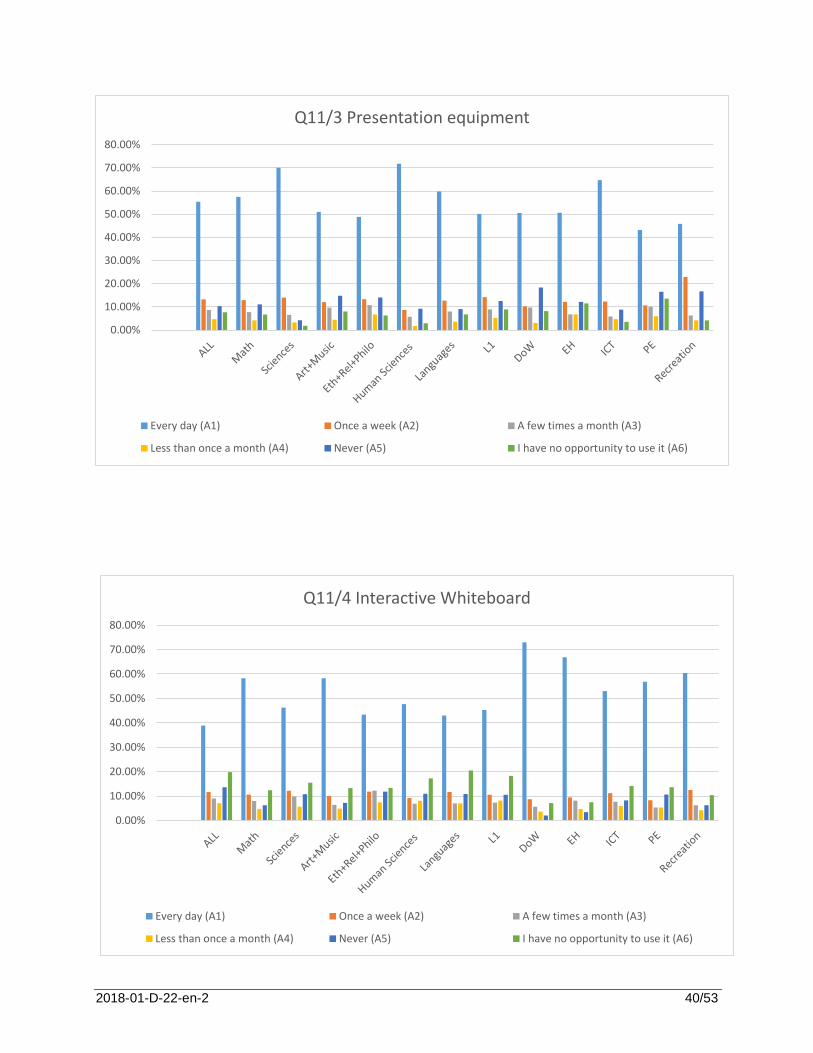
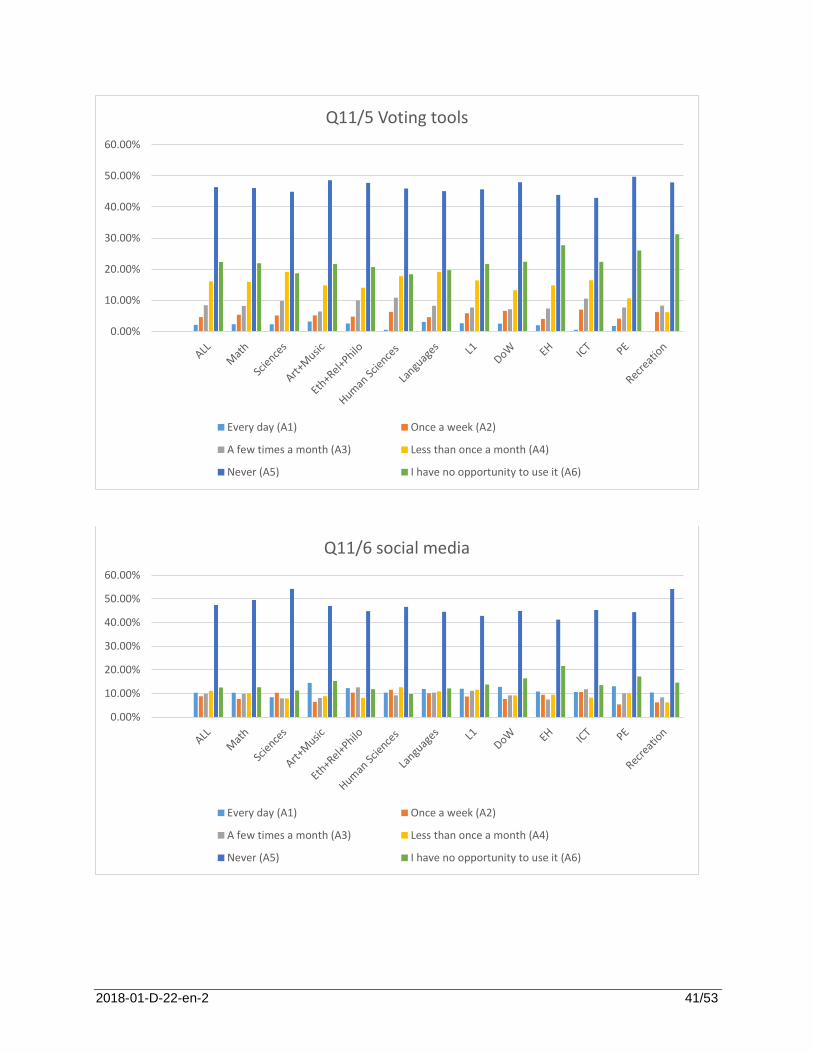
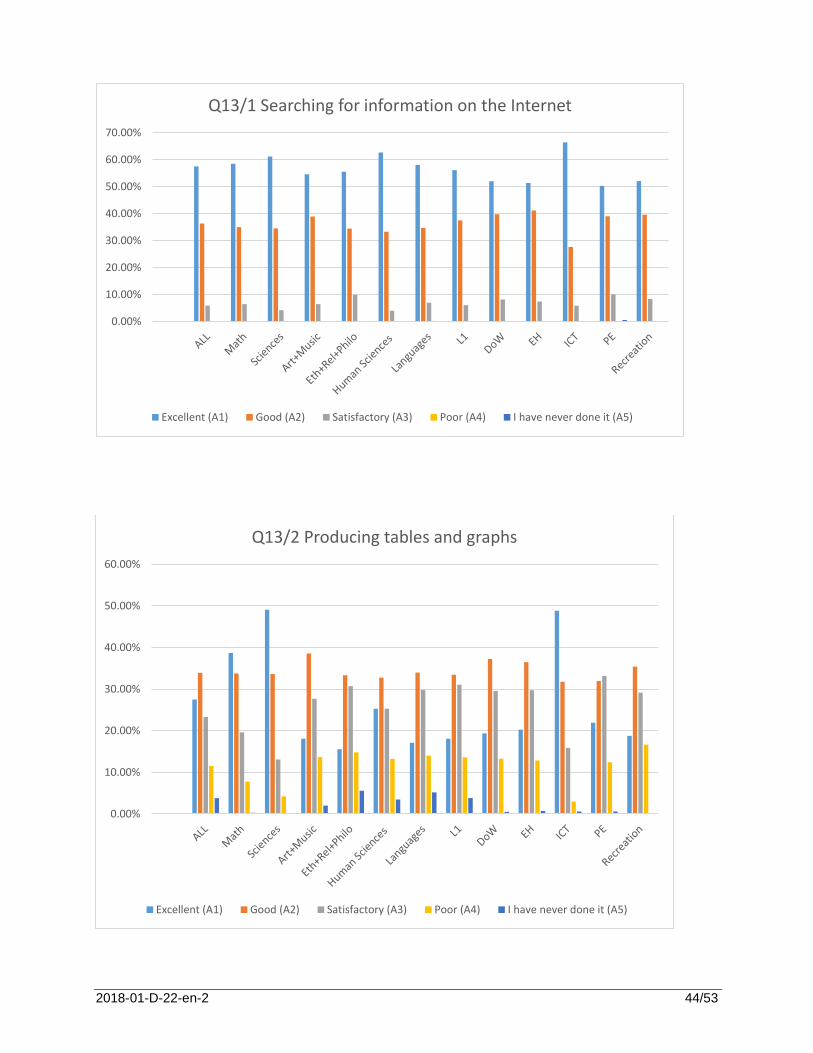
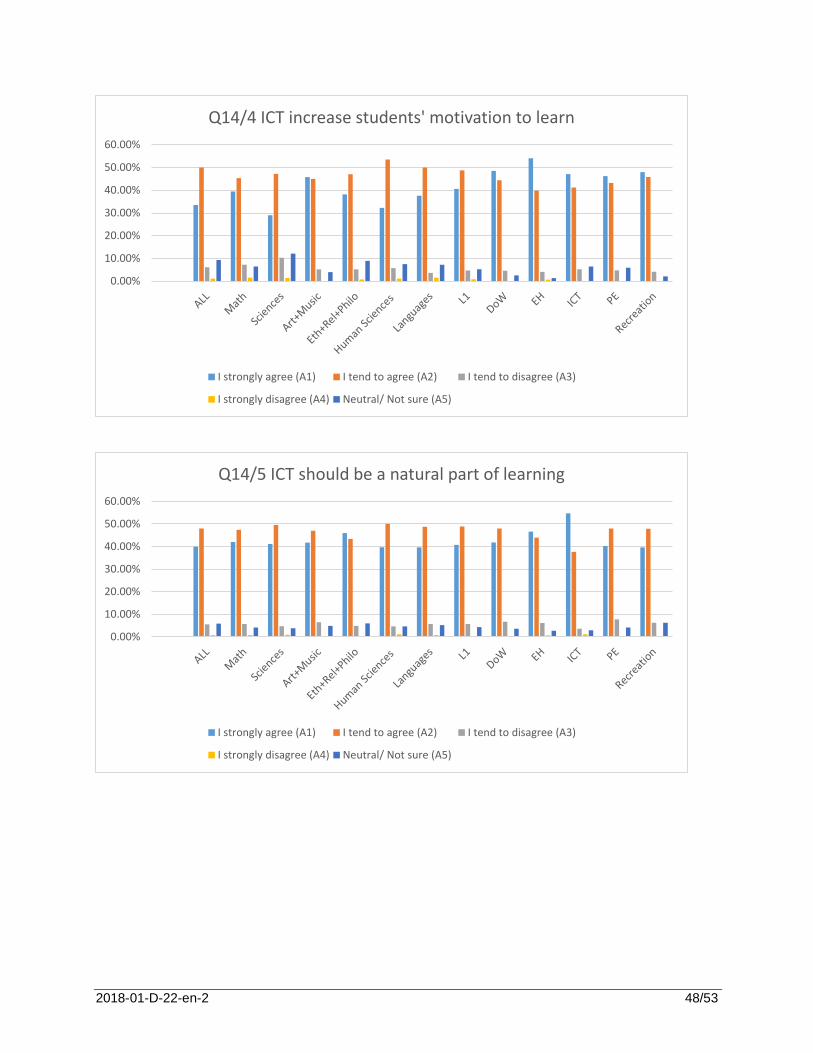
Annex III – Graphs – Teachers’ competences, attitudes, practices and training needs per subjects
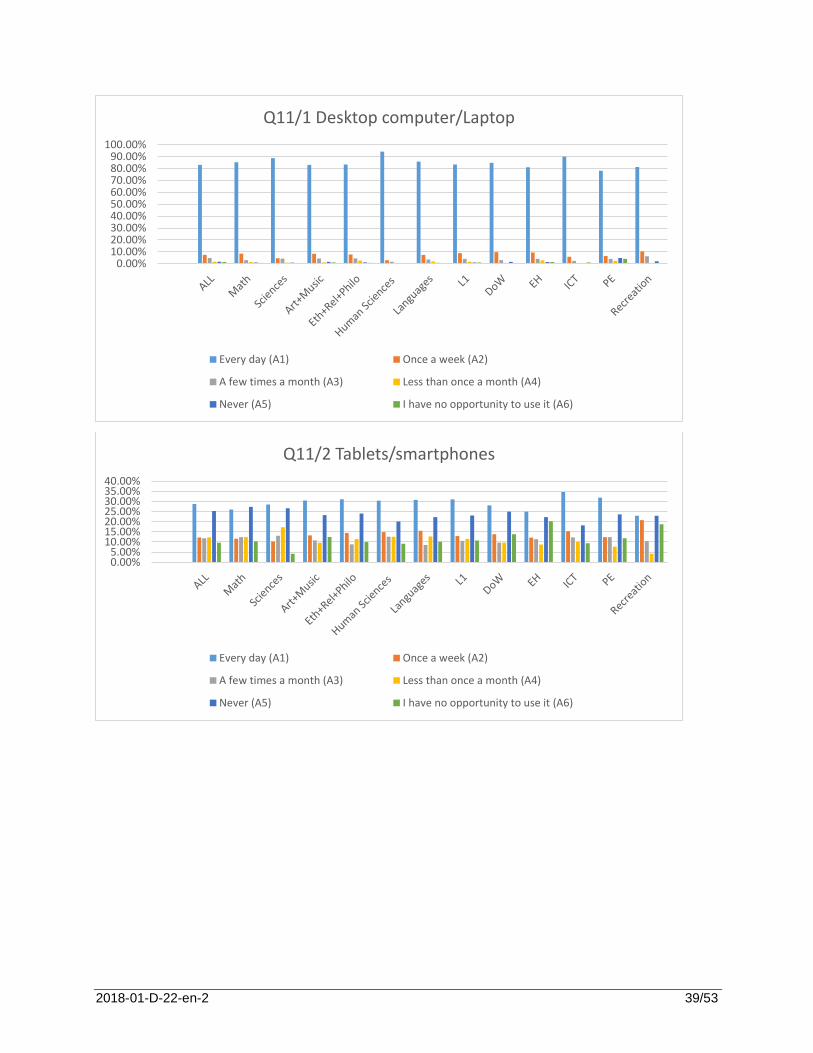
Q11. Please note which of the following digital tools (equipment, programs, platforms, etc.) you use in teaching and how often?
Q13. How would you evaluate the level of your skills in the following activities?
Q14. Please indicate in the table below to what extent you agree with the following statements.
Q15. Please rate your need for professional development in the following topics.
The main purpose of these questions was to examine whether the skills, preferences, and attitudes differ significantly based on the
various subjects. For the sake of simplification of the responses, we applied the following subject classification:
Math Sciences Art+Music Eth+Rel+Philo Human Sciences
Languages L1 DoW EH ICT PE Recreation
Mathematics Biology Art Ethics Geography L2 L1 Discovery of the World