NASA DEVELOP National Program GIS Training and Research Center, Pocatello, Idaho Summer 2015 Idaho Disasters III Using Landsat Earth Observations to identify increased fire susceptibility due to invasion of cheatgrass (Bromus tectorum L.) Technical Report Final Draft - August 6, 2015 Jeff May (Project Lead) Jenna Williams Zachary Simpson Keith Weber, ISU (Science Advisor) John Schnase, GSFC (Science Advisor) Mark Carroll, GSFC (Science Advisor Previous Contributors: Kiersten Newtoff Andrea Bodenburg Kyle E. Sowder Katherine Bradford Eric Smith
Transcript
NASA DEVELOP National Program
GIS Training and Research Center, Pocatello, Idaho
Summer 2015
Idaho Disasters III Using Landsat Earth Observations to identify increased fire
susceptibility due to invasion of cheatgrass (Bromus tectorum L.)
Technical Report Final Draft - August 6, 2015
Jeff May (Project Lead)
Jenna Williams Zachary Simpson
Keith Weber, ISU (Science Advisor)
John Schnase, GSFC (Science Advisor) Mark Carroll, GSFC (Science Advisor
Previous Contributors: Kiersten Newtoff
Andrea Bodenburg Kyle E. Sowder
Katherine Bradford Eric Smith
1
I. Abstract Wildfires, coupled with the presence of invasive plant species, are primary drivers of change in semi-arid savanna ecosystems. These wildfires disrupt ecosystems, human localities, critical habitats of threatened Greater Sage Grouse, Centrocercus urophasianus (Bonaparte, 1827), and create opportunities for invasive species to expand their populations. Wildland fire regimes have changed dramatically due to cheatgrass (Bromus tectorum L.), an invasive annual grass, which has effectively lengthened the wildfire season and increased fire frequency. Cheatgrass’ ability to quickly establish in disturbed areas creates a positive feedback cycle with wildland fire, resulting in landscapes that burn more frequently and become increasingly dominated by this invasive plant. This creates a need for more advanced landscape and wildfire monitoring tools that can identify the prominence of invasive plants in order to provide better information regarding fire susceptibility. Currently, there are no active cheatgrass management plans in Idaho due to the overwhelming capabilities of the plant to dominate landscapes. However, effective management of this species requires knowledge of its distribution in order to evaluate wildfire regimes and prevent cheatgrass expansion in recently disturbed landscapes. This study used spring and summer 2013, 2014, and 2015 imagery from Landsat 8 Operational Land Imager (OLI) and decision-tree-based classification to create a vegetation distribution map of SE Idaho that identified cheatgrass (74% accuracy) and was subsequently used to create a fire susceptibility map (r2: 0.67) for the study area. These results enhance the decision making processes of the Bureau of Land Management and Idaho Department of Land with respect to resource allocations and supports post-fire rehabilitation planning and fuel reduction programs. Keywords Remote sensing, wildland fire, cheatgrass, fire susceptibility, semi-arid savanna, ecosystem change
II. Introduction
Overview Wildfire is a primary driver of change in the semi-arid savanna ecosystems. Though fire often plays an essential role in wildland ecology and helps maintain natural processes, too many occurrences of wildfire can induce a loss of biodiversity, disrupt ecosystems, and deplete resources (Oppenheimer, 2013; Whisenant S.G., 1990). Estimates of annual wildland fire costs have tripled from less than $1 billion in the 1990’s to more than $3 billion on average since 2002 (Gorte, 2013). However, the costs of wildfire management may be much more as these assessments reflect the direct suppression and protection costs of the federal government but did not consider local and state expenditures. It is
2
estimated that the Bureau of Land Management spends about $40/ha in fire protection efforts and around $77/ha in land rehabilitation after a fire occurs. (Pellant & Abbey et al., 2004). A twenty-seven yearlong study conducted by Dennison & Brewer et al., found that the total fire area across the western United States, has increased on average at a rate of 355 km² (221 mi²) per year, effectively increasing fire suppression and protection expenditures (Dennison & Brewer et al., 2014). It is broadly accepted that a primary driver of expanding wildfire regimes is the prominences of Bromus tectorum L., henceforth referred to by its common name, cheatgrass. Cheatgrass has become prominent in Idaho Rangelands and has overwhelmed native the native vegetation. It is a self-pollinating winter annual and can germinate in the fall or early spring. This species is responsible for the transformation of sagebrush dominated landscapes into cheatgrass dominated monocultures (Mealor & Mealor et al., 2013; Brooke & Antonio et al., 2010; Peters & Bunting, 1994). Cheatgrass outcompetes native plants by consuming resources before the growth cycle of native species can begin. Its seeds can remain viable for up to five years, making this plant resilient to extended periods of drought (Pellant, 1996). Researchers suggest that cheatgrass dominates 2.5 million ha (6.2 million acres) of former sagebrush-grass rangelands in southern Idaho and roughly 10.1 million ha (25 million acres) in the Great Basin (Pellant et al., 2004; Laycock, 1991). This mass invasion is thought to have been aggravated by overgrazing, land misuse and abandonment, and an expansion of fire regimes (Laycock, 1991). A study by Balch, J. K et al., conducted in 2013 found that cheatgrass-dominated landscapes were four times more likely to ignite than native vegetation types. This twenty-year study documented that these cheatgrass controlled landscapes were more vulnerable to the largest fires recorded (Balch & Bradley et al., 2013). Cheatgrass is flammable 4 to 6 weeks sooner than native plants and is susceptible to wildfire 1 to 2 months longer than native perennials (Platt & Jackman, 1946); this has effectively extended the fire season and has caused landscapes to burn more frequently (Mealor et al., 2013; Pellant, 1996; Stewart & Hull, 1949). An excess of desiccated cheatgrass has increased the frequency of wildland fires with intervals now less than 5 years on average in certain southern Idaho rangelands (Chen & Weber et al., 2001; Pellant, 1996). There have been numerous studies that have attempted to delineate cheatgrass from the landscape using remotely sensed technologies. Landsat TM/ETM+, Advanced Very High Resolution Radiometer, and Moderate Resolution Imaging Sprectro-radiometer (MODIS) have been used to detect the amplified response of cheatgrass to precipitation using the Normalized Differenced Vegetation Index (NDVI) (Clinton & Potter et al., 2010; Bradley & Mustard, 2005). Other studies have leveraged the unique
3
phenology (green-up and senescence) of cheatgrass to map its distribution from differenced images combined and various classification methods(Dudley & Dennison et al., 2015; Bradley & Mustard, 2008; Baraldi & Puzzolo et al., 2006; Peterson, 2003). This study combined the Modified Soil Adjusted Index (mSAVI2) (Qi & Chehbouni et al., 1994), Normalized Differenced Bare Soil Index (NDBSI) (Baraldi et al., 2006), Tasseled Cap Transformation (TCT) (Kauth & Thomas, 1976) derived from NASA’s Landsat 8 earth observations, and topographic data in Classification Tree Analysis (Zambon & Lawrence et al., 2006) to produce a fuel distribution model and subsequent fire susceptibility model. MSAVI2 was chosen as a proxy for greenness in the fuel classification model over the Normalized Differenced Vegetation Index (NDVI) due to NDVI’s sensitivity to bare ground reflectance, which results in overestimations of reflectance at a given pixel where there is a large proportion of bare ground (Rondeaux & Steven et al., 1996; Qi et al., 1994). Unlike Burgan’s fire potential model, the susceptibility model developed in study explicitly analyzes landscape and vegetation condition irrespective of climate variables (Burgan et al., 1998). However, climate variables were leveraged to identify time periods with phenologically synchronous characteristics regarding cheatgrass growth.
Objectives The objectives of this study were to create a fuel model using imagery acquired from the Landsat 8 Operational Land Imager (OLI), classified using decision-tree-based methods to identify areas with higher presence of cheatgrass. The classified fuel model will be subsequently used for the creation of a fire susceptibility model (FSM) that quantifies fire susceptibility, defined as landscape combustibility respective to fuel type and topography. These two model will support the decision making of land managers responsible for coordinating wildfire risk prevention and other wildfire related activities
Study Area The study focuses on southeastern Idaho (Landsat WRS-2 path 39 row 30) encompassing semi-arid savanna rangelands and montane forest regions (fig. 1). The area is characterized by the Snake River Plains, which stretches east to west 640 km (400 miles) from Wyoming to Oregon and was formed as a result of the North American tectonic plate moving over the Yellowstone hotspot. Geologists believe that this hotspot was formed approximately
Figure 1 - Study area and extent within Idaho. Image from Landsat 8 OLI
4
16 million years ago and has traced a path through the landscape to its present location, Yellowstone National Park (Smith & Braile, 1994). This volcanic activity has modified the landscape, creating a 110 km (70 mile) channel that has crosscut the basin and range patterns of the Rocky Mountains and has significantly altered the climate of this area. From Yellowstone, the Snake River flows west through the desiccated countryside and sustains a tremendous diversity of plant and animal species. Throughout the study region, there exists critical habitat designations for Greater Sage-Grouse, a species that is currently threatened. The state of Idaho has a strong interest in habitat restoration as fire suppression expenditures are given priority in order to protect these delicate habitats.
Project partners This project falls under the National Aerospace Science Administration (NASA) Natural Disaster Applications Area seeking to improve wildfire susceptibility forecasting and enhance land management practices and decision making by providing fire related information products. The Bureau of Land Management (BLM) and Idaho Department of Lands (IDL) are the primary end-users for this project. Currently, these agencies rely on in-situ vegetation moisture measurements to support decisions regarding resource allocation across fire management zones throughout Idaho. Due to the large extent of the area of concern, field observations are not capable of providing a comprehensive assessment of vegetation distribution throughout the agency’s respective management zone. Furthermore, the positive feedback cycle between cheatgrass and wildland fire is well understood (Brooks et al., 2010) within these organizations, but there is no process currently implemented that communicates cheatgrass distribution information to decision makers.
III. Methodology
Data Acquisition Satellite Imagery Level 1T Landsat 8 OLI imagery was acquired from the United States Geological Survey’s (USGS) Earth Explorer for WRS-2 path 39 row 30. The study period for this project encapsulated April through September 2013, 2014 and April through June, 2015. Twenty-three images in total were obtained from Landsat 8 OLI. Corrections for atmospheric effects were applied to the imagery using the Cos(t) atmospheric correction model. Calculations to derive surface reflectance from multispectral bands were computed using the IDRISI TerrSet Landsat Import Archive module.
5
The phenology of a region changes between years and the phenological synchronizations of satellite imagery allows for stronger analysis of remotely sensed imagery regarding land cover change (Weber, 2000). Season and environmental conditions, especially perception and temperature, play a strong role in cheatgrass germination (Richards, 2013; Roundy et al., 2007; Miller & Franklin, 2002) Phenologically synchronous images were identified using historic meteorological data was obtained from the Bureau of Reclamation’s AgriMet weather system. Agrimet is a cooperative agricultural weather network that collects and archives weather data from stations around the Pacific Northwest. Minimum, maximum, and average daily air temperatures were evaluated with daily precipitation in order to determine when cheatgrass was photosynthetically active, while native plant species were dormant. Specifically, days where precipitation was observed were scrutinized to identify cheatgrass location. Temperature and precipitation were then analyzed to determine the days when cheatgrass green up would be more active. This data was used to identify, from the acquired Landsat 8 OLI images, which images were taken during active cheat grass growth. Pheno-Calc, a software package developed at the GIS Training and Research Center (http://giscenter.isu.edu), was used to match days of the year that are phenologically similar. The time period identified as meeting this criteria for active cheatgrass growth was a base temperature of 35 degrees Fahrenheit and a growing degree day (GDD) of 400 with a 10% tolerance. A study conducted by Boyte et al., indicate that 400 GDD are necessary to begin the cheatgrass growth cycle (Boyte et al., 2015). Pheno-Calc was used to analyze AgriMet historical meteorological records to determine GDD for each study year. Based on phenological similarities for early cheatgrass growth, three images were selected for this study that were suitable for maximum green-up of cheatgrass; May 15, 2013, April 16, 2014, and April 19, 2015 (Appendix A).
Figure 2 – Classification sites digitized over 2013 NAIP imagery
Classification Sites Four classes of land cover were analyzed: bare ground, cheatgrass, montane forest, and sagebrush/herbaceous. The classification dataset was created from digitized points from the 2013 National Agricultural Imagery Program (NAIP), Landsat 8 derived mSAVI2, and a classified cheatgrass map from Clinton et al., 2010. Also included in the classification dataset were in-situ point data from the University of Georgia’s Center for Invasive Species and Ecosystem Health, 2013 BLM summer field season, and Idaho State University GIS Training and Research Center’s 2014 and 2015 summer field season(fig. 2 – Appendix B). The dataset consisted of 397 classification sites in total: 61 bare ground, 124 cheatgrass, 61 montane forest, and 149 sagebrush/ herbaceous.
Data Processing Cloud masks were applied to the selected Landsat 8 OLI images prior to the deriving mSAVI2, TCT brightness, greenness, and wetness (Huang et al., 2002) and NDBSI indices. Ten-meter slope and aspect from the National Elevation Dataset (NED) was resampled to 30-meter resolution and included in the analysis based on expert knowledge that described the tendency of cheatgrass to grow on southern aspects and on slopes <30° (Mavor, personal communication, June 19, 2015). These data underwent standardization prior to being input into CTA. The data standardization process included ensuring all data was projected to WGS 84 UTM zone 12N and the number of rows and columns are consistent between all data. Standardization of rows and columns was accomplished by applying a window of 30,825 km2 (11,901 mi2) not extening past the boundary of any image used in CTA.
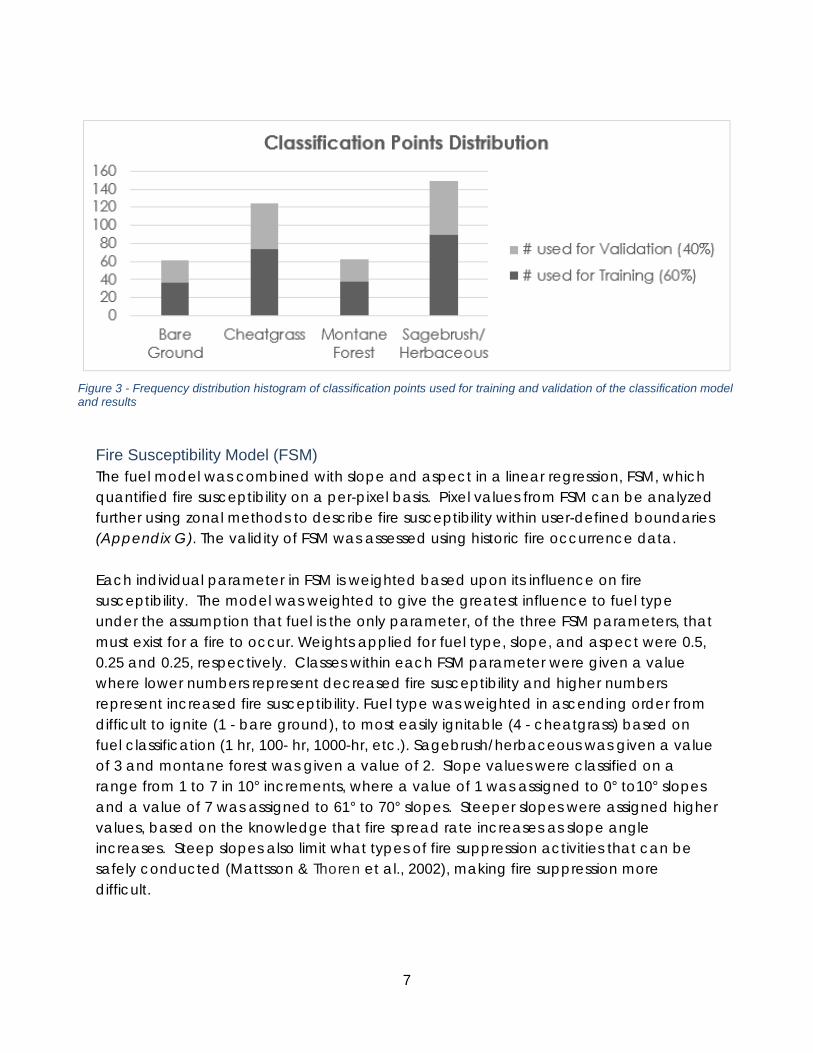
Data Analysis Fuel Classification Model CTA is a supervised, decision-tree based classification method described as being data driven and nonparametric (Miller & Franklin, 2002). Individual pixels are classified based upon spectral signatures exposed by the various vegetation indices through a random subset of the classification dataset. (Appendix C). Gini split method and 2% auto-pruning were specified in the classification. A training data subset equal to 60% of the classification points for each class were used to train the CTA classification model. CTA results were independently validated using the remaining 40% of the classification dataset (fig. 3).
7
Fire Susceptibility Model (FSM) The fuel model was combined with slope and aspect in a linear regression, FSM, which quantified fire susceptibility on a per-pixel basis. Pixel values from FSM can be analyzed further using zonal methods to describe fire susceptibility within user-defined boundaries (Appendix G). The validity of FSM was assessed using historic fire occurrence data. Each individual parameter in FSM is weighted based upon its influence on fire susceptibility. The model was weighted to give the greatest influence to fuel type under the assumption that fuel is the only parameter, of the three FSM parameters, that must exist for a fire to occur. Weights applied for fuel type, slope, and aspect were 0.5, 0.25 and 0.25, respectively. Classes within each FSM parameter were given a value where lower numbers represent decreased fire susceptibility and higher numbers represent increased fire susceptibility. Fuel type was weighted in ascending order from difficult to ignite (1 - bare ground), to most easily ignitable (4 - cheatgrass) based on fuel classification (1 hr, 100- hr, 1000-hr, etc.). Sagebrush/herbaceous was given a value of 3 and montane forest was given a value of 2. Slope values were classified on a range from 1 to 7 in 10° increments, where a value of 1 was assigned to 0° to10° slopes and a value of 7 was assigned to 61° to 70° slopes. Steeper slopes were assigned higher values, based on the knowledge that fire spread rate increases as slope angle increases. Steep slopes also limit what types of fire suppression activities that can be safely conducted (Mattsson & Thoren et al., 2002), making fire suppression more difficult.
Figure 3 - Frequency distribution histogram of classification points used for training and validation of the classification model and results
8
Southern facing aspects have a higher chance of ignition (Mattsson et al., 2002). This is due to prolonged sunlight exposure length and higher evapotranspiration rates creating favorable conditions for cheatgrass growth. Values were assigned based on expert knowledge and cheatgrass’ observed preference for southern aspects (Mavor, s., personal communication, June 19, 2015). These values ranged from 1 to 6 where the highest values were assigned to directly south facing slopes and decreased incrementally towards northerly facing slopes. Flat areas were assigned a value of 3 due to their average sun exposure. The sum of the parameter values multiplied by their respective weights produced a fire susceptibility value on a per-pixel basis from a range 0 to 5.5 ranking fire susceptibility on a 1 to 5.5 scale, reserving 0 values for areas where a mask is applied. To focus the results on areas where fire occurs, a mask was applied to the FSM results to remove cultivated fields, bodies of water and urbanized areas.
IV. Results & Discussion
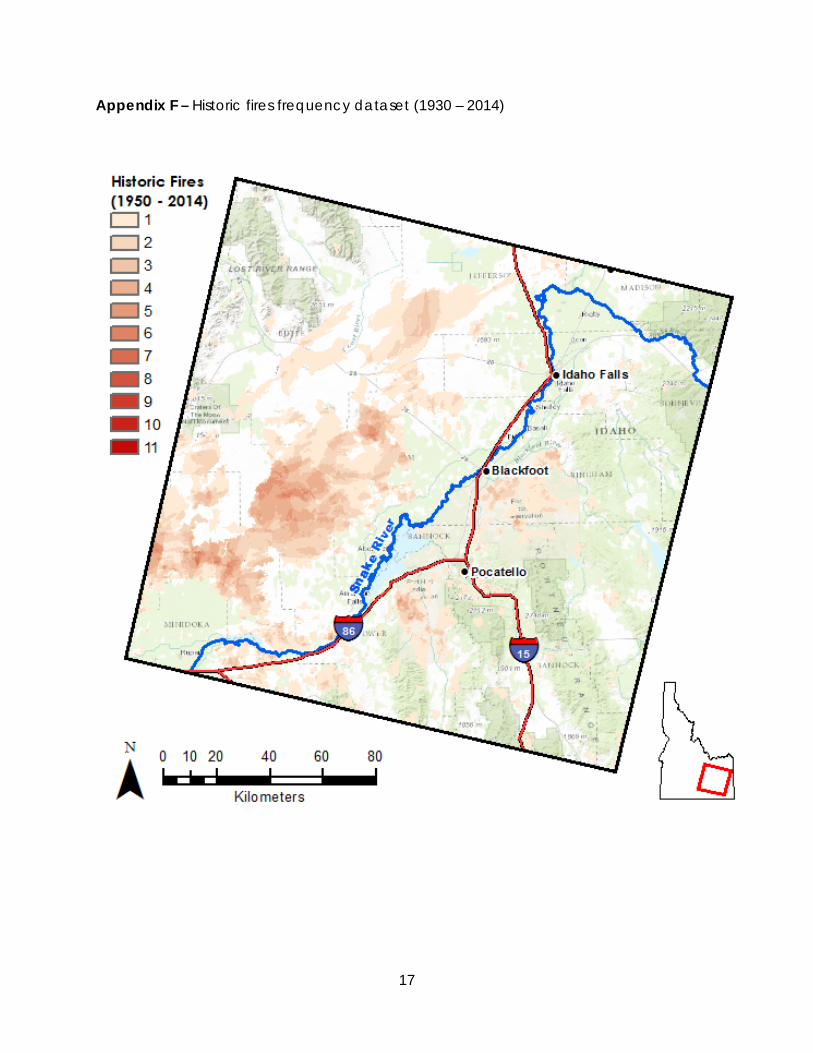
Results Accuracy assessment of the fuel model (fig. 4) produced an overall accuracy of 74% with a kappa coefficient of 0.67 (Appendix D). The pixel-based fire susceptibility model (fig. 5) had an r-squared value of 0.61 when compared to historic fires occurrence data (Appendix F). The validation of the fire susceptibility model was done under the assumption that areas that have higher fire return rates are more susceptible to fire. Examining the fuel model results, we see that the fuel models are driven by the classification of the fuel type. Due to the nature of cheatgrass to promote wildfire frequency, it is imperative that areas with high concentrations of cheatgrass be scrutinized thoroughly.
Figure 4 - Fuel model derived from Classification Tree Analysis
9
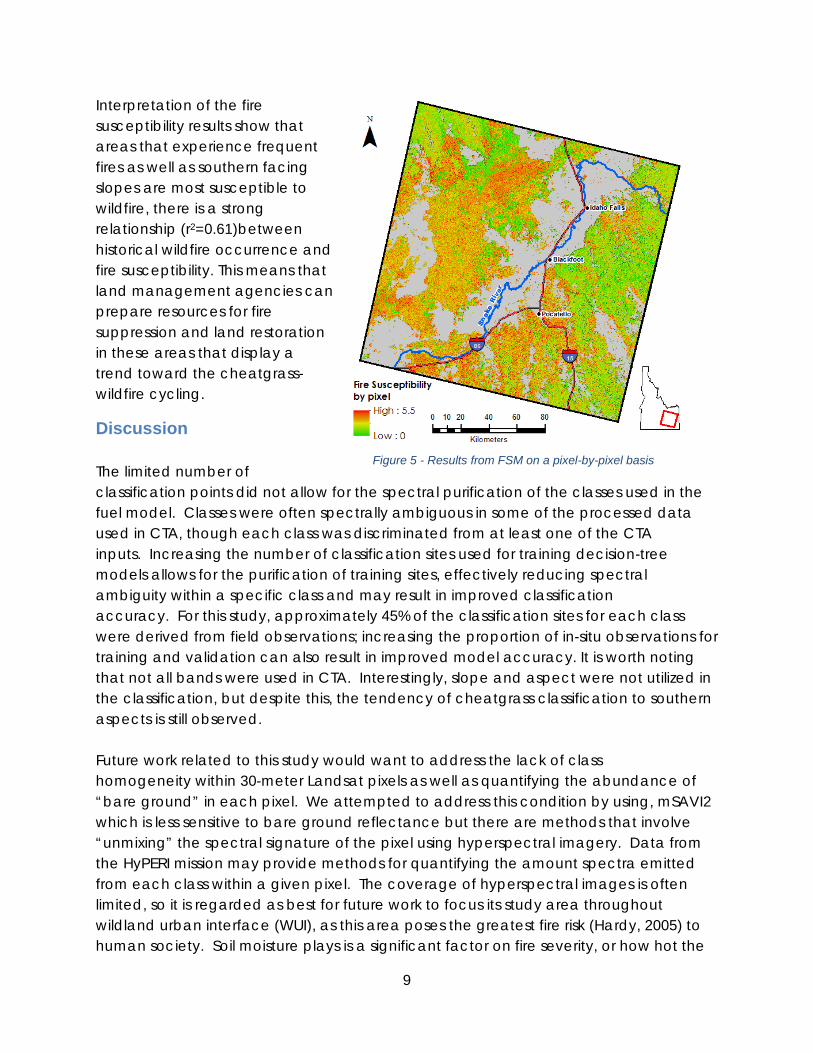
Interpretation of the fire susceptibility results show that areas that experience frequent fires as well as southern facing slopes are most susceptible to wildfire, there is a strong relationship (r2=0.61)between historical wildfire occurrence and fire susceptibility. This means that land management agencies can prepare resources for fire suppression and land restoration in these areas that display a trend toward the cheatgrass-wildfire cycling.
Discussion The limited number of classification points did not allow for the spectral purification of the classes used in the fuel model. Classes were often spectrally ambiguous in some of the processed data used in CTA, though each class was discriminated from at least one of the CTA inputs. Increasing the number of classification sites used for training decision-tree models allows for the purification of training sites, effectively reducing spectral ambiguity within a specific class and may result in improved classification accuracy. For this study, approximately 45% of the classification sites for each class were derived from field observations; increasing the proportion of in-situ observations for training and validation can also result in improved model accuracy. It is worth noting that not all bands were used in CTA. Interestingly, slope and aspect were not utilized in the classification, but despite this, the tendency of cheatgrass classification to southern aspects is still observed. Future work related to this study would want to address the lack of class homogeneity within 30-meter Landsat pixels as well as quantifying the abundance of “bare ground” in each pixel. We attempted to address this condition by using, mSAVI2 which is less sensitive to bare ground reflectance but there are methods that involve “unmixing” the spectral signature of the pixel using hyperspectral imagery. Data from the HyPERI mission may provide methods for quantifying the amount spectra emitted from each class within a given pixel. The coverage of hyperspectral images is often limited, so it is regarded as best for future work to focus its study area throughout wildland urban interface (WUI), as this area poses the greatest fire risk (Hardy, 2005) to human society. Soil moisture plays is a significant factor on fire severity, or how hot the
Figure 5 - Results from FSM on a pixel-by-pixel basis
10
fire burns and may also exhibit different characteristics in a cheatgrass dominated site compared to native vegetation. NASA’s Soil Moisture Active Passive (SMAP) root zone soil moisture data products could be leveraged to further identify areas dominated by cheatgrass or for estimating fire severity. Furthermore, fuel models, including the model created in this study, could be combined with gridded weather from the national oceanic and Atmospheric Administration (NOAA) to create advanced fire susceptibility forecasting models (Preisler et al., 2009)
V. Conclusions Detecting areas that are susceptible to wildfire is possible utilizing remotely sensed data. Species specific classification can be successful when the target species is phenologically distinct from surrounding vegetation types. Based on the accuracy assessment of our fuel classification model, it is concluded that this model is reliable (Goodchild & Biging et al., 1994). In the past efforts to detect concentrations of cheatgrass have been somewhat successful, but utilizing previous Landsat imagery did not provide the capacity of Landsat 8. Landsat 8 OLI imagery was able to distinguish concentrations of cheatgrass better than former attempts due to the enhanced radiometric resolution of Landsat 8 OLI compared to previous Landsat instruments. The methods discussed for the fuel distribution model are applicable to areas where cheatgrass is prevalent or where the vegetation of interest has unique phenotypic characteristics that are detectable with remotely sensed technology. Heterogenous distribution of land cover classes in Idaho rangeland, and many other places, continue to be problematic for remotely sensed image classification, though this problem can be mitigated by the use of higher resolution imagery and/or hyperspectral analysis. The results of this research support land managers decision making process by providing fuel distribution and fire susceptibility information products at local and regional scales. This allows managers to identify areas with increased fire susceptibility and take appropriate action to reduce fire risk amongst human localities. In addition to fire susceptibility detection, this model can be used for land restoration efforts, ecological forecasting and overall land health maintenance.
VI. Acknowledgments We would like to thank our science advisors, Keith Weber, Dr. Mark Carroll, and Dr. John Schnase as well as Margaret Wooten for their guidance and feedback throughout the life of this project. We extend a special thanks to Ryan Howerton at the GIS TReC for his assistance in collecting field observations used as part of this research as well as taking quality photos of the DEVELOP team in action. We would also like to thank past DEVELOP team members Kiersten Newtoff, Kyle Sowder, Katherine Bradford, Andrea Bodenberg, and Eric Smith for their contributions to this research. This material is based upon work supported by NASA through contract NNL11AA00B and cooperative agreement NNX14AB60A.
11
VII. References Aguirre, L., & Johnson, D. a. (1991). Root morphological development in relation to shoot growth in seedlings of four range grasses. Journal of Range Management, 81(2), 341–346. http://doi.org/10.2307/4002396 Balch, J. K., Bradley, B. A., D'Antonio, C. M., & Gómez‐Dans, J. (2013). Introduced annual grass increases regional fire activity across the arid western USA (1980–2009). Global Change Biology, 19(1), 173-183 Baraldi, A., Puzzolo, V., Blonda, P., Bruzzone, L., & Tarantino, C. (2006). Automatic spectral rule-based preliminary mapping of calibrated Landsat TM and ETM+ images. Geoscience and Remote Sensing, IEEE Transactions on,44(9), 2563-2586 Boyte, S. P., Wylie, B. K., & Major, D. J. (2015). Mapping and monitoring cheatgrass dieoff in rangelands of the Northern Great Basin, USA. Rangeland Ecology & Management, 68(1), 18-28.
Bradley, B. A., & Mustard, J. F. (2005). Identifying land cover variability distinct from land cover change: cheatgrass in the Great Basin. Remote Sensing of Environment, 94(2), 204-213 Bradley, B. A., & Mustard, J. F. (2008). Comparison of phenology trends by land cover class: a case study in the Great Basin, USA. Global Change Biology, 14(2), 334-346 Brooks, M. L., Antonio, C. M. D., Richardson, D. M., Grace, J. B., Keeley, E., Ditomaso, J. M., … Keeley, J. O. N. E. (2010). Effects of Invasive Alien Plants on Fire Regimes. BioScience, 54(7), 677–688 Bureau of Reclamation, 2006, AgriMet-The Pacific Northwest Cooperative Agricultural Weather Network - AgriMet network map: accessed June 15, 2015, at URL: http://www.usbr.gov/pn/agrimet/agrimetmap/agrimap.html Burgan, R. E., Klaver, R. W., & Klaver, J. M. (1998). Fuel models and fire potential from satellite and surface observations. International Journal of Wildland Fire, 8(3), 159-170 Chen, F., Weber, K. T., Anderson, J., & Gokhal, B. (2011). Assessing the susceptibility of semiarid rangelands to wildfires using Terra MODIS and Landsat Thematic Mapper data. International Journal of Wildland Fire, 20(5), 690-701 Clinton, N. E., Potter, C., Crabtree, B., Genovese, V., Gross, P., & Gong, P. (2010). Remote Sensing–Based Time-Series Analysis of Cheatgrass (L.) Phenology. Journal of environmental quality, 39(3), 955-963 Dennison, P. E., Brewer, S. C., Arnold, J. D., & Moritz, M. A. (2014). Large wildfire trends in the western United States, 1984–2011. Geophysical Research Letters, 41(8), 2928-2933
Dudley, K. L., Dennison, P. E., Roth, K. L., Roberts, D. A., & Coates, A. R. (2015). A multi-temporal spectral library approach for mapping vegetation species across spatial and temporal phenological gradients. Remote Sensing of Environment
Goodchild, M. F., Biging, G. S., Congalton, R. G., Langley, P. G., Chrisman, N. R., & Davis, F. W. (1994). Final report of the accuracy assessment task force.California Assembly Bill AB1580 (Santa Barbara: University of California, National Center for Geographic Information and Analysis (NCGIA)). Gorte, R. (2013). The rising cost of wildfire protection. Headwaters Economics. Hardy, C. (2005). Wildland fire hazardand risk: Problems, definitions, and context. Forest Ecology and Management, 73-82. Retrieved June 3, 2015, from www.sciencedirect.com Huang, C., Wylie, B., Yang, L., Homer, C., & Zylstra, G. (2002). Derivation of a tasselled cap transformation based on Landsat 7 at-satellite reflectance. International Journal of Remote Sensing, 23(8), 1741-1748
Kauth, R. J., & Thomas, G. S.(1976, January). The tasselled cap--a graphic description of the spectral-temporal development of agricultural crops as seen by Landsat. In LARS Symposia (p. 159) Laycock, W. A. (1991). Stable states and thresholds of range condition on North American rangelands: a viewpoint. Journal of Range Management, 427-433.(p. 430) Mattsson, D., Thoren, F., Weber, K. T., & Burkhardt, F. (2002). Wildland/Urban Interface and Communities at Risk: Pocatello.
Mealor, B. A., Mealor, R. D., Kelley, W. K., Bergman, D. L., Burnett, S. A., Decker, … & Fernandez-Gimenez, M. (2013). Cheatgrass management handbook: Managing an invasive annual grass in the Rocky mountain region. Laramie, Wyoming: University of Wyoming. Miller, J., & Franklin, J. (2002). Modeling the distribution of four vegetation alliances using generalized linear models and classification trees with spatial dependence. Ecological Modelling,157(2), 227-247. Oppenheimer, J. (2012, September 1). Fire in Idaho Lessons for Community Safety and Forest Restoration: An Analysis of Idaho's 2012 Fire Season. Retrieved June 3, 2015. Pellant, M. (1996). Cheatgrass: The Invader That Won the West. Retrieved June 2, 2015. Pellant, M., Abbey, B., & Karl, S. (2004). Restoring the Great Basin Desert, U.S.A.: Integrating science, management, and people. Environmental Monitoring and Assessment, 99(1-3), 169–179. http://doi.org/10.1007/s10661-004-4017-3
Peters, E. F. and S. C. Bunting. 1994. Fire conditions pre- and post- occurrence of annual grasses on the Snake River Plain. p. 31–36. In: S.B. Monsen and S.G. Kitchen (eds.) Proc. Ecology and Management of Annual Rangelands. U.S.D.A. For. Serv., Gen. Tech. Rept. INT-313. Peterson, E. B. (2003). Mapping percent-cover of the invasive species Bromus tectorum (cheatgrass) over a large portion of Nevada from satellite imagery.Report for the US Fish and Wildlife Service, Nevada State Office, Reno, by the Nevada Natural Heritage Program, Carson City. Preisler, H. K., Burgan, R. E.,Eidenshink, J. C., Klaver, J. M., & Klaver, R. W. (2009). Forecasting distributions of large federal-lands fires utilizing satellite and gridded weather information. International Journal of Wildland Fire, 18(5), 508-516. Qi, J., Chehbouni, A., Huete, A. R., Kerr, Y. H., & Sorooshian, S. (1994). A modified soil adjusted vegetation index. Remote sensing of environment, 48(2), 119-126. Roundy, B. A., Hardegree, S. P., Chambers, J. C., & Whittaker, A. (2007). Prediction of cheatgrass field germination potential using wet thermal accumulation. Rangeland Ecology & Management, 60(6), 613-623. Rondeaux, G., Steven, M., & Baret, F. (1996). Optimization of soil-adjusted vegetation indices. Remote sensing of environment, 55(2), 95-107. Smith, R. B., & Braile ,L. W. (1994). The Yellowstone hotspot. Journal of Volcanology and Geothermal Research, 61(3), 121-187. Weber, K. T. (2000). A method to incorporate phenology into land cover change analysis, (March), 1–7. Retrieved from papers2://publication/uuid/547199D7-B9C5-4C8E-A587-1216ECD43B8A United States Geological Survey (USGS). May 2015. Landsat 8 data [Data files]. Retrieved from http://earthexplorer.usgs.gov/ Whisenant, S. G. (1990). Changing fire frequencies on Idaho’s Snake River Plains: ecological and management implications. McArthur, E. Durant; Romney, Evan M.; Smith, Stanley D, 5-7. Zambon, M., Lawrence, R., Bunn, A., & Powell, S. (2006). Effect of alternative splitting rules on image processing using classification tree analysis Photogrammetric Engineering & Remote Sensing, 72(1), 25-30
14
VIII. Content Innovation
AudioSlides – 2015Sum_ID_IdahoDisastersIII_ContentInnovation_AudioSlides.pptx Featured Author Videos - 2015Sum_ID_IdahoDisastersIII_FeaturedAuthorvideo.mp4
IV. Appendices
Appendix A – Imagery selected from time series for analysis