ideabank.pl Idea Bank S.A. Group Results 4Q 2015 r. Presentation of the Management Board for Investors March 4, 2016 Another quarter with good performance of Idea Bank S.A. Group despite additional charges imposed by regulator to banking sector
Transcript
ideabank.pl
Idea Bank S.A. Group Results
4Q 2015 r.
Presentation of the Management Board for Investors
March 4, 2016
Another quarter with good performance of Idea Bank S.A. Group
despite additional charges imposed by regulator to banking sector
ideabank.pl
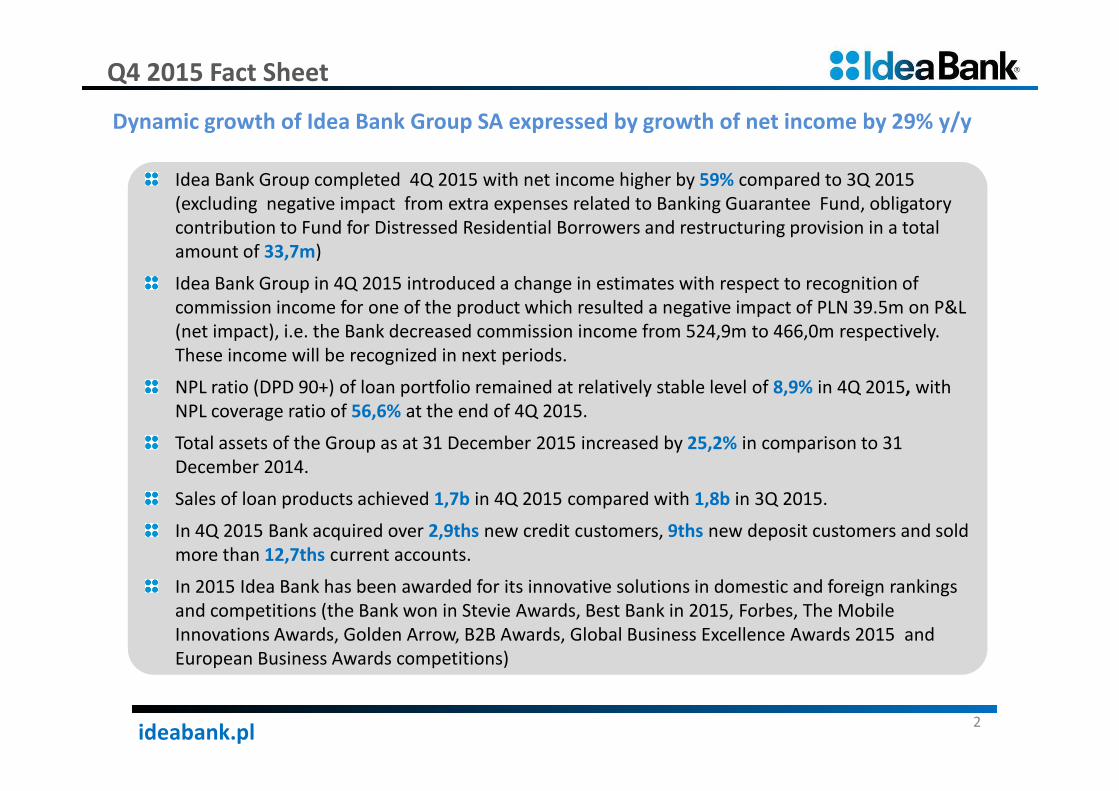
Idea Bank Group completed 4Q 2015 with net income higher by 59% compared to 3Q 2015
(excluding negative impact from extra expenses related to Banking Guarantee Fund, obligatory
contribution to Fund for Distressed Residential Borrowers and restructuring provision in a total
amount of 33,7m)
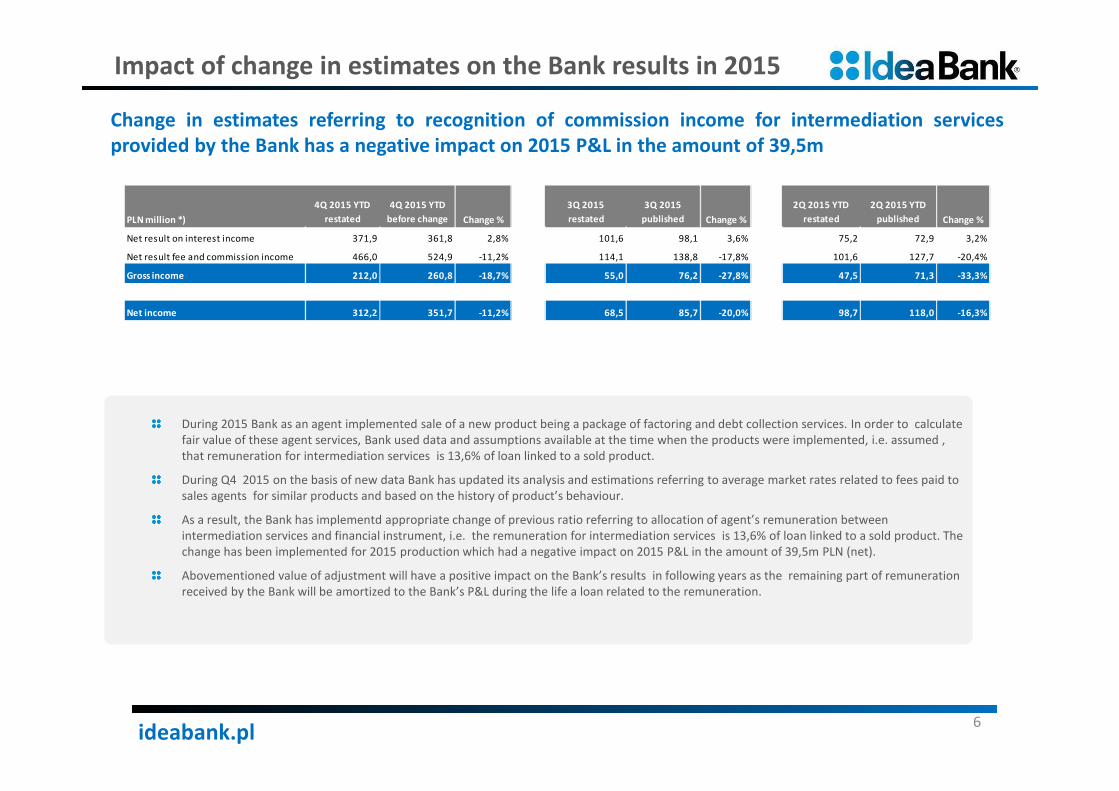
Idea Bank Group in 4Q 2015 introduced a change in estimates with respect to recognition of
commission income for one of the product which resulted a negative impact of PLN 39.5m on P&L
(net impact), i.e. the Bank decreased commission income from 524,9m to 466,0m respectively.
These income will be recognized in next periods.
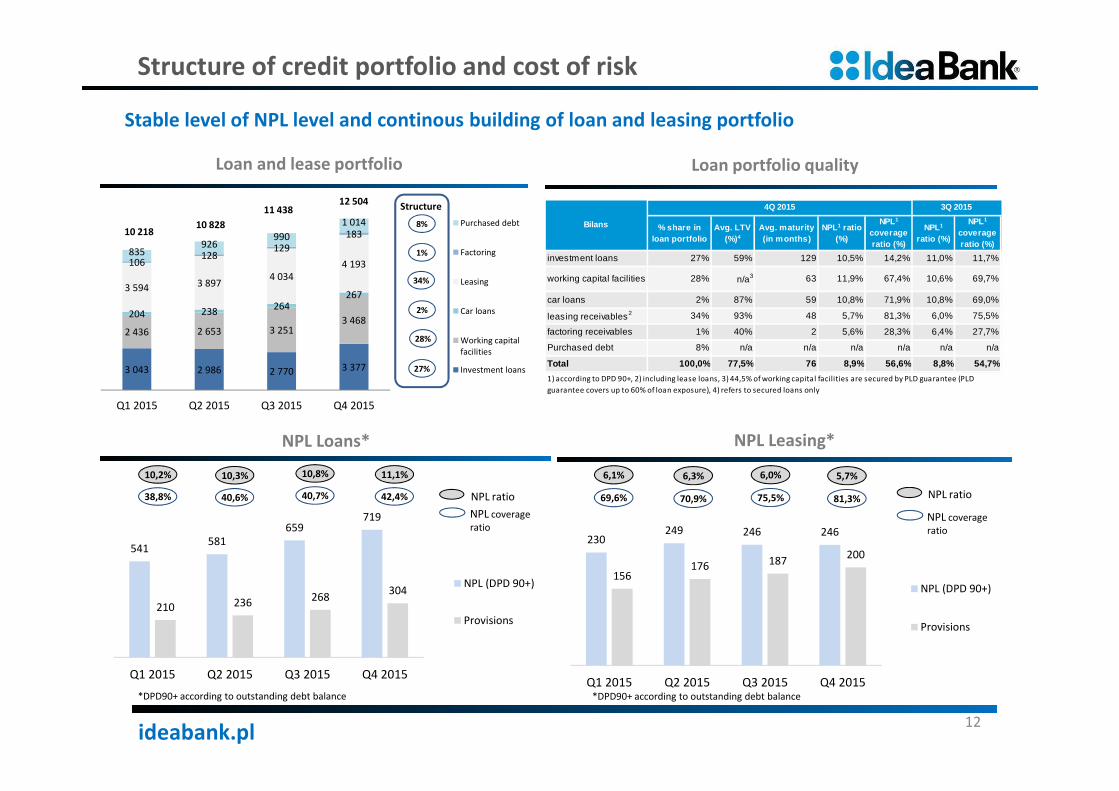
NPL ratio (DPD 90+) of loan portfolio remained at relatively stable level of 8,9% in 4Q 2015, with
NPL coverage ratio of 56,6% at the end of 4Q 2015.
Total assets of the Group as at 31 December 2015 increased by 25,2% in comparison to 31
December 2014.
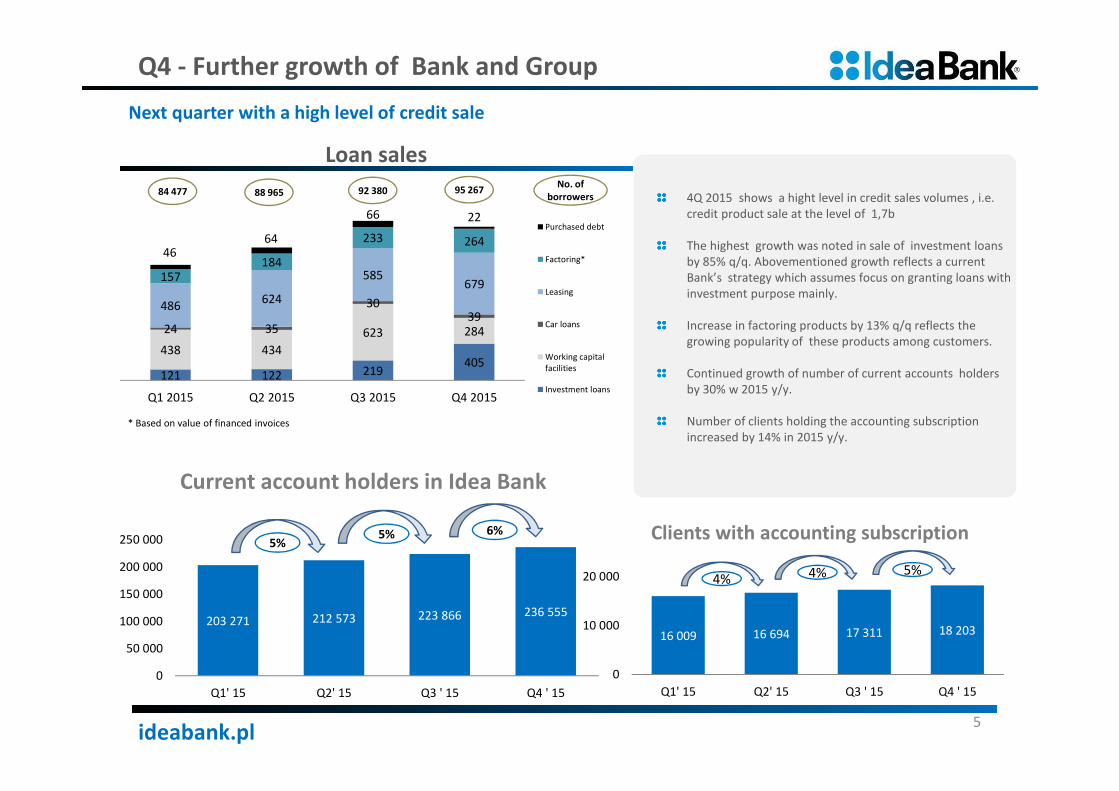
Sales of loan products achieved 1,7b in 4Q 2015 compared with 1,8b in 3Q 2015.
In 4Q 2015 Bank acquired over 2,9ths new credit customers, 9ths new deposit customers and sold
more than 12,7ths current accounts.
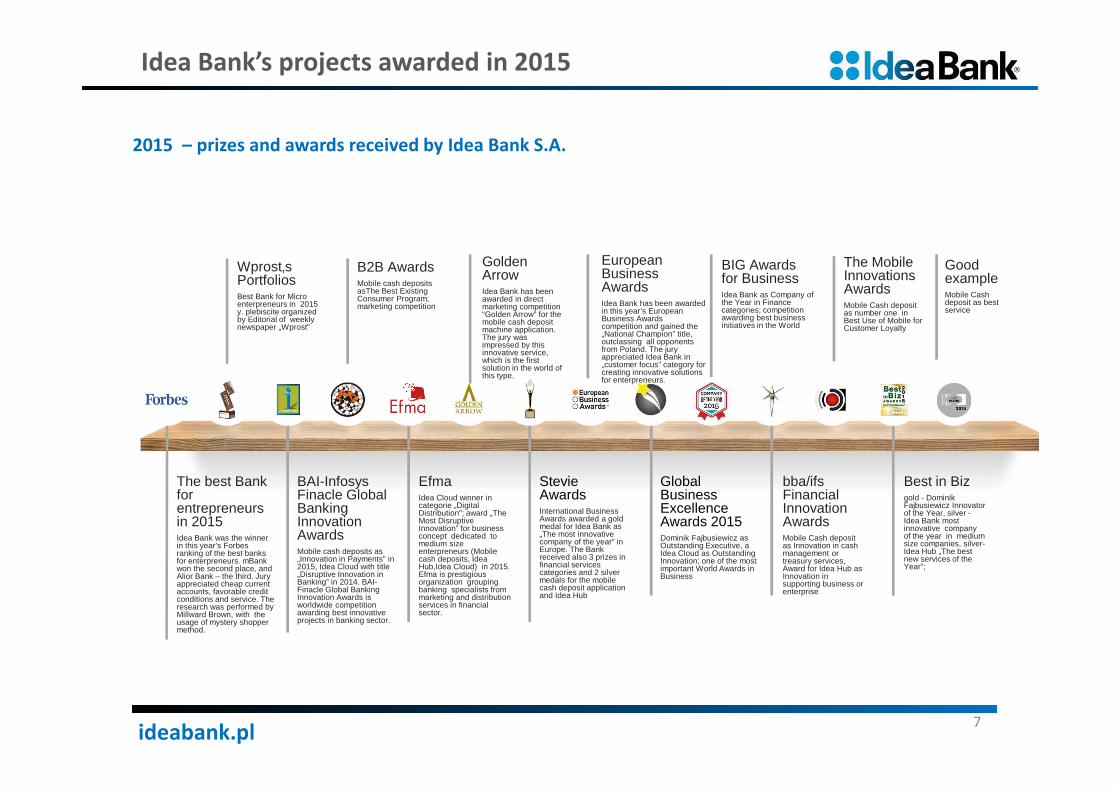
In 2015 Idea Bank has been awarded for its innovative solutions in domestic and foreign rankings
and competitions (the Bank won in Stevie Awards, Best Bank in 2015, Forbes, The Mobile
Innovations Awards, Golden Arrow, B2B Awards, Global Business Excellence Awards 2015 and
European Business Awards competitions)
Q4 2015 Fact Sheet
2
Dynamic growth of Idea Bank Group SA expressed by growth of net income by 29% y/y
ideabank.pl
Agenda
Summary of Idea Bank Group 4Q 2015 results
Summary of financial data and key ratios
Sales and customers volumes
Key initiatives
Analysis of 4Q 2015 financial results
Structure of net income
Structure of loans together with impairment losses and CoR
Key regulatory indicators
Key financial information relating to operating segments
Attachments
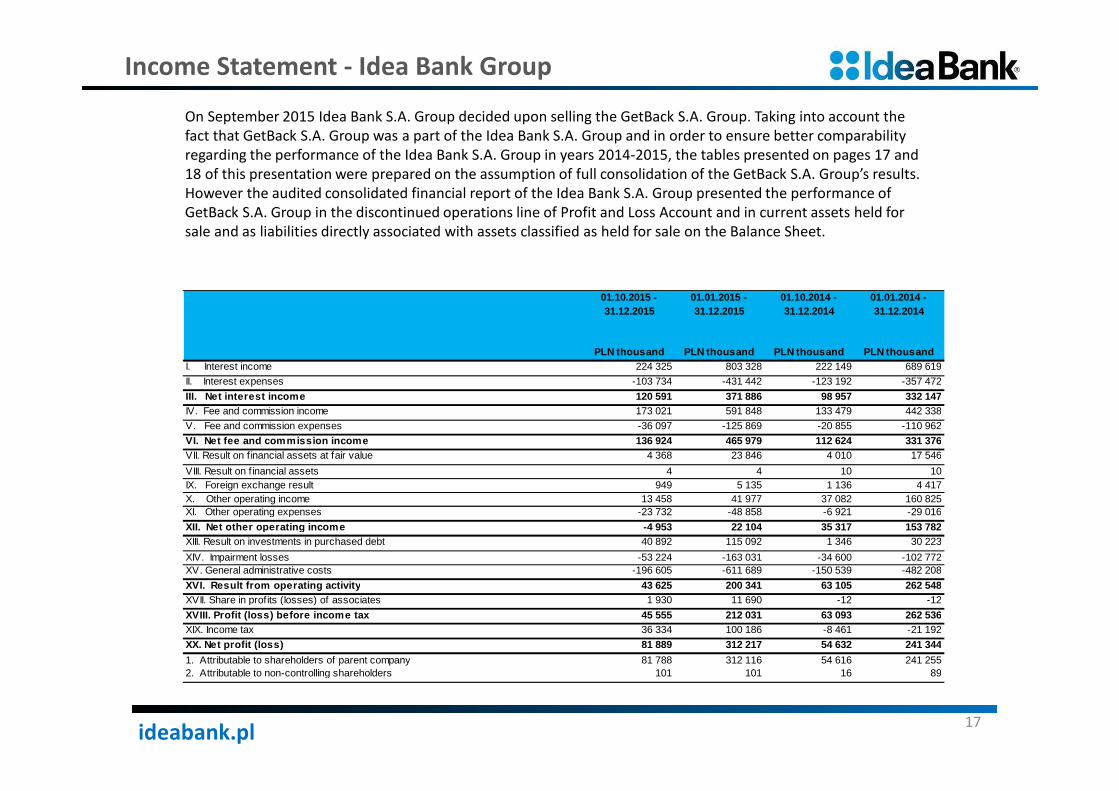
Income statement – Idea Bank Group
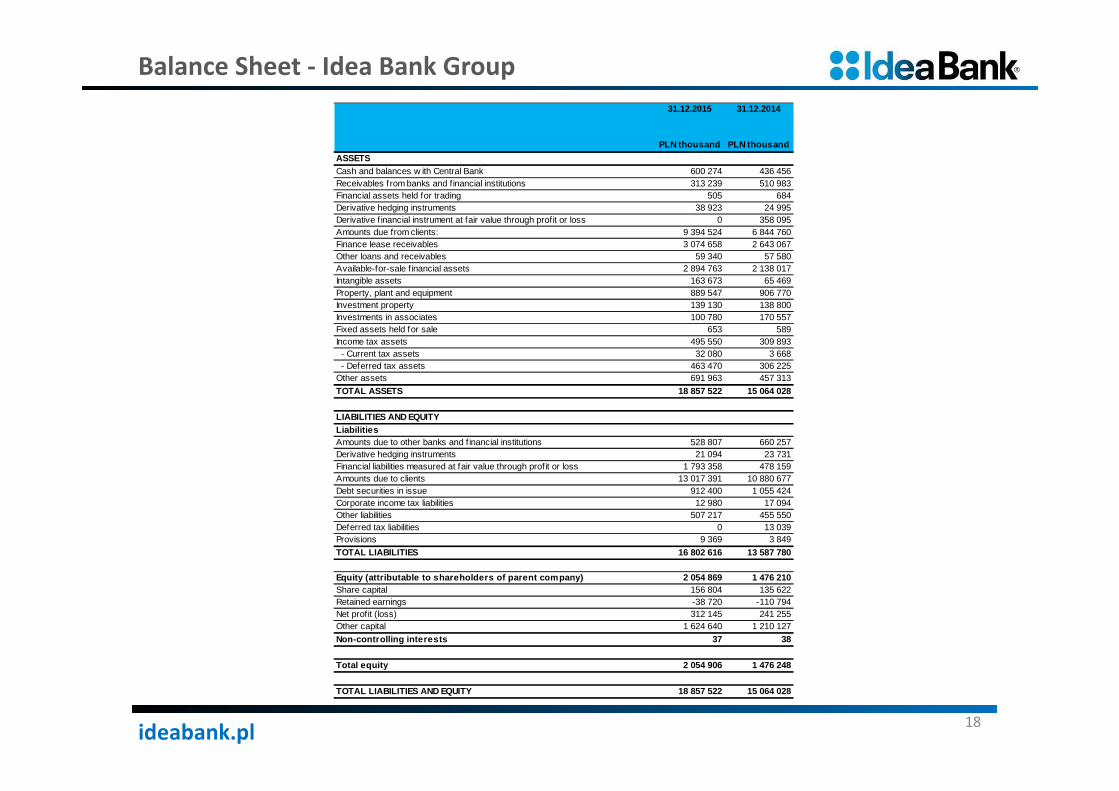
Balance sheet – Idea Bank Group
3
ideabank.pl
Summary of Income statement and key ratios
4
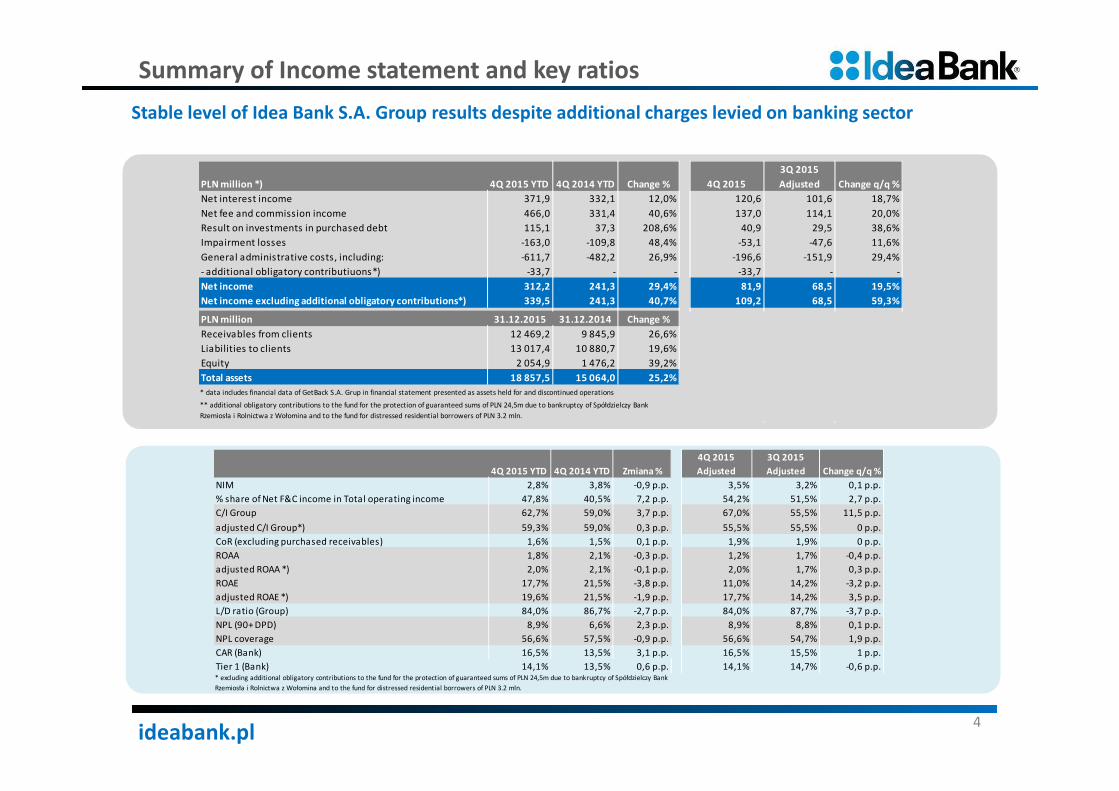
Stable level of Idea Bank S.A. Group results despite additional charges levied on banking sector
4Q 2015 YTD 4Q 2014 YTD Zmiana %
4Q 2015
Adjusted
3Q 2015
Adjusted Change q/q %
NIM 2,8% 3,8% -0,9 p.p. 3,5% 3,2% 0,1 p.p.
% share of Net F&C income in Total operating income 47,8% 40,5% 7,2 p.p. 54,2% 51,5% 2,7 p.p.
C/I Group 62,7% 59,0% 3,7 p.p. 67,0% 55,5% 11,5 p.p.
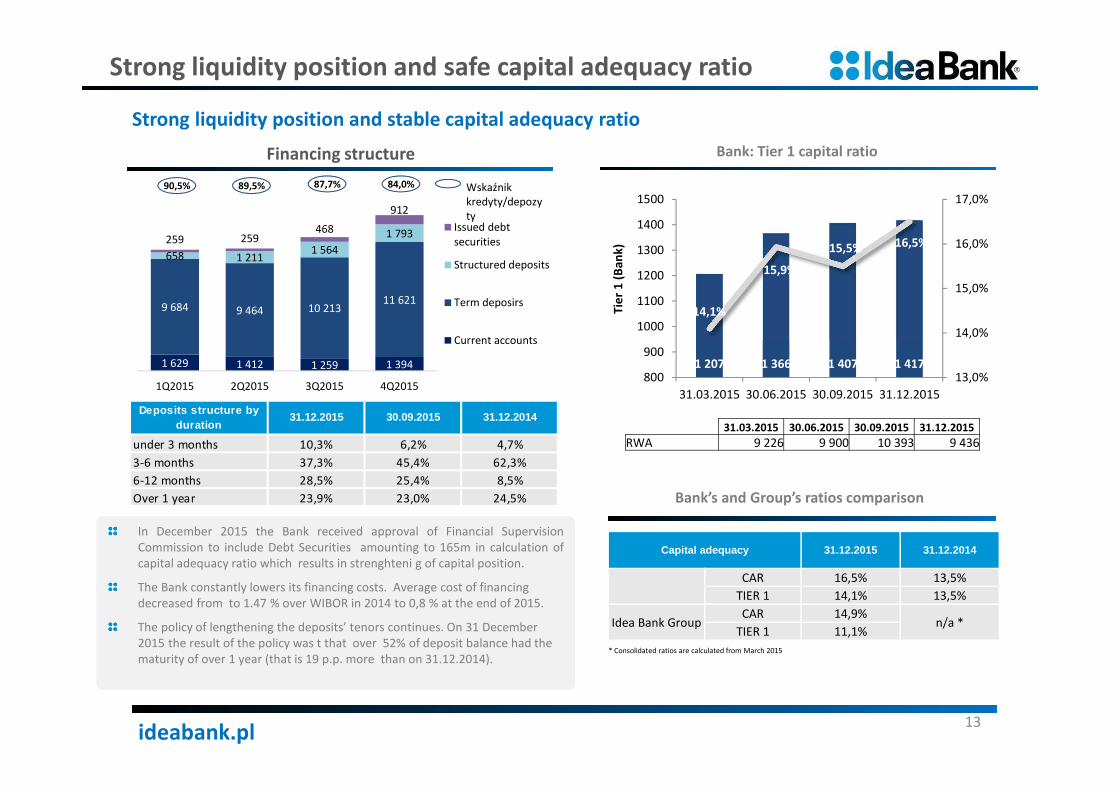
CAR (Bank) 16,5% 13,5% 3,1 p.p. 16,5% 15,5% 1 p.p.
Tier 1 (Bank) 14,1% 13,5% 0,6 p.p. 14,1% 14,7% -0,6 p.p.* excluding additional obligatory contributions to the fund for the protection of guaranteed sums of PLN 24,5m due to bankruptcy of Spółdzielczy Bank
Rzemiosła i Rolnictwa z Wołomina and to the fund for distressed residential borrowers of PLN 3.2 mln.
Net income 312,2 351,7 -11,2% 68,5 85,7 -20,0% 98,7 118,0 -16,3%
ideabank.pl
bba/ifs Financial Innovation Awards Mobile Cash depositas Innovation in cash management or treasury services, Award for Idea Hub asInnovation in supporting business or enterprise
Best in Biz gold - DominikFajbusiewicz Innovatorof the Year, silver -Idea Bank most innovative companyof the year in medium size companies, silver-Idea Hub „The bestnew services of the Year”;
Wprost‚s PortfoliosBest Bank for Micro enterpreneurs in 2015 y. plebiscite organizedby Editorial of weeklynewspaper „Wprost”
The best Bank for entrepreneursin 2015Idea Bank was the winner in this year’s Forbes ranking of the best banks for enterpreneurs. mBankwon the second place, and Alior Bank – the third. Jury appreciated cheap current accounts, favorable credit conditions and service. The research was performed by Millward Brown, with the usage of mystery shopper method.
EfmaIdea Cloud winner in categorie „Digital Distribution”; award „The Most Disruptive Innovation” for business concept dedicated to medium sizeenterpreneurs (Mobile cash deposits, Idea Hub,Idea Cloud) in 2015. Efma is prestigiousorganization groupingbanking specialists from marketing and distributionservices in financialsector.
BAI-Infosys Finacle Global Banking Innovation AwardsMobile cash deposits as „Innovation in Payments” in2015, Idea Cloud with title„Disruptive Innovation in Banking” in 2014. BAI-Finacle Global Banking Innovation Awards isworldwide competitionawarding best innovativeprojects in banking sector.
StevieAwardsInternational Business Awards awarded a gold medal for Idea Bank as „The most innovative company of the year” in Europe. The Bank received also 3 prizes in financial services categories and 2 silver medals for the mobile cash deposit application and Idea Hub
Global Business Excellence Awards 2015Dominik Fajbusiewicz asOutstanding Executive, a Idea Cloud as Outstanding Innovation; one of the most important World Awards in Business
The Mobile Innovations AwardsMobile Cash depositas number one in Best Use of Mobile for Customer Loyalty
B2B Awards Mobile cash depositsasThe Best Existing Consumer Program; marketing competition
Golden ArrowIdea Bank has been awarded in direct marketing competition “Golden Arrow” for the mobile cash deposit machine application. The jury was impressed by this innovative service, which is the first solution in the world of this type.
BIG Awards for Business Idea Bank as Company of the Year in Finance categories; competitionawarding best business initiatives in the World
European Business AwardsIdea Bank has been awarded in this year’s European Business Awards competition and gained the „National Champion” title, outclassing all opponents from Poland. The jury appreciated Idea Bank in „customer focus” category for creating innovative solutions for enterpreneurs.
GoodexampleMobile Cash deposit as bestservice
Idea Bank’s projects awarded in 2015
7
2015 – prizes and awards received by Idea Bank S.A.
ideabank.pl
Summary of Idea Bank Group 4Q 2015 results
Summary of financial data and key ratios
Sales and customers volumes
Key initiatives
Analysis of 4Q 2015 financial results
Structure of net income
Structure of loans together with impairment losses and CoR
Key regulatory indicators
Key financial information relating to operating segments
Attachments
Income statement - Idea Bank Group
Balance sheet – Idea Bank Group
Agenda
8
ideabank.pl
IDEA HUB
The Group financial results - 4Q 2015 by segments
Kreatywna przestrzeń dla
biznesu
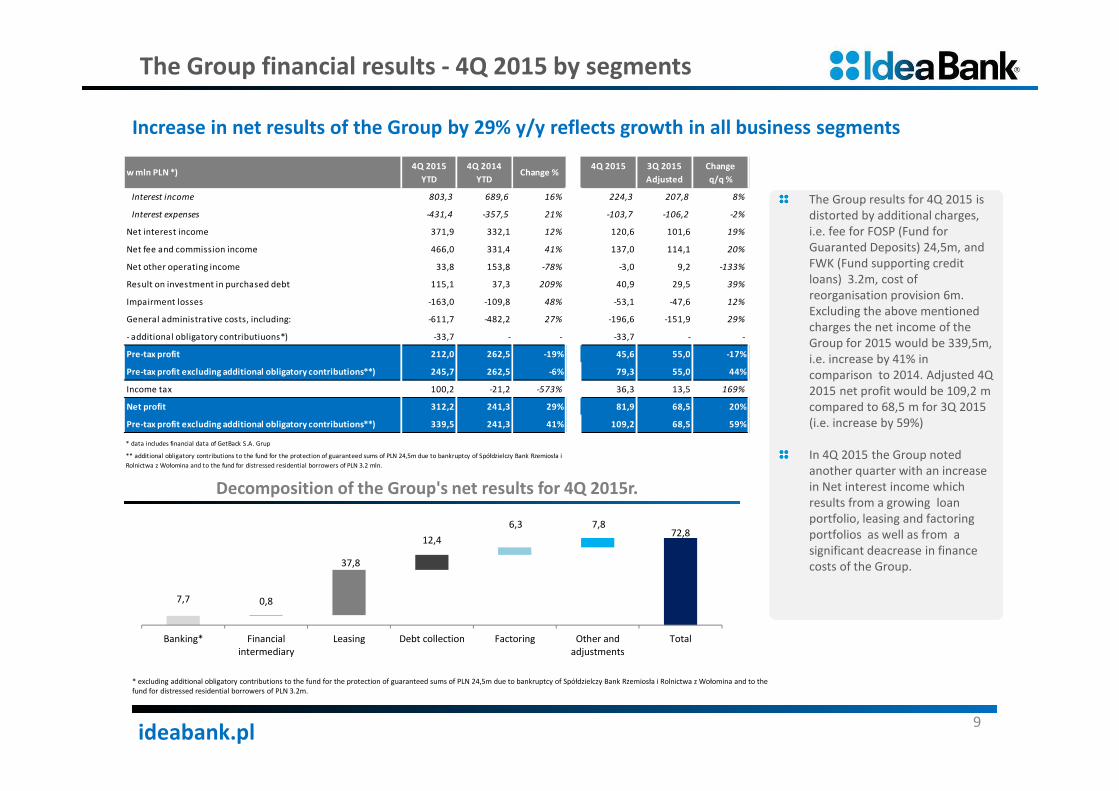
The Group results for 4Q 2015 is
distorted by additional charges,
i.e. fee for FOSP (Fund for
Guaranted Deposits) 24,5m, and
FWK (Fund supporting credit
loans) 3.2m, cost of
reorganisation provision 6m.
Excluding the above mentioned
charges the net income of the
Group for 2015 would be 339,5m,
i.e. increase by 41% in
comparison to 2014. Adjusted 4Q
2015 net profit would be 109,2 m
compared to 68,5 m for 3Q 2015
(i.e. increase by 59%)
In 4Q 2015 the Group noted
another quarter with an increase
in Net interest income which
results from a growing loan
portfolio, leasing and factoring
portfolios as well as from a
significant deacrease in finance
costs of the Group.
9
Increase in net results of the Group by 29% y/y reflects growth in all business segments
* excluding additional obligatory contributions to the fund for the protection of guaranteed sums of PLN 24,5m due to bankruptcy of Spółdzielczy Bank Rzemiosła i Rolnictwa z Wołomina and to the
fund for distressed residential borrowers of PLN 3.2m.
7,7 0,8
37,8
12,4
6,3 7,872,8
Banking* Financial
intermediary
Leasing Debt collection Factoring Other and
adjustments
Total
Decomposition of the Group's net results for 4Q 2015r.
* data includes financial data of GetBack S.A. Grup
** additional obligatory contributions to the fund for the protection of guaranteed sums of PLN 24,5m due to bankruptcy of Spółdzielczy Bank Rzemiosła i
Rolnictwa z Wołomina and to the fund for distressed residential borrowers of PLN 3.2 mln.
ideabank.pl
74,5 75,2
101,6120,6
2,4% 2,4%
3,2%
3,5%
0,0%
1,0%
2,0%
3,0%
4,0%
5,0%
Q1 2015 Q2 2015 Q3 2015 Q4 2015
0
30
60
90
120
150
Net interest income and NIM
Net
interest
income
(PLNm)
NIM (%)IDEA HUB
Dynamics of the Group Income and Costs
Kreatywna przestrzeń dla
biznesu
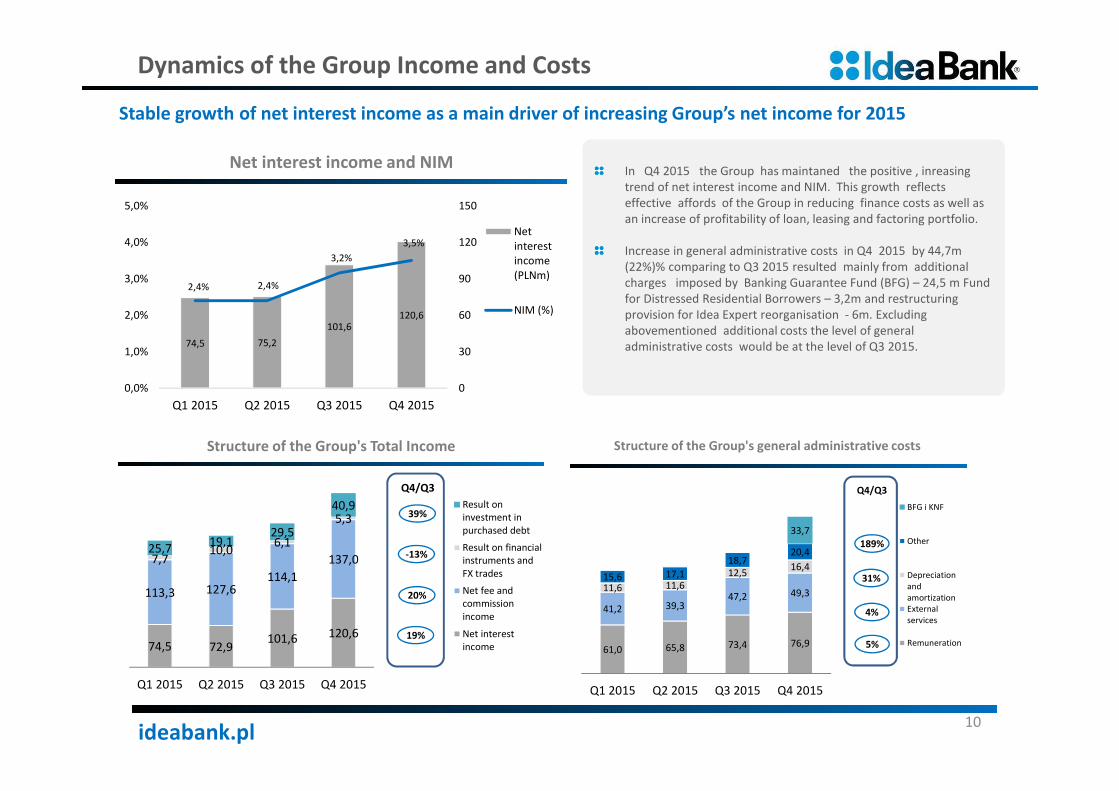
In Q4 2015 the Group has maintaned the positive , inreasing
trend of net interest income and NIM. This growth reflects
effective affords of the Group in reducing finance costs as well as
an increase of profitability of loan, leasing and factoring portfolio.
Increase in general administrative costs in Q4 2015 by 44,7m
(22%)% comparing to Q3 2015 resulted mainly from additional
charges imposed by Banking Guarantee Fund (BFG) – 24,5 m Fund
for Distressed Residential Borrowers – 3,2m and restructuring
provision for Idea Expert reorganisation - 6m. Excluding
abovementioned additional costs the level of general
administrative costs would be at the level of Q3 2015.
10
Stable growth of net interest income as a main driver of increasing Group’s net income for 2015
74,5 72,9101,6 120,6
113,3 127,6114,1
137,07,710,0
6,1
5,3
25,719,1
29,5
40,9
Q1 2015 Q2 2015 Q3 2015 Q4 2015
Structure of the Group's Total Income
Result on
investment in
purchased debt
Result on financial
instruments and
FX trades
Net fee and
commission
income
Net interest
income
Q4/Q3
-13%
20%
19%
39%
61,0 65,8 73,4 76,9
41,2 39,347,2 49,3
11,6 11,6
12,516,4
15,6 17,1
18,720,4
33,7
Q1 2015 Q2 2015 Q3 2015 Q4 2015
Structure of the Group's general administrative costs
BFG i KNF
Other
Depreciation
and
amortization
External
services
Remuneration
189%
31%
4%
5%
Q4/Q3
ideabank.pl
Dynamics of the Group Income and Costs
Comment :
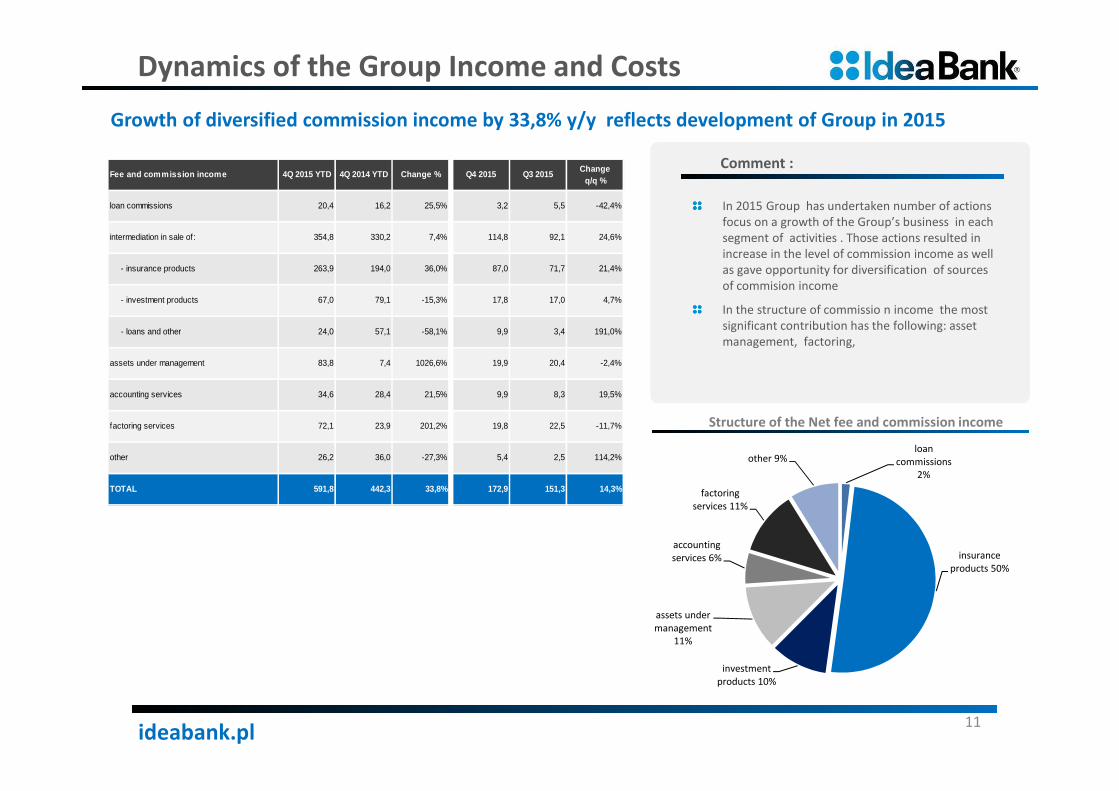
In 2015 Group has undertaken number of actions
focus on a growth of the Group’s business in each
segment of activities . Those actions resulted in
increase in the level of commission income as well
as gave opportunity for diversification of sources
of commision income
In the structure of commissio n income the most
significant contribution has the following: asset
management, factoring,
11
Growth of diversified commission income by 33,8% y/y reflects development of Group in 2015
Fee and commission income 4Q 2015 YTD 4Q 2014 YTD Change % Q4 2015 Q3 2015 Change
q/q %
loan commissions 20,4 16,2 25,5% 3,2 5,5 -42,4%
intermediation in sale of: 354,8 330,2 7,4% 114,8 92,1 24,6%
XVI. Result from operating activity 43 625 200 341 63 105 262 548XVII. Share in profits (losses) of associates 1 930 11 690 -12 -12
XVIII. Profit (loss) before income tax 45 555 212 031 63 093 262 536XIX. Income tax 36 334 100 186 -8 461 -21 192
XX. Net profit (loss) 81 889 312 217 54 632 241 344
1. Attributable to shareholders of parent company 81 788 312 116 54 616 241 2552. Attributable to non-controlling shareholders 101 101 16 89
ideabank.pl
Balance Sheet - Idea Bank Group
18
31.12.2015 31.12.2014
PLN thousand PLN thousand
ASSETSCash and balances w ith Central Bank 600 274 436 456Receivables from banks and financial institutions 313 239 510 983Financial assets held for trading 505 684Derivative hedging instruments 38 923 24 995Derivative f inancial instrument at fair value through profit or loss 0 358 095Amounts due from clients: 9 394 524 6 844 760Finance lease receivables 3 074 658 2 643 067Other loans and receivables 59 340 57 580Available-for-sale f inancial assets 2 894 763 2 138 017Intangible assets 163 673 65 469Property, plant and equipment 889 547 906 770Investment property 139 130 138 800Investments in associates 100 780 170 557Fixed assets held for sale 653 589Income tax assets 495 550 309 893 - Current tax assets 32 080 3 668 - Deferred tax assets 463 470 306 225Other assets 691 963 457 313
TOTAL ASSETS 18 857 522 15 064 028
LIABILITIES AND EQUITYLiabilitiesAmounts due to other banks and f inancial institutions 528 807 660 257Derivative hedging instruments 21 094 23 731Financial liabilities measured at fair value through profit or loss 1 793 358 478 159Amounts due to clients 13 017 391 10 880 677Debt securities in issue 912 400 1 055 424Corporate income tax liabilities 12 980 17 094Other liabilities 507 217 455 550Deferred tax liabilities 0 13 039Provisions 9 369 3 849
TOTAL LIABILITIES 16 802 616 13 587 780
Equity (attributable to shareholders of parent company) 2 054 869 1 476 210Share capital 156 804 135 622Retained earnings -38 720 -110 794Net profit (loss) 312 145 241 255Other capital 1 624 640 1 210 127
Non-controlling interests 37 38
Total equity 2 054 906 1 476 248
TOTAL LIABILITIES AND EQUITY 18 857 522 15 064 028