8
IDEA Report FALL 2019 What Makes People Come Back: The Behaviors of Registrant Loyalty

IDEA Report
F A L L 2 0 1 9
What Makes People Come Back: The Behaviors of Registrant Loyalty

Page 1 of 7 | © 2019 Experient
As a leading service provider within the events and exhibitions industry, Experient is empowered by a wealth of data and data-savvy professionals. Inside the Experient offices, we mined, anonymized and aggregated customer data from the past 4 years to test some of our assumptions and to be able to share insightful and actionable information by leveraging over 1,000 unique events. The Experient IDEA Report is our way to bring you, our valued customers, those insights to translate to your own event.
Let’s get started! In this Fall 2019 edition, we are going to explore the topic of registrant retention and identifying behavioral factors that have a correlation to registrant retention.
The IDEA ReportWhat Makes People Come Back: The Behaviors of Registrant Loyalty
What correlations can be found between registrant retention and their behavior?
• Registration timing
• Amount they spend on the event
• Distance traveled to the event
• Location of the event
IDEA Report Research Question To create the IDEA Report, Experient collected data from more than
1,000 unique events
Definition of Terms
R E T U R N I N G
a person that has registered for events
in the past
FIRST-TIMER
a person that has not registered for an
event in the past
ROTATING
an event that changes the city their event is held in, from one year
to the next
an event that remains in the same city year
after year
STATIONARY
DRIVER
a person that registers for the event
and lives less than 250 miles away from
the event location
a person that registers and lives
more than 250 miles away from the event
location
FLYER
a person that registers for
consecutive events
RETAINED
a person that does not register for
consecutive events
LOST

© 2019 Experient | Page 2 of 7
Relationship of Registration Timing & Registrant Spend
Key Timing for Registrants to Spend Money
5 WEEKS OUT: Spend begins to peak
1 WEEK OUT: Highest percentage of spend in pre-registration
ONSITE: Highest spend overall
When do registrants spend the most money during the registration life cycle?
Research Question
Experient’s Insights
Opening a website a year in advance or even 20 weeks out does not necessarily result in more revenue for your association or a better verified attendance onsite. Take advantage of when registrants are ready to spend and demonstrate a commitment to show up. If peak spending begins at 5 weeks out, consider these areas of your business and if they promote registering and spending at your event:
M Deadline dates/rate increases
M Marketing campaigns
M Onsite marketing and upselling offers
M Finalization of education content and event schedule
M Hotel deadlines
What Does the Data Tell Us?The average percentage of all money spent on registra-tion and sessions increases steadily from 18 weeks prior to the event, with an initial peak at 5 weeks out. 58.2% of total event revenues are captured between the 18th and 5th week prior to a show. The last week alone before the event captures nearly 9% of total registration revenue while the largest amount is collected onsite of the event at 15.2%. On average, 85% of all event revenue is realized prior to onsite.
Interestingly, registration activity prior to 20 weeks out from the event results in a significantly lower percentage of confirmed attendance. The data shows 12% of people register 14–18 weeks out from the event and opening online registration more than 18 weeks out will only yield <1% of registrants per week. This puts into question the effectiveness of opening registration prior to 18 weeks out from an event, unless other contributing factors are impacting those opening decisions. by 1 Week Out
85% of People are Registered
by 10 Weeks Out
26% of People are Registered
by 18 Weeks Out
2% of People are Registered
by 5 Weeks Out
55% of People are Registered

Page 3 of 7 | © 2019 Experient
RETURNING
Based on registration activity trends over time, is there a trend based on the registrant’s loyalty type (returning, first-time, lost or retained) to the event?
Research Question
What Does the Data Tell Us?First-time registrants make up two-thirds of total registrations. However, returning registrants, those who are loyal to the event, spend on average $35 dollars more than first-time registrants. Interestingly, new registrants who are eventually loyal spend the most — 14% more than new registrants who do not return the following year. This data trend could be a way to predict behavior and an opportunity to build in plans to mitigate lost attendance.
Experient’s Insights
In order to build marketing plans around different personas, it is significant to know how each one is behaving at the event. Also, it is important to help the first-time registrants navigate the event so they can convert to a loyal status, increasing spending and ultimately engagement in your event. Incentivizing their attendance by discounts, more access or show status are options so they see value in continuing to register year over year.
M Reward your loyal registrants for returning each year
M Identify the trends of your lost attendee base
M Review the conversion of abandoned/in-progress registrations
M Use Experient’s Experience Tracker to remind registrants of past sessions attended or exhibitors they visited and show ROI to draw them back next year
Impact of Registration Loyalty Status on Amount Spent
First-Time Registrantsmake up two-thirds of total registrations
Returning Registrantsspend on average $35 more than first-timers
NEW = =2/3
Average Spend Per Event
60
50
40
30
20
10
0
55%
14%RETAINED
LOST
19% 21%RETAINEDLOST
FIRST-TIME REGISTRANTS
RETURNING REGISTRANTS
© 2019 Experient | Page 4 of 7
Impact of Travel Distance on Participation
Week Registered — Flyer vs. Driver
Weeks Out
% o
f All
Regi
stra
nts
0
1
2
3
4
5
6
7
8Flyers
Drivers
024681012141618
7.8%
6.4%
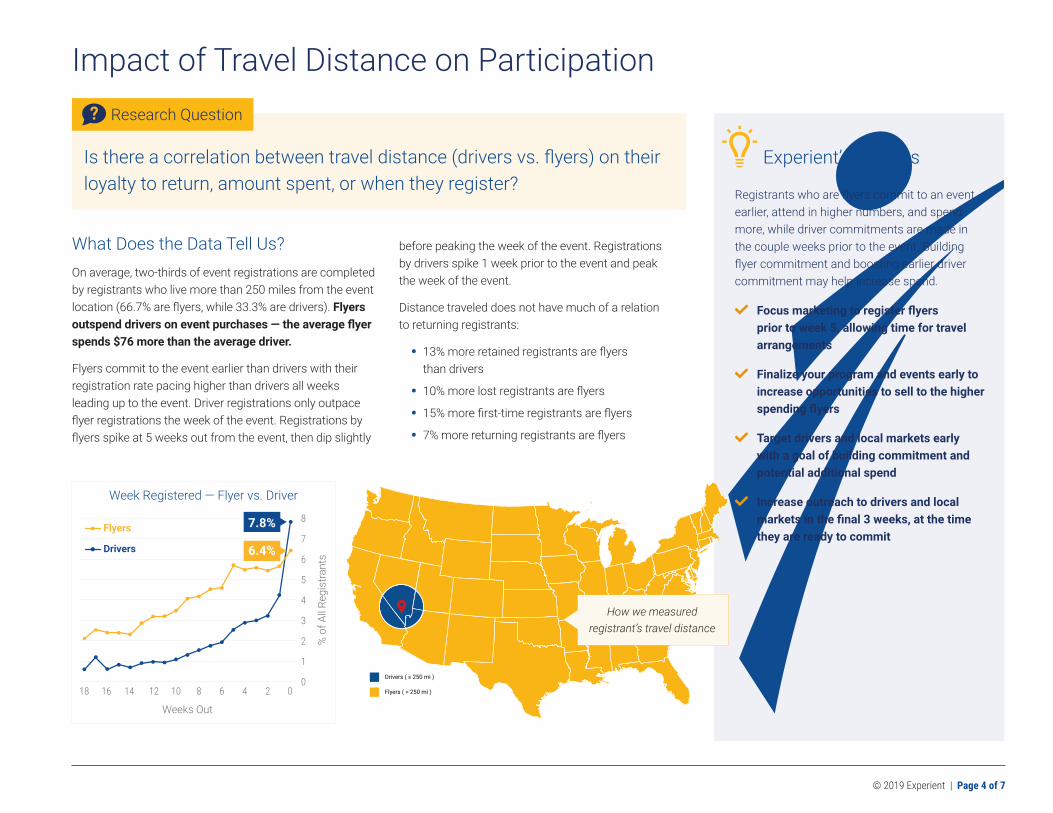
Is there a correlation between travel distance (drivers vs. flyers) on their loyalty to return, amount spent, or when they register?
Research Question
What Does the Data Tell Us?On average, two-thirds of event registrations are completed by registrants who live more than 250 miles from the event location (66.7% are flyers, while 33.3% are drivers). Flyers outspend drivers on event purchases — the average flyer spends $76 more than the average driver.
Flyers commit to the event earlier than drivers with their registration rate pacing higher than drivers all weeks leading up to the event. Driver registrations only outpace flyer registrations the week of the event. Registrations by flyers spike at 5 weeks out from the event, then dip slightly
before peaking the week of the event. Registrations by drivers spike 1 week prior to the event and peak the week of the event.
Distance traveled does not have much of a relation to returning registrants:
• 13% more retained registrants are flyers than drivers
• 10% more lost registrants are flyers
• 15% more first-time registrants are flyers
• 7% more returning registrants are flyers
Experient’s Insights
Registrants who are flyers commit to an event earlier, attend in higher numbers, and spend more, while driver commitments are made in the couple weeks prior to the event. Building flyer commitment and boosting earlier driver commitment may help increase spend.
M Focus marketing to register flyers prior to week 5, allowing time for travel arrangements
M Finalize your program and events early to increase opportunities to sell to the higher spending flyers
M Target drivers and local markets early with a goal of building commitment and potential additional spend
M Increase outreach to drivers and local markets in the final 3 weeks, at the time they are ready to commit
How we measured registrant’s travel distance

Page 5 of 7 | © 2019 Experient
Impact of Event Location on Registration
Does event location (stationary vs. city rotation) affect the level of timing of registration and participation?
Research Question
What Does the Data Tell Us?For events that rotate cities annually, the 5th week prior to the event continues to be a key time for registrations — averaging 10% of registrations completed. Rotating events bring in more completed registrations over a steadier pattern between weeks 3–16. For events that are stationary in their event city, there is an initial spike at 17 weeks out. At 4 weeks out is the beginning of an increase of registration at 37% from the week before in registration activity. Also, stationary events have an impressive spike during onsite registration at 17% of registration completed, which is a 65% increase from the previous week of registration.
• People are 8% more likely to fly to an event that rotates cities than fly to an event that is stationary
• Drivers make up 47% of registrations for events that are stationary
• Drivers make up only 25% of registrations for events that rotate cities
• First-time registrants are 5% more likely to travel to a rotating event than a stationary event
• Retained registrants are 6% more likely to register to an event that is stationary
While these percentages may not be largely impactive, it is important to see how subsets of the registrant base lean toward overall show decisions, such as event location.
Experient’s Insights
While each event has a different registrant base, it is important to look at your own event’s trends in registration based on the decisions your organiza-tion has made in structuring the event.
M The impact on stationary events data trends could be related to Show Organizers finding cities that are more successful for them to build a loyalty base for their registration. Drivers can attend more easily and do attend more consistently to those stationary events.
M The correlation of an event location to the retention and travel distance can be insightful to create marketing strategies for assumed behavior to grow attendance at your event.
M Other factors may play a role in impacting the behavior of your registration such as hotel openings, expansion of venues, city attractions or association base. These are areas Experient can tailor specific data initiatives towards for your event.
Stationary Events
52% are Flyers
47% are Drivers
Rotating Events
75% are Flyers
25% are Drivers

© 2019 Experient | Page 6 of 7
Reading an Electronic Version? Click one of the following buttons to let us know if the information in this report was helpful.
Reading a Printed Version?Type the following web address into your browser to send feedback on the IDEA Report to Experient.
https://bit.ly/IDEAreport
Want More Information?If you’d like to know how our data insights impact your specific event, contact your Strategic Account Manager.
What is YOUR Next IDEA?What question would you like to be answered in the next issue of the IDEA report? Submit any ideas to [email protected].
Y E SThe information was helpful.
N OThe information was not helpful.
We value your feedback!Was the information in this report helpful?

Page 2 of 7 | © 2019 Experient


