Ideas and Resources for Teaching Statistics: Two Resources from the Past Author(s): Peter Holmes Source: Mathematics in School, Vol. 32, No. 5 (Nov., 2003), pp. 4-6 Published by: The Mathematical Association Stable URL: http://www.jstor.org/stable/30215617 . Accessed: 06/10/2013 11:57 Your use of the JSTOR archive indicates your acceptance of the Terms & Conditions of Use, available at . http://www.jstor.org/page/info/about/policies/terms.jsp . JSTOR is a not-for-profit service that helps scholars, researchers, and students discover, use, and build upon a wide range of content in a trusted digital archive. We use information technology and tools to increase productivity and facilitate new forms of scholarship. For more information about JSTOR, please contact [email protected]. . The Mathematical Association is collaborating with JSTOR to digitize, preserve and extend access to Mathematics in School. http://www.jstor.org This content downloaded from 131.170.6.51 on Sun, 6 Oct 2013 11:57:42 AM All use subject to JSTOR Terms and Conditions
Transcript
Ideas and Resources for Teaching Statistics: Two Resources from the PastAuthor(s): Peter HolmesSource: Mathematics in School, Vol. 32, No. 5 (Nov., 2003), pp. 4-6Published by: The Mathematical AssociationStable URL: http://www.jstor.org/stable/30215617 .
Accessed: 06/10/2013 11:57
Your use of the JSTOR archive indicates your acceptance of the Terms & Conditions of Use, available at .http://www.jstor.org/page/info/about/policies/terms.jsp
.JSTOR is a not-for-profit service that helps scholars, researchers, and students discover, use, and build upon a wide range ofcontent in a trusted digital archive. We use information technology and tools to increase productivity and facilitate new formsof scholarship. For more information about JSTOR, please contact [email protected].
.
The Mathematical Association is collaborating with JSTOR to digitize, preserve and extend access toMathematics in School.
http://www.jstor.org
This content downloaded from 131.170.6.51 on Sun, 6 Oct 2013 11:57:42 AMAll use subject to JSTOR Terms and Conditions
Ideas and pesources fo Teaching Statistics - two pesouices riom the past
by Peter Holmes
Statistics has been taught in English schools now for over 40 years. During that time a lot of ideas have been discussed and a lot of material generated. There is no reason for us always to try to invent everything from scratch. Here are two free resources that are on the web site of the RSS Centre for Statistical Education (http://science.ntu.ac.uk/rsscse/).
The Schools Council Project on Statistical Education (POSE) This project was the largest curriculum development project worldwide on the teaching of statistics to pupils aged 11 to 16. It worked in the late 1970's, tested and refined its material in over 80 secondary schools of all types throughout the country and eventually published its material as 27 pupil and teacher booklets under the general title of Statistics in Your World. These booklets are now out of print but the material is available on http://science.ntu.ac.uk/rsscse/pose/index.html
There are three reasons why you might find this material useful.
1. It includes a lot of ideas for teaching probability and statistics that are timeless.
2. If you are looking for real data that you can use to make a historical contrast with current data then you will find many examples here.
3. The material takes the approach to teaching statistics described in the current programmes of study for Key Stages 3 and 4 of the English National Curriculum in Mathematics. Generally the units start with a question or area of investigation and develop the techniques in the context of investigating these questions. Every unit includes some aspect of interpreting the data and of trying to draw real inferences.
Probability is introduced in two ways. One is through games and the other is through ordering phrases such as likely, 50-50, impossible (with the pupils asked to generate examples) leading on to numerical values for these probabilities. Both of these occur in Probability Games (level 1). The basic understanding of probability measures is through the idea of relative frequencies settling down. This can pose problems for pupils with a poor grasp of fractions and decimals. POSE gets round this in the level 1 unit Shaking a Six by using the Stirling Recording Sheet. This auto- matically plots relative frequencies and the graph soon shows some settling down.
Probability is conceived of as a measure of uncertainty, not just as fractions, and simulations are widely used to show the variability in what might be expected. An early example of this is a simulation of booking seats on a bus so as to
... .................. ...... IT 1 L2 1 I I 4j sv N"Q dice B1Jt m I U se tvp-tP~ dice Gdasum of Get a sum of /G~n~~strcr
81,1011 o 12 'eads m ore, t~han6
se to-ttw d'io U seone die Use one, die Use oLlz~ne win: 3ef a sum oi ff-vw a 3 T hrow La Get a d'Hearf 7 4 -cit 55 From Probability Games, level 1
maximize the number of seats taken but to avoid over- booking on too many occasions (If at First, level 1). Other simulations occur throughout the units; one simulating a simple birth and death model for population growth is in Multiplying People (level 3).
START etsuce -
No bher of successes awtr 20 tn'OWS Fractions of successes
00 o1 02 0"3 04 0'5 0o6 0 0"8 o9 I o
15. - I$---. 0 .- :
N r be oisuc~ssesaftf 2 thow
Fractons f sucesse
Decifna
00 01 01 ,3 0- 05 0, 07 ' 9 ;
Stirling Record Sheet from Shaking a Six, level 1
The vague idea of fairness can lead to the idea of random samples and also to the ideas of equally likely probabilities. Both of these are found in Being Fair to Ernie (level 1) where both are also linked to using random numbers. These ideas are put into practice in Fair Play (level 2), which investigates the sort of games that may be used at a school fate.
Push penny grid from Fair Play, level 2
4 Mathematics in School, November 2003 The MA web site www.m-a.org.uk
This content downloaded from 131.170.6.51 on Sun, 6 Oct 2013 11:57:42 AMAll use subject to JSTOR Terms and Conditions
Simple survey work is done in several units. Leisure for Pleasure (level 1) collects data on how pupils use their spare time and uses pie charts and histograms to plot the results. Important ideas for questionnaire design are introduced in Opinion Matters (level 2); not only does this unit show how to write good questions it also shows in practice what can happen with poor questions. A very useful, and under-rated skill is designing and reading tables. This is introduced in Tidy Tables (level 1). All these principles are applied in Pupil Poll (level 3) where pupils carry out a survey.
In the Key Stage 4 (Foundation) programme of study reference is made to the Retail Price index and to the National Census. Both of these are covered in POSE units - Retail Price Index (level 4) and Sampling the Census (level 4), respectively.
Some interesting examples of inference from real data are in Authors Anonymous (level 2 - how can you use data to distinguish between two possible authors of a piece of writing); Car Careers (level 3 - using officially published statistics to estimate how long a car lasts); Equal Pay (level 4 - using official data to see whether the Equal Pay Act had its required effect on women's pay); Smoking and Health (level 4 - on the data that led to the inference that smoking causes different aspects of ill health). Testing Testing (level 4) shows how you can use probability and statistics to investigate the social consequences of the breathalyser not being a perfect measure of blood alcohol and of the inaccuracy in medical screening tests.
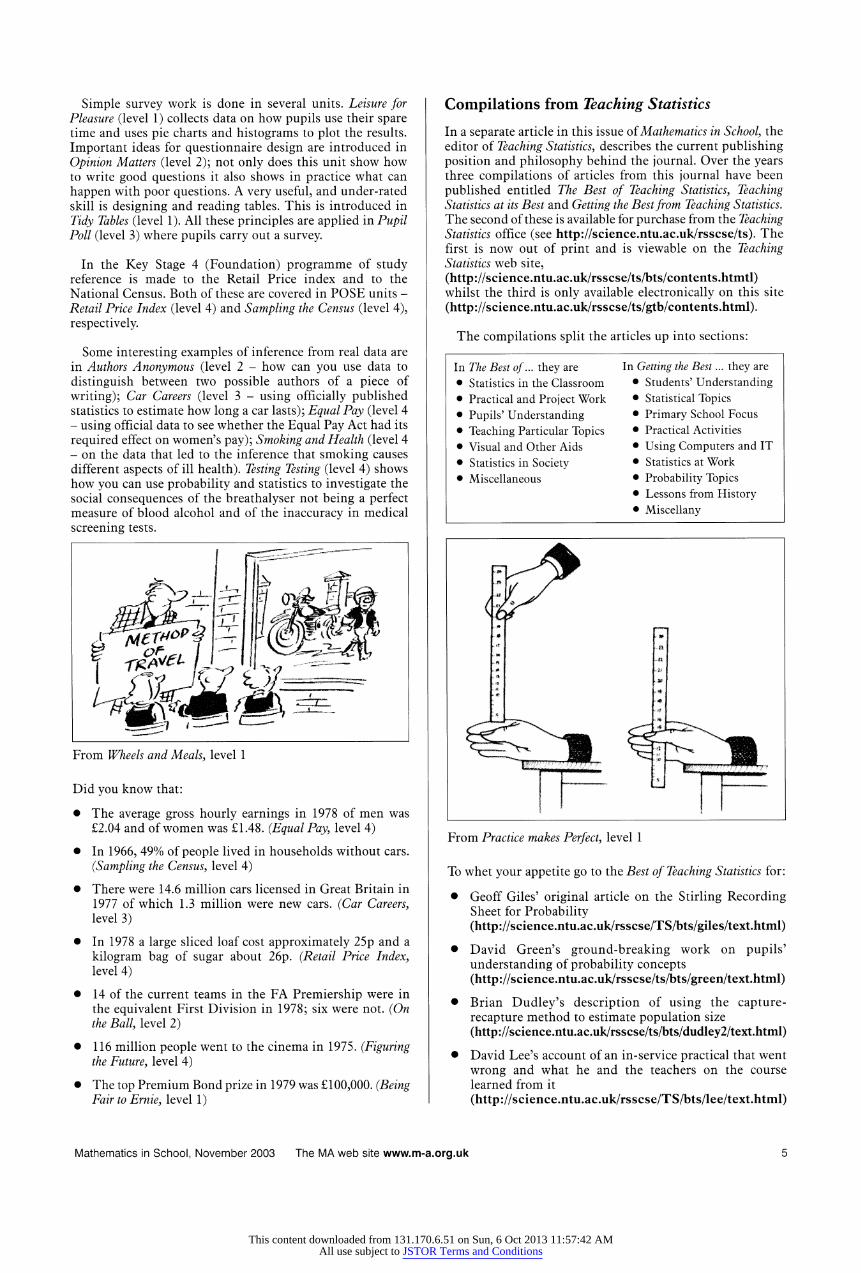
From Wheels and Meals, level 1
Did you know that:
* The average gross hourly earnings in 1978 of men was 02.04 and of women was 01.48. (Equal Pay, level 4)
* In 1966, 49% of people lived in households without cars. (Sampling the Census, level 4)
* There were 14.6 million cars licensed in Great Britain in 1977 of which 1.3 million were new cars. (Car Careers, level 3)
* In 1978 a large sliced loaf cost approximately 25p and a kilogram bag of sugar about 26p. (Retail Price Index, level 4)
* 14 of the current teams in the FA Premiership were in the equivalent First Division in 1978; six were not. (On the Ball, level 2)
* 116 million people went to the cinema in 1975. (Figuring the Future, level 4)
* The top Premium Bond prize in 1979 was 0100,000. (Being Fair to Ernie, level 1)
Compilations from Teaching Statistics
In a separate article in this issue of Mathematics in School, the editor of Teaching Statistics, describes the current publishing position and philosophy behind the journal. Over the years three compilations of articles from this journal have been published entitled The Best of Teaching Statistics, Teaching Statistics at its Best and Getting the Bestfrom Teaching Statistics. The second of these is available for purchase from the Teaching Statistics office (see http://science.ntu.ac.uk/rsscse/ts). The first is now out of print and is viewable on the Teaching Statistics web site, (http://science.ntu.ac.uk/rsscse/ts/bts/contents.htmtl) whilst the third is only available electronically on this site (http://science.ntu.ac.uk/rsscse/ts/gtb/contents.html).
The compilations split the articles up into sections:
In The Best of... they are * Statistics in the Classroom * Practical and Project Work * Pupils' Understanding * Teaching Particular Topics * Visual and Other Aids * Statistics in Society * Miscellaneous
In Getting the Best ... they are * Students' Understanding * Statistical Topics " Primary School Focus * Practical Activities * Using Computers and IT * Statistics at Work * Probability Topics * Lessons from History * Miscellany
From Practice makes Perfect, level 1
To whet your appetite go to the Best of Teaching Statistics for:
* Geoff Giles' original article on the Stirling Recording Sheet for Probability (http://science.ntu.ac.uk/rsscse/TS/bts/giles/text.html)
* David Green's ground-breaking work on pupils' understanding of probability concepts (http://science.ntu.ac.uk/rssecse/ts/bts/green/text.html)
* Brian Dudley's description of using the capture- recapture method to estimate population size (http://science.ntu.ac.uk/rsscse/ts/bts/dudley2/text.html)
* David Lee's account of an in-service practical that went wrong and what he and the teachers on the course learned from it (http://science.ntu.ac.uk/rsscse/TS/bts/lee/text.html)
Mathematics in School, November 2003 The MA web site www.m-a.org.uk 5
This content downloaded from 131.170.6.51 on Sun, 6 Oct 2013 11:57:42 AMAll use subject to JSTOR Terms and Conditions
* Peter Moore's description of a piece of practical work that can link subjective probability with the relative frequency concept of probability (http://science.ntu.ac.uk/rsscse/TS/bts/moore/text.html)
* Kerstin Vannman's example to convince first year under- graduate students that an estimator is a random variable (http://science.ntu.ac.uk/rsscse/ts/bts/vannman/text.html).
BECA)SE S'TEY
MAKE STUDENTS -Z No LECTURES?
FIND THEIR WLHY DON'T
oWN WAY OF You
LIKE.t.,
97 HoW TO LIS -
THEM ? i i T T 6 Wrm SMSTIls.rp 00
-+, -. =2_::_ -i7 . -vat-,*
From Vannman's article in The Best of Teaching Statistics
Go to Getting the Bestfrom Teaching Statistics (http://science.ntu.ac.uk/rsscse/ts/gtb/contents.html then click the appropriate pdf icon) for:
* Richard Madsen's survey of secondary students' under- standing of probability
* James Nicholson on exploring the effect of different sampling methods on estimates
* Trevor Smart's excellent practical demonstration of sampling bias in a simple experiment
* Roger Johnson's description of a class activity to test the colour of M&M's (Smarties in the UK)
* Robert Matthews on coincidences
* Larry Lesser's use of counterintuitive examples to motivate students
* Dennis Lindley on the analysis of experimental data
and many, many more.
I
1700-
o1600
150c
1400-
1300-
120D
1100
1000 1 2 3
Random O d
Fig. 2. Boxplot of average values from different samples.
From Nicholson's article in Getting the Best from Teaching Statistics
Happy surfing!!
Acknowledgements All illustrations are taken from the web site of the RSS Centre for Statistical Education (http://science.ntu.ac.uk/rsscse/). The POSE material is copyright QCA and is on the web site with permission. The material from back issues of Teaching Statistics is copyright the Teaching Statistics Trust and is reproduced with permission.
Keywords: Statistics; Probability.
Author Peter Holmes, 87 Furness Avenue, Sheffield S17 3QN.
Maths Takes Shape The Mathematical Association's
Annual Easter Conference
at the
University of York 13th - 16th April 2004
Keynote Speakers lan Stewart
David Acheson, Rob Eastaway Des MacHale, Kjartan Poskitt,
Sir Christopher Zeeman
and many other excellent session leaders
A Personal Development
Opportunity you can't afford to
miss!
To receive a brochure and booking form send your name and address: