Ideas by Statistical Mechanics (ISM) † Lester Ingber Lester Ingber Research (LIR) <[email protected]> <[email protected]> [http://www.ingber.com] Abstract Ideas by Statistical Mechanics (ISM) is a generic program to model evolution and propagation of ideas/patterns throughout populations subjected to endogenous and exogenous interactions. The program is based on the author’s work in Statistical Mechanics of Neocortical Interactions (SMNI), and uses the author’s Adaptive Simulated Annealing (ASA) code for optimizations of training sets, as well as for importance-sampling to apply the author’s copula financial risk-management codes, Trading in Risk Dimensions (TRD), for assessments of risk and uncertainty. This product can be used for decision support for projects ranging from diplomatic, information, military, and economic (DIME) factors of propagation/evolution of ideas, to commercial sales, trading indicators across sectors of financial markets, advertising and political campaigns, etc. It seems appropriate to base an approach for propagation of ideas on the only system so far demonstrated to develop and nurture ideas, i.e., the neocortical brain. A statistical mechanical model of neocortical interactions, developed by the author and tested successfully in describing short-term memory and EEG indicators, is the proposed model. ISM develops subsets of macrocolumnar activity of multivariate stochastic descriptions of defined populations, with macrocolumns defined by their local parameters within specific regions and with parameterized endogenous inter-regional and exogenous external connectivities. Parameters of subsets of macrocolumns will be fit using ASA to patterns representing ideas. Parameters of external and inter-regional interactions will be determined that promote or inhibit the spread of these ideas. Tools of financial risk management, developed by the author to process correlated multivariate systems with differing non-Gaussian distributions using modern copula analysis, importance- sampled using ASA, will enable bona fide correlations and uncertainties of success and failure to be calculated. Marginal distributions will be evolved to determine their expected duration and stability using algorithms developed by the author, i.e., PATHTREE and PATHINT codes. Keywords: statistical mechanics, neocortical interactions, simulated annealing, risk management † L. Ingber, “Ideas by statistical mechanics (ISM),” Report 2006:ISM, Lester Ingber Research, Ashland, OR, 2006. URL http://www.ingber.com/smni06_ism.pdf. Early drafts can be downloaded from http://arxiv.org/pdf/cs.CE/0607103 and http://ssrn.com/abstract=918860. A short version appears as "AI and Ideas by Statistical Mechanics (ISM)" in Encyclopedia of Artificial Intelligence (2008), and details in this paper appear in "Ideas by Statistical Mechanics (ISM)", Journal of Integrated Systems Design and Process Science, Vol. 11, No. 3, pp. 31-54 (2007), Special Issue: Biologically Inspired Computing. $Id: smni06_ism,v 1.41 2009/03/28 16:45:13 ingber Exp $
AbstractIdeas by Statistical Mechanics (ISM) is a generic program to model evolution and propagation ofideas/patterns throughout populations subjected to endogenous and exogenous interactions. The programis based on the author’s work in Statistical Mechanics of Neocortical Interactions (SMNI), and uses theauthor’s Adaptive Simulated Annealing (ASA) code for optimizations of training sets, as well as forimportance-sampling to apply the author’s copula financial risk-management codes, Trading in RiskDimensions (TRD), for assessments of risk and uncertainty. This product can be used for decisionsupport for projects ranging from diplomatic, information, military, and economic (DIME) factors ofpropagation/evolution of ideas, to commercial sales, trading indicators across sectors of financial markets,advertising and political campaigns, etc.
It seems appropriate to base an approach for propagation of ideas on the only system so far demonstratedto develop and nurture ideas, i.e., the neocortical brain.A statistical mechanical model of neocorticalinteractions, developed by the author and tested successfully in describing short-term memory and EEGindicators, is the proposed model.ISM develops subsets of macrocolumnar activity of multivariatestochastic descriptions of defined populations, with macrocolumns defined by their local parameterswithin specific regions and with parameterized endogenous inter-regional and exogenous externalconnectivities. Parameters of subsets of macrocolumns will be fit using ASA to patterns representingideas. Parameters of external and inter-regional interactions will be determined that promote or inhibit thespread of these ideas.Tools of financial risk management, developed by the author to process correlatedmultivariate systems with differing non-Gaussian distributions using modern copula analysis, importance-sampled using ASA, will enable bona fide correlations and uncertainties of success and failure to becalculated. Marginal distributions will be evolved to determine their expected duration and stability usingalgorithms developed by the author, i.e., PATHTREE and PATHINT codes.
† L. Ingber, “Ideas by statistical mechanics (ISM),” Report 2006:ISM, Lester Ingber Research, Ashland,OR, 2006. URL http://www.ingber.com/smni06_ism.pdf. Earlydrafts can be downloaded fromhttp://arxiv.org/pdf/cs.CE/0607103 and http://ssrn.com/abstract=918860.
A short version appears as "AI and Ideas by Statistical Mechanics (ISM)" in Encyclopedia of ArtificialIntelligence (2008), and details in this paper appear in "Ideas by Statistical Mechanics (ISM)", Journal ofIntegrated Systems Design and Process Science, Vol. 11, No. 3, pp. 31-54 (2007), Special Issue:Biologically Inspired Computing.
1. Significance of ProblemA briefing [2] demonstrates the breadth and depth complexity required to address real diplomatic,information, military, economic (DIME) factors for the propagation/evolution of ideas through definedpopulations. Anopen mind would conclude that it is possible that multiple approaches may be requiredfor multiple decision makers in multiple scenarios.However, it is in the interests of multiple decision-makers to as much as possible rely on the same generic model for actual computations.Many userswould have to trust that the coded model is faithful to process their inputs.
Similar to DIME scenarios, sophisticated competitive marketing requires assessments of responses ofpopulations to new products.
Many large financial institutions are now trading at speeds barely limited by the speed of light.They co-locate their servers close to exchange floors to be able to turn quotes into orders to be executed withinmsecs. Clearly, trading at these speeds require automated algorithms for processing and makingdecisions. Thesealgorithms are based on “technical” information derived from price, volume and quote(Level I I) information. The next big hurdle to automated trading is to turn “fundamental” informationinto technical indicators, e.g., to include new political and economic news into such algorithms.
Ideas by Statistical Mechanics (ISM) can be developed to address these issues. [ism (noun): A belief (orsystem of beliefs) accepted as authoritative by some group or school.A doctrine or theory; especially, awild or visionary theory. A distinctive doctrine, theory, system, or practice.]
A short summary of the detailed description provided here appears in the 2008 issue of the Encyclopediaof Artificial Intelligence[56] with a collection of new approaches to artificial intelligence. Details in thispaper appear in the Journal of Integrated Systems Design and Process Science, Special Issue: BiologicallyInspired Computing [54].
1.1. Bottom-Upversus Top-DownThe concept of “memes” is an example of an approach to deal with DIME factors [74].
The meme approach, using a reductionist philosophy of evolution among genes, is reasonably contrastedto approaches emphasizing the need to include relatively global influences of evolution [75].
A best selling book on propagation of ideas documents many contexts where the spreading of informationoften follows a diffusion process [9].
It seems appropriate to base an approach for propagation of ideas on the only system so far demonstratedto develop and nurture ideas, i.e., the neocortical brain.In the present context, the author’s approach,using guidance from his statistical mechanics of human neocortical interactions (SMNI), developed in aseries of about 30 published papers from 1981-2001[14-16,20,29,33,35,41,43,44,46], also addresseslong-standing issues of information measured by electroencephalography (EEG) as arising from bottom-up local interactions of clusters of thousands to tens of thousands of neurons interacting via short-rangedfibers), or top-down influences of global interactions (mediated by long-ranged myelinated fibers). SMNIdoes this by including both local and global interactions as being necessary to develop neocorticalcircuitry.
1.2. CostFunctions for IdeasComputational approaches developed to process different approaches to modeling phenomena must not beconfused with the models of these phenomena.For example, the meme approach lends it self well to acomputational scheme in the spirit of genetic algorithms (GA).The cost/objective function that describesthe phenomena of course could be processed by any other sampling technique such as simulatedannealing (SA). One comparison[62] demonstrated the superiority of SA over GA on cost/objectivefunctions used in a GA database. That study used Very Fast Simulated Annealing (VFSR), created by theauthor for military simulation studies [26], which has evolved into Adaptive Simulated Annealing(ASA) [30]. However, it is the author’s experience that the Art and Science of sampling complex systemsrequires tuning expertise of the researcher as well as good codes, and GA or SA likely would do as wellon cost functions for this study.
Lester Ingber Research - 5 - ISM
A very important issue is for this project is to develop cost functions for this study, not only how to fit orprocess them.For example, a cost function may be obtained directly from minus the logarithm of themultivariate distribution describing all variables (related to the entropy or “information”), as was done forsome SMNI and financial markets studies.
1.3. Inclusionof non-Gaussian Correlated SystemsThis approach includes application of methods of portfolio risk analysis to such statistical systems.Thereare often two kinds of errors committed in multivariate risk analyses: (E1) Although the distributions ofvariables being considered are not Gaussian (or not tested to see how close they are to Gaussian), standardstatistical calculations appropriateonly to Gaussian distributions are employed. (E2)Either correlationsamong the variables are ignored, or the mistakes committed in (E1) — incorrectly assuming variables areGaussian — are compounded by calculating correlations as if all variables were Gaussian.
The harm in committing errors E1 and E2 can be fatal — fatal to the analysis and/or fatal to people actingin good faith on the basis of these risk assessments. Risk is measured by tails of distributions. So,if thetails of some variables are much fatter or thinner than Gaussian, the risk in committing E1 can be quiteterrible. Many times systems are pushed to and past desired levels of risk when several variables becomehighly correlated, leading to extreme dependence of the full system on the sensitivity of these variables.It is very important not to commit E2 errors.
The Trading in Risk Dimensions (TRD) project addresses these issues in the context of financial riskmanagement, but the tools and codes are generic [52].
1.4. OtherAlternati vesThere are multiple other alternative works being conducted world-wide that must be at least kept in mindwhile developing and testing models of evolution/propagation of ideas in defined populations: A study ona (too) simple algebraic model of opinion formation concluded that the only final opinions are extremalones [1]. A study of the influence on chaos on opinion formation, using a simple algebraic model,concluded that contrarian opinion could persist and be crucial in close elections, albeit the authors werecareful to note that most real populations probably do not support chaos[5]. A limited review of work insocial networks illustrates that there are about as many phenomena to be explored as there are disciplinesready to apply their network models [73].
2. Technical Objectives
2.1. Architecture for Selected ModelThe primary objective is to deliver a computer model that contains the following features: (1) Amultivariable space will be defined to accommodate populations.(2) A cost function over the populationvariables in (1) will be defined to explicitly define a pattern that can be identified as an Idea. (3) Subsetsof the population will be used to fit parameters — e.g, coefficients of variables, connectivities to patterns,etc. — to an Idea, using the cost function in (2). (4) Connectivity of the population in (3) will be made tothe rest of the population.Investigations will be made to determine what endogenous connectivity isrequired to stop or promote the propagation of the Idea into other regions of the population.(5) Externalforces, e.g., acting only on specific regions of the population, will be introduced, to determine how theseexogenous forces may stop or promote the propagation of an Idea.
3. Work Plan
3.1. Application of SMNI ModelA statistical mechanical model of neocortical interactions, developed by the author and tested successfullyin describing short-term memory (STM) and in training and testing EEG indicators, is the model usedhere to address DIME factors for the propagation/evolution of Ideas through defined populations.
The approach here is to develop subsets of Ideas/macrocolumnar activity of multivariate stochasticdescriptions of defined populations (of a reasonable but small population samples, e.g., of 100−1000),
Lester Ingber Research - 6 - ISM
with macrocolumns defined by their local parameters within specific regions (larger samples ofpopulations) and with parameterized long-ranged inter-regional and external connectivities. Parametersof a given subset of macrocolumns will be fit using ASA to patterns representing Ideas, akin to acquiringhard-wired long-term memory (LTM) patterns.Parameters of external and inter-regional interactions willbe determined that promote or inhibit the spread of these Ideas, by determining the degree of fits andoverlaps of probability distributions relative to the seeded macrocolumns.
That is, the same Ideas/patterns may be represented in other than the seeded macrocolumns by localconfluence of macrocolumnar and long-ranged firings, akin to STM, or by different hard-wired parameterLTM sets that can support the same local firings in other regions (possible in nonlinear systems).SMNIalso calculates how STM can be dynamically encoded into LTM [15].
Small populations in regions will be sampled to determine if the propagated Idea(s) exists in its patternspace where it did exist prior to its interactions with the seeded population.SMNI derives nonlinearfunctions as arguments of probability distributions, leading to multiple STM, e.g., 7± 2 for auditorymemory capacity. Some investigation will be made into nonlinear functional forms other than thosederived for SMNI, e.g., to have capacities of tens or hundreds of patterns for ISM.
3.2. Application of TRD AnalysisTools of financial risk management, developed by the author to process correlated multivariate systemswith differing non-Gaussian distributions using modern copula analysis, importance-sampled using ASA,will enable bona fide correlations and uncertainties of success and failure to be calculated[52]. Marginaldistributions will be evolved to determine their expected duration and stability using algorithms developedby the author, i.e., PATHTREE [57] and PATHINT [45] codes.
3.3. Exampleof Use of ISMFor an example of problems that can be approached by ISM, for specificity consider some data that mightbe drawn from opinions, or internet sampling, etc., and mapped onto several variables. Saythat themapped/projected data has a range that is dense enough (e.g., 10 or more divisions) so that it makes senseto build histograms -- which are essentially marginal probability distributions for each variable. If thesystem is such that it is changing in time, e.g., due to volatility of the system or changing trends/contexts,then this really is a multivariate stochastic process.For a large class of distributions, the timedevelopment can be used to better fit the models, e.g., using PATHINT/PATHTREE code to evolve themodel and fit the model over a time domain as well.
ASA can fit the data to some forms of reasonable distributions. TRDcopula codes can transform thesedistributions (which likely are not Gaussian) into a space where it makes sense to develop correlations andcovariances -- the point of using modern copula analysis for risk management, etc. In most systems it isimportant to properly treat correlations.
Now, consider introducing a product or an idea into a city or two within one of two countries. Therecanbe “long-ranged” interactions/influences between cities within one country and cities within the othercountry. Within a country, there are relatively “short-ranged” (different from long-ranged, e.g., due tocultural distances, etc.) interactions. The problem posed is how to (a) model this total system composedof two (or more) countries with their inner cities, (b) how to promote or retard the development of certainproducts or ideas, e.g., how to seed the process to enhance a desired goal.
This is very much like the real brain modeled by SMNI in detail to fit EEG data across regions ofneocortex (where here different neocortical regions are like different countries, e.g., like auditory, visual,somatic, associative, frontal cortical regions), and the within each region there are macrocolumnarinteractions (like within cities).
Somewhat more specifically, the distributions likely have multiple states to support several to many ideasor themes, akin to states of short-term memory (STM). These can be maintained by stochastic activity ofthe underlying model which was not not set prior to hold such states. These states might even becompeting preferences or ideas. After time, the parameters of the model may be modified/adapted tostore these activity patterns more solidly into the parameters of the system, e.g., into a long-term memory(LTM) storage, which likely would be harder to modify with the long-ranged interactions.The long-
Lester Ingber Research - 7 - ISM
ranged interactions, which can exist endogenously in the total system, probably can be more easilymodified (than the short-ranged interactions) by introduction of exogenous activity, permitting some kindof control over the system.
The use of multivariate stochastic processes at just these few lev els, albeit requiring relativelysophisticated computational algebra and numerical algorithms, suffice to explain a lot of brain processes,and this also would suffice to explain some useful tactics and strategies for a lot of businesses.
4. RelatedWork
4.1. StatisticalMechanics of Neocortical Interactions (SMNI)
4.1.1. Application to ISM ProjectNeocortex has evolved to use minicolumns of neurons interacting via short-ranged interactions inmacrocolumns, and interacting via long-ranged interactions across regions of macrocolumns.Thiscommon architecture processes patterns of information within and among different regions of sensory,motor, associative cortex, etc. Therefore, the premise of this approach is that this is a good model todescribe and analyze evolution/propagation of Ideas among defined populations.
Relevant to this study is that a spatial-temporal lattice-field short-time conditional multiplicative-noise(nonlinear in drifts and diffusions) multivariate Gaussian-Markovian probability distribution is developedfaithful to neocortical function/physiology. Such probability distributions are a basic input into theapproach used here. The SMNI model was the first physical application of a nonlinear multivariatecalculus developed by other mathematical physicists in the late 1970’s to define a statistical mechanics ofmultivariate nonlinear nonequilibrium systems [10,67].
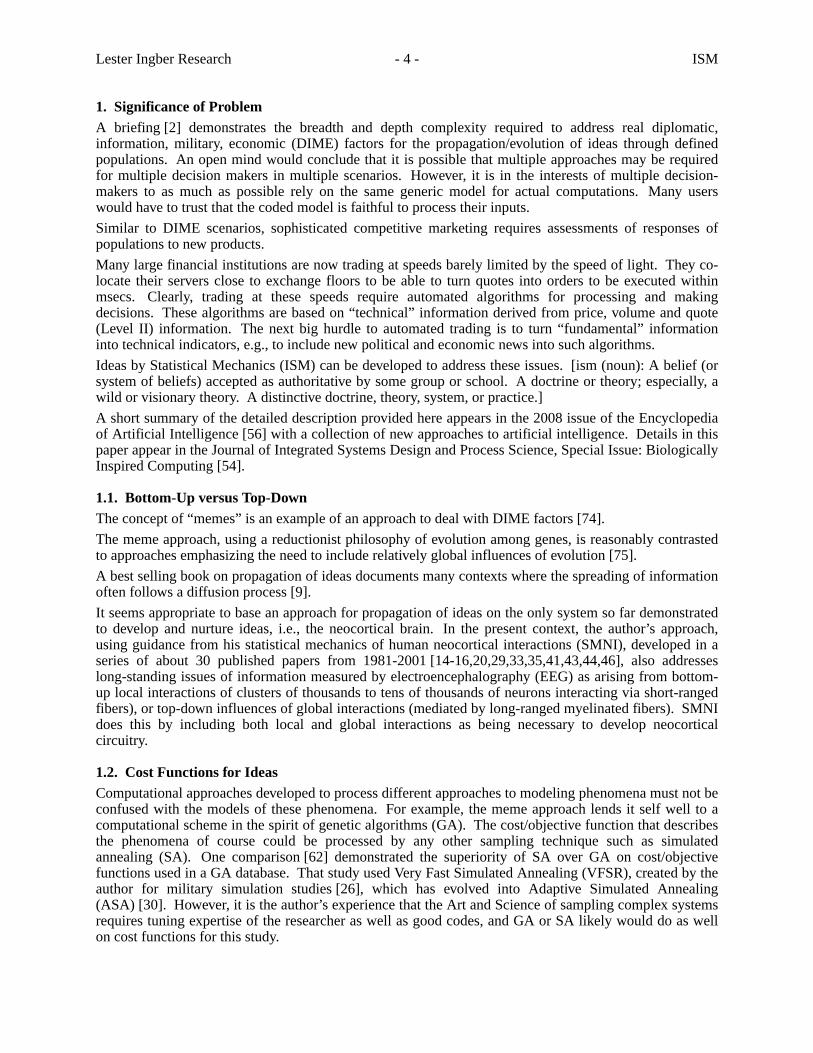
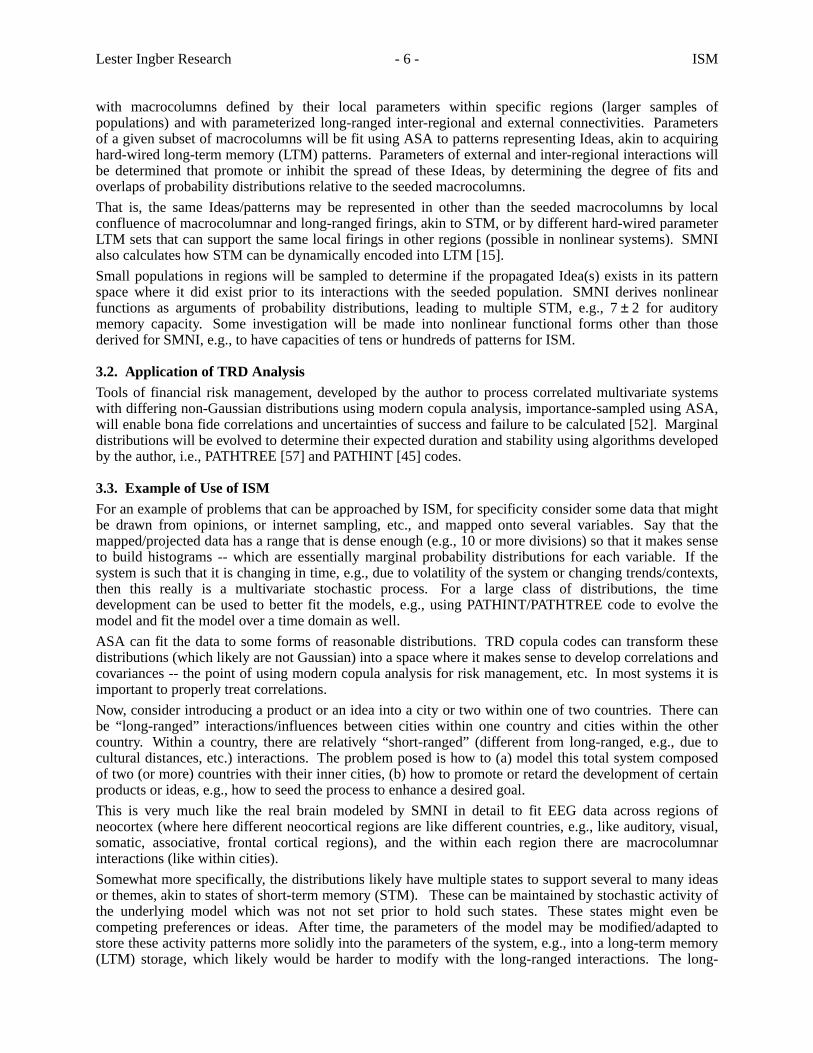
4.1.2. SMNITests on STM and EEGThe author has developed a statistical mechanics of neocortical interactions (SMNI) for human neocortex,building from synaptic interactions to minicolumnar, macrocolumnar, and regional interactions inneocortex. Since1981, a series of papers on the statistical mechanics of neocortical interactions (SMNI)has been developed to model columns and regions of neocortex, spanning mm to cm of tissue, Asdepicted in Figure 1, SMNI develops three biophysical scales of neocortical interactions: (a)-(a* )-(a’)microscopic neurons; (b)-(b’) mesocolumnar domains; (c)-(c’) macroscopic regions. SMNI hasdeveloped appropriate conditional probability distributions at each level, aggregating up from the smallestlevels of interactions.In (a* ) synaptic inter-neuronal interactions, averaged over by mesocolumns, arephenomenologically described by the mean and variance of a distribution Ψ. Similarly, in (a)intraneuronal transmissions are phenomenologically described by the mean and variance of Γ.Mesocolumnar averaged excitatory (E) and inhibitory (I ) neuronal firings M are represented in (a’).In(b) the vertical organization of minicolumns is sketched together with their horizontal stratification,yielding a physiological entity, the mesocolumn. In (b’) the overlap of interacting mesocolumns atlocationsr andr′ from timest andt + τ is sketched. In(c) macroscopic regions of neocortex are depictedas arising from many mesocolumnar domains. (c’) sketches how regions may be coupled by long−rangedinteractions.
Most of these papers have dealt explicitly with calculating properties of STM and scalp EEG in order totest the basic formulation of this approach[13-16,19,20,22,28,29,33,35,36,38,39,41,43,60,61]. TheSMNI modeling of local mesocolumnar interactions (convergence and divergence between minicolumnarand macrocolumnar interactions) was tested on STM phenomena.The SMNI modeling ofmacrocolumnar interactions across regions was tested on EEG phenomena.
4.1.3. SMNIDescription of STM
SMNI studies have detailed that maximal numbers of attractors lie within the physical firing space ofMG ,where G = {Excitatory, Inhibitory} minicolumnar firings, consistent with experimentally observedcapacities of auditory and visual STM, when a “centering” mechanism is enforced by shifting backgroundnoise in synaptic interactions, consistent with experimental observations under conditions of selective
Lester Ingber Research - 8 - ISM
Fig. 1. Illustrated are three biophysical scales of neocortical interactions: (a)-(a* )-(a’)microscopic neurons; (b)-(b’) mesocolumnar domains; (c)-(c’) macroscopic regions.
attention [16,20,33,61,71].This leads to all attractors of the short-time distribution lying along a diagonalline in MG space, effectively defining a narrow parabolic trough containing these most likely firing states.This essentially collapses the 2 dimensionalMG space down to a one-dimensional space of mostimportance. Thus,the predominant physics of STM and of (short-fiber contribution to) EEG phenomenatakes place in a narrow “parabolic trough” inMG space, roughly along a diagonal line [16].
These calculations were further supported by high-resolution evolution of the short-time conditional-probability propagator using PATHINT [61]. SMNI correctly calculated the stability and duration ofSTM, the primacy versus recency rule, random access to memories within tenths of a second as observed,and the observed 7± 2 capacity rule of auditory memory and the observed 4± 2 capacity rule of visualmemory.
SMNI also calculates how STM patterns (e.g., from a given region or even aggregated from multipleregions) may be encoded by dynamic modification of synaptic parameters (within experimentallyobserved ranges) into long-term memory patterns (LTM) [15].
4.1.4. SMNIDescription of EEGUsing the power of this formal structure, sets of EEG and evoked potential data from a separate NIHstudy, collected to investigate genetic predispositions to alcoholism, were fitted to an SMNI model on alattice of regional electrodes to extract brain “signatures” of STM[41,43]. Eachelectrode site wasrepresented by an SMNI distribution of independent stochastic macrocolumnar-scaled MG variables,interconnected by long-ranged circuitry with delays appropriate to long-fiber communication inneocortex. The global optimization algorithm ASA was used to perform maximum likelihood fits ofLagrangians defined by path integrals of multivariate conditional probabilities. Canonical momentaindicators (CMI) were thereby derived for individual’s EEG data. The CMI give better signal recognitionthan the raw data, and were used to advantage as correlates of behavioral states. In-sample data was usedfor training [41], and out-of-sample data was used for testing [43] these fits.
These results gav e strong quantitative support for an accurate intuitive picture, portraying neocorticalinteractions as having common algebraic physics mechanisms that scale across quite disparate spatial
Lester Ingber Research - 9 - ISM
scales and functional or behavioral phenomena, i.e., describing interactions among neurons, columns ofneurons, and regional masses of neurons.
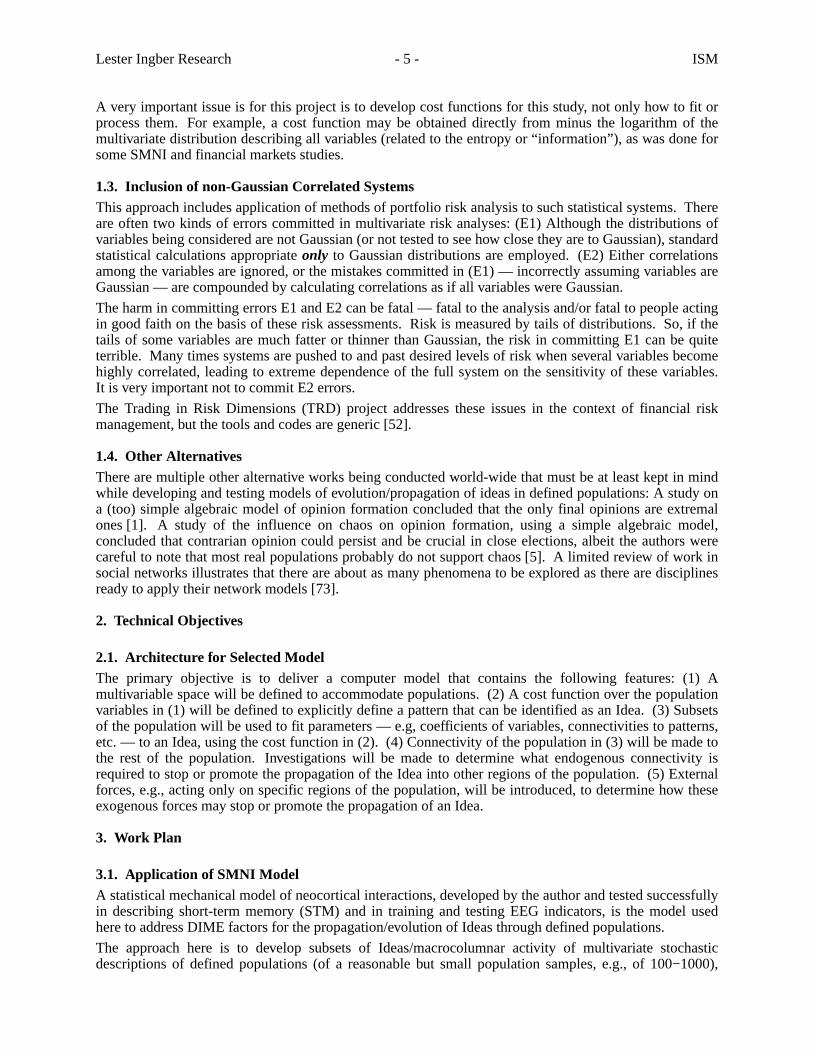
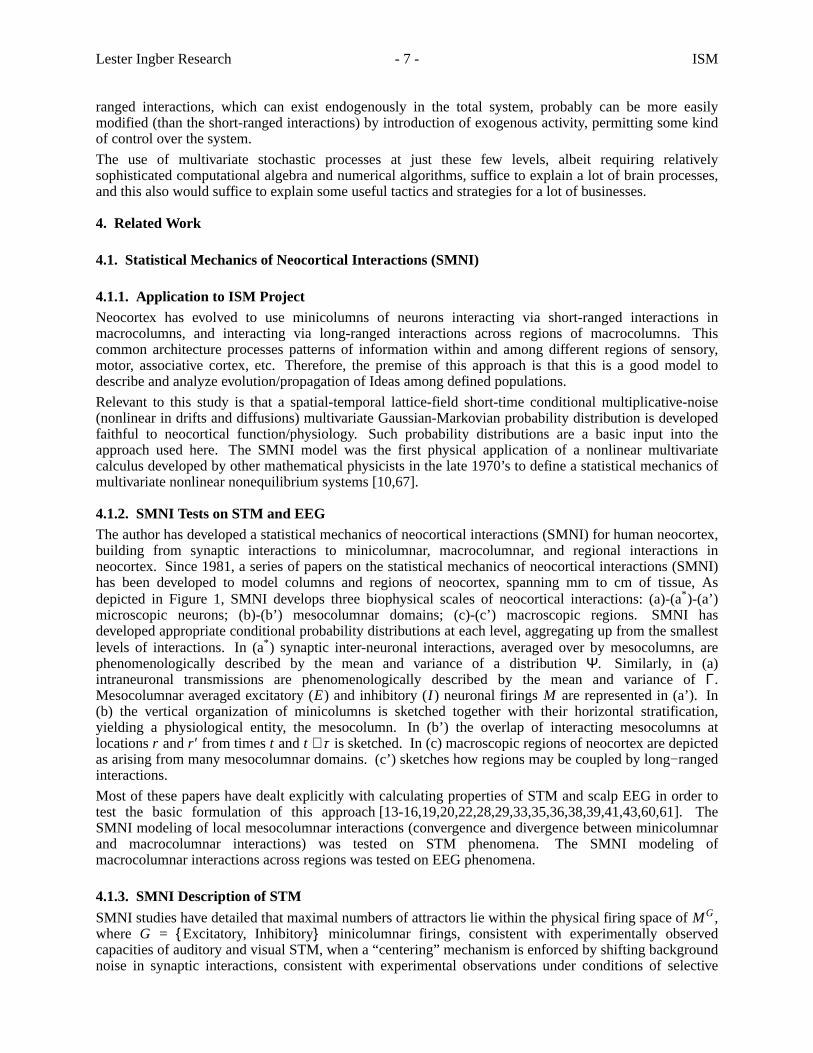
4.1.5. GenericMesoscopic Neural NetworksSMNI was applied to a parallelized generic mesoscopic neural networks (MNN) [29], as depicted inFigure 2, adding computational power to a similar paradigm proposed for target recognition [18].
Fig. 2. Scales of interactions among minicolumns are represented, within macrocolumns,across macrocolumns, and across regions of macrocolumns.
“Learning” takes place by presenting the MNN with data, and parametrizing the data in terms of thefi rings, or multivariate firings. The“weights,” or coefficients of functions of firings appearing in the driftsand diffusions, are fit to incoming data, considering the joint “effective” L agrangian (including thelogarithm of the prefactor in the probability distribution) as a dynamic cost function. This program offi tting coefficients in Lagrangian uses methods of ASA.
“Prediction” takes advantage of a mathematically equivalent representation of the Lagrangian path-integral algorithm, i.e., a set of coupled Langevin rate-equations.A coarse deterministic estimate to“predict” the evolution can be applied using the most probable path, but PATHINT has been used.PATHINT, even when parallelized, typically can be too slow for “predicting” evolution of these systems.However, PATHTREE is much faster.
The present project uses the same concepts, having sets of multiple variables define macrocolumns with aregion, with long-ranged connectivity to other regions. Eachmacrocolumn has its own parameters, whichdefine sets of possible patterns.Ultimately, ISM of course would not use functional relationshipsdeveloped solely in neocortex, but rather those more appropriate to a given population.
4.1.6. OnChaos in NeocortexThere are many papers on the possibility of chaos in neocortical interactions. While this phenomena mayhave some merit when dealing with small networks of neurons, e.g., in some circumstances such asepilepsy, these papers generally have considered only too simple models of neocortex.
The author took a model of chaos that might be measured by EEG, developed and published by somecolleagues, but adding background stochastic influences and parameters that were agreed to better modelneocortical interactions. The resulting multivariate nonlinear conditional probability distribution waspropagated many thousands of epochs, using the authors PATHINT code, to see if chaos could exist andpersist under such a model[63]. Therewas absolutely no measurable instance of chaos surviving in thismore realistic context.
4.1.7. MathematicalDevelopmentSome of the algebra behind SMNI depicts variables and distributions that populate each representativemacrocolumn in each region.
A derived mesoscopic LagrangianLM defines the short-time probability distribution of firings in aminicolumn, composed of∼102 neurons, given its just previous interactions with all other neurons in itsmacrocolumnar surround.G is used to represent excitatory (E) and inhibitory (I ) contributions. Gdesignates contributions from bothE andI .
PM =GΠ PG
M [MG(r; t + τ )|MG(r′; t)]
Lester Ingber Research - 10 - ISM
=σ j
Σ δ jEΣσ j − M E (r; t + τ )
δ
jIΣσ j − M I (r; t + τ )
N
jΠ pσ j
≈GΠ (2π τ gGG)−1/2 exp(−Nτ LG
M ) ,
PM ≈(2π τ )−1/2g1/2 exp(−Nτ LM ) ,
LM = LEM + L I
M = (2N )−1(MG − gG)gGG′(M
G′ − gG′) + MG JG /(2Nτ ) − V ′ ,
V ′ =GΣV ′′GG′(ρ∇MG′)2 ,
gG = −τ −1(MG + N G tanhFG) , gGG′ = (gGG′)−1 = δ G′
G τ −1N Gsech2FG , g = det(gGG′) ,
FG =(V G − a|G|
G′ v|G|G′ N G′ −
1
2A|G|
G′ v|G|G′ MG′)
((π [(v|G|G′ )
2 + (φ |G|G′ )
2](a|G|G′ N G′ +
1
2A|G|
G′ MG′)))1/2, aG
G′ =1
2AG
G′ + BGG′ , (1)
where AGG′ and BG
G′ are minicolumnar-averaged inter-neuronal synaptic efficacies, vGG′ and φ G
G′ areav eraged means and variances of contributions to neuronal electric polarizations.MG′ andN G′ in FG areafferent macrocolumnar firings, scaled to efferent minicolumnar firings byN /N * ∼10−3, whereN * is thenumber of neurons in a macrocolumn,∼105. Similarly, AG′
G and BG′G have been scaled byN * / N∼103 to
keepFG invariant. V ′ are mesocolumnar nearest-neighbor interactions.
4.1.7.1. Inclusionof Macroscopic Circuitry
The most important features of this development are described by the LagrangianLG in the negative ofthe argument of the exponential describing the probability distribution, and the “threshold factor” FG
describing an important sensitivity of the distribution to changes in its variables and parameters.
To more properly include long-ranged fibers, when it is possible to numerically include interactionsamong macrocolumns, theJG terms can be dropped, and more realistically replaced by a modifiedthreshold factorFG ,
FG =(V G − a|G|
G′ v|G|G′ N G′ −
1
2A|G|
G′ v|G|G′ MG′ − a‡E
E′ vEE′ N
‡E′ −1
2A‡E
E′ vEE′ M
‡E′)
((π [(v|G|G′ )
2 + (φ |G|G′ )
2](a|G|G′ N G′ +
1
2A|G|
G′ MG′ + a‡EE′ N‡E′ +
1
2A‡E
E′ M‡E′)))1/2,
a‡EE′ =
1
2A‡E
E′ + B‡EE′ . (2)
Here, afferent contributions fromN‡E long-ranged excitatory fibers, e.g., cortico-cortical neurons, havebeen added, whereN‡E might be on the order of 10% ofN ∗: Of the approximately 1010 to 1011
neocortical neurons, estimates of the number of pyramidal cells range from 1/10 to 2/3. Nearly everypyramidal cell has an axon branch that makes a cortico-cortical connection; i.e., the number of cortico-cortical fibers is of the order 1010.
4.1.8. Portfolio of Physiological Indicators (PPI)The ISM project uses the SMNI distributions as a template for distributions of populations. The TRDproject illustrates how such distributions can be developed as a Portfolio of Physiological Indicators (PPI),to calculate risk and uncertainty of functions, e.g., functions of Ideas, dependent on events that impactsuch populations [53].
Lester Ingber Research - 11 - ISM
4.1.8.1. Multiple Imaging DataIt is clear that the SMNI distributions also can be used to process different imaging data beyond EEG,e.g., also MEG, PET, SPECT, fMRI, etc., where each set of imaging data is used to fit it own set ofparameterized SMNI distributions using a common regional circuitry. (Different imaging techniques mayhave different sensitivities to different synaptic and neuronal activities.) Then,portfolios of these imagingdistributions can be developed to describe the total neuronal system, e.g., akin to a portfolio of a basket ofmarkets. For example, this could permit the uncertainties of measurements to be reduced by weightingthe contributions of different data sets, etc.Overlaps of distributions corresponding to different subsets ofdata give numerical specificity to the values of using these subsets.
It is to be expected that better resolution of behavioral events can be determined by joint distributions ofdifferent imaging data, rather than by treating each distribution separately.
4.1.8.2. LocalVersus Global InfluencesAnother twist on the use of this approach is to better understand the role of local and global contributionsto imaging data. EEG data is often collected at different electrode resolutions. Cost functions composedof these different collection-method variables can be used to calculate expectations over their imagingportfolios. For example, relative weights of two scales of collection methods can be fit as parameters, andrelative strengths as they contribute to various circuitries can be calculated. This method will be appliedto determine the degree of relevance of local and global activity during specific tasks. If some tasksinvolve circuitry with frontal cortex, then these methods may contribute to the understanding of the role ofconsciousness.
4.1.8.3. Binocular-Rivalry ExampleFor specificity, an example of the use of this approach is to extract information from binocular-rivalrytasks. Binocularrivalry likely is a stochastic Gamma process [68], wherein there can be as much as 20%of the data switching between states during either task.
Fitted SMNI distributions could be “Trained” on data presenting clear cases of brain states.Thesedistributions could then be “Tested” on out of sample clear data, and then used to match thesedistributions to data not so clearly defined. Theseresults may be sufficiently defined to be correlated withfrontal region activity, suggesting further studies on the role of consciousness in binocular rivalry.
4.1.8.4. Application to ISMThese kinds of applications of SMNI and TRD to PPI have obvious counterparts in ISM.Different kindsof data from populations often lead to different conclusions.A portfolio of distributions from thesedifferent data sets permits a better assessment of relative error/uncertainty of these conclusions.
4.2. ComputationalPhysics
4.2.1. Application to ISM ProjectThe author’s work in mathematical and computational physics, applying algorithms including those usedin this project to applications in several disciplines, including physics per se [21,34,42,57,63]neuroscience [14,16,29,35,39,43],finance [27,45,59,65],general optimization [3,26,31,37,62], andcombat analysis[6,32,58,64], illustrate the importance of properly applying these algorithms to thisproject.
4.2.2. Adaptive Simulated Annealing (ASA)Adaptive Simulated Annealing (ASA)[30] is used to optimize parameters of systems and also toimportance-sample variables for risk-management.
ASA is a C-language code developed to statistically find the best global fit of a nonlinear constrainednon-convex cost-function over a D-dimensional space. This algorithm permits an annealing schedule for“temperature”T decreasing exponentially in annealing-timek, T = T0 exp(−ck1/D). Theintroduction of
Lester Ingber Research - 12 - ISM
re-annealing also permits adaptation to changing sensitivities in the multi-dimensional parameter-space.This annealing schedule is faster than fast Cauchy annealing, whereT = T0/k, and much faster thanBoltzmann annealing, whereT = T0/ ln k. ASA has over 100 OPTIONS to provide robust tuning overmany classes of nonlinear stochastic systems.
For example, ASA has ASA_PARALLEL OPTIONS, hooks to use ASA on parallel processors, whichwere first developed in 1994 when the author was Principal Investigator (PI) of National ScienceFoundation grant DMS940009P, Parallelizing ASA and PATHINT Project (PAPP). Sincethen theseOPTIONS have been used by people in various institutions.
4.2.3. PATHINT and PATHTREEIn some cases, it is desirable to develop a time evolution of a short-time conditional probability, e.g., ofmarginal distributions in this study. Two useful algorithms have been developed and published by theauthor.
PATHINT [33] motivated the development of PATHTREE [57],an algorithm that permits extremely fastaccurate computation of probability distributions of a large class of general nonlinear diffusion processes.
The natural metric of the space is used to first lay down the mesh. The evolving local short-timedistributions on this mesh are then dynamically calculated. The short-time probability density gives thecorrect result up to orderO(∆t) for any final point S′, the order required to recover the correspondingpartial differential equation.
PATHINT and PATHTREE have demonstrated their utility in statistical mechanical studies in finance,neuroscience, combat analyses, neuroscience, and other selected nonlinear multivariatesystems [45,58,61].PATHTREE has been used extensively to price financial options [57].
4.2.3.1. RealOptions for Project Schedules (ROPS)An advantage to fitting data to nonlinear short-time conditional multiplicative-noise (nonlinear in driftsand diffusions) multivariate Gaussian-Markovian probability distributions, aside from robust features suchas forming Padeapproximates of ratios of drift and diffusion nonlinear functions, is that Real Optionsbased on this data can also be developed to estimate the future nature/value of marginal distributions [55].
Real Options for Project Schedules (ROPS) has three recursive sampling/optimization shells.An outerAdaptive Simulated Annealing (ASA) optimization shell optimizes parameters of strategic Planscontaining multiple Projects containing ordered Tasks. Amiddle shell samples probability distributionsof durations of Tasks. Aninner shell samples probability distributions of costs of Tasks. PATHTREE isused to develop options on schedules.Algorithms used for TRD are applied to develop a relative riskanalysis among projects.
4.3. StatisticalMechanics of Combat (SMC)
4.3.1. Application to ISM ProjectThe author has experience in several disciplines developing projects requiring developing and fittingnonlinear stochastic algorithms to data, including projects that require developing algorithms for accuratedescription and analysis of human activity.
4.3.2. Janus ProjectDuring 1988-1989, after a year of preparatory work, as a Professor of Physics with the US Navy, andworking with the US Army, the author was PI of US Army Contract RLF6L, funded by the Deputy UnderSecretary of the Army for Operations Research (DUSA-OR).He led a team of Officers and contractors tosuccessfully baseline Janus(T) — a battalion-level war game with statistical details of performancecharacteristics of weapons, movement of men and machines across various terrains — to NationalTraining Center (NTC) data obtained in the field [6,23-25].
The Janus project developed fits of data to probability distributions, separately for the data collected atNTC and for the data collected from Janus(T) war games (after the terrain and tactics used at NTC were
Lester Ingber Research - 13 - ISM
put into Janus).A Statistical Mechanics of Combat (SMC) was developed, essentially a nonlinearstochastic extension of Lanchester theory of combat, to define a common cost function.The fits wereperformed using an early variant of ASA, Very Fast Simulated Re-annealing (VFSR) also created by theauthor [26]. These distributions were evolved in time, to test their sensitivity to the initial fits. A matchbetween the means and variances of the two evolving distributions gav ethe US Army confidence to useJanus(T) in acquisition and tactics training.
4.3.3. Portfolio of Combat Indicators (PCI)Many times (multiple runs of) simulation studies are performed to study the influence of a particulartechnology or set of tactics using varied technologies, within the context of a full scenario of multipletechnologies and tactics/strategies.
The PPI project illustrates how multiple distributions, derived from independent fits of such simulationscan be developed as a Portfolio Combat Indicators (PCI), to calculate risk and uncertainty of functions ofthese technologies and/or tactics.
4.3.3.1. Application to ISMSimilar to the utility of PPI to help ground the concept of ISM by a reasonable analogy to phenomenamore familiar than ISM, the kinds of applications of PCI have obvious counterparts in ISM.Differentkinds of data from populations often lead to different conclusions.A portfolio of distributions from thesedifferent data sets permits a better assessment of relative error/uncertainty of these conclusions.
4.4. Trading in Risk Dimensions (TRD)
4.4.1. StatisticalMechanics of Financial Markets (SMFM)A full real-time risk-managed trading system has been coded by the author using state of the art riskmanagement algorithms, Trading in Risk Dimensions (TRD) [52].
TRD is based largely on previous work in several disciplines, using a formulation similar to that used bythe author to develop a multivariate nonlinear nonequilibrium Statistical Mechanics of Financial Markets(SMFM) [17,27,40,48-50].using powerful numerical algorithms to fit models to data[47]. A publishedreport closest to this project was formulated for a portfolio of options [51].
4.4.2. Application to ISM ProjectSome algebraic and numerical details inherent in developing and using an end-to-end trading system likeTRD serves to emphasize some real-world aspects of dealing with complex systems that must beaddressed using ISM.
In the context of this approach, the concepts of “portfolio” are considered to be extended to the totalensemble of of multiple regions of populations, each having sets of multiple variables. Thatis, althoughthe each region will have the same kinds of multiple variables, to create a generic system for the project,such variables in different regions will be part of the full set of multivariate nonlinear stochastic variablesacross all regions. Oncethe full “portfolio” distribution is developed, various measures of cost orperformance can be calculated, in addition to calculating various measure of risk.
It should be understood that any sampling algorithm processing a huge number of states can find manymultiple optima. As mentioned below, ASA’s MULTI_MIN OPTIONS are used to save multiple optimaduring sampling. Some algorithms might label these states as “mutations” of optimal states. It isimportant to be able to include them in final decisions, e.g., to apply additional metrics of performancespecific to applications. Experience with risk-managing portfolios shows that all criteria are not bestconsidered by lumping them all into one cost function, but rather good judgment should be applied tomultiple stages of pre-processing and post-processing when performing such sampling.
The concepts of trading-rule parameters are considered to be extended to parameters that might beincluded in this work, e.g., to permit some top-level control of weights given to different members ofensembles, or parameters in models that affect their interactions.
Lester Ingber Research - 14 - ISM
It is clear that stochastic financial markets represent a social system of many people willing to risk theirmoney on their beliefs and ideas and on their assumptions of beliefs and ideas of other traders.Theconcepts of trading rules and portfolio risk-management seem useful to introduce into ISM, beyond toolsto determine risk and uncertainty.
4.4.2.1. StandardCode For All PlatformsThe ASA and TRD codes are in vanilla C, able to run across all Unix platforms, includingSolaris/SPARC, Linux and Cygwin under Windows [http://cygwin.com]. StandardUnix scripts are usedto facilitate file and data manipulations.For example, output analysis plots — e.g., 20 sub-plots per page,are prepared in batch using RDB (a Perl relational database tool from ftp://ftp.rand.org/RDB-hobbs/),Gnuplot (from http://gnuplot.sourceforge.net/), and other Unix scripts developed by the author.
The judicious use of pre-processing and post-processing of variables, in addition to processing byoptimization and importance-sampling algorithms, presents important features to this project beyondsimple maximum likelihood estimates based on (quasi-)linear methods of regression usually applied tosuch systems.
TRD includes design and code required to interface to actual data feeds and execution platforms.Similarrequirements might be essential for future use of these approaches as proposed here.
As with most complex projects, care must be given to sundry problems that arise. Similar and new suchproblems can be expected to arise in this project as well.
4.4.2.2. GaussianCopulaGaussian copulas are developed in TRD. Other copula distributions are possible, e.g., Student-tdistributions (often touted as being more sensitive to fat-tailed distributions — here data is first adaptivelyfi t to fat-tailed distributions prior to copula transformations). These alternative distributions can be quiteslow because inverse transformations typically are not as quick as for the present distribution.
Copulas are cited as an important component of risk management not yet widely used by riskmanagement practitioners[4]. Gaussiancopulas are presently regarded as the Basel II standard for creditrisk management [11]. TRD permits fast as well as robust copula risk management in real time.
The copula approach can be extended to more general distributions than those considered here[12]. Ifthere are not analytic or relatively standard math functions for the transformations (and/or inversetransformations described) here, then these transformations must be performed explicitly numerically incode such as TRD. Then, the ASA_PARALLEL OPTIONS already existing in ASA (developed as partof the1994 National Science Foundation Parallelizing ASA and PATHINT Project (PAPP)) would be veryuseful to speed up real time calculations [30].
4.4.3. ExponentialMarginal Distribution ModelsFor specificity, assume that each market is fit well to a two-tailed exponential density distribution p (notto be confused with the indexed price variablept) with scaleχ and meanm,
p(dx)dx =
1
2χe
−dx−m
χ dx , dx >= m
1
2χe
dx−m
χ dx , dx < m
=1
2χe
−|dx−m|
χ dx (3)
which has a cumulative probability distribution
F(dx) =dx
−∞∫ dx′ p(dx′) =
1
2
1 + sgn(dx − m)1 − e
−|dx−m|
χ
(4)
whereχ andm are defined by averages <. > over a window of data,
Lester Ingber Research - 15 - ISM
m = < dx > , 2χ 2 = < (dx)2 > − < dx >2 (5)
The exponential distribution is selected here to illustrate that even this hardest case to processanalytically [70] can be treated within TRD,
The p(dx) are “marginal” distributions observed in the market, modeled to fit the above algebraic form.Note that the exponential distribution has an infinite number of non-zero cumulants, so that< dx2 > − < dx >2 does not have the same “variance” meaning for this “width” as it does for a Gaussiandistribution which has just two independent cumulants (and all cumulants greater than the second vanish).Below algorithms are specified to address correlated markets giving rise to the stochastic behavior ofthese markets.
The TRD code can be easily modified to utilize distributions p′(dx) with different widths, e.g., differentχ ′ for dx less than and greater thanm,
p′(dx)dx =1
2χ ′e
−|dx−m|
χ ′ dx (6)
4.4.4. CopulaTr ansformation
4.4.4.1. Transformation to Gaussian Marginal DistributionsA Normal Gaussian distribution has the form
p(dy) =1
√ 2πe
−dy2
2 (7)
with a cumulative distribution
F(dy) =1
2
1 + erf
dy
√2
(8)
where the erf() function is a tabulated function coded into most math libraries.
By setting the numerical values of the above two cumulative distributions, monotonic on interval [0,1],equal to each other, the transformation of thex marginal variables to they marginal variables is effected,
dy = √2 erf−1((2 F(dx) − 1)) = √2 sgn(dx − m) erf−11 − e
−|dx−m|
χ
(9)
The inverse mapping is used when applying this to the portfolio distribution,
dx = m − sgn(dy)χ ln1 − erf
|dy|
√2
(10)
4.4.4.2. IncludingCorrelations
To understand how correlations enter, look at the stochastic process defined by thedyi marginaltransformed variables:
dyi = gi dwi (11)
wheredwi is the Wiener Gaussian noise contributing todyi of market i. The transformations are chosensuch that ˆgi = 1.
Now, a giv en market’s noise, (gi dwi), has potential contributions from allN markets, which is modeled interms ofN independent Gaussian processes,dzk ,
gi dwi =kΣ gi
k dzk (12)
Lester Ingber Research - 16 - ISM
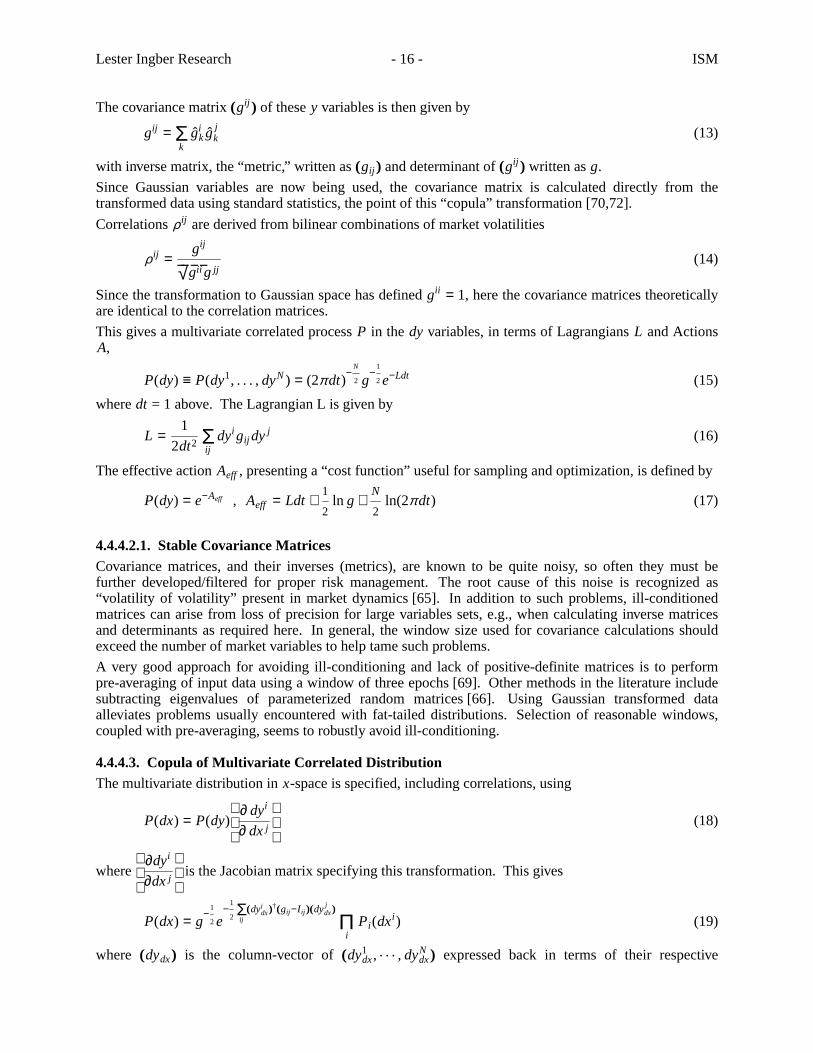
The covariance matrix ((gij)) of thesey variables is then given by
gij =kΣ gi
k g jk (13)
with inverse matrix, the “metric,” written as ((gij)) and determinant of ((gij)) written asg.
Since Gaussian variables are now being used, the covariance matrix is calculated directly from thetransformed data using standard statistics, the point of this “copula” transformation [70,72].
Correlationsρ ij are derived from bilinear combinations of market volatilities
ρ ij =gij
√ gii g jj(14)
Since the transformation to Gaussian space has defined gii = 1, here the covariance matrices theoreticallyare identical to the correlation matrices.
This gives a multivariate correlated processP in thedy variables, in terms of LagrangiansL and ActionsA,
P(dy) ≡ P(dy1, . . . ,dyN ) = (2π dt)−
N
2 g−
1
2 e−Ldt (15)
wheredt = 1 above. The Lagrangian L is given by
L =1
2dt2ijΣ dyi gij dy j (16)
The effective action Aeff , presenting a “cost function” useful for sampling and optimization, is defined by
P(dy) = e−Aeff , Aeff = Ldt +1
2ln g +
N
2ln(2π dt) (17)
4.4.4.2.1. StableCovariance MatricesCovariance matrices, and their inverses (metrics), are known to be quite noisy, so often they must befurther developed/filtered for proper risk management. The root cause of this noise is recognized as“volatility of volatility” present in market dynamics[65]. In addition to such problems, ill-conditionedmatrices can arise from loss of precision for large variables sets, e.g., when calculating inverse matricesand determinants as required here. In general, the window size used for covariance calculations shouldexceed the number of market variables to help tame such problems.
A very good approach for avoiding ill-conditioning and lack of positive-definite matrices is to performpre-averaging of input data using a window of three epochs[69]. Othermethods in the literature includesubtracting eigenvalues of parameterized random matrices[66]. Using Gaussian transformed dataalleviates problems usually encountered with fat-tailed distributions. Selectionof reasonable windows,coupled with pre-averaging, seems to robustly avoid ill-conditioning.
4.4.4.3. Copulaof Multi variate Correlated DistributionThe multivariate distribution inx-space is specified, including correlations, using
P(dx) = P(dy)
∂ dyi
∂ dx j
(18)
where
∂dyi
∂dx j
is the Jacobian matrix specifying this transformation. This gives
P(dx) = g−
1
2 e−
1
2 ijΣ((dyi
dx))†((gij−Iij))((dy jdx))
iΠ Pi(dxi) (19)
where ((dydx)) is the column-vector of ((dy1dx , . . . , dyN
dx)) expressed back in terms of their respective
Lester Ingber Research - 17 - ISM
((dx1, . . . ,dxN )), ((dydx))† is the transpose row-vector, and ((I )) is the identity matrix (all ones on thediagonal).
The Gaussian copulaC(dx) is defined from Eq. (19),
C(dx) = g−
1
2 e−
1
2 ijΣ((dyi
dx))†((gij−Iij))((dy jdx))
(20)
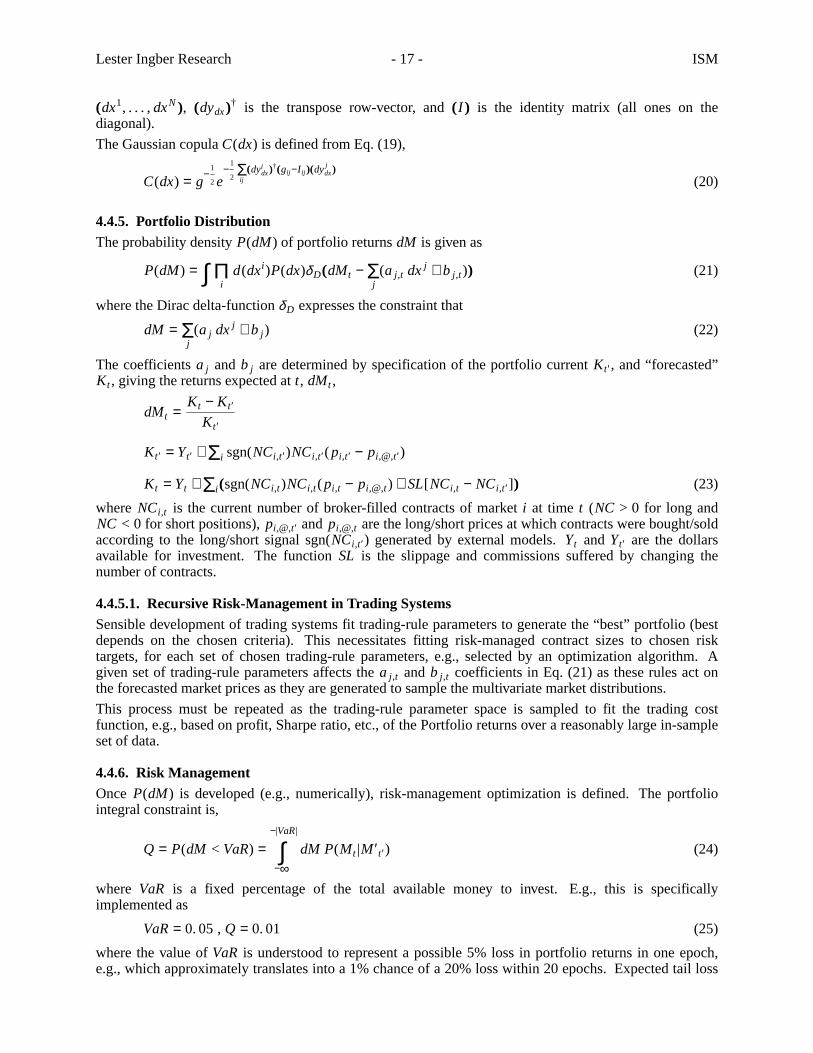
4.4.5. Portfolio DistributionThe probability densityP(dM) of portfolio returnsdM is given as
P(dM) = ∫i
Π d(dxi)P(dx)δ D((dMt −j
Σ(a j,t dx j + b j,t))) (21)
where the Dirac delta-functionδ D expresses the constraint that
dM =j
Σ(a j dx j + b j) (22)
The coefficientsa j andb j are determined by specification of the portfolio currentKt′, and “forecasted”Kt , giving the returns expected att, dMt ,
whereNCi,t is the current number of broker-filled contracts of market i at time t (NC > 0 for long andNC < 0 for short positions),pi,@,t′ and pi,@,t are the long/short prices at which contracts were bought/soldaccording to the long/short signal sgn(NCi,t′) generated by external models.Yt and Yt′ are the dollarsavailable for investment. Thefunction SL is the slippage and commissions suffered by changing thenumber of contracts.
4.4.5.1. Recursive Risk-Management in Trading SystemsSensible development of trading systems fit trading-rule parameters to generate the “best” portfolio (bestdepends on the chosen criteria).This necessitates fitting risk-managed contract sizes to chosen risktargets, for each set of chosen trading-rule parameters, e.g., selected by an optimization algorithm.Agiven set of trading-rule parameters affects thea j,t andb j,t coefficients in Eq. (21) as these rules act onthe forecasted market prices as they are generated to sample the multivariate market distributions.
This process must be repeated as the trading-rule parameter space is sampled to fit the trading costfunction, e.g., based on profit, Sharpe ratio, etc., of the Portfolio returns over a reasonably large in-sampleset of data.
4.4.6. RiskManagementOnce P(dM) is dev eloped (e.g., numerically), risk-management optimization is defined. Theportfoliointegral constraint is,
Q = P(dM < VaR) =−|VaR|
−∞∫ dM P(Mt |M ′t′) (24)
where VaR is a fixed percentage of the total available money to inv est. E.g., this is specificallyimplemented as
VaR = 0. 05, Q = 0. 01 (25)
where the value ofVaR is understood to represent a possible 5% loss in portfolio returns in one epoch,e.g., which approximately translates into a 1% chance of a 20% loss within 20 epochs. Expected tail loss
Lester Ingber Research - 18 - ISM
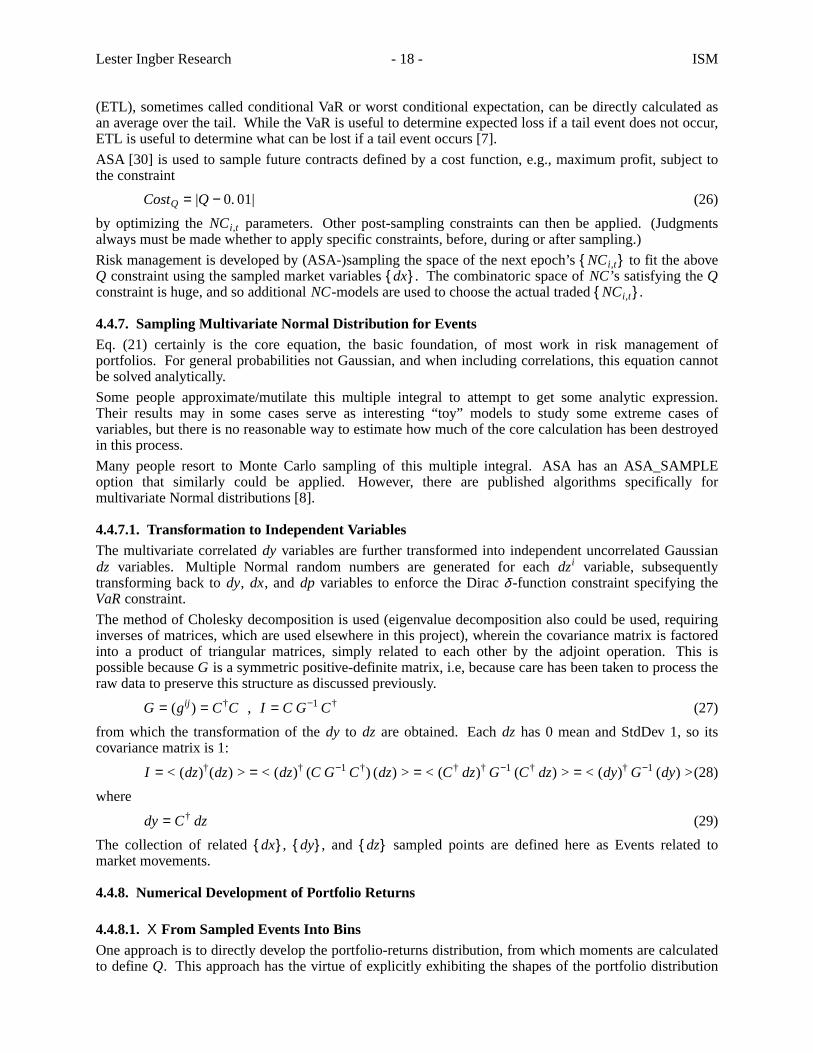
(ETL), sometimes called conditional VaR or worst conditional expectation, can be directly calculated asan average over the tail. While the VaR is useful to determine expected loss if a tail event does not occur,ETL is useful to determine what can be lost if a tail event occurs [7].
ASA [30] is used to sample future contracts defined by a cost function, e.g., maximum profit, subject tothe constraint
CostQ = |Q − 0. 01| (26)
by optimizing theNCi,t parameters. Otherpost-sampling constraints can then be applied.(Judgmentsalways must be made whether to apply specific constraints, before, during or after sampling.)
Risk management is developed by (ASA-)sampling the space of the next epoch’s {NCi,t} to fit the aboveQ constraint using the sampled market variables{dx}. The combinatoric space ofNC ’s satisfying theQconstraint is huge, and so additionalNC-models are used to choose the actual traded{NCi,t}.
4.4.7. SamplingMulti variate Normal Distribution for EventsEq. (21) certainly is the core equation, the basic foundation, of most work in risk management ofportfolios. For general probabilities not Gaussian, and when including correlations, this equation cannotbe solved analytically.
Some people approximate/mutilate this multiple integral to attempt to get some analytic expression.Their results may in some cases serve as interesting “toy” models to study some extreme cases ofvariables, but there is no reasonable way to estimate how much of the core calculation has been destroyedin this process.
Many people resort to Monte Carlo sampling of this multiple integral. ASA has an ASA_SAMPLEoption that similarly could be applied.However, there are published algorithms specifically formultivariate Normal distributions [8].
4.4.7.1. Transformation to Independent VariablesThe multivariate correlateddy variables are further transformed into independent uncorrelated Gaussiandz variables. Multiple Normal random numbers are generated for eachdzi variable, subsequentlytransforming back tody, dx, and dp variables to enforce the Diracδ -function constraint specifying theVaR constraint.
The method of Cholesky decomposition is used (eigenvalue decomposition also could be used, requiringinverses of matrices, which are used elsewhere in this project), wherein the covariance matrix is factoredinto a product of triangular matrices, simply related to each other by the adjoint operation. This ispossible becauseG is a symmetric positive-definite matrix, i.e, because care has been taken to process theraw data to preserve this structure as discussed previously.
G = (gij) = C†C , I = C G−1 C† (27)
from which the transformation of thedy to dz are obtained.Eachdz has 0 mean and StdDev 1, so itscovariance matrix is 1:
The collection of related{dx}, {dy}, and {dz} sampled points are defined here as Events related tomarket movements.
4.4.8. NumericalDevelopment of Portfolio Returns
4.4.8.1. Χ From Sampled Events Into BinsOne approach is to directly develop the portfolio-returns distribution, from which moments are calculatedto define Q. This approach has the virtue of explicitly exhibiting the shapes of the portfolio distribution
Lester Ingber Research - 19 - ISM
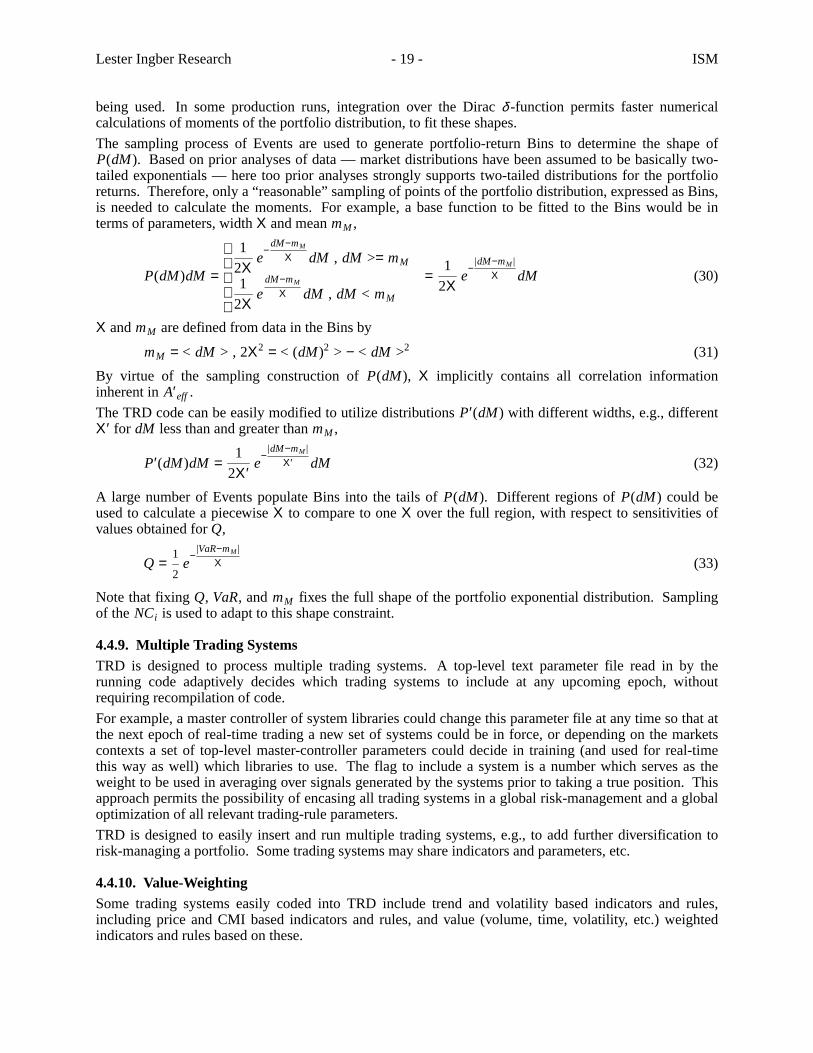
being used. In some production runs, integration over the Diracδ -function permits faster numericalcalculations of moments of the portfolio distribution, to fit these shapes.
The sampling process of Events are used to generate portfolio-return Bins to determine the shape ofP(dM). Basedon prior analyses of data — market distributions have been assumed to be basically two-tailed exponentials — here too prior analyses strongly supports two-tailed distributions for the portfolioreturns. Therefore,only a “reasonable” sampling of points of the portfolio distribution, expressed as Bins,is needed to calculate the moments.For example, a base function to be fitted to the Bins would be interms of parameters, widthΧ and meanmM ,
P(dM)dM =
1
2Χe
−dM−mM
Χ dM , dM >= mM
1
2Χe
dM−mM
Χ dM , dM < mM
=1
2Χe
−|dM−mM |
Χ dM (30)
Χ andmM are defined from data in the Bins by
mM = < dM > , 2Χ2 = < (dM)2 > − < dM >2 (31)
By virtue of the sampling construction ofP(dM), Χ implicitly contains all correlation informationinherent inA′eff .
The TRD code can be easily modified to utilize distributionsP′(dM) with different widths, e.g., differentΧ′ for dM less than and greater thanmM ,
P′(dM)dM =1
2Χ′e
−|dM−mM |
Χ′ dM (32)
A large number of Events populate Bins into the tails ofP(dM). Different regions ofP(dM) could beused to calculate a piecewise Χ to compare to oneΧ over the full region, with respect to sensitivities ofvalues obtained forQ,
Q =1
2e
−|VaR−mM |
Χ (33)
Note that fixing Q, VaR, and mM fixes the full shape of the portfolio exponential distribution. Samplingof theNCi is used to adapt to this shape constraint.
4.4.9. Multiple Tr ading SystemsTRD is designed to process multiple trading systems.A top-level text parameter file read in by therunning code adaptively decides which trading systems to include at any upcoming epoch, withoutrequiring recompilation of code.
For example, a master controller of system libraries could change this parameter file at any time so that atthe next epoch of real-time trading a new set of systems could be in force, or depending on the marketscontexts a set of top-level master-controller parameters could decide in training (and used for real-timethis way as well) which libraries to use. The flag to include a system is a number which serves as theweight to be used in averaging over signals generated by the systems prior to taking a true position.Thisapproach permits the possibility of encasing all trading systems in a global risk-management and a globaloptimization of all relevant trading-rule parameters.
TRD is designed to easily insert and run multiple trading systems, e.g., to add further diversification torisk-managing a portfolio. Some trading systems may share indicators and parameters, etc.
4.4.10. Value-WeightingSome trading systems easily coded into TRD include trend and volatility based indicators and rules,including price and CMI based indicators and rules, and value (volume, time, volatility, etc.) weightedindicators and rules based on these.
Lester Ingber Research - 20 - ISM
4.4.11. Post-Processing of Multiple Optima/“Mutations”Within a chosen resolution of future contracts and trading parameters, the huge numbers of possible statesto be importance-sampled presents multiple optima and sometimes multiple optimal states.While thesecan be filtered during sampling with various criteria, it is more useful not to include all filters duringsampling, but rather to use ASA’s MULTI_MIN OPTIONS to save any desired number of these optimalstates for further post-processing to examine possible benefits versus risk according to various desiredimportant considerations, e.g., weighting by correlations, adding additional metrics of performance, etc.
5. Future Research
5.1. AnticipatedResultsIf this project is successful it will have been established that SMNI and TRD algorithms, supported bycomputational algorithms such as ASA and PATHINT/PATHTREE, is a very viable approach to developIdeas by Statistical Mechanics (ISM) for decision support for DIME factors of propagation/evolution ofideas.
5.2. Significance of Initial EffortsEndogenous and exogenous interactions among local populations, one or some of which have been fit toan Idea(s) will be tuned to determine circumstances under which the Idea(s) can be propagated orstopped. Itis possible that only populations already approximately fit/prepared for the Ideas(s) may bemost receptive, and the degree of such preparedness must be determined.If SMNI is any guide, it is easyto see how long-ranged connectivity can sometimes be an effective substitute for having tuned localinteractions.
6. CommercializationThis product can be used for decision support for projects ranging from diplomatic, information, military,and economic (DIME) factors of propagation/evolution of ideas, to commercial sales, trading indicatorsacross sectors of financial markets, advertising and political campaigns, etc.
7. ConclusionMany disciplines now require or will require processing complex patterns of information derived frommultiple sources.Ideas by Statistical Mechanics (ISM) is a biologically inspired approach to computingsuch multivariate systems.ISM uses algorithms and tools applied and tested in several other disciplines,including multivariate nonequilibrium nonlinear statistical mechanics, neuroscience of neocorticalinteractions, simulated annealing global optimization, path integral evolution of probability distributions,and copula methods of financial risk management.
The power of processing “ideas” is extremely powerful, indeed so powerful that artificial intelligence hasyet to match human processing of ideas in many respects. Thestrength of utilizing neocortical processingof information as the backbone of ISM lies not just in its intuitive appeal, but on details of use of multiplealgorithms and tools.
Prior work in statistical mechanics of neocortical interactions has detailed columnar processing of short-term memory and large-scale processing of information across multiple regions of neocortex. Similarly,ISM develops multiple scales of information processing in quite generic stochastic systems, which aredescribed by their own probability distributions and objective functions. Multiplestates of these systemsrepresent transitory patterns of short-term memory and hard-coded patterns of long-term memories, whichmay arise across patterns of information from multiple sources in multiple representations.
Prior work in statistical mechanics of financial markets and copula methods of risk management hasdetailed processing and trading of multiple stochastic financial instruments.Similarly, ISM processesnon-Gaussian probability distributions of multivariate systems, assessing their correlations in a copula-transformed space.Some algebraic and numerical details inherent in the Trading in Risk Dimensions(TRD) code serves to emphasize some real-world aspects of dealing with complex systems that must beaddressed using ISM.
Lester Ingber Research - 21 - ISM
Multivariate nonequilibrium nonlinear statistical mechanics, although tested and detailed for a couple ofdecades —in disciples ranging from neuroscience to combat analysis to financial markets to othernonlinear stochastic systems — still is a complex discipline in itself. The trade-off in using such complexalgebra is that this approach often provides remarkably simple underlying intuitions not gained elsewherefor such nonlinear stochastic multivariate systems, e.g., concepts of “momenta” faithful to the details ofcalculation and consistent with intuitions and calculations of “force”, “inertia”, etc.
These approaches have required the development of strong computational tools, e.g., Adaptive SimulatedAnnealing (ASA) for global optimization of nonlinear multivariate parameters and importance samplingof nonlinear multivariate variables, PATHINT and PATHTREE codes for time development of probabilitydistributions with moments nonlinear in their multivariate variables, and copula codes for transformingmultivariate non-Gaussian probability distributions into Gaussian spaces where calculations ofcorrelations makes sense.
ISM represents a synthesis of these tools and algorithms. Of course, ISM must now be tested on newsystems of data.
REFERENCES
[1] G. Aletti, G. Naldi, and G. Toscani, ‘‘First-order continuous models of opinion formation,’’ Report,U Milano, Milano, Italy, 2006. [URLhttp://lanl.arxiv.org/abs/cond-mat/0605092]
[2] J. Allen, ‘‘Commander’s automated decision support tools,’’ Report, DARPA, Washington DC,2004. [URLhttp://www.darpa.mil/ato/solicit/IBC/allen.ppt]
[3] A.F. Atiya, A.G. Parlos, and L. Ingber, ‘‘A r einforcement learning method based on adaptivesimulated annealing,’’ i n Proceedings International Midwest Symposium on Circuits and Systems(MWCAS), December 2003, (IEEE CAS, Cairo, Egypt, 2003). [URLhttp://www.ingber.com/asa03_reinforce.pdf]
[4] C. Blanco, Financial Risk Management: Beyond Normality, Volatility and Correlations (FEN,Waltham, MA, 2005). [URL http://www.fenews.com/fen46/front-sr/blanco/blanco.html]
[5] C. Borghesi and S. Galam, ‘‘Chaotic, staggered and polarized dynamics in opinion forming: thecontrarian effect,’’ Report, Service de Physique de l’Etat Condens, Saclay, France, 2006.[URLhttp://lanl.arxiv.org/abs/physics/0605150]
[6] M. Bowman and L. Ingber, ‘‘Canonical momenta of nonlinear combat,’’ i n Proceedings of the 1997Simulation Multi-Conference, 6-10 April 1997, Atlanta, GA, (Society for Computer Simulation, SanDiego, CA, 1997). [URL http://www.ingber.com/combat97_cmi.pdf]
[7] K. Dowd, Estimating expected tail loss (FEN, Waltham, MA, 2002). [URLhttp://www.fenews.com/fen25/dowd.html]
[8] A. Genz, ‘‘Comparison of methods for the computation of multivariate normal probabilities,’’Computing Sciences and Statistics 25, 400-405 (1993).
[9] M. Gladwell,The Tipping Point (Little, Brown & Co., New York, NY, 2002).
[10] R.Graham, ‘‘Covariant formulation of non-equilibrium statistical thermodynamics,’’ Z. Physik B26,397-405 (1977).
[11] R. Horsewood, Credit Correlation: Maths of All Angles (FEN, Waltham, MA, 2005). [URLhttp://www.fenews.com/fen39/euro_angles/euro_angles.html]
[12] R. Ibragimon, ‘‘Copula-based dependence characterizations and modeling for time series,’’ ReportNo. 2094, Harvard Inst Econ Res, Cambridge, MA, 2005.[URLhttp://post.economics.harvard.edu/hier/2005papers/HIER2094.pdf]
[13] L. Ingber, ‘‘Tow ards a unified brain theory,’’ J. Social Biol. Struct. 4, 211-224 (1981). [URLhttp://www.ingber.com/smni81_unified.pdf]
[14] L. Ingber, ‘‘Statistical mechanics of neocortical interactions. I. Basic formulation,’’ Physica D 5,83-107 (1982). [URL http://www.ingber.com/smni82_basic.pdf]
Lester Ingber Research - 22 - ISM
[15] L. Ingber, ‘‘Statistical mechanics of neocortical interactions. Dynamics of synaptic modification,’’Phys. Rev. A 28, 395-416 (1983). [URL http://www.ingber.com/smni83_dynamics.pdf]
[16] L. Ingber, ‘‘Statistical mechanics of neocortical interactions. Derivation of short-term-memorycapacity,’’ Phys. Rev. A 29, 3346-3358 (1984). [URL http://www.ingber.com/smni84_stm.pdf]
[17] L. Ingber, ‘‘Statistical mechanics of nonlinear nonequilibrium financial markets,’’ Math. Modelling5, 343-361 (1984). [URL http://www.ingber.com/markets84_statmech.pdf]
[18] L. Ingber, ‘‘Statistical mechanics algorithm for response to targets (SMART),’’ i n Workshop onUncertainty and Probability in Artificial Intelligence: UC Los Angeles, 14-16 August 1985,(American Association for Artificial Intelligence, Menlo Park, CA, 1985), p. 258-264.[URLhttp://www.ingber.com/combat85_smart.pdf]
[19] L. Ingber, ‘‘Statistical mechanics of neocortical interactions. EEG dispersion relations,’’ IEEETr ans. Biomed. Eng. 32, 91-94 (1985). [URL http://www.ingber.com/smni85_eeg.pdf]
[20] L. Ingber, ‘‘Statistical mechanics of neocortical interactions: Stability and duration of the 7+-2 ruleof short-term-memory capacity,’’ Phys. Rev. A 31, 1183-1186 (1985). [URLhttp://www.ingber.com/smni85_stm.pdf]
[21] L. Ingber, ‘‘Riemannian contributions to short-ranged velocity-dependent nucleon-nucleoninteractions,’’ Phys. Rev. D 33, 3781-3784 (1986). [URLhttp://www.ingber.com/nuclear86_riemann.pdf]
[22] L. Ingber, ‘‘Statistical mechanics of neocortical interactions,’’ Bull. Am. Phys. Soc. 31, 868 (1986).
[23] L. Ingber, ‘‘Mathematical comparison of computer models to exercise data: Comparison ofJANUS(T) to National Training Center data,’’ i n 1988 JDL C2 Symposium: Naval PostgraduateSchool, Monterey, CA, 7-9 June 1988, (SAIC, McLean, VA, 1988), p. 541-549.
[24] L. Ingber, ‘‘Mathematical comparison of computer models to exercise data,’’ i n 1989 JDL C2Symposium: National Defense University, Washington, DC, 27-29 June 1989, (SAIC, McLean, VA,1989), p. 169-192.
[25] L. Ingber, ‘‘Mathematical comparison of JANUS(T) simulation to National Training Center,’’ i nThe Science of Command and Control: Part II, Coping With Complexity, ed. by S.E. Johnson andA.H. Levis (AFCEA International, Washington, DC, 1989), p. 165-176.
[26] L. Ingber, ‘‘Very fast simulated re-annealing,’’ Mathl. Comput. Modelling 12, 967-973 (1989).[URL http://www.ingber.com/asa89_vfsr.pdf]
[27] L. Ingber, ‘‘Statistical mechanical aids to calculating term structure models,’’ Phys. Rev. A 42,7057-7064 (1990). [URL http://www.ingber.com/markets90_interest.pdf]
[28] L. Ingber, ‘‘Statistical mechanics of neocortical interactions: A scaling paradigm applied toelectroencephalography,’’ Phys. Rev. A 44, 4017-4060 (1991). [URLhttp://www.ingber.com/smni91_eeg.pdf]
[29] L. Ingber, ‘‘Generic mesoscopic neural networks based on statistical mechanics of neocorticalinteractions,’’ Phys. Rev. A 45, R2183-R2186 (1992). [URLhttp://www.ingber.com/smni92_mnn.pdf]
[30] L. Ingber, ‘‘A daptive Simulated Annealing (ASA),’’ G lobal optimization C-code, Caltech AlumniAssociation, Pasadena, CA, 1993. [URL http://www.ingber.com/#ASA-CODE]
[31] L. Ingber, ‘‘Simulated annealing: Practice versus theory,’’ Mathl. Comput. Modelling 18, 29-57(1993). [URLhttp://www.ingber.com/asa93_sapvt.pdf]
[32] L. Ingber, ‘‘Statistical mechanics of combat and extensions,’’ i n Toward a Science of Command,Control, and Communications, ed. by C. Jones (American Institute of Aeronautics andAstronautics, Washington, D.C., 1993), p. 117-149.[ISBN 1-56347-068-3. URLhttp://www.ingber.com/combat93_c3sci.pdf]
[33] L. Ingber, ‘‘Statistical mechanics of neocortical interactions: Path-integral evolution of short-termmemory,’’ Phys. Rev. E 49, 4652-4664 (1994). [URL http://www.ingber.com/smni94_stm.pdf]
Lester Ingber Research - 23 - ISM
[34] L. Ingber, ‘‘Path-integral evolution of multivariate systems with moderate noise,’’ Phys. Rev. E 51,1616-1619 (1995). [URL http://www.ingber.com/path95_nonl.pdf]
[35] L. Ingber, ‘‘Statistical mechanics of multiple scales of neocortical interactions,’’ i n NeocorticalDynamics and Human EEG Rhythms, ed. by P.L. Nunez (Oxford University Press, New York, NY,1995), p. 628-681. [ISBN 0-19-505728-7. URL http://www.ingber.com/smni95_scales.pdf]
[36] L. Ingber, ‘‘Statistical mechanics of neocortical interactions: Constraints on 40 Hz models of short-term memory,’’ Phys. Rev. E 52, 4561-4563 (1995). [URLhttp://www.ingber.com/smni95_stm40hz.pdf]
[37] L. Ingber, ‘‘A daptive simulated annealing (ASA): Lessons learned,’’ Control and Cybernetics 25,33-54 (1996). [Invited paper to Control and Cybernetics on "Simulated Annealing Applied toCombinatorial Optimization." URL http://www.ingber.com/asa96_lessons.pdf]
[38] L. Ingber, ‘‘Nonlinear nonequilibrium nonquantum nonchaotic statistical mechanics of neocorticalinteractions,’’ Behavioral and Brain Sci. 19, 300-301 (1996).[Invited commentary on Dynamicsof the brain at global and microscopic scales: Neural networks and the EEG, by J.J. Wright andD.T.J. Liley. URL http://www.ingber.com/smni96_nonlinear.pdf]
[39] L. Ingber, ‘‘Statistical mechanics of neocortical interactions: Multiple scales of EEG,’’ i n Fr ontierScience in EEG: Continuous Waveform Analysis (Electroencephal. clin. Neurophysiol. Suppl. 45),ed. by R.M. Dasheiff and D.J. Vincent (Elsevier, Amsterdam, 1996), p. 79-112.[Invited talk toFrontier Science in EEG Symposium, New Orleans, 9 Oct 1993. ISBN 0-444-82429-4.URLhttp://www.ingber.com/smni96_eeg.pdf]
[40] L. Ingber, ‘‘Statistical mechanics of nonlinear nonequilibrium financial markets: Applications tooptimized trading,’’ Mathl. Computer Modelling 23, 101-121 (1996). [URLhttp://www.ingber.com/markets96_trading.pdf]
[41] L. Ingber, ‘‘Statistical mechanics of neocortical interactions: Applications of canonical momentaindicators to electroencephalography,’’ Phys. Rev. E 55, 4578-4593 (1997). [URLhttp://www.ingber.com/smni97_cmi.pdf]
[42] L. Ingber, ‘‘Data mining and knowledge discovery via statistical mechanics in nonlinear stochasticsystems,’’ Mathl. Computer Modelling 27, 9-31 (1998). [URLhttp://www.ingber.com/path98_datamining.pdf]
[43] L. Ingber, ‘‘Statistical mechanics of neocortical interactions: Training and testing canonicalmomenta indicators of EEG,’’ Mathl. Computer Modelling 27, 33-64 (1998). [URLhttp://www.ingber.com/smni98_cmi_test.pdf]
[44] L. Ingber, ‘‘Statistical mechanics of neocortical interactions: Reaction time correlates of the gfactor,’’ Psycholoquy 10, (1999). [Invited commentary on The g Factor: The Science of MentalAbility by Arthur Jensen. URL http://www.ingber.com/smni99_g_factor.pdf]
[45] L. Ingber, ‘‘High-resolution path-integral development of financial options,’’ Physica A 283,529-558 (2000). [URL http://www.ingber.com/markets00_highres.pdf]
[46] L. Ingber, ‘‘Statistical mechanics of neocortical interactions: EEG eigenfunctions of short-termmemory,’’ Behavioral and Brain Sci. 23, 403-405 (2000). [Invited commentary on Tow ard aQuantitative Description of Large-Scale Neocortical Dynamic Function and EEG, by P.L. Nunez.URL http://www.ingber.com/smni00_eeg_stm.pdf]
[47] L. Ingber, ‘‘A daptive Simulated Annealing (ASA) and Path-Integral (PATHINT) Algorithms:Generic Tools for Complex Systems,’’ A SA-PATHINT Lecture Plates, Lester Ingber Research,Chicago, IL, 2001. [Invited talk U Calgary, Canada, April 2001. URLhttp://www.ingber.com/asa01_lecture.pdf and asa01_lecture.html]
[48] L. Ingber, ‘‘Statistical Mechanics of Combat (SMC): Mathematical Comparison of ComputerModels to Exercise Data,’’ SMC Lecture Plates, Lester Ingber Research, Chicago, IL, 2001.[URLhttp://www.ingber.com/combat01_lecture.pdf and combat01_lecture.html]
[49] L. Ingber, ‘‘Statistical Mechanics of Financial Markets (SMFM): Applications to Trading Indicatorsand Options,’’ SMFM Lecture Plates, Lester Ingber Research, Chicago, IL, 2001.[Invited talk U
Lester Ingber Research - 24 - ISM
Calgary, Canada, April 2001.Invited talk U Florida, Gainesville, April 2002.Invited talk TulaneU, New Orleans, January 2003.URL http://www.ingber.com/markets01_lecture.pdf andmarkets01_lecture.html]
[50] L. Ingber, ‘‘Statistical Mechanics of Neocortical Interactions (SMNI): Multiple Scales of Short-Term Memory and EEG Phenomena,’’ SMNI Lecture Plates, Lester Ingber Research, Chicago, IL,2001. [Invited talk U Calgary, Canada, April 2001. URLhttp://www.ingber.com/smni01_lecture.pdf and smni01_lecture.html]
[51] L. Ingber, ‘‘Statistical mechanics of portfolios of options,’’ Report 2002:SMPO, Lester IngberResearch, Chicago, IL, 2002. [URL http://www.ingber.com/markets02_portfolio.pdf]
[52] L. Ingber, ‘‘Trading in Risk Dimensions (TRD),’’ Report 2005:TRD, Lester Ingber Research,Ashland, OR, 2005. [URL http://www.ingber.com/markets05_trd.pdf]
[53] L. Ingber, ‘‘Statistical mechanics of neocortical interactions: Portfolio of physiological indicators,’’Report 2006:PPI, Lester Ingber Research, Ashland, OR, 2006.[URLhttp://www.ingber.com/smni06_ppi.pdf]
[54] L. Ingber, ‘‘Ideas by Statistical Mechanics (ISM),’’ J Integrated Systems Design and ProcessScience 11, 31-54 (2007). [Special Issue: Biologically Inspired Computing.]
[55] L. Ingber, ‘‘Real Options for Project Schedules (ROPS),’’ Report 2007:ROPS, Lester IngberResearch, Ashland, OR, 2007. [URL http://www.ingber.com/markets07_rops.pdf]
[56] L. Ingber, ‘‘A I and Ideas by Statistical Mechanics (ISM),’’ i n Encyclopedia of ArtificialIntelligence, ed. by J.R. Rabuñal, J. Dorado, and A.P. Pazos (Information Science Reference, NewYork, 2008), p. 58-64. [ISBN 978-1-59904-849-9]
[57] L. Ingber, C. Chen, R.P. Mondescu, D. Muzzall, and M. Renedo, ‘‘Probability tree algorithm forgeneral diffusion processes,’’ Phys. Rev. E 64, 056702-056707 (2001). [URLhttp://www.ingber.com/path01_pathtree.pdf]
[58] L. Ingber, H. Fujio, and M.F. Wehner, ‘‘Mathematical comparison of combat computer models toexercise data,’’ Mathl. Comput. Modelling 15, 65-90 (1991). [URLhttp://www.ingber.com/combat91_data.pdf]
[59] L. Ingber and R.P. Mondescu, ‘‘A utomated internet trading based on optimized physics models ofmarkets,’’ i n Intelligent Internet-Based Information Processing Systems, ed. by R.J. Howlett, N.S.Ichalkaranje, L.C. Jain, and G. Tonfoni (World Scientific, Singapore, 2003), p. 305-356.[Invitedpaper. URL http://www.ingber.com/markets03_automated.pdf]
[60] L. Ingber and P.L. Nunez, ‘‘Multiple scales of statistical physics of neocortex: Application toelectroencephalography,’’ Mathl. Comput. Modelling 13, 83-95 (1990).
[61] L. Ingber and P.L. Nunez, ‘‘Statistical mechanics of neocortical interactions: High resolution path-integral calculation of short-term memory,’’ Phys. Rev. E 51, 5074-5083 (1995). [URLhttp://www.ingber.com/smni95_stm.pdf]
[62] L. Ingber and B. Rosen, ‘‘Genetic algorithms and very fast simulated reannealing: A comparison,’’Mathl. Comput. Modelling 16, 87-100 (1992). [URL http://www.ingber.com/asa92_saga.pdf]
[63] L. Ingber, R. Srinivasan, and P.L. Nunez, ‘‘Path-integral evolution of chaos embedded in noise:Duffing neocortical analog,’’ Mathl. Computer Modelling 23, 43-53 (1996). [URLhttp://www.ingber.com/path96_duffing.pdf]
[64] L. Ingber and D.D. Sworder, ‘‘Statistical mechanics of combat with human factors,’’ Mathl.Comput. Modelling 15, 99-127 (1991). [URL http://www.ingber.com/combat91_human.pdf]
[65] L. Ingber and J.K. Wilson, ‘‘Volatility of volatility of financial markets,’’ Mathl. ComputerModelling 29, 39-57 (1999). [URL http://www.ingber.com/markets99_vol.pdf]
[66] L. Laloux, P. Cizeau, J.-P. Bouchaud, and M. Potters, ‘‘Noise dressing of financial correlationmatrices,’’ Phys. Rev. Lett. 83, 1467-1470 (1999).
[67] F. Langouche, D. Roekaerts, and E. Tirapegui, Functional Integration and SemiclassicalExpansions (Reidel, Dordrecht, The Netherlands, 1982).
Lester Ingber Research - 25 - ISM
[68] D.A. Leopold and N.K. Logothetis, ‘‘A ctivity-changes in early visual cortex reflect monkeys’percepts during binocular rivalry,’’ Nature 379, 549-553 (1996).
[69] R. Litterman and K. Winkelmann, ‘‘Estimating covariance matrices,’’ Report, Goldman Sachs, NewYork, 1998.
[70] Y. Malevergne and D. Sornette, ‘‘General framework for a portfolio theory with non-Gaussian risksand non-linear correlations,’’ Report, UCLA, Los Angeles, CA, 2002. [URLhttp://www.arxiv.org/PS_cache/cond-mat/pdf/0103/0103020.pdf]
[71] V.B. Mountcastle, R.A. Andersen, and B.C. Motter, ‘‘The influence of attentive fixation upon theexcitability of the light-sensitive neurons of the posterior parietal cortex,’’ J. Neurosci. 1,1218-1235 (1981).
[72] J.V. Rosenberg and T. Schuermann, ‘‘A general approach to integrated risk management withskewed, fat-tailed risks,’’ Staff Report No. 185, Fed. Res. Bank NY, New York, NY, 2004.
[73] P. Sen, ‘‘Complexities of social networks: A physicist’s perspective,’’ Report, U Calcutta, Kolkata,India, 2006. [URL http://lanl.arxiv.org/abs/physics/0605072]
[74] H. Situngkir, ‘‘On selfish memes: Culture as complex adaptive system,’’ J Social Complexity 2,20-32 (2004). [URL http://cogprints.org/3471/]
[75] P.S. Thurtle, ‘‘"The G Files": Linking "The Selfish Gene" And "The Thinking Reed",’’ StanfordPresidential Lectures and Symposia in the Humanities and Arts, Standford U, Palo Alto, CA, 2006.[URL http://prelectur.stanford.edu/lecturers/gould/commentary/thurtle.html]