Page 1
EUROPEAN LARGE LAKES III
Identification of factors constraining nitrate assimilationin Lake Superior, Laurentian Great Lakes
John A. Berges • Yuelu Jiang •
Robert W. Sterner • George S. Bullerjahn •
Natalia A. Ivanikova • Robert M. L. McKay
Received: 7 December 2012 / Accepted: 25 July 2013
� Springer Science+Business Media Dordrecht 2013
Abstract Despite a well-documented rise in nitrate
concentration over the past century, Lake Superior has
retained an oligotrophic character. In part, this status
results from physical attributes of the lake including
low temperatures and prolonged isothermy, resulting
in deep-mixing and light limitation which constrain
primary production. Lake Superior is also phosphorus
deficient which limits phytoplankton growth. We
conducted large (20 l) volume factorial bioassay
experiments to assess the influence of light and
nutrients (P, Fe) on nitrate assimilation by a Lake
Superior chlorophyte alga. Bioassays seeded with the
chlorophyte yielded a strong response to light result-
ing in the rapid depletion of nitrate. High light resulted
in higher activities of the key N-assimilation enzyme
nitrate reductase (NR) and increased algal biomass
compared to low light treatments. NR activity was
highly correlated with rates of nitrate incorporation in
bioassays and field surveys suggesting that NR
occupies a critical place in nitrate metabolism. In
bioassays, the addition of nutrients (P, Fe) only
slightly increased the rate at which nitrate became
depleted. Parallel trials using a luminescent cyano-
bacterial bioreporter confirmed the lack of response by
added nutrients supporting light as an important factor
in constraining nitrate assimilation by phytoplankton
in the lake.
Keywords Lake Superior � Light � Nitrate �Nitrate reductase � Phytoplankton
Introduction
Eutrophication is widely recognized as a first-order
threat to the ecological integrity of our freshwater and
coastal marine resources (Schindler, 2006). The
largest freshwater resource in the world, the Lauren-
tian Great Lakes system, has followed the pattern of
eutrophication occurring globally (Beeton, 1965). In
particular, the lower Great Lakes (Erie, Ontario, and
southern Lake Michigan) whose watersheds support
large human populations as well as intensive agriculture
Guest editors: D. Straile, D. Gerdeaux, D. M. Livingstone,
P. Noges, F. Peeters & K.-O. Rothhaupt / European Large
Lakes III. Large lakes under changing environmental conditions
Electronic supplementary material The online version ofthis article (doi:10.1007/s10750-013-1637-z) contains supple-mentary material, which is available to authorized users.
J. A. Berges � Y. Jiang
Department of Biological Sciences & School
of Freshwater Sciences, University
of Wisconsin-Milwaukee, Milwaukee, WI 53211, USA
R. W. Sterner
Department of Ecology, Evolution and Behavior,
University of Minnesota, St. Paul, MN 55108, USA
G. S. Bullerjahn � N. A. Ivanikova � R. M. L. McKay (&)
Department of Biological Sciences, Bowling Green State
University, Bowling Green, OH 43545, USA
e-mail: [email protected]
123
Hydrobiologia
DOI 10.1007/s10750-013-1637-z
Page 2
and industry, have been profoundly impacted. In stark
contrast, Lake Superior, which serves as the headwaters
for the system, has remained, by and large, pristine. This
is supported by historical data showing mainly flat
profiles of total dissolved solids as well as concentra-
tions of major ions which serve as indicators of
anthropogenic impacts on the system (Beeton, 1965;
Chapra et al., 2012).
Seemingly defying the static trends in major ions is
the observation that Lake Superior has exhibited a
continuous, century-long increase in nitrate levels
(Sterner et al., 2007). This trend was initially reported
in the years following implementation in 1968 of the
Great Lakes Surveillance Program by Environment
Canada but included historic data going back to early
in the twentieth century (Weiler, 1978; Bennett, 1986).
The trend of increasing nitrate has been confirmed
through annual binational monitoring conducted by
Environment Canada and the US EPA as well as
sampling done by university investigators (Sterner
et al., 2007). In fact, these monitoring efforts show that
nitrate concentrations have increased across the entire
Laurentian Great Lakes system (Neilson et al., 2003;
Dove, 2009).
Globally, atmospheric deposition of reactive nitro-
gen is identified as a primary source of nitrate
accumulating on land and in lakes and rivers (Gallo-
way et al., 2003), yet patterns in regional nitrate ion
wet deposition do not always support these trends. For
instance, in Lake Erie’s western basin where spring
surveys showed nitrate levels had increased by 40%
from 1983 to 1993, the increase was attributed in large
part to changes caused by invasive Dreissena species
(Makarewicz et al., 2000). Likewise, a 30% rise in
nitrate observed in Lake Superior since the mid-1970s
(Sterner et al., 2007; Kelly et al., 2011) cannot be
explained by atmospheric deposition. Rather, nitrate is
produced within the lake, derived primarily from
microbial transformations dominated by nitrification
(Finlay et al., 2007; Small et al., 2013a) catalyzed
largely by ammonia-oxidizing archaea (Small et al.,
2013a).
While nitrate levels in Lake Superior continue to
increase, albeit at a lower rate (Sterner, 2011), a recent
modeling effort suggests the system may be nearing its
capacity to accumulate nitrate (McDonald et al., 2010).
Several factors interact promoting the accumulation of
nitrate in Lake Superior, although foremost are its
oligotrophic state and strong oxic environment. Driving
the oligotrophic character of the lake is its low
phosphorus content with soluble reactive phosphorus
(SRP) measured at low nanomolar levels (Anagnostou
& Sherrell, 2008). The extreme depleted phosphorus
character constrains primary production in the lake
resulting in low export of organic carbon to the
sediment (Sterner et al., 2004; Sterner, 2010). This, in
turn, helps maintain the lakes oxic environment by
limiting rates of bacterial remineralization that would
otherwise consume oxygen. These processes also
highlight the lack of strong biogeochemical ‘‘sinks’’
for nitrate in Lake Superior. Low levels of primary
production will constrain biological assimilation of
nitrate whereas the oxidizing environment, which
extends deep into surface sediments (Carlton et al.,
1989; Li et al., 2012; Small et al., 2013b), is not
conducive to conventional dissimilatory sinks such as
denitrification.
In contrast, the effect of stronger biogeochemical
sinks can be observed downstream in Lake Erie, the
eutrophic end member of the Great Lakes system.
Present day nitrate levels in Lake Erie are variable
with peak summer concentrations *30–40% lower
compared with the upper lakes, despite known heavy
fertilizer use in Erie’s watershed (Richards & Baker,
1993). Higher rates of assimilation in Lake Erie are
consistent with higher planktonic biomass measured in
this lake relative to other lakes in the system (Barbiero
& Tuchman, 2001; Conroy et al., 2005). Likewise,
dissimilatory sinks are also relatively strong given the
annual recurrence of Lake Erie’s expansive hypoxic
‘dead zone’ (Hawley et al., 2006). Indeed, increasing
sedimentary d15N values from *1910 to *1970
measured from sediment cores are consistent with the
occurrence of respiratory denitrification in the lake’s
central basin (Lu et al., 2010) and moderate rates of
potential denitrification (*150 lmol N m-2 h-1)
have been reported for nearshore Lake Erie sediments
(McCarthy et al., 2007). Core flux studies indicate that
Lake Superior sediments are a net source of nitrate,
whereas Lake Erie sediments are a net sink (Small
et al., 2013b).
In this study, we aimed to identify factors con-
straining the biological assimilation of nitrate by
phytoplankton in Lake Superior. Previous work by our
group has demonstrated that phytoplankton growth in
Lake Superior is co-limited by low available phos-
phorus and iron (Sterner et al., 2004). Subsequent
studies using a luminescent cyanobacterial bioreporter
Hydrobiologia
123
Page 3
showed that nitrate utilization was stimulated in
response to amendment of lake water by phosphorus
and to a lesser extent by iron (Ivanikova et al., 2007a).
Further, these studies highlighted the importance of
light in nitrate assimilation demonstrating that the
light climate during the period of spring mixing was
insufficient to promote high rates of nitrate drawdown
(Ivanikova et al., 2007a). Finally, shipboard- and
in situ incubations demonstrated a strong temperature
dependence of 15N-nitrogen (nitrate, ammonium)
uptake with maximum rates restricted to the warmer
stratified surface mixed layer (Kumar et al., 2008).
The factors affecting nitrate assimilation can be
species-specific. Patterns of nitrate incorporation vary
with taxa (e.g., Needoba & Harrison, 2004), and at the
extreme, some species are entirely incapable of using
nitrate (e.g., Deyoe & Suttle, 1994; Moore et al.,
2002). Thus, we used two approaches: making com-
munity-level measurements of a key enzyme in nitrate
assimilation (nitrate reductase, NR: E.C. 1.7.7.1) in
the field, as well as experimental measurements with a
chlorophyte alga endemic to Lake Superior. This
approach offers some parallels to the well-known
Algal Assay Procedure (U.S. EPA, 1971) involving
identification of a limiting nutrient based on the
growth response of a standard test alga species to
nutrient amendments of filtered water. In previous
work on phytoplankton, NR has been shown to
respond to changes in irradiance or iron limitation in
step with changes in nitrate incorporation (e.g., Berges
& Harrison, 1995a; Boyd et al., 1998); responses of
NR to P-limitation are less well established, though
nitrate incorporation is responsive to P in both
phytoplankton and higher plants (e.g., Rhee, 1978;
Rufty et al., 1990). Use of a luminescent cyanobac-
terial bioreporter strain responsive to nitrate assimila-
tion (Ivanikova et al., 2005) offered an independent,
but complementary approach. Based on previous work
and on our understanding of phytoplankton commu-
nity responses, we hypothesized that irradiance would
have the strongest effects on nitrate assimilation.
Materials and methods
Sample collection
Samples were collected from multiple sites during
three research surveys on Lake Superior in 2004 and
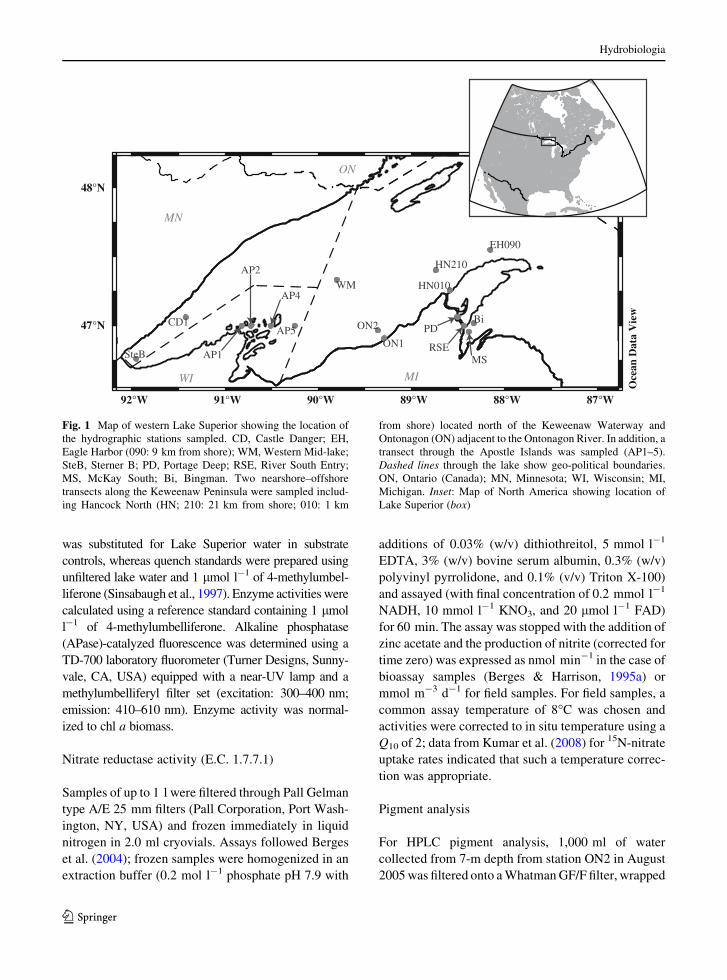
2005 aboard R/V Blue Heron (Fig. 1). The surveys
were conducted during periods of weak inverse
thermal stratification (18–22 May 2004) as well as
strong summer thermal stratification (14–16 Septem-
ber 2004, 27–31 August 2005). At each hydrographic
station, sampling was preceded by a conductivity–
temperature–depth cast. In May 2004, during which
the water column was mainly isothermal, water was
sampled only from 5 m. During the late summer
surveys, epi-, meta- and hypolimnetic samples were
collected. At all locations, water was collected into
acid-cleaned polycarbonate bottles from discrete
depths using a metal-clean in situ pumping system
following passage through a 0.45-lm capsule filter
(GE Osmonics, GE Water and Process Technologies,
Feasterville-Trevose, PA, USA) as described else-
where (Hassler et al., 2009).
Subsamples for nutrient determination were frozen
in polyethylene bottles on board ship for subsequent
laboratory analysis. Nitrate was measured using an
Alpkem autoanalyzer (OI Analytical, College Station,
TX, USA) whereas measurement of total dissolved
phosphate followed the ascorbic acid–molybdate
method (Parsons et al., 1984). Samples for determi-
nation of particulate organic nitrogen (PON) and
particulate phosphorus (PP) were collected by filtra-
tion (1–1.5 l) onto pre-combusted Whatman GF/F
filters (GE Healthcare Life Sciences, Piscataway, NJ,
USA). Filters for PP analysis were rinsed with 5 ml of
1% HCl and followed by deionized water prior to
sample collection. Samples were transported frozen to
the lab and then dried at 60�C for up to 48 h and
prepared for analysis. PON samples were analyzed on
a 2400 CHN analyzer (PerkinElmer, Waltham, MA,
USA) calibrated with an acetanilide standard. PP
samples were digested with potassium persulfate and
total P analyzed spectrophotometrically using the
ascorbic acid–molybdate method (Menzel & Corwin,
1965). Total chl a was measured on samples extracted
overnight in 95% (v/v) acetone by fluorometry after
Welschmeyer (1994).
Alkaline phosphatase activity (E.C. 3.1.3.1.)
Unfiltered water was dispersed to triplicate methacrylate
cuvettes (2.5 ml) and incubated with 40 lmol l-1
4-methylumbelliferyl phosphate (Sigma Inc., St. Louis,
MO, USA) in darkness at ambient ship-laboratory
temperature (*20�C). Sodium bicarbonate (4 mmol l-1)
Hydrobiologia
123
Page 4
was substituted for Lake Superior water in substrate
controls, whereas quench standards were prepared using
unfiltered lake water and 1 lmol l-1 of 4-methylumbel-
liferone (Sinsabaugh et al., 1997). Enzyme activities were
calculated using a reference standard containing 1 lmol
l-1 of 4-methylumbelliferone. Alkaline phosphatase
(APase)-catalyzed fluorescence was determined using a
TD-700 laboratory fluorometer (Turner Designs, Sunny-
vale, CA, USA) equipped with a near-UV lamp and a
methylumbelliferyl filter set (excitation: 300–400 nm;
emission: 410–610 nm). Enzyme activity was normal-
ized to chl a biomass.
Nitrate reductase activity (E.C. 1.7.7.1)
Samples of up to 1 l were filtered through Pall Gelman
type A/E 25 mm filters (Pall Corporation, Port Wash-
ington, NY, USA) and frozen immediately in liquid
nitrogen in 2.0 ml cryovials. Assays followed Berges
et al. (2004); frozen samples were homogenized in an
extraction buffer (0.2 mol l-1 phosphate pH 7.9 with
additions of 0.03% (w/v) dithiothreitol, 5 mmol l-1
EDTA, 3% (w/v) bovine serum albumin, 0.3% (w/v)
polyvinyl pyrrolidone, and 0.1% (v/v) Triton X-100)
and assayed (with final concentration of 0.2 mmol l-1
NADH, 10 mmol l-1 KNO3, and 20 lmol l-1 FAD)
for 60 min. The assay was stopped with the addition of
zinc acetate and the production of nitrite (corrected for
time zero) was expressed as nmol min-1 in the case of
bioassay samples (Berges & Harrison, 1995a) or
mmol m-3 d-1 for field samples. For field samples, a
common assay temperature of 8�C was chosen and
activities were corrected to in situ temperature using a
Q10 of 2; data from Kumar et al. (2008) for 15N-nitrate
uptake rates indicated that such a temperature correc-
tion was appropriate.
Pigment analysis
For HPLC pigment analysis, 1,000 ml of water
collected from 7-m depth from station ON2 in August
2005 was filtered onto a Whatman GF/F filter, wrapped
92°W 91°W 90°W 89°W 88°W 87°W
47°N
48°N
Oce
an D
ata
Vie
w
WM
SteB AP1
AP2
AP4
AP5 ON2
ON1
HN210
HN010
EH090
Bi
MSRSE
PDCD1
MN
MI
ON
WI
Fig. 1 Map of western Lake Superior showing the location of
the hydrographic stations sampled. CD, Castle Danger; EH,
Eagle Harbor (090: 9 km from shore); WM, Western Mid-lake;
SteB, Sterner B; PD, Portage Deep; RSE, River South Entry;
MS, McKay South; Bi, Bingman. Two nearshore–offshore
transects along the Keweenaw Peninsula were sampled includ-
ing Hancock North (HN; 210: 21 km from shore; 010: 1 km
from shore) located north of the Keweenaw Waterway and
Ontonagon (ON) adjacent to the Ontonagon River. In addition, a
transect through the Apostle Islands was sampled (AP1–5).
Dashed lines through the lake show geo-political boundaries.
ON, Ontario (Canada); MN, Minnesota; WI, Wisconsin; MI,
Michigan. Inset: Map of North America showing location of
Lake Superior (box)
Hydrobiologia
123
Page 5
in Al foil and immediately frozen in liquid nitrogen and
stored until analysis. HPLC pigment data were ana-
lyzed using the CHEMTAX (V 1.95) program (Mackey
et al., 1996, 1998), obtained from S. Wright (Australian
Antarctic Division). This program uses a steepest-
descent algorithm to fit a matrix of expected pigment
ratios determined from reference cultures to unknown
samples. Methods followed those of Millie et al. (2009),
using fucoxanthin (diatoms and chrysophytes), neo-
xanthin (chlorophytes), dinoxanthin (dinoflagellates),
alloxanthin (cryptophytes), lutein (chlorophytes), and
zeaxanthin (cyanobacteria). Final pigment allocation is
expressed as percentages of total chl a.
Factorial bioassay experiments
Water sampled from the surface mixed layer was
filtered (0.45 lm) and collected into acid-cleaned 20-l
polycarbonate carboys. With water collected in August
2005, factorial experiments were performed using
duplicate carboys and varying irradiance to mimic that
encountered in the mixed layer during vernal
(\25 lmol quanta m-2 s-1) and seasonal ([100 lmol quanta m-2 s-1) mixing (see Ivanikova et al.,
2007a). Reflecting this, for the bioassays, irradiance
was adjusted to 110 lmol quanta m-2 s-1 high light
(HL) or 8 lmol quanta m-2 s-1 low light (LL), mea-
sured as the average of irradiance in front and behind
the carboy, and adjusted by applying one or more
layers of 3 mm black mesh as a neutral density filter.
Experiments were conducted at 16�C. Carboys either
received no nutrient additions (LN), or additions of
8 lmol l-1 phosphate (as KH2PO4) and 10 nmol l-1
iron (as FeCl3 with equimolar Na2EDTA) (HN).
Carboys were continuously bubbled with filtered air
and samples aseptically removed through a one-way
sampling port; all tubing was silicone.
A level 1 bioassay approach was chosen (Hecky &
Kilham, 1988) thus providing full experimental control
of the parameters leading to population growth.
Carboys were inoculated at an equal initial chl fluores-
cence with a Chlamydomonas species isolated from
Lake Superior (clone CD-1 Red, Canadian Phycolog-
ical Culture Centre [CPCC] strain 641). A ribosomal
18S rRNA sequence for the environmental isolate has
been deposited to GenBank under accession number
KC800695, and aligns perfectly with an 18S sequence
in the database designated Chlamydomonas sordida.
Before use, the chlorophyte was grown at the same
irradiance as the LL treatment using modified Chu-10
medium (Andersen et al., 2005). Over the course of four
grow-ups and dilutions (10 ml transfer in 1 l new
medium), trace metal additions were eliminated and N
and P were gradually reduced from full enrichment to
half enrichment to no additions except those nutrients
carried over in innocula for the last two additions. Cells
were inoculated into the bioassay carboys when the
increase in fluorescence of the stock cultures had ceased
(early stationary phase). Experiments were followed for
8 d. Daily samples were taken for analysis of chl
a (measured spectrophotometrically in 90% acetone
extracts, Parsons et al., 1984), variable fluorescence
emissions (measured in a Turner Designs TD-700
fluorometer before and after addition of 10 lmol l-1
3-(3,4-dichlorophenyl)-1,1-dimethylurea (DCMU;
Cullen & Renger, 1979), nitrate and phosphate (mea-
sured in filtered samples, using the cadmium reduction
method and the ascorbic acid–molybdate method,
respectively, Parsons et al., 1984), and particulate C
and N (measured in samples collected on precombusted
13 mm GF/F filters using a Flash EA 1112 elemental
analyzer [Thermo Fisher Scientific, Waltham, MA,
USA]). NR activity was measured in 500 ml samples
collected on 25 mm Gelman A/E filters and assayed
either immediately or after storage in liquid nitrogen for
up to 2 weeks (see above).
All analyses were run on instruments that are
calibrated at least annually. Replicate blanks and
(where possible) standards were run alongside sam-
ples. No data were excluded from analyses; variation
in replicate numbers indicates accidental loss.
Experiments were analyzed using two-way repeated-
measures ANOVAs, with treatment (light and nutrient
combination) and time as factors, treating each carboy
as an experimental subject. Where found, significant
differences at the 95% confidence level (a = 0.05) were
examined using the Holm–Sidak method using Sigma-
Plot (V. 12, Systat Software Inc., Chicago, IL, USA).
Cyanobacterial bioreporter
A bioluminescent nitrate bioreporter strain AND100
(Ivanikova et al., 2005, 2007a) was used on parallel
samples in August 2005 (station ON2) to assess nitrate
assimilation potential. Engineered using a construct
containing the gene promoter for nitrite reductase
fused to bacterial luciferase genes, the strain exhibits
bioluminescence under physico-chemical conditions
Hydrobiologia
123
Page 6
that favor nitrate/nitrite assimilation with the intensity
of luminescence serving as a measure of nitrate/nitrite
uptake. Synechocystis sp. PCC 6803 strain AND100
was maintained in BG-11 medium containing reduced
nitrate concentration (2.3 mmol l-1) as described
previously (Ivanikova et al., 2005). All cultures were
bubbled with air and grown at 25�C in constant light
(50 lmol quanta m-2 s-1 PAR) provided by cool-
white fluorescent lamps. Growth of batch cultures was
monitored daily by measuring light scattering at
750 nm (OD750nm). Cells were harvested by centrifu-
gation at 4,0009g for 15 min, washed twice in nitrate-
, phosphate- and iron-free BG-11 and resuspended to a
final OD750nm = 0.1 in lake water or BG-11 of defined
nitrate concentration which was used for calibration.
For environmental samples, the AND100 reporter
strain was seeded into filtered water from ON2, and
luminescence was measured following amendment of
samples with phosphate (8 lmol l-1 K2HPO4) and
iron (10 nmol l-1 FeCl3 chelated with Na2EDTA in a
ratio of 1:1.5), both individually and in combination.
Samples were then incubated at 25�C with continuous
gyratory shaking (100 rpm). During assays, irradiance
was maintained at 50 lmol quanta m-2 s-1, a light
flux shown to yield maximum rates of nitrate assim-
ilation using the cyanobacterial bioreporter (Ivanikova
et al., 2005). Luminescence of AND100 cultures was
measured with a Femtomaster model FB14 lumino-
meter (Zylux Corp., Oak Ridge, TN, USA) immedi-
ately following the addition of 20 ll of methanol
containing 27 mmol l-1 n-decyl aldehyde substrate
(Sigma Inc., St. Louis, MO, USA) to 2 ml of the
sample. Light emission from the bioluminescent
AND100 shows strong positive correlation to the rate
of nitrate assimilation (Ivanikova et al., 2005), thus
nutrient factors that constrain nitrate assimilation can
be identified.
Results
Physicochemical characteristics of Lake Superior
Surveys of western Lake Superior were conducted in
May and September 2004 and August 2005 in support
of studies to assess the potential of resident phyto-
plankton to assimilate nitrate. Inverse thermal stratifi-
cation was recorded during the May survey with surface
mixed layer temperatures at offshore stations below
3�C and low chl a biomass ranging from 0.82 to
1.82 lg l-1 at 5 m depth (Table 1). Surface mixed
layer temperature as well as chl a biomass was higher in
nearshore regions, especially at sites influenced by flow
of the Ontanogan River (ON1, HN010). In summer,
strong thermal stratification was evident at all sites
during the September and August surveys with surface
temperatures ranging between 16 and 18.5�C at station
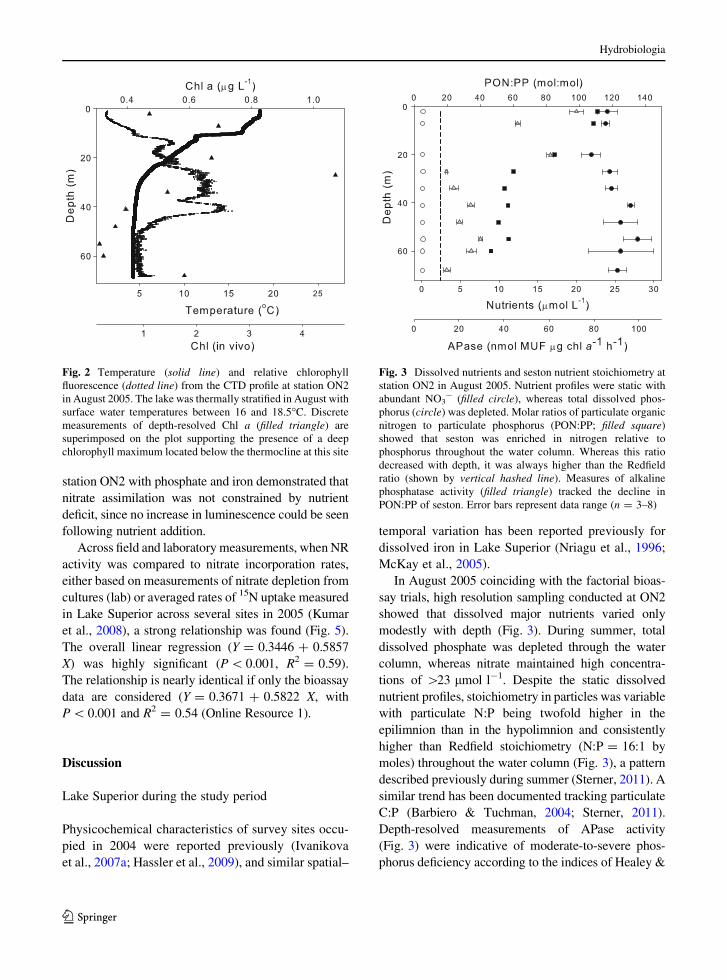
ON2 during 2005 (Fig. 2). There is evidence for a
chlorophyll maximum at depth (located below the
thermocline), identified by fluorometry during CTD
profiles and supported by discrete measures of depth-
resolved total chl a which peaked at 1.07 ± 0.42 lg l-1
at station ON2 (Fig. 2).
Surface nitrate remained high during surveys in this
study (median: 24.3 lmol l-1; Table 1). Dissolved
phosphorus data are available only for the September
survey where mixed layer SRP was measured at low
nanomolar concentrations (1–5 nmol l-1; Ivanikova
et al., 2007a). Dissolved iron was higher in May
(mean = 11.7 nmol l-1) than in September (mean =
4.0 nmol l-1) and was elevated at nearshore sites
compared with offshore locations during the May
survey (Hassler et al., 2009).
In August 2005 coinciding with the factorial bioas-
say trials, high resolution sampling conducted at ON2
showed that dissolved major nutrients varied only
modestly with depth (Fig. 3). During summer, total
dissolved phosphate was depleted through the water
column, whereas nitrate maintained high concentra-
tions of [23 lmol l-1. Despite the static dissolved
nutrient profiles, stoichiometry in particles was variable
with particulate N:P being twofold higher in the
epilimnion than in the hypolimnion and consistently
higher than Redfield stoichiometry (N:P = 16:1 by
moles) throughout the water column (Fig. 3). Depth-
resolved measurement of APase activity tracked the
profile of seston N:P stoichiometry (Fig. 3).
Pigment analysis
HPLC analysis of phytoplankton collected from the
mixed layer at station ON2 in August 2005 showed
dominance of diatoms and chrysophytes, with a
moderate representation of cyanobacteria (23%),
some chlorophytes (6%) and a small biomass of
dinoflagellates (1%).
Hydrobiologia
123
Page 7
NR measurements in the field
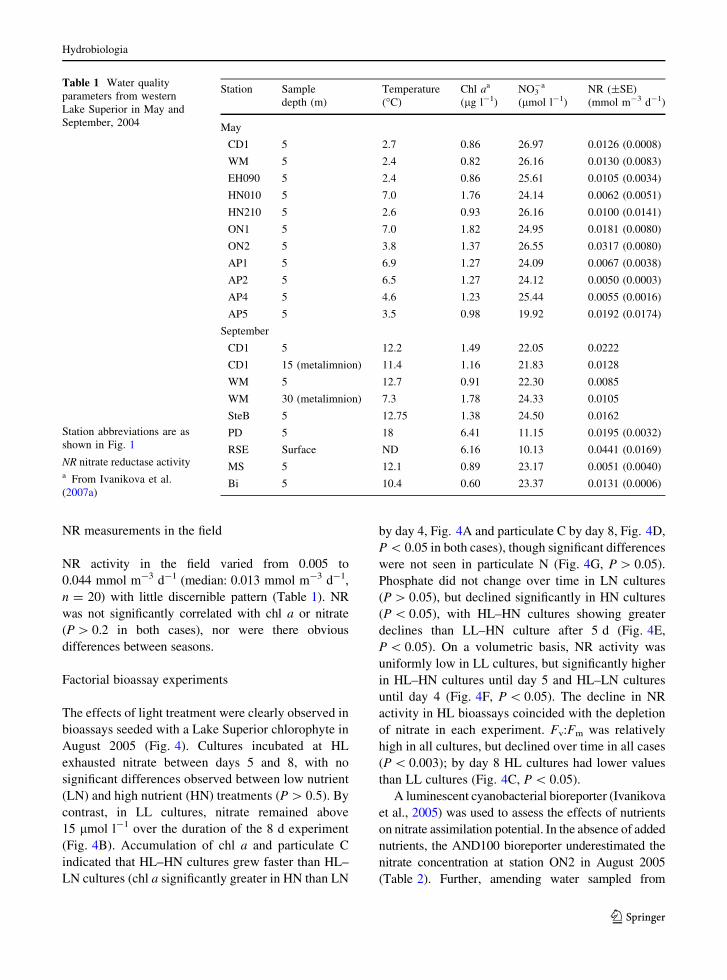
NR activity in the field varied from 0.005 to
0.044 mmol m-3 d-1 (median: 0.013 mmol m-3 d-1,
n = 20) with little discernible pattern (Table 1). NR
was not significantly correlated with chl a or nitrate
(P [ 0.2 in both cases), nor were there obvious
differences between seasons.
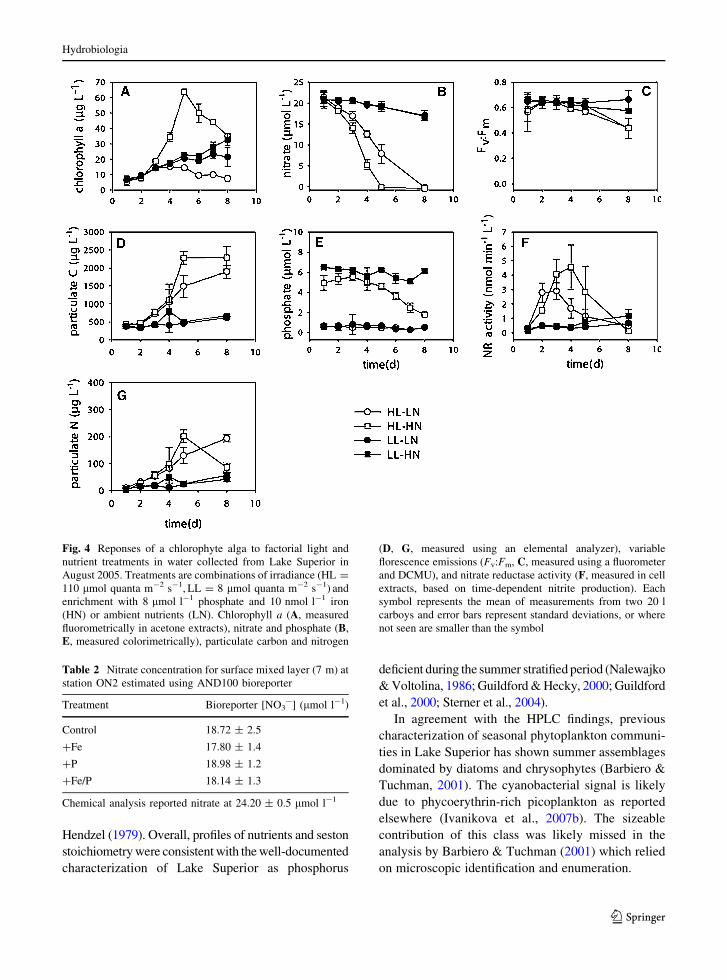
Factorial bioassay experiments
The effects of light treatment were clearly observed in
bioassays seeded with a Lake Superior chlorophyte in
August 2005 (Fig. 4). Cultures incubated at HL
exhausted nitrate between days 5 and 8, with no
significant differences observed between low nutrient
(LN) and high nutrient (HN) treatments (P [ 0.5). By
contrast, in LL cultures, nitrate remained above
15 lmol l-1 over the duration of the 8 d experiment
(Fig. 4B). Accumulation of chl a and particulate C
indicated that HL–HN cultures grew faster than HL–
LN cultures (chl a significantly greater in HN than LN
by day 4, Fig. 4A and particulate C by day 8, Fig. 4D,
P \ 0.05 in both cases), though significant differences
were not seen in particulate N (Fig. 4G, P [ 0.05).
Phosphate did not change over time in LN cultures
(P [ 0.05), but declined significantly in HN cultures
(P \ 0.05), with HL–HN cultures showing greater
declines than LL–HN culture after 5 d (Fig. 4E,
P \ 0.05). On a volumetric basis, NR activity was
uniformly low in LL cultures, but significantly higher
in HL–HN cultures until day 5 and HL–LN cultures
until day 4 (Fig. 4F, P \ 0.05). The decline in NR
activity in HL bioassays coincided with the depletion
of nitrate in each experiment. Fv:Fm was relatively
high in all cultures, but declined over time in all cases
(P \ 0.003); by day 8 HL cultures had lower values
than LL cultures (Fig. 4C, P \ 0.05).
A luminescent cyanobacterial bioreporter (Ivanikova
et al., 2005) was used to assess the effects of nutrients
on nitrate assimilation potential. In the absence of added
nutrients, the AND100 bioreporter underestimated the
nitrate concentration at station ON2 in August 2005
(Table 2). Further, amending water sampled from
Table 1 Water quality
parameters from western
Lake Superior in May and
September, 2004
Station abbreviations are as
shown in Fig. 1
NR nitrate reductase activitya From Ivanikova et al.
(2007a)
Station Sample
depth (m)
Temperature
(�C)
Chl aa
(lg l-1)
NO3-a
(lmol l-1)
NR (±SE)
(mmol m-3 d-1)
May
CD1 5 2.7 0.86 26.97 0.0126 (0.0008)
WM 5 2.4 0.82 26.16 0.0130 (0.0083)
EH090 5 2.4 0.86 25.61 0.0105 (0.0034)
HN010 5 7.0 1.76 24.14 0.0062 (0.0051)
HN210 5 2.6 0.93 26.16 0.0100 (0.0141)
ON1 5 7.0 1.82 24.95 0.0181 (0.0080)
ON2 5 3.8 1.37 26.55 0.0317 (0.0080)
AP1 5 6.9 1.27 24.09 0.0067 (0.0038)
AP2 5 6.5 1.27 24.12 0.0050 (0.0003)
AP4 5 4.6 1.23 25.44 0.0055 (0.0016)
AP5 5 3.5 0.98 19.92 0.0192 (0.0174)
September
CD1 5 12.2 1.49 22.05 0.0222
CD1 15 (metalimnion) 11.4 1.16 21.83 0.0128
WM 5 12.7 0.91 22.30 0.0085
WM 30 (metalimnion) 7.3 1.78 24.33 0.0105
SteB 5 12.75 1.38 24.50 0.0162
PD 5 18 6.41 11.15 0.0195 (0.0032)
RSE Surface ND 6.16 10.13 0.0441 (0.0169)
MS 5 12.1 0.89 23.17 0.0051 (0.0040)
Bi 5 10.4 0.60 23.37 0.0131 (0.0006)
Hydrobiologia
123
Page 8
station ON2 with phosphate and iron demonstrated that
nitrate assimilation was not constrained by nutrient
deficit, since no increase in luminescence could be seen
following nutrient addition.
Across field and laboratory measurements, when NR
activity was compared to nitrate incorporation rates,
either based on measurements of nitrate depletion from
cultures (lab) or averaged rates of 15N uptake measured
in Lake Superior across several sites in 2005 (Kumar
et al., 2008), a strong relationship was found (Fig. 5).
The overall linear regression (Y = 0.3446 ? 0.5857
X) was highly significant (P \ 0.001, R2 = 0.59).
The relationship is nearly identical if only the bioassay
data are considered (Y = 0.3671 ? 0.5822 X, with
P \ 0.001 and R2 = 0.54 (Online Resource 1).
Discussion
Lake Superior during the study period
Physicochemical characteristics of survey sites occu-
pied in 2004 were reported previously (Ivanikova
et al., 2007a; Hassler et al., 2009), and similar spatial–
temporal variation has been reported previously for
dissolved iron in Lake Superior (Nriagu et al., 1996;
McKay et al., 2005).
In August 2005 coinciding with the factorial bioas-
say trials, high resolution sampling conducted at ON2
showed that dissolved major nutrients varied only
modestly with depth (Fig. 3). During summer, total
dissolved phosphate was depleted through the water
column, whereas nitrate maintained high concentra-
tions of [23 lmol l-1. Despite the static dissolved
nutrient profiles, stoichiometry in particles was variable
with particulate N:P being twofold higher in the
epilimnion than in the hypolimnion and consistently
higher than Redfield stoichiometry (N:P = 16:1 by
moles) throughout the water column (Fig. 3), a pattern
described previously during summer (Sterner, 2011). A
similar trend has been documented tracking particulate
C:P (Barbiero & Tuchman, 2004; Sterner, 2011).
Depth-resolved measurements of APase activity
(Fig. 3) were indicative of moderate-to-severe phos-
phorus deficiency according to the indices of Healey &
Fig. 2 Temperature (solid line) and relative chlorophyll
fluorescence (dotted line) from the CTD profile at station ON2
in August 2005. The lake was thermally stratified in August with
surface water temperatures between 16 and 18.5�C. Discrete
measurements of depth-resolved Chl a (filled triangle) are
superimposed on the plot supporting the presence of a deep
chlorophyll maximum located below the thermocline at this site
Fig. 3 Dissolved nutrients and seston nutrient stoichiometry at
station ON2 in August 2005. Nutrient profiles were static with
abundant NO3- (filled circle), whereas total dissolved phos-
phorus (circle) was depleted. Molar ratios of particulate organic
nitrogen to particulate phosphorus (PON:PP; filled square)
showed that seston was enriched in nitrogen relative to
phosphorus throughout the water column. Whereas this ratio
decreased with depth, it was always higher than the Redfield
ratio (shown by vertical hashed line). Measures of alkaline
phosphatase activity (filled triangle) tracked the decline in
PON:PP of seston. Error bars represent data range (n = 3–8)
Hydrobiologia
123
Page 9
Hendzel (1979). Overall, profiles of nutrients and seston
stoichiometry were consistent with the well-documented
characterization of Lake Superior as phosphorus
deficient during the summer stratified period (Nalewajko
& Voltolina, 1986; Guildford & Hecky, 2000; Guildford
et al., 2000; Sterner et al., 2004).
In agreement with the HPLC findings, previous
characterization of seasonal phytoplankton communi-
ties in Lake Superior has shown summer assemblages
dominated by diatoms and chrysophytes (Barbiero &
Tuchman, 2001). The cyanobacterial signal is likely
due to phycoerythrin-rich picoplankton as reported
elsewhere (Ivanikova et al., 2007b). The sizeable
contribution of this class was likely missed in the
analysis by Barbiero & Tuchman (2001) which relied
on microscopic identification and enumeration.
Fig. 4 Reponses of a chlorophyte alga to factorial light and
nutrient treatments in water collected from Lake Superior in
August 2005. Treatments are combinations of irradiance (HL =
110 lmol quanta m-2 s-1, LL = 8 lmol quanta m-2 s-1) and
enrichment with 8 lmol l-1 phosphate and 10 nmol l-1 iron
(HN) or ambient nutrients (LN). Chlorophyll a (A, measured
fluorometrically in acetone extracts), nitrate and phosphate (B,
E, measured colorimetrically), particulate carbon and nitrogen
(D, G, measured using an elemental analyzer), variable
florescence emissions (Fv:Fm, C, measured using a fluorometer
and DCMU), and nitrate reductase activity (F, measured in cell
extracts, based on time-dependent nitrite production). Each
symbol represents the mean of measurements from two 20 l
carboys and error bars represent standard deviations, or where
not seen are smaller than the symbol
Table 2 Nitrate concentration for surface mixed layer (7 m) at
station ON2 estimated using AND100 bioreporter
Treatment Bioreporter [NO3-] (lmol l-1)
Control 18.72 ± 2.5
?Fe 17.80 ± 1.4
?P 18.98 ± 1.2
?Fe/P 18.14 ± 1.3
Chemical analysis reported nitrate at 24.20 ± 0.5 lmol l-1
Hydrobiologia
123
Page 10
NR as an indicator of N-incorporation
The range of NR values corresponds quite closely to
the range of 15N nitrate uptake rates (approximately
0.001–0.037 mmol m-3 d-1) measured in Lake Supe-
rior in 2005 and 2006 (Kumar et al., 2008). In marine
waters, NR has often been measured and compared
with nitrate uptake and incorporation, though earlier
work likely suffered from assays that underestimated
activity (see Berges & Harrison, 1995a). Good rela-
tionships have been observed in a number of environ-
ments, especially those with diatoms, under conditions
including iron and light limitation (Berges et al., 1995,
2004; Boyd et al., 1998; Hung et al., 2000). In contrast,
despite a long history of NR measurement in cultures
of freshwater algal genera such as Chlorella and
Chlamydomonas (e.g., Morris & Syrett, 1963) there
are relatively few studies of NR in freshwaters
(Wynne & Berman, 1990; Aleya, 1992; Mallet et al.,
1998; Gordillo et al., 2001), and these have generally
been unable to relate NR activity to rates of assimi-
lation or environmental variables. Some of the issues
may be methodological (see Hochman et al., 1986;
Berges & Harrison, 1995a), but another factor may
be the species in the systems. NR activity has
been especially difficult to relate to environmental
variables in dinoflagellate-dominated systems (Wynne
& Berman, 1990), and Berges & Harrison (1995a)
noted weaker relationships between NR activity and
nitrate incorporation in a dinoflagellate species.
Moreover, using polyclonal antibodies raised against
NR purified from the marine diatom Thalassiosira
weissflogii (Vergara et al., 1998), we detected cross-
reacting proteins of appropriate size on Western blots
containing protein extracts of bulk net seston col-
lected from multiple sites in May 2004 (J. Berges,
unpublished). These results suggest that NR assays
developed for marine waters are applicable to
freshwaters and that rates of NR activity agree with
independent measures of nitrate uptake, even when it
is poorly correlated with environmental measurements.
We found a strong relationship between NR activity
and N-incorporation across field and bioassay sam-
ples. Some of the lowest nitrate incorporation rates
measured (0.01–0.2 nmol min-1 l-1) were not well-
correlated with NR activity, but occurred in bioassays
at the point where cultures exhausted nitrate. This
likely reflects the fact that it takes some period of time
before NR activity responds to removal of substrate
(see Berges et al., 1995). Such a robust relationship
across species, limiting factor and environment sug-
gest that NR occupies a critical place in nitrate
metabolism, if not controlling incorporation, then at
least acclimating quickly enough to be useful as an
indicator (Berges & Harrison, 1995a, Berges, 1997).
Bioassays of limiting factors in Lake Superior
The chlorophyte used in these experiments was able to
completely remove ambient nitrate in Lake Superior
water only if provided high irradiance. This suggests
that most other resources are present at sufficient
levels to support production sufficient for nitrate
drawdown and that light is a key factor. These findings
reinforce the observations of Ivanikova et al. (2005,
2007a). In these experiments, temperature was main-
tained at 16�C guided by the in situ temperatures
encountered in the mixed layer at station ON2 from
where the water was collected (Fig. 2). While this
temperature was somewhat higher than what is
normally recorded for surface waters in late summer
in the lake (cf. Table 1), this may have alleviated the
temperature limitation on nitrate assimilation described
previously (Kumar et al., 2008). If this were the case;
however, it seems more likely that temperature would
Fig. 5 Relationship between nitrate reductase (NR) activity
and nitrate incorporation rate in field samples and experimental
samples. Field samples represent averages of NR activities from
Table 1, plotted against 15N uptake rates averages from 2005 to
2006 data presented in Kumar et al. (2008). Experimental data is
derived from data presented in Fig. 4, plotting measured NR
against nitrate uptake from day to day of the experiment. Solid
line represents the 1:1 relationship. The data are fit by a
regression line of equation Y = 0.3446 ? 0.5857 X (R2 = 0.59,
P \ 0.001)
Hydrobiologia
123
Page 11
change the time scale of responses rather than the
pattern. We found little evidence in the bioassay
experiments of phosphorus or iron limitation, though
nitrate was exhausted earlier in HL–HN than in HL–LN
carboys. This is also supported by uniformly high
Fv:Fm values, that did respond to eventual nitrate
depletion. However, it is important to recognize that
chlorophytes were grown for a period of weeks before
the experiments in artificially enriched media contain-
ing higher nutrients than lake water, and carryover of
dissolved P from the inocula may have further contrib-
uted to P availability in the bioassay. We did see some
differences in growth and incorporation of nutrients
between LN and HN treatments indicating some
residual nutrient deficiency even with possible carry-
over factored in. However, even though we attempted
to minimize these effects by gradually diluting cultures
before inoculation, we cannot reject the possibility that
cells had internal and external pools of nutrients higher
than what phytoplankton would have had in situ. Thus,
while our work affirms the importance of irradiance, the
significance of limited nutrients is less straightforward
to assess. Further, it is clear from the literature that
species-specific responses are important to understand-
ing nutrient dynamics in the field (e.g., Needoba &
Harrison, 2004; Berges et al., 2004), so the response of
the chlorophyte is not necessarily indicative of all
species in the lake.
We did not normalize NR activity to algal biomass
because the focus of the study was nitrate dynamics in
the lake. Since we could independently measure
uptake and incorporation on a volumetric basis, we
chose this approach. Normalizing to chl a was con-
sidered inappropriate because the cells were acclimat-
ing to different irradiances and so chl a per cell would
be changing; normalizing per unit C or N face similar
issues. Berges & Harrison (1995b) demonstrated that
scaling to biomass typically increased the variance of
measurements. In fact, in this study, scaling to chl a or
C, while it increased variance, did not change the basic
patterns in NR activity, nor did it alter the statistical
results (Online Resource 2).
Whereas the bioassay approach can provide useful
information regarding nutrient limitation of phyto-
plankton, the assays are of long duration over which
time increases in algal biomass may yield changes in
water chemistry. Thus, complementing the factorial
bioassay approach was use of a luminescent cyano-
bacterial bioreporter (Ivanikova et al., 2005) to rapidly
(6–12 h) assess the effects of nutrients (P, Fe) on
nitrate assimilation. This approach also offered anal-
ysis using a separate taxon, important considering
recognized differences in nutrient assimilation mech-
anisms existing among phytoplankton. Indeed, assim-
ilatory nitrate transport and reduction fundamentally
differs between eukaryotes and cyanobacteria (Ber-
ges, 1997; Needoba & Harrison, 2004).
Added nutrients had no effect on the AND100
bioreporter assay (Table 2), similar to trials conducted
throughout western Lake Superior in 2004 (Ivanikova
et al., 2007a). This suggests that nitrate assimilation was
not constrained by nutrient deficit, since no increase in
luminescence could be seen following nutrient addition.
At first glance, this runs counter to our characterization
of the epilimnion at this site as phosphorus deficient
based on seston N:P ratios and APase activity (Fig. 3).
This may; however, reflect taxonomic differences in
susceptibility to phosphorus deficiency and highlights
the importance of extending multiple approaches in
addressing community-level phenomena.
Acknowledgments This material is based upon work
supported by the National Science Foundation under grant
numbers OCE-0327738, OCE-0352274 (R.M.L.M. and G.S.B.),
and OCE-0352291(R.W.S). The authors are grateful to the
Captain and crew of the R/V Blue Heron for their assistance with
the collection of samples. We also extend thanks to Michael
Twiss, Christel Hassler, Rob Sherrell, Jason Agnich, and Sandra
Brovold who provided assistance with shipboard sampling and
analysis. HPLC analysis was provided by the Center for Hydro-
Optics and Remote Sensing, San Diego State University.
We thank Lauren Simmons for assistance with CHEMTAX
analyses of HPLC data. Ben Beall provided assistance with
figure preparation.
References
Aleya, L., 1992. The seasonal succession of phytoplankton in an
eutrophic lake through the coupling of biochemical-com-
position of particulates, metabolic parameters and envi-
ronmental-conditions. Archiv fur Hydrobiologie 124:
69–88.
Anagnostou, E. & R. M. Sherrell, 2008. MAGIC method for
subnanomolar orthophosphate determination in freshwater.
Limnology and Oceanography: Methods 6: 64–74.
Andersen, R. A., J. A. Berges, P. J. Harrison & M. M. Watanabe,
2005. Appendix A. Recipes for freshwater and seawater
media. In Andersen, R. A. (ed.), Algal Culturing Techniques.
Elsevier, Amsterdam: 429–538.
Barbiero, R. P. & M. L. Tuchman, 2001. Results from U.S.
EPA’s biological open water surveillance program of the
Laurentian Great Lakes: I. Introduction and phytoplankton
results. Journal of Great Lakes Research 27: 134–154.
Hydrobiologia
123
Page 12
Barbiero, R. P. & M. L. Tuchman, 2004. The deep chlorophyll
maximum in Lake Superior. Journal of Great Lakes
Research 30: 256–268.
Beeton, A. M., 1965. Eutrophication of the St. Lawrence Great
Lakes. Limnology and Oceanography 10: 240–254.
Bennett, E. B., 1986. The nitrifying of Lake Superior. Ambio 15:
272–275.
Berges, J. A., 1997. Algal nitrate reductases. European Journal
of Phycology 32: 3–8.
Berges, J. A. & P. J. Harrison, 1995a. Nitrate reductase activity
quantitatively predicts the rate of nitrate incorporation
under steady state light limitation: a revised assay and
characterization of the enzyme in three species of marine
phytoplankton. Limnology and Oceanography 40: 82–93.
Berges, J. A. & P. J. Harrison, 1995b. Relationships between
nitrate reductase activity and rates of growth and nitrate
incorporation under steady-state light or nitrate limitation
in the marine diatom Thalassiosira pseudonana (Bacillar-
iophyceae). Journal of Phycology 31: 85–95.
Berges, J. A., W. P. Cochlan & P. J. Harrison, 1995. Laboratory
and field responses of algal nitrate reductase to diel peri-
odicity in irradiance, nitrate exhaustion, and the presence of
ammonium. Marine Ecology Progress Series 124: 259–269.
Berges, J. A., C. E. Gibson & B. M. Stewart, 2004. Physiological
responses of phytoplankton communities in the Irish Sea to
simulated upwelling. Hydrobiologia 517: 121–132.
Boyd, P., J. A. Berges & P. J. Harrison, 1998. In vitro iron
enrichment experiments at iron-rich and -poor sites in the
NE subarctic Pacific. Journal of Experimental Marine
Biology and Ecology 227: 133–151.
Carlton, R. G., G. S. Walker, M. J. Klug & R. G. Wetzel, 1989.
Relative values of oxygen, nitrate, and sulfate to terminal
microbial processes in the sediments of Lake Superior.
Journal of Great Lakes Research 15: 133–140.
Chapra, S. C., A. Dove & G. J. Warren, 2012. Long-term trends
of Great Lakes major ion chemistry. Journal of Great Lakes
Research 38: 550–560.
Conroy, J. D., D. D. Kane, D. M. Dolan, W. J. Edwards, M.
N. Charlton & D. A. Culver, 2005. Temporal trends in Lake
Erie plankton biomass: roles of external phosphorus load-
ing and dreissenid mussels. Journal of Great Lakes
Research 31: 89–110.
Cullen, J. & E. Renger, 1979. Continuous measurement of the
DCMU-induced fluorescence response of natural phyto-
plankton populations. Marine Biology 53: 13–20.
DeYoe, H. R. & C. A. Suttle, 1994. The inability of the Texas
‘‘brown tide’’ alga to use nitrate and the role of nitrogen in
the initiation of a persistent bloom of this organism. Journal
of Phycology 30: 800–806.
Dove, A., 2009. Long-term trends in major ions and nutrients in
Lake Ontario. Aquatic Ecosystem Health & Management
12: 281–295.
Finlay, J. C., R. W. Sterner & S. Kumar, 2007. Isotopic evidence
for in-lake production of accumulating nitrate in Lake
Superior. Ecological Applications 17: 2323–2332.
Galloway, J. N., J. D. Aber, J. W. Erisman, S. P. Seitzinger, R.
W. Howarth, E. B. Cowling & B. J. Cosby, 2003. The
nitrogen cascade. BioScience 53: 341–356.
Gordillo, F. J. L., R. Garcia-Ruiz, A. Corzo, J. Lucena & F.
X. Niell, 2001. Nitrate reductase activity in an eutrophic
reservoir during the stratification cycle. International
Review of Hydrobiology 86: 603–618.
Guildford, S. J. & R. E. Hecky, 2000. Total nitrogen, total
phosphorus, and nutrient limitation in lakes and oceans: is
there a common relationship? Limnology and Oceanogra-
phy 45: 1213–1223.
Guildford, S. J., H. A. Bootsma, E. J. Fee, R. E. Hecky & G.
Patterson, 2000. Phytoplankton nutrient status and mean
water column irradiance in Lakes Malawi and Superior.
Aquatic Ecosystem Health & Management 3: 35–45.
Hassler, C. S., S. M. Havens, G. S. Bullerjahn, R. M. L. McKay
& M. R. Twiss, 2009. An evaluation of iron bioavailability
and speciation in western Lake Superior with the use of
combined physical, chemical, and biological assessment.
Limnology and Oceanography 54: 987–1001.
Hawley, N., T. H. Johengren, Y. R. Rao, A. Ruberg, D. Beletsky,
S. A. Ludsin, B. J. Eadie, D. J. Schwab, T. E. Croley & S.
B. Brandt, 2006. Lake Erie hypoxia prompts Canada—U.S.
study. Eos, Transactions, American Geophysical Union 87:
313–314.
Healey, F. P. & L. L. Hendzel, 1979. Fluorometric measurement
of alkaline phosphatase activity in algae. Freshwater
Biology 9: 429–439.
Hecky, R. E. & P. Kilham, 1988. Nutrient limitation of phyto-
plankton in freshwater and marine environments: a review
of recent evidence on the effects of enrichment. Limnology
and Oceanography 33: 796–822.
Hochman, A., A. Nissany, D. Wynne, B. Kaplan & T. Berman,
1986. Nitrate reductase: an improved assay method for
phytoplankton. Journal of Plankton Research 8: 385–392.
Hung, C. C., G. T. F. Wong, K. K. Liu, F. K. Shiah & G.
C. Gong, 2000. The effects of light and nitrate levels on the
relationship between nitrate reductase activity and 15NO3-
uptake: field observations in the East China Sea. Limnol-
ogy and Oceanography 45: 836–848.
Ivanikova, N. V., R. M. L. McKay & G. S. Bullerjahn, 2005.
Construction and characterization of a cyanobacterial bi-
oreporter capable of assessing nitrate assimilatory capacity
in freshwaters. Limnology and Oceanography: Methods 3:
86–93.
Ivanikova, N. V., R. M. L. McKay, G. S. Bullerjahn & R.
W. Sterner, 2007a. Nitrate utilization by phytoplankton in
Lake Superior is impaired by low nutrient (P, Fe) avail-
ability and seasonal light limitation—a cyanobacterial bi-
oreporter study. Journal of Phycology 43: 475–484.
Ivanikova, N. V., L. C. Popels, R. M. L. McKay & G. S. Bul-
lerjahn, 2007b. Lake Superior supports novel clusters of
cyanobacterial picoplankton. Applied and Environmental
Microbiology 73: 4055–4065.
Kelly, J. R., P. M. Yurista, S. E. Miller, A. C. Cotter, T. C. Corry,
J. V. Scharold, M. E. Sierszen, E. J. Issac & J. D. Stockwell,
2011. Challenges to Lake Superior’s condition, assessment
and management: a few observations across a generation of
change. Aquatic Ecosystem Health & Management 14:
332–344.
Kumar, S., R. W. Sterner & J. C. Finlay, 2008. Nitrogen and
carbon uptake dynamics in Lake Superior. Journal of
Geophysical Research 113: G04003.
Li, J., S. A. Crowe, D. Miklesh, M. Kistner, D. E. Canfield & S.
Katsev, 2012. Carbon mineralization and oxygen dynamics
Hydrobiologia
123
Page 13
in sediments with deep oxygen penetration, Lake Superior.
Limnology and Oceanography 57: 1634–1650.
Lu, Y., P. A. Meyers, T. H. Johengen, B. J. Eadie, J. A. Robbins
& H. Han, 2010. d15N values in Lake Erie sediments as
indicators of nitrogen biogeochemical dynamics during
cultural eutrophication. Chemical Geology 273: 1–7.
Mackey, M. D., D. J. Mackey, H. W. Higgens & S. W. Wright,
1996. CHEMTAX—a program for estimating class abun-
dances from chemical markers: application to HPLC
measurements of phytoplankton. Marine Ecology Progress
Series 144: 265–283.
Mackey, D. J., H. W. Higgins, M. D. Mackey & D. Holdsworth,
1998. Algal class abundances in the western equatorial
Pacific: estimation from HPLC measurements of chloro-
plast pigments using CHEMTAX. Deep Sea Research Part
I: Oceanographic Research Papers 45: 1441–1468.
Makarewicz, J. C., P. Bertram & T. W. Lewis, 2000. Chemistry
of the offshore surface waters of Lake Erie: pre- and post-
Dreissena introduction (1983–1993). Journal of Great
Lakes Research 26: 82–93.
Mallet, C., M. Charpin & J. Devaux, 1998. Nitrate reductase
activity of phytoplankton populations in eutrophic Lake
Aydat and meso-oligotrophic Lake Pavin: a comparison.
Hydrobiologia 374: 135–148.
McCarthy, M. J., W. S. Gardner, P. J. Lavrentyev, K. M. Moats,
F. J. Jochem & D. M. Klarer, 2007. Effects of hydrological
flow regime on sediment–water interface and water column
nitrogen dynamics in a Great Lakes coastal watershed
(Old Woman Creek, Lake Erie). Journal of Great Lakes
Research 33: 219–231.
McDonald, C. P., N. R. Urban & C. M. Casey, 2010. Modeling
historical trends in Lake Superior total nitrogen concen-
trations. Journal of Great Lakes Research 36: 715–721.
McKay, R. M. L., D. Porta, G. S. Bullerjahn, M. M. D. Al-
Rshaidat, J. A. Klimowicz, R. W. Sterner, T. A. Smutka, E.
T. Brown & R. M. Sherrell, 2005. Bioavailable iron in
oligotrophic Lake Superior assessed using biological
reporters. Journal of Plankton Research 27: 1033–1044.
Menzel, D. W. & N. Corwin, 1965. The measurement of total
phosphorus in seawater based on the liberation of organi-
cally bound fractions by persulfate oxidation. Limnology
and Oceanography 10: 280–282.
Millie, D. F., G. L. Fahnenstiel, J. Dyble Bressie, R. J. Pigg, R.
R. Rediske, D. Klarer, P. A. Tester & R. W. Litaker, 2009.
Late-summer phytoplankton in western Lake Erie (Lau-
rentian Great Lakes): bloom distributions, toxicity, and
environmental influences. Aquatic Ecology 43: 915–934.
Moore, L. R., A. F. Post, G. Rocap & S. W. Chisholm, 2002.
Utilization of different nitrogen sources by the marine
cyanobacteria Prochlorococcus and Synechococcus. Lim-
nology and Oceanography 47: 989–996.
Morris, I. & P. J. Syrett, 1963. The development of nitrate
reductase in Chlorella and its repression by ammonium.
Archiv fur Mikrobiologie 47: 32–41.
Nalewajko, C. & D. Voltolina, 1986. Effects of environmental
variables on growth rates and physiological characteristics
of Lake Superior phytoplankton. Canadian Journal of
Fisheries and Aquatic Sciences 43: 1163–1170.
Needoba, J. A. & P. J. Harrison, 2004. Influence of low light and
a light: dark cycle on NO3- uptake, intracellular NO3
-, and
nitrogen isotope fractionation by marine phytoplankton.
Journal of Phycology 40: 505–516.
Neilson, M. A., D. S. Painter, G. Warren, R. A. Hites, I. Basu, D.
V. C. Weseloh, D. M. Whittle, G. Christie, R. Barbiero, M.
Tuchman, O. E. Johannsson, T. F. Nalepa, T. A. Edsall, G.
Fleischer, C. Bronte, S. B. Smith & P. C. Baumann, 2003.
Ecological monitoring for assessing the state of the near-
shore and open waters of the Great Lakes. Environmental
Monitoring and Assessment 88: 103–117.
Nriagu, J. O., G. Lawson, H. K. T. Wong & V. Cheam, 1996.
Dissolved trace metals in Lakes Superior, Erie, and Ontario.
Environmental Science and Technology 30: 178–187.
Parsons, T., M. Maita & C. Lalli, 1984. A Manual of Chemical
and Biological Methods for Seawater Analysis. Pergam-
mon Press, Oxford.
Rhee, G. Y., 1978. Effects of N:P atomic ratios and nitrate
limitation on algal growth, cell composition, and nitrate
uptake. Limnology and Oceanography 23: 10–25.
Richards, R. P. & D. B. Baker, 1993. Trends in nutrient and
suspended sediment concentrations in Lake Erie tributaries,
1975–1990. Journal of Great Lakes Research 19: 200–211.
Rufty, T. W., C. T. MacKown & D. W. Israel, 1990. Phosphorus
stress effects on assimilation of nitrate. Plant Physiology
94: 328–333.
Schindler, D. W., 2006. Recent advances in the understanding
and management of eutrophication. Limnology and
Oceanography 51: 356–363.
Sinsabaugh, R. L., S. Findlay, P. Franchini & D. Fischer, 1997.
Enzymatic analysis of riverine bacterioplankton produc-
tion. Limnology and Oceanography 42: 29–38.
Small, G. E., G. S. Bullerjahn, R. W. Sterner, B. F. N. Beall, S.
Brovold, J. C. Finlay, R. M. L. McKay & M. Mukherjee,
2013a. Rates and controls of nitrification in a large oligo-
trophic lake. Limnology and Oceanography 58: 276–286.
Small, G. E., J. B. Cotner, J. C. Finlay, R. A. Stark & R.
W. Sterner, 2013b. Nitrogen transformations at the sedi-
ment–water interface across redox gradients in the Lau-
rentian Great Lakes. Hydrobiologia. doi:10.1007/s10750-
013-1569-7.
Sterner, R. W., 2010. In situ measured primary production in
Lake Superior. Journal of Great Lakes Research 36:
139–149.
Sterner, R. W., 2011. C:N:P stoichiometry in Lake Superior:
freshwater sea as end member. Inland Waters 1: 29–46.
Sterner, R. W., T. M. Smutka, R. M. L. McKay, Q. Xiaoming, E.
T. Brown & R. M. Sherrell, 2004. Phosphorus and trace
metal limitation of algae and bacteria in Lake Superior.
Limnology and Oceanography 49: 495–507.
Sterner, R. W., E. Anagnostou, S. Brovold, G. S. Bullerjahn, J.
C. Finlay, S. Kumar, R. M. L. McKay & R. M. Sherrell,
2007. Increasing stoichiometric imbalance in North
America’s largest lake: nitrification in Lake Superior.
Geophysical Research Letters 34: L10406.
U.S. Environmental Protection Agency, 1971. Algal Assay
Procedure: Bottle Test. National Eutrophication Research
Program, Corvallis, OR: 82 pp.
Vergara, J. J., J. A. Berges & P. G. Falkowski, 1998. Diel
periodicity of nitrate reductase activity and protein levels
in the marine diatom Thalassiosira weissflogii (Bacillari-
ophyceae). Journal of Phycology 34: 952–961.
Hydrobiologia
123
Page 14
Weiler, R., 1978. Chemistry of Lake Superior. Journal of Great
Lakes Research 4: 370–385.
Welschmeyer, N. A., 1994. Fluorometric analysis of chlorophyll
a in the presence of chlorophyll b and pheopigments.
Limnology and Oceanography 39: 1985–1992.
Wynne, D. & T. Berman, 1990. The influence of environmental
factors on nitrate reductase activity in freshwater phyto-
plankton. I. Field studies. Hydrobiologia 194: 235–245.
Hydrobiologia
123