agronomy Article Identification of Wheat Cultivars for Low Nitrogen Tolerance Using Multivariable Screening Approaches Bhudeva S. Tyagi 1, *, John Foulkes 2 , Gyanendra Singh 1 , Sindhu Sareen 1 , Pradeep Kumar 1 , Martin R. Broadley 2 , Vikas Gupta 1 , Gopalareddy Krishnappa 1 , Ashish Ojha 1 , Jaswant S. Khokhar 2 , Ian P. King 2 and Gyanendra Pratap Singh 1 1 Division of Crop Improvement, ICAR-Indian Institute of Wheat and Barley Research, Karnal 132001, India; [email protected] (G.S.); [email protected] (S.S.); [email protected] (P.K.); [email protected] (V.G.); [email protected] (G.K.); [email protected] (A.O); [email protected] (G.P.S.) 2 Division of Plant and Crop Science, School of Biosciences, University of Nottingham, Sutton Bonington, Loughborough, Leicestershire LE12 5RD, UK; [email protected] (J.F.); [email protected] (M.R.B.); [email protected] (J.S.K.); [email protected] (I.P.K.) * Correspondence: [email protected]; Tel.: +91-184-2209115 Received: 27 January 2020; Accepted: 13 March 2020; Published: 19 March 2020 Abstract: A set of thirty-six wheat cultivars were grown for two consecutive years under low and high nitrogen conditions. The interactions of cultivars with different environmental factors were shown to be highly significant for most of the studied traits, suggesting the presence of wider genetic variability which may be utilized for the genetic improvement of desired trait(s). Three cultivars, i.e., RAJ 4037, DBW 39 and GW 322, were selected based on three selection indices, i.e., tolerance index (TOL), stress susceptibility index (SSI), and yield stability index (YSI), while two cultivars, HD 2967 and MACS 6478, were selected based on all four selection indices which were common in both of the study years. According to Kendall’s concordance coefficient, the consistency of geometric mean productivity (GMP) was found to be highest (0.778), followed by YSI (0.556), SSI (0.472), and TOL (0.200). Due to the high consistency of GMP followed by YSI and SSI, the three selection indices could be utilized as a selection tool in the identification of high-yielding genotypes under low nitrogen conditions. The GMP and YSI selection indices had a positive and significant correlation with grain yield, whereas TOL and SSI exhibited a significant but negative correlation with grain yield under both high and low nitrogen conditions in both years. The common tolerant genotypes identified through different selection indices could be utilized as potential donors in active breeding programs to incorporate the low nitrogen tolerant genes to develop high-yielding wheat varieties for low nitrogen conditions. The study also helps in understanding the physiological basis of tolerance in high-yielding wheat genotypes under low nitrogen conditions. Keywords: low nitrogen; nitrogen use efficiency; selection indices 1. Introduction Wheat is an important cereal crop, accounting for about 20 percent of the calories consumed by the human population across the globe. Global wheat production was 749 million tons in 2016 [1], while that of India recorded an all-time high of 102.19 million tons in 2019. The rate of global yield increase in wheat is declining, and is currently about 1.1 percent per annum [2]. Nitrogen is the most important macronutrient for plants, but is costly to supply and can adversely affect the environment. Up to 50%–70% of nitrogen applied to the wheat cropping system is not utilized by the plants [3]; Agronomy 2020, 10, 417; doi:10.3390/agronomy10030417 www.mdpi.com/journal/agronomy
Transcript
agronomy
Article
Identification of Wheat Cultivars for Low NitrogenTolerance Using Multivariable Screening Approaches
Bhudeva S. Tyagi 1,*, John Foulkes 2, Gyanendra Singh 1 , Sindhu Sareen 1, Pradeep Kumar 1,Martin R. Broadley 2 , Vikas Gupta 1 , Gopalareddy Krishnappa 1, Ashish Ojha 1,Jaswant S. Khokhar 2, Ian P. King 2 and Gyanendra Pratap Singh 1
Received: 27 January 2020; Accepted: 13 March 2020; Published: 19 March 2020�����������������
Abstract: A set of thirty-six wheat cultivars were grown for two consecutive years under low andhigh nitrogen conditions. The interactions of cultivars with different environmental factors wereshown to be highly significant for most of the studied traits, suggesting the presence of wider geneticvariability which may be utilized for the genetic improvement of desired trait(s). Three cultivars,i.e., RAJ 4037, DBW 39 and GW 322, were selected based on three selection indices, i.e., tolerance index(TOL), stress susceptibility index (SSI), and yield stability index (YSI), while two cultivars, HD 2967and MACS 6478, were selected based on all four selection indices which were common in both ofthe study years. According to Kendall’s concordance coefficient, the consistency of geometric meanproductivity (GMP) was found to be highest (0.778), followed by YSI (0.556), SSI (0.472), and TOL(0.200). Due to the high consistency of GMP followed by YSI and SSI, the three selection indices couldbe utilized as a selection tool in the identification of high-yielding genotypes under low nitrogenconditions. The GMP and YSI selection indices had a positive and significant correlation with grainyield, whereas TOL and SSI exhibited a significant but negative correlation with grain yield underboth high and low nitrogen conditions in both years. The common tolerant genotypes identifiedthrough different selection indices could be utilized as potential donors in active breeding programsto incorporate the low nitrogen tolerant genes to develop high-yielding wheat varieties for lownitrogen conditions. The study also helps in understanding the physiological basis of tolerance inhigh-yielding wheat genotypes under low nitrogen conditions.
Keywords: low nitrogen; nitrogen use efficiency; selection indices
1. Introduction
Wheat is an important cereal crop, accounting for about 20 percent of the calories consumed bythe human population across the globe. Global wheat production was 749 million tons in 2016 [1],while that of India recorded an all-time high of 102.19 million tons in 2019. The rate of global yieldincrease in wheat is declining, and is currently about 1.1 percent per annum [2]. Nitrogen is the mostimportant macronutrient for plants, but is costly to supply and can adversely affect the environment.Up to 50%–70% of nitrogen applied to the wheat cropping system is not utilized by the plants [3];
moreover, globally, wheat accounts for nearly one-third of crop fertilizer use. India is the secondlargest consumer of nitrogenous fertilizers in the world after China [1]. The development of wheatgenotypes with high nitrogen use-efficiency would be of economic benefit to farmers, and help to reduceenvironmental pollution associated with the excessive use of nitrogen fertilizers [4,5]. Wheat breedersacknowledge the need to raise yield potential while decreasing the environmental impact of fertilizersby developing N-efficient genotypes [6]. The higher yield levels achieved during the green revolutionwere mainly due to the increased harvest index and the use of nitrogenous fertilizers. Furthermore,to increase the grain yield of wheat crop, the aboveground biomass should be increased withoutcompromising the harvest index. This implies an additional requirement of nitrogen (N) to support theincreased photosynthesis and biomass production [7,8].
The N use-efficiency can be defined as the grain dry matter yield divided by the supply ofavailable N from the soil and fertilizer [9]. The existence of genotype × nitrogen supply interaction fornitrogen use-efficiency could be exploited to develop high N use efficient genotypes [10–13]. However,genotypes that perform well under optimal and/or high nitrogen conditions might not perform wellunder low N conditions. Therefore, selection under low as well as high N environments is of paramountimportance to identify high nitrogen use-efficient and/or tolerant wheat genotypes, with the potentialto perform well under both high and low N conditions. The characterization of traits contributing toimproved nitrogen use-efficiency could be an important resource to the breeding community across theglobe [5,11,12]. Earlier studies conducted at different nitrogen levels indicated that genetic progresshad been achieved under both high and low N conditions, but that the rate of genetic progress washigher for the former [4,14]. Genetic studies in wheat indicated the existence of variability for nitrogenuse efficiency in terms of N uptake as well as N utilization efficiency [4,11,14,15]. Once the traits thatimprove the efficiency of genotypes to give stable and superior performance under low N conditionsare identified, it is necessary to quantify the magnitude and direction of correlation with grain yieldand yield components traits. The concept of genetic correlation between other traits and yield hasbeen reported in wheat [15–17], which enable breeders to select efficient genotypes under low inputconditions through indirect selection. Heritability within each production system and the magnitudeof genotype × production system interactions are very important when comparing direct or indirectselection strategies for low N input farming systems [18].
Various selection indices (SSI, GMP, YSI and TOL) under stress and non-stress environments havebeen reported for the identification of tolerant genotypes. The SSI relies on identifying only thosegenotypes which show minimum reduction under stress compared to non-stress environments [19].Thus, the SSI helps us to identify tolerant genotypes under stress conditions, but it may fail to identifygenotypes with both high yield and stress tolerance. YSI is the other yield-based method of evaluatingthe stability of genotype under both stress and non-stress conditions [20]. The various selection indicesare based on either the tolerance or susceptibility of genotypes, and have been reported in wheat [21,22].The development of high nitrogen use-efficient wheat genotypes would be both an economical and anenvironmentally-friendly approach. Therefore, it is necessary to develop genotypes with high yieldpotential and better disease resistance coupled with high nitrogen use-efficiency. The identificationof tolerant genotypes under low N conditions through various selection indices is both a timely andefficient approach for the development of high nitrogen use efficient genotypes in different breedingprograms across the globe.
Therefore, the present study aimed: (1) To identify the tolerant genotypes under low N conditionsby different selection indices (TOL, SSI, GMP and YSI), and their physiological basis of tolerance to lowN stress. (2) To estimate the effects of low N on grain yield, yield components, and physiological traits.(3) To identify the most consistent selection index under low N conditions. (4) To estimate correlationsof different kinds of yield-based selection indices, yield components, and physiological traits withgrain yield under high and low N conditions.
Agronomy 2020, 10, 417 3 of 17
2. Materials and Methods
2.1. Plant Materials and Field Experiments
The field experiments were conducted at research farm of the ICAR-Indian Institute of Wheatand Barley Research, Karnal (29◦43′ N, 76◦48′ E, 245 m ASL), India in 2014 and 2015. The previouscrop was rice in both years. A set of 36 elite wheat cultivars were evaluated under both high N(HN) and low N (LN) field conditions to identify the better performing cultivars in low N conditions.The experimental material of the present study is a representative set of the most widely grown cultivarsin the major wheat growing regions, and most of the genotypes are selections from CIMMYT material.All the selected cultivars were semi-dwarf except for two (KH 65 and BH 1146). Out of 36 cultivars,32 belong to bread wheat, while the remaining four were durum wheat cultivars (MACS 2496, MACS3125, HI 8498 and PDW 314). The information regarding the pedigree, year of release, and other detailsof the 36 tested wheat cultivars is given in Table 1. Each cultivar was planted in a four-row plot of2.5 m length, maintaining a row spacing of 23 cm and 10 cm between plants within a row, followinga randomized complete block design with three replications. The sowing of both the experiments(high and low N) was done in the second fortnight of November, and harvesting in the months ofApril–May during both the 2014 and 2015 seasons. The experimental field was prepared, and seed wasplaced manually in the furrows.
Table 1. List of wheat cultivars used in field trials under high and low N conditions in 2014 and 2015.
Sr. No. Variety Pedigree Year ofRelease
ProductionCondition
1 DPW 621-50 KAUZ//ALTAR84/AOS/3/MILAN/KAUZ/4/HUITES 2011 TS, IR
In the present study, two level of N fertilizer treatment, i.e., high and low N, were applied.For the high N fertilizer, N amount was estimated according to previous knowledge of the field, takinginto consideration the soil N availability. The soil type of the experimental field was sandy loam and theorganic matter content was 0.57%, whereas the residual N of the field was 150 kg/ha. In the high N (HN)experiment, the dose of N:P:K fertilizers was applied in the ratio of 150:60:40 per hectare as granules ofurea, triple super phosphate (TSP), and muriate of potash (MOP), respectively. The full dose of P andK, and 1/2 N fertilizers was applied as a basal dose at the time of field preparation, and the remaining1/2N was top dressed in two splits at the crown root initiation stage (CRI), i.e., at 21 days after sowing(DAS), and the booting stage. i.e., at 45 DAS. In the low N (LN) experiment, the recommended dosesof P and K fertilizers and zero N were applied at the time of field preparation. In each year, the cropwas irrigated at an interval of 21 days, typically at four stages (CRI, booting, pre-heading and grainfilling stages) or when irrigation was needed to avoid water stress. Standard agronomic practices werefollowed to raise the healthy crop. The crop was harvested above ground level carefully at maturity asfull plot size for each cultivars (100% dry matter above ground level used as total biological yield) inboth high and low N conditions in both years, and threshed using a power threshing machine.
2.2. Phenotypic Evaluation of Yield, Yield Components, and Physiological Traits
Observations were recorded on plant height (PH), fertile shoots m−1 (FS), 1000-kernel weight(TKW), grain number/spike (GNPS), grain weight/spike (GWPS), biological yield/plot (BY), harvestindex (HI), and grain yield/plot (GY) under high and low N conditions. Plant height (cm) was measuredfrom base of soil surface to tip of spike excluding awns of five randomly selected plants from each plot.Fertile shoots/m (tillers with fully fertile spike) were counted from one meter-long segment of a singlerow of four row plots from each genotype. A random sample of 1000 grains was counted with the helpof automatic seed counter from each plot, weighed in a weighing balance, and recorded as TKW (g).Grain number/spike (five spikes selected randomly, harvested, threshed in bulk, and total grains offive spikes was counted using a seed counter and averaged to get the grain number/spike). Five spikeswere selected randomly, harvested, threshed in bulk and weight by weighing balance, and averaged to
Agronomy 2020, 10, 417 5 of 17
get grain weight/spike. Total grain yield/plot is divided by a total biological yield/plot and multipliedby 100 to obtain the harvest index. Biological yield/plot was measured as total dry matter harvestedabove ground level from the four-row plot of 2.5m length, and grain yield as the total grains harvestedfrom the same.
Three observations were recorded for the physiological traits, viz., normalized difference vegetationindex (NDVI), canopy temperature (CT), chlorophyll content (CHL), ratio of variable fluorescenceand maximum fluorescence (FV/FM), ratio of variable fluorescence and initial fluorescence (FV/FO)in both high N and low N conditions at 50% heading stage between 11AM to 2PM, when thetemperature is maximum during the day. FV/FM and FV/FO were recorded with Opti sciences (OS-30p),CHL was recorded with SPAD-502plus, NDVI with Green seeker trembler, and CT with the help ofHTC MT4 instrument.
2.3. Evaluation of Various Yield Based Selection Indices
To identify the best performing genotypes under stress condition, several yield-based selectionindices have been proposed on the basis of mathematical relationships between stress and normalconditions [23]. In the present study, four kinds of yield-based selection indices viz., tolerance index(TOL), stress susceptibility index (SSI), geometric mean productivity (GMP), and yield stability index(YSI), were used to identify the tolerant genotypes and/or best performing genotypes under HN andLN conditions in wheat.
1. Percentage reduction of grain yield (PRGY) = (Yield under high N − Yield under low N)/Yieldunder high N × 100 [24].
2. Tolerance index (TOL) = (Yp − Ys) [25].3. Stress susceptible index (SSI) = (1 − Ys/Yp)/SI [19]. Where Stress intensity (SI) was calculated as
1 − (Xs/Xp) and SSI value < 1 is more resistant to stress condition4. Geometric mean productivity (GMP) = (Ys × Yp)0.5 [26].5. Yield Stability Index (YSI) = Ys/Yp [20]. Where Yp and Ys are the grain yield of a cultivar under
high N and low N conditions, respectively. The Xp and Xs represents mean grain yield of allcultivars under high N and low N conditions, respectively.
2.4. Statistical Analysis
The data was subjected to combined analysis of variance (ANOVA) using GenStat 18th Edition(VSN International Ltd., Hemel Hempstead, UK). The estimates of genetic variability and biplotprocedures for genetic correlation coefficients among yield components, selection indices, and also withgrain yield under both high N and low N conditions were calculated with adjusted mean. The biplotswere generated from the first two PCAs, without scaling, centering (2), or singular value partitioning(SVP) (2) using the factoextra R package. In the PCA biplot, a vector drawn from the origin to each traitfacilitates the visualization of interrelationships among traits. The vector length of the trait measuresthe magnitude of its effects on the yield. The polygon view of the GT biplot allowed us to visualize theinteraction pattern between genotypes and traits, as long as the biplot provides a sufficient amount oftotal variation. The correlation coefficient between any two traits is approximated by the cosine of theangle between their vectors. On this premise, two traits are positively correlated if the angle betweentheir vectors is an acute angle (<90◦), while they are negatively correlated if their vectors are an obtuseangle (>90◦) [27].
3. Results
3.1. Analysis of Variance and Genotype × Year Interaction
The pooled analysis of variance is presented in Table 2. The genotype effect is significant for allthe studied traits, whereas genotype × year effect was significant for all the studied traits except GWPS,
Agronomy 2020, 10, 417 6 of 17
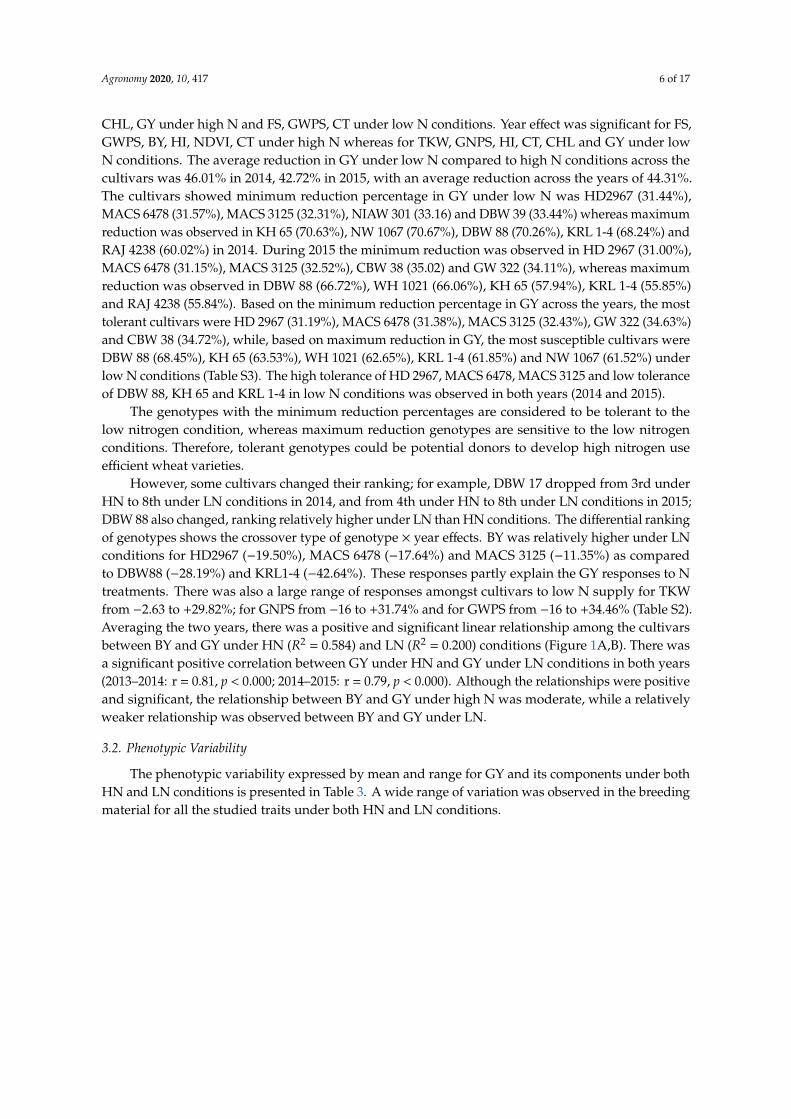
CHL, GY under high N and FS, GWPS, CT under low N conditions. Year effect was significant for FS,GWPS, BY, HI, NDVI, CT under high N whereas for TKW, GNPS, HI, CT, CHL and GY under lowN conditions. The average reduction in GY under low N compared to high N conditions across thecultivars was 46.01% in 2014, 42.72% in 2015, with an average reduction across the years of 44.31%.The cultivars showed minimum reduction percentage in GY under low N was HD2967 (31.44%),MACS 6478 (31.57%), MACS 3125 (32.31%), NIAW 301 (33.16) and DBW 39 (33.44%) whereas maximumreduction was observed in KH 65 (70.63%), NW 1067 (70.67%), DBW 88 (70.26%), KRL 1-4 (68.24%) andRAJ 4238 (60.02%) in 2014. During 2015 the minimum reduction was observed in HD 2967 (31.00%),MACS 6478 (31.15%), MACS 3125 (32.52%), CBW 38 (35.02) and GW 322 (34.11%), whereas maximumreduction was observed in DBW 88 (66.72%), WH 1021 (66.06%), KH 65 (57.94%), KRL 1-4 (55.85%)and RAJ 4238 (55.84%). Based on the minimum reduction percentage in GY across the years, the mosttolerant cultivars were HD 2967 (31.19%), MACS 6478 (31.38%), MACS 3125 (32.43%), GW 322 (34.63%)and CBW 38 (34.72%), while, based on maximum reduction in GY, the most susceptible cultivars wereDBW 88 (68.45%), KH 65 (63.53%), WH 1021 (62.65%), KRL 1-4 (61.85%) and NW 1067 (61.52%) underlow N conditions (Table S3). The high tolerance of HD 2967, MACS 6478, MACS 3125 and low toleranceof DBW 88, KH 65 and KRL 1-4 in low N conditions was observed in both years (2014 and 2015).
The genotypes with the minimum reduction percentages are considered to be tolerant to thelow nitrogen condition, whereas maximum reduction genotypes are sensitive to the low nitrogenconditions. Therefore, tolerant genotypes could be potential donors to develop high nitrogen useefficient wheat varieties.
However, some cultivars changed their ranking; for example, DBW 17 dropped from 3rd underHN to 8th under LN conditions in 2014, and from 4th under HN to 8th under LN conditions in 2015;DBW 88 also changed, ranking relatively higher under LN than HN conditions. The differential rankingof genotypes shows the crossover type of genotype × year effects. BY was relatively higher under LNconditions for HD2967 (−19.50%), MACS 6478 (−17.64%) and MACS 3125 (−11.35%) as comparedto DBW88 (−28.19%) and KRL1-4 (−42.64%). These responses partly explain the GY responses to Ntreatments. There was also a large range of responses amongst cultivars to low N supply for TKWfrom −2.63 to +29.82%; for GNPS from −16 to +31.74% and for GWPS from −16 to +34.46% (Table S2).Averaging the two years, there was a positive and significant linear relationship among the cultivarsbetween BY and GY under HN (R2 = 0.584) and LN (R2 = 0.200) conditions (Figure 1A,B). There wasa significant positive correlation between GY under HN and GY under LN conditions in both years(2013–2014: r = 0.81, p < 0.000; 2014–2015: r = 0.79, p < 0.000). Although the relationships were positiveand significant, the relationship between BY and GY under high N was moderate, while a relativelyweaker relationship was observed between BY and GY under LN.
3.2. Phenotypic Variability
The phenotypic variability expressed by mean and range for GY and its components under bothHN and LN conditions is presented in Table 3. A wide range of variation was observed in the breedingmaterial for all the studied traits under both HN and LN conditions.
Agronomy 2020, 10, 417 7 of 17
Table 2. Combined analysis of variance for yield and its attributes in 36 wheat cultivars grown under high N and low N conditions in 2014 and 2015.
Source ofVariation
df EnvironmentMean Sum of Square (MSS)
PH (cm) FS TKW (g) GNPS GWPS BY (g) HI (%) NDVI CT CHL (%) FV/FM FV/FO GY (g)
KRL 1-4 (55.85%) and RAJ 4238 (55.84%). Based on the minimum reduction percentage in GY across
the years, the most tolerant cultivars were HD 2967 (31.19%), MACS 6478 (31.38%), MACS 3125
(32.43%), GW 322 (34.63%) and CBW 38 (34.72%), while, based on maximum reduction in GY, the
most susceptible cultivars were DBW 88 (68.45%), KH 65 (63.53%), WH 1021 (62.65%), KRL 1-4
(61.85%) and NW 1067 (61.52%) under low N conditions (Table S3). The high tolerance of HD 2967,
MACS 6478, MACS 3125 and low tolerance of DBW 88, KH 65 and KRL 1-4 in low N conditions was
observed in both years (2014 and 2015).
The genotypes with the minimum reduction percentages are considered to be tolerant to the low
nitrogen condition, whereas maximum reduction genotypes are sensitive to the low nitrogen
conditions. Therefore, tolerant genotypes could be potential donors to develop high nitrogen use
efficient wheat varieties.
However, some cultivars changed their ranking; for example, DBW 17 dropped from 3rd under
HN to 8th under LN conditions in 2014, and from 4th under HN to 8th under LN conditions in 2015;
DBW 88 also changed, ranking relatively higher under LN than HN conditions. The differential
ranking of genotypes shows the crossover type of genotype × year effects. BY was relatively higher
under LN conditions for HD2967 (−19.50%), MACS 6478 (−17.64%) and MACS 3125 (−11.35%) as
compared to DBW88 (−28.19%) and KRL1-4 (−42.64%). These responses partly explain the GY
responses to N treatments. There was also a large range of responses amongst cultivars to low N
supply for TKW from −2.63 to +29.82%; for GNPS from −16 to +31.74% and for GWPS from −16 to
+34.46% (Table S2). Averaging the two years, there was a positive and significant linear relationship
among the cultivars between BY and GY under HN (R2 = 0.584) and LN (R2 = 0.200) conditions (Figure
1A,B). There was a significant positive correlation between GY under HN and GY under LN
conditions in both years (2013–2014: r = 0.81, p < 0.000; 2014–2015: r = 0.79, p < 0.000). Although the
relationships were positive and significant, the relationship between BY and GY under high N was
moderate, while a relatively weaker relationship was observed between BY and GY under LN.
Figure 1. Relationship between grain yield (GY) and biological yield (BY) under LN (A) and HN (B)
among 36 wheat cultivars.
3.2. Phenotypic Variability
The phenotypic variability expressed by mean and range for GY and its components under both
HN and LN conditions is presented in Table 3. A wide range of variation was observed in the
breeding material for all the studied traits under both HN and LN conditions.
GY
BY
GY
BY A B
Figure 1. Relationship between grain yield (GY) and biological yield (BY) under LN (A) and HN (B) among 36 wheat cultivars.
Agronomy 2020, 10, 417 8 of 17
Table 3. Mean, range and reduction percentage of yield and its attributes in 36 wheat cultivars grown under high nitrogen and low nitrogen conditions in 2014and 2015.
Year Conditions PH (cm) FS TKW (g) GNPS GWPS BY (g) HI (%) NDVI CT CHL (%) FV/FM FV/FO GY (g)
3.3. Yield Performance under High N and Low N Conditions
The grain yields of all 36 wheat cultivars under HN and LN conditions are presented (Table S3).Based on yields during in 2014, the top five highest yielding cultivars under HN conditions were DPW621-50, followed by MACS 6478, MACS 3125, HD 2967 and DBW 17, whereas KH 65, MACS 2496,KRL 19, KRL 1-4 and DBW 14 were five lowest yielding cultivars. Under LN condition, the five highestyielding cultivars were DPW 621-50, followed by MACS 6478, MACS 3125, HD 2967 and DBW 39,whereas the five lowest yielding cultivars were KH 65, followed by KRL 1-4, DBW 88, NW 1067 andMACS 2496. In 2015, five highest yielding cultivars under HN conditions were DPW 621-50, followedby MACS 6478, MACS 3125, HD 2967 and BH 1146, whereas KH 65, followed by KRL 19, GW 322,WH 1021 and MACS 2496 were five lowest yielding cultivars. Under LN condition, DPW 621-50,followed by MACS 6478, MACS 3125, DBW 17 and BH 1146, whereas the lowest yielding cultivarswere KH 65, followed by WH 1021, DBW 88, KRL 1-4, Raj 4238, KRL 19, GW 322, and MACS 2496.The best performing cultivars were DPW 621-50, MACS 3125, DBW 17, MACS 6478, and BH 1146under HN condition, whereas DPW 621-50, MACS 6478, MACS 3125, HD 2967 and BH 1146 underLN conditions. Cultivars DPW 621-50, followed by MACS 6478, MACS 3125 and BH 1146 were bestperforming cultivars with respect to GY under both conditions (HN and LN) in both years.
3.4. Correlation Studies
Correlation coefficients were estimated between grain yield, yield components, and physiologicaltraits under both HN and LN conditions (Figures 2 and 3, Table S4). Significant and positive correlationswere recorded for TKW, GWPS, BY, HI, NDVI, and CHL with GY under both HN and LN conditions inboth years, except HI (Table S5). Two physiological traits, viz., FV/FM and FV/FO, were significantly andpositively correlated with GY under HN condition, whereas negatively correlated with GY under LNconditions in both years. The GNPS had positive and significant correlation with GY under HN whereasit had positive but non-significant correlation with GY under LN conditions in both years (Table S5).
Agronomy 2020, 10, x FOR PEER REVIEW 9 of 17
3.3.Yield Performance under High N and Low N Conditions
The grain yields of all 36 wheat cultivars under HN and LN conditions are presented (Table S3).
Based on yields during in 2014, the top five highest yielding cultivars under HN conditions were
DPW 621-50, followed by MACS 6478, MACS 3125, HD 2967 and DBW 17, whereas KH 65, MACS
2496, KRL 19, KRL 1-4 and DBW 14 were five lowest yielding cultivars. Under LN condition, the five
highest yielding cultivars were DPW 621-50, followed by MACS 6478, MACS 3125, HD 2967 and
DBW 39, whereas the five lowest yielding cultivars were KH 65, followed by KRL 1-4, DBW 88, NW
1067 and MACS 2496.In 2015, five highest yielding cultivars under HN conditions were DPW 621-50,
followed by MACS 6478, MACS 3125, HD 2967 and BH 1146, whereas KH 65, followed by KRL 19,
GW 322, WH 1021 and MACS 2496 were five lowest yielding cultivars. Under LN condition, DPW
621-50, followed by MACS 6478, MACS 3125, DBW 17 and BH 1146, whereas the lowest yielding
cultivars were KH 65, followed by WH 1021, DBW 88, KRL 1-4, Raj 4238, KRL 19, GW 322, and MACS
2496. The best performing cultivars were DPW 621-50, MACS 3125, DBW 17, MACS 6478, and BH
1146 under HN condition, whereas DPW 621-50, MACS 6478, MACS 3125, HD 2967 and BH 1146
under LN conditions. Cultivars DPW 621-50, followed by MACS 6478, MACS 3125 and BH 1146 were
best performing cultivars with respect to GY under both conditions (HN and LN) in both years.
3.4. Correlation Studies
Correlation coefficients were estimated between grain yield, yield components, and
physiological traits under both HN and LN conditions (Figures 2 and 3, Table S4). Significant and
positive correlations were recorded for TKW, GWPS, BY, HI, NDVI, and CHL with GY under both
HN and LN conditions in both years, except HI (Table S5). Two physiological traits, viz., FV/FM and
FV/FO, were significantly and positively correlated with GY under HN condition, whereas negatively
correlated with GY under LN conditions in both years. The GNPS had positive and significant
correlation with GY under HN whereas it had positive but non-significant correlation with GY under
LN conditions in both years (Table S5).
Figure 2. Phenotypic correlation between grain yield (GY) and its component traits under HN (A) and
LN (B) in 2014 among 36 wheat cultivars.
A B
Figure 2. Phenotypic correlation between grain yield (GY) and its component traits under HN (A) andLN (B) in 2014 among 36 wheat cultivars.
Agronomy 2020, 10, 417 10 of 17Agronomy 2020, 10, x FOR PEER REVIEW 10 of 17
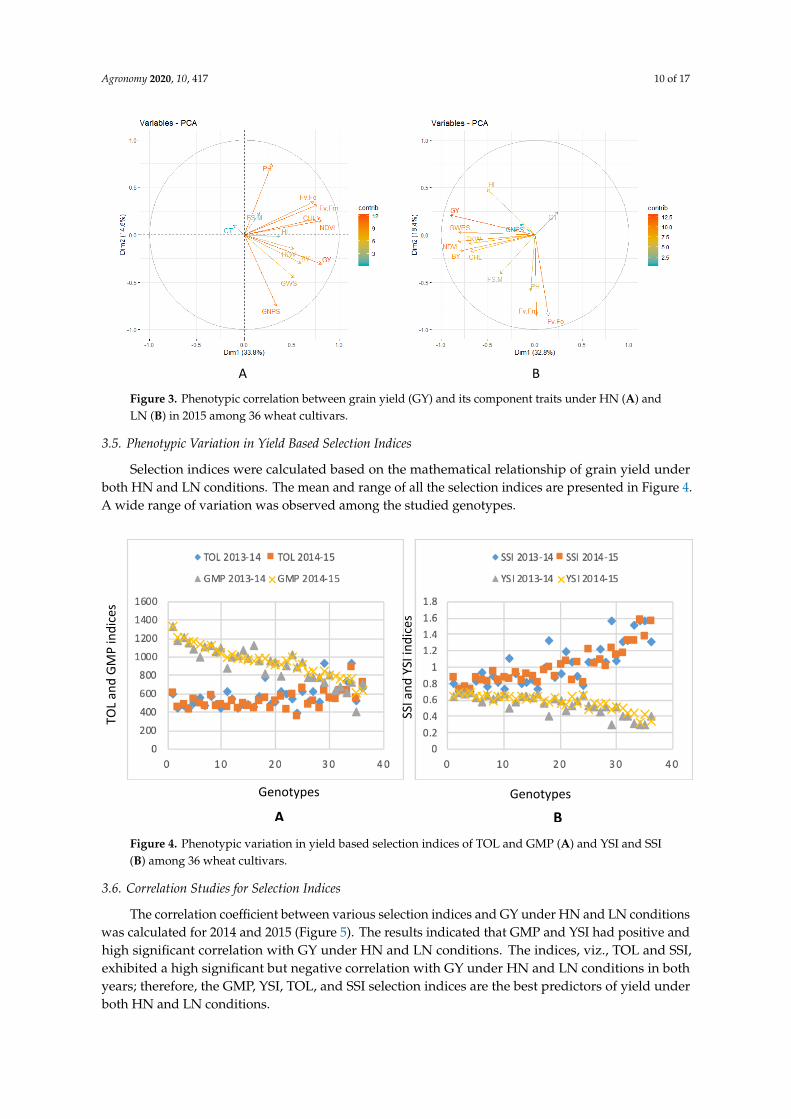
Figure 3. Phenotypic correlation between grain yield (GY) and its component traits under HN (A) and
LN (B) in 2015 among 36 wheat cultivars.
2.5.Phenotypic Variation in Yield Based Selection Indices
Selection indices were calculated based on the mathematical relationship of grain yield under
both HN and LN conditions. The mean and range of all the selection indices are presented in Figure
4. A wide range of variation was observed among the studied genotypes.
Figure 4. Phenotypic variation in yield based selection indices of TOL and GMP (A) and YSI and SSI
(B) among 36 wheat cultivars.
3.6. Correlation Studies for Selection Indices
The correlation coefficient between various selection indices and GY under HN and LN
conditions was calculated for 2014 and 2015 (Figure 5). The results indicated that GMP and YSI had
positive and high significant correlation with GY under HN and LN conditions. The indices, viz.,
TOL and SSI, exhibited a high significant but negative correlation with GY under HN and LN
conditions in both years; therefore, the GMP, YSI, TOL, and SSI selection indices are the best
predictors of yield under both HN and LN conditions.
A B
TOL
and
GM
P in
dic
es
SSI a
nd
YSI
ind
ices
Genotypes Genotypes
A B
Figure 3. Phenotypic correlation between grain yield (GY) and its component traits under HN (A) andLN (B) in 2015 among 36 wheat cultivars.
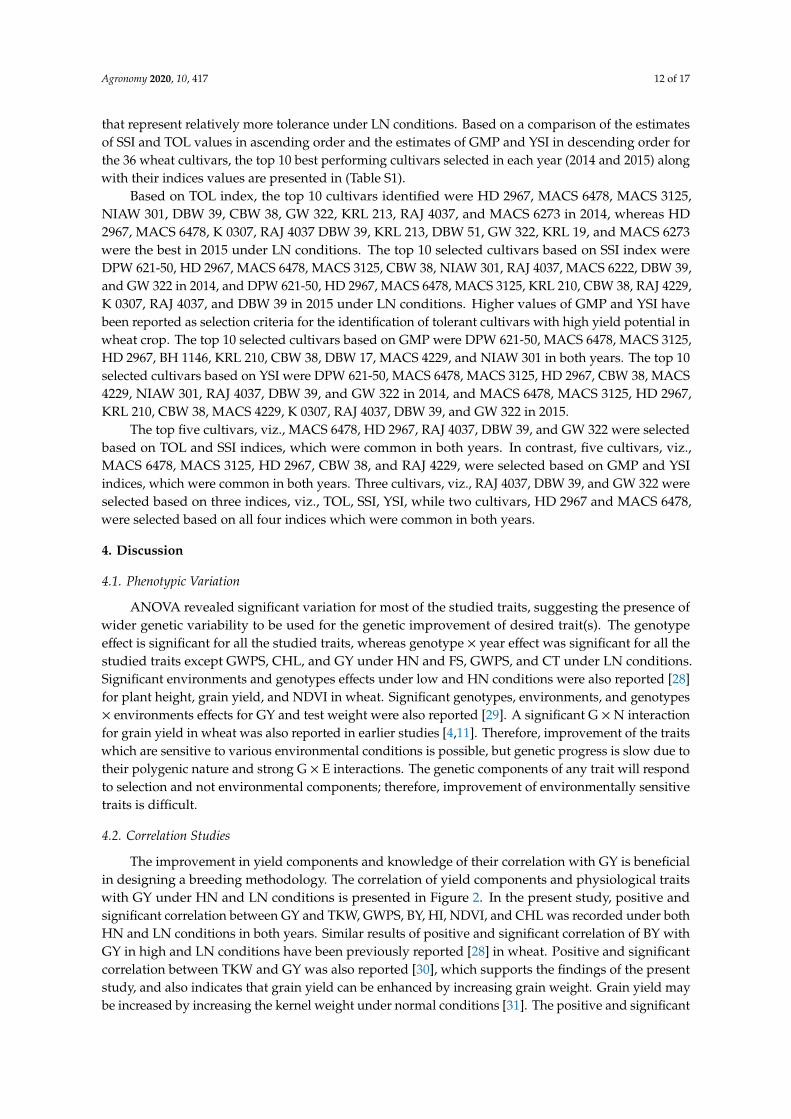
3.5. Phenotypic Variation in Yield Based Selection Indices
Selection indices were calculated based on the mathematical relationship of grain yield underboth HN and LN conditions. The mean and range of all the selection indices are presented in Figure 4.A wide range of variation was observed among the studied genotypes.
Agronomy 2020, 10, x FOR PEER REVIEW 10 of 17
Figure 3. Phenotypic correlation between grain yield (GY) and its component traits under HN (A) and
LN (B) in 2015 among 36 wheat cultivars.
2.5.Phenotypic Variation in Yield Based Selection Indices
Selection indices were calculated based on the mathematical relationship of grain yield under
both HN and LN conditions. The mean and range of all the selection indices are presented in Figure
4. A wide range of variation was observed among the studied genotypes.
Figure 4. Phenotypic variation in yield based selection indices of TOL and GMP (A) and YSI and SSI
(B) among 36 wheat cultivars.
3.6. Correlation Studies for Selection Indices
The correlation coefficient between various selection indices and GY under HN and LN
conditions was calculated for 2014 and 2015 (Figure 5). The results indicated that GMP and YSI had
positive and high significant correlation with GY under HN and LN conditions. The indices, viz.,
TOL and SSI, exhibited a high significant but negative correlation with GY under HN and LN
conditions in both years; therefore, the GMP, YSI, TOL, and SSI selection indices are the best
predictors of yield under both HN and LN conditions.
A B
TOL
and
GM
P in
dic
es
SSI a
nd
YSI
ind
ices
Genotypes Genotypes
A B
Figure 4. Phenotypic variation in yield based selection indices of TOL and GMP (A) and YSI and SSI(B) among 36 wheat cultivars.
3.6. Correlation Studies for Selection Indices
The correlation coefficient between various selection indices and GY under HN and LN conditionswas calculated for 2014 and 2015 (Figure 5). The results indicated that GMP and YSI had positive andhigh significant correlation with GY under HN and LN conditions. The indices, viz., TOL and SSI,exhibited a high significant but negative correlation with GY under HN and LN conditions in bothyears; therefore, the GMP, YSI, TOL, and SSI selection indices are the best predictors of yield underboth HN and LN conditions.
Agronomy 2020, 10, 417 11 of 17Agronomy 2020, 10, x FOR PEER REVIEW 11 of 17
Figure 5. Phenotypic correlation between grain yield (GY) and selection indices during 2014 (A) and
2015 (B) under LN conditions among 36 wheat cultivars.
3.7. Consistency of the Stress Tolerance Indices
The genetic correlation coefficients between GY and yield-based tolerance indices were
determined for both years (Table 4). Highly significant correlations were recorded for all the indices,
viz., TOL, SSI, GMP, and YSI, indicating the consistency of correlation among the observed selection
indices across the years. Kendall’s coefficient of concordance (W) and discordance (1-W) and
Friedman’s chi-square statistic were used to test the significance for consistency of mean yields and
stress tolerance indices (Table 5). The W values varied from 0.200 (TOL) to 0.778 (GMP) among the
indices. Apart from GMP, the W values for YSI were also shown to be high, whereas the SSI and TOL
indices recorded low values. The consistency of the GMP selection index was found to be highest
(0.778), followed by those of YSI (0.556), SSI (0.472) and TOL (0.200).
Table 4. Phenotypic correlation between yield-based selection indices measured for both years under
*Significance at 5% (p = 0.05); ** Significance at 1% (p = 0.01).
Table 5. Kendall’s coefficient of concordance (W) and discordance (1-W) and significance test for
various selection indices for 2014/2015 in 36 wheat cultivars.
Statistics High N (Yp) Low N (Ys) TOL SSI GMP YSI
W 0.750 0.611 0.200 0.472 0.778 0.556
1-W 0.250 0.389 0.800 0528 0.222 0.444
Friedman’s χ2 test 27.0 22.0 7.2 14.0 28.0 20.0
p value 0.000 0.000 0.007 0.000 0.000 0.000
3.8.Identification of Promising Cultivarsbased on Selection Indices
It was observed that the correlation between various selection indices was significant under HN
and LN conditions in both years, indicating that these selection indices could be utilized to select
tolerant cultivars under LN and HN conditions. Considering tolerance or sensitivity equations, larger
A B
Figure 5. Phenotypic correlation between grain yield (GY) and selection indices during 2014 (A) and2015 (B) under LN conditions among 36 wheat cultivars.
3.7. Consistency of the Stress Tolerance Indices
The genetic correlation coefficients between GY and yield-based tolerance indices were determinedfor both years (Table 4). Highly significant correlations were recorded for all the indices, viz., TOL, SSI,GMP, and YSI, indicating the consistency of correlation among the observed selection indices acrossthe years. Kendall’s coefficient of concordance (W) and discordance (1-W) and Friedman’s chi-squarestatistic were used to test the significance for consistency of mean yields and stress tolerance indices(Table 5). The W values varied from 0.200 (TOL) to 0.778 (GMP) among the indices. Apart from GMP,the W values for YSI were also shown to be high, whereas the SSI and TOL indices recorded low values.The consistency of the GMP selection index was found to be highest (0.778), followed by those of YSI(0.556), SSI (0.472) and TOL (0.200).
Table 4. Phenotypic correlation between yield-based selection indices measured for both years underLN conditions.
* Significance at 5% (p = 0.05); ** Significance at 1% (p = 0.01).
Table 5. Kendall’s coefficient of concordance (W) and discordance (1-W) and significance test forvarious selection indices for 2014/2015 in 36 wheat cultivars.
Statistics High N (Yp) Low N (Ys) TOL SSI GMP YSI
W 0.750 0.611 0.200 0.472 0.778 0.556
1-W 0.250 0.389 0.800 0528 0.222 0.444
Friedman’s χ2 test 27.0 22.0 7.2 14.0 28.0 20.0
p value 0.000 0.000 0.007 0.000 0.000 0.000
3.8. Identification of Promising Cultivarsbased on Selection Indices
It was observed that the correlation between various selection indices was significant under HNand LN conditions in both years, indicating that these selection indices could be utilized to selecttolerant cultivars under LN and HN conditions. Considering tolerance or sensitivity equations, largervalues for GMP and YSI would be desirable, whereas lower values would be desirable for SSI and TOL
Agronomy 2020, 10, 417 12 of 17
that represent relatively more tolerance under LN conditions. Based on a comparison of the estimatesof SSI and TOL values in ascending order and the estimates of GMP and YSI in descending order forthe 36 wheat cultivars, the top 10 best performing cultivars selected in each year (2014 and 2015) alongwith their indices values are presented in (Table S1).
Based on TOL index, the top 10 cultivars identified were HD 2967, MACS 6478, MACS 3125,NIAW 301, DBW 39, CBW 38, GW 322, KRL 213, RAJ 4037, and MACS 6273 in 2014, whereas HD2967, MACS 6478, K 0307, RAJ 4037 DBW 39, KRL 213, DBW 51, GW 322, KRL 19, and MACS 6273were the best in 2015 under LN conditions. The top 10 selected cultivars based on SSI index wereDPW 621-50, HD 2967, MACS 6478, MACS 3125, CBW 38, NIAW 301, RAJ 4037, MACS 6222, DBW 39,and GW 322 in 2014, and DPW 621-50, HD 2967, MACS 6478, MACS 3125, KRL 210, CBW 38, RAJ 4229,K 0307, RAJ 4037, and DBW 39 in 2015 under LN conditions. Higher values of GMP and YSI havebeen reported as selection criteria for the identification of tolerant cultivars with high yield potential inwheat crop. The top 10 selected cultivars based on GMP were DPW 621-50, MACS 6478, MACS 3125,HD 2967, BH 1146, KRL 210, CBW 38, DBW 17, MACS 4229, and NIAW 301 in both years. The top 10selected cultivars based on YSI were DPW 621-50, MACS 6478, MACS 3125, HD 2967, CBW 38, MACS4229, NIAW 301, RAJ 4037, DBW 39, and GW 322 in 2014, and MACS 6478, MACS 3125, HD 2967,KRL 210, CBW 38, MACS 4229, K 0307, RAJ 4037, DBW 39, and GW 322 in 2015.
The top five cultivars, viz., MACS 6478, HD 2967, RAJ 4037, DBW 39, and GW 322 were selectedbased on TOL and SSI indices, which were common in both years. In contrast, five cultivars, viz.,MACS 6478, MACS 3125, HD 2967, CBW 38, and RAJ 4229, were selected based on GMP and YSIindices, which were common in both years. Three cultivars, viz., RAJ 4037, DBW 39, and GW 322 wereselected based on three indices, viz., TOL, SSI, YSI, while two cultivars, HD 2967 and MACS 6478,were selected based on all four indices which were common in both years.
4. Discussion
4.1. Phenotypic Variation
ANOVA revealed significant variation for most of the studied traits, suggesting the presence ofwider genetic variability to be used for the genetic improvement of desired trait(s). The genotypeeffect is significant for all the studied traits, whereas genotype × year effect was significant for all thestudied traits except GWPS, CHL, and GY under HN and FS, GWPS, and CT under LN conditions.Significant environments and genotypes effects under low and HN conditions were also reported [28]for plant height, grain yield, and NDVI in wheat. Significant genotypes, environments, and genotypes× environments effects for GY and test weight were also reported [29]. A significant G × N interactionfor grain yield in wheat was also reported in earlier studies [4,11]. Therefore, improvement of the traitswhich are sensitive to various environmental conditions is possible, but genetic progress is slow due totheir polygenic nature and strong G × E interactions. The genetic components of any trait will respondto selection and not environmental components; therefore, improvement of environmentally sensitivetraits is difficult.
4.2. Correlation Studies
The improvement in yield components and knowledge of their correlation with GY is beneficialin designing a breeding methodology. The correlation of yield components and physiological traitswith GY under HN and LN conditions is presented in Figure 2. In the present study, positive andsignificant correlation between GY and TKW, GWPS, BY, HI, NDVI, and CHL was recorded under bothHN and LN conditions in both years. Similar results of positive and significant correlation of BY withGY in high and LN conditions have been previously reported [28] in wheat. Positive and significantcorrelation between TKW and GY was also reported [30], which supports the findings of the presentstudy, and also indicates that grain yield can be enhanced by increasing grain weight. Grain yield maybe increased by increasing the kernel weight under normal conditions [31]. The positive and significant
Agronomy 2020, 10, 417 13 of 17
correlation of NDVI with GY under both HN and LN conditions indicates that NDVI could be utilizedfor the enhancement of GY. The physiological traits FV/FM and FV/FO showed significant and positivecorrelation with GY under HN condition, but negative but non-significant correlation with GY underLN conditions in both years. The traits like 1000-grain weight, seed yield, and biomass have beensuccessfully utilized in breeding programs to screen wheat genotypes for their performance understress conditions [32]. The positive and significant correlation of yield component and physiologicaltraits with GY will enable breeders to select high-yielding genotypes through the indirect selection ofassociated traits under both HN and LN conditions.
4.3. Correlation Studies of Selection Indices
In the present study (Figure 3), TOL had positive correlation with GY under HN condition,while it was negatively associated with GY under LN conditions. Similar results were also observedin different studies, wherein the TOL index had positive and significant correlation with yield undernormal condition, but significant negative correlation under stress conditions in wheat [21,22,33,34].The selection based on SSI and TOL will result in increased yield under high fertility conditions asthe genotypes that are high-yielding under HN conditions suffered more yield reduction; therefore,relative value often leads to the selection of genotypes with the lowest absolute yield levels. In thepresent study, the SSI is significantly and negatively associated with yield. SSI has been utilized asa selection criterion to identify best performing genotypes under stress conditions in earlier studiesin wheat [21,22,34]. In the present study, the positive and significant correlation between GY undernormal and stress conditions corroborates earlier findings on wheat [22,29,35]. The GMP and YSIselection indices have positive and significant correlation with yield under both stress and normalconditions. A positive correlation of GMP and YSI with yield were similarly observed in previousstudies [22,35]. The indices SSI, TOL, GMP, and YSI showed a similar pattern of correlation with GYunder both HN and LN conditions in both years; therefore, either SSI or TOL, and GMP or YSI can beutilized to select tolerant cultivars for LN conditions in wheat.
4.4. Consistency of the Tolerance Indices
According to Kendall’s concordance coefficient, the consistency of the GMP selection indexwas found to be highest, followed by YSI, SSI, and TOL. Similar findings on the consistency ofselection indices have also been reported in previous studies [21,22,34,35]. The low value of Kendall’sconcordance coefficient for the TOL index was observed because of the significant difference in theTOL value for individual year. The high consistency of GMP followed by YSI and SSI could be utilizedas a selection tool in the identification of high-yielding genotypes under LN conditions.
4.5. Selection of Promising Cultivars Based on Selection Indices
To develop high-yielding wheat varieties suitable for low input (LN) conditions, the identificationof donor parents with high yield under LN conditions is of paramount importance. The cultivarsselected based on each selection indices with their indices value for LN tolerance in both years arepresented in (Table S1). HD 2967, MACS 6478, DBW 39, GW 322, KRL 213, RAJ 4037, and MACS 6273were shown to be common tolerant genotypes for LN conditions in both years based on TOL selectionindex. In contrast, the cultivars DPW 621-50, HD 2967, MACS 6478, MACS 3125, CBW 38, RAJ 4037,and DBW 39 are common tolerant genotypes based on the SSI selection index for both years. SSI wasalso used to identify stress-sensitive and tolerant genotypes [22,33,36]; it showed year to year variationfor genotypes and their ranking patterns [33].
Based on desirable values of SSI and TOL, the cultivars HD 2967, MACS 6478, DBW 39, and RAJ4037 were identified as tolerant ones under LN conditions in both years. Higher GMP and YSI valueshave been reported as selection criteria for the identification of tolerant cultivars with high yieldpotential [22]. The best cultivars were selected based on GMP are DPW 621-50, MACS 6478, MACS3125, HD 2967, BH 1146, KRL 210, CBW 38, DBW 17, MACS 4229, and NIAW 301, which were common
Agronomy 2020, 10, 417 14 of 17
in both years. The larger GMP values were also used to identify the tolerant genotypes for normal andstress conditions in wheat [22].
Tolerant cultivars selected based on YSI were MACS 6478, MACS 3125, HD 2967, CBW 38, MACS4229, RAJ 4037, DBW 39, and GW 322 YSI in both years. In contrast, five cultivars, viz., MACS 6478,MACS 3125, HD 2967, CBW 38, and RAJ 4229, were selected based on GMP and YSI indices, whichwere common in both years. Three cultivars, RAJ 4037, DBW 39, and GW 322, were selected based onthree indices (TOL, SSI, and YSI), while two, HD 2967 and MACS 6478, were selected based on all fourindices which were common in both years. Some of the cultivars (HD 2967, GW 322, and MACS 6478)which were common in different selection indices are popular mega varieties in different wheat growingregions and conditions. These varieties are highly responsive to high input (particularly nitrogen)levels; different studies of nitrogen use efficiency also support the present investigations [37]. The highyield under LN conditions of the selected genotypes could be due to a plethora of activities like efficientabsorption from soil, mobilization in the plant system, and conversion in to the sink.
Coincidentally, the common tolerant genotype (HD2967) in all four selection indices was found tobe the best candidate for physiological traits like high biological yield, NDVI, and CHL comparedto the overall population grand mean under LN conditions. Other tolerant genotypes like DBW39 were also found superior for some of the physiological traits, i.e., high BY, NDVI, Fv/Fm, andFv/Fo; RAJ 4037 showed superior performance for NDVI and Fv/Fo; MACS 6478 showed superiorperformance for CHL compared to the overall population grand mean under LN conditions. Tolerantcultivars selected based on different selection indices indicated different physiological parameters oftolerance under LN conditions.
The indices TOL, SSI, GMP, and YSI were also used to identify tolerant genotypes under normaland stress conditions in bread wheat [22] and durum wheat [34], and GMP and YSI in bread wheat [35].Therefore, the selection indices that showed highly significant and desirable correlation with GY undernormal and stress conditions are generally suitable for selecting tolerant genotypes in wheat.
The material used in the study consists of genotypes having diverse adaptation from India as wellas selection from CIMMYT material. The CIMMYT shares the material through nurseries and trialsacross the globe, and the same material is released as varieties in different countries with differentnames, even though the pedigree is same. Therefore, this study would be useful for countries wherespring wheat is important.
Nitrogen Use Efficiency (NUE) is defined as total grain yield or biomass produced per unit ofapplied N fertilizer [38]. It can be expressed as a ratio of output (total grain yield biomass, grain N,plant N) and input N in the form of fertilizers [39]. The NUE reported in cereals is about 40%, and theremaining 60% of the applied fertilizer is lost and goes on to pollute the environment [40]. Therefore,growing wheat cultivar with improved NUE will ultimately result in a reduction of excessive fertilizerinput without a reduction in yield. The importance of growing NUE genotypes has already beenemphasized [5]. NUE is a complex phenomenon involving both genetic and environmental factors.The various components of NUE are N uptakes by root, assimilation, and remobilization in the shoot.Reports in the literature suggest genetic variability in NUE in spring wheat [41]. In the present study,the nitrogen use efficient genotypes were HD 2967, DBW 39, RAJ 4037, and MACS 6478. The genotypeHD 2967 was efficient in all the four selection indices, and was also found to be superior for biologicalyield, NDVI, and CHL under LN conditions. HD 2967 was the most nitrogen use efficient genotype, asrevealed by a significant increase in root dry weight due to N-stress [37].
5. Conclusions
Thirty-six wheat cultivars were evaluated for LN tolerance in 2014 and 2015 under both HNand LN conditions. RAJ 4037, DBW 39, and GW 322 were the most tolerant common genotypesunder LN conditions based on the three selection indices (TOL, SSI and YSI), while HD 2967 andMACS 6478 were the common genotypes tolerant under LN conditions in all four selection indices(GMP, TOL, SSI and YSI). The GMP selection index was found to be the most consistent, followed by
Agronomy 2020, 10, 417 15 of 17
YSI, SSI, and TOL, which could be utilized as a selection tool in the identification of high-yieldinggenotypes under LN conditions. Three out of five tolerant genotypes were selections from CIMMYT,and might already be in cultivation in different parts of the world. Therefore, these common tolerantgenotypes identified through different selection indices could be utilized as potential donors in activebreeding programs to incorporate the LN-tolerant genes to develop high-yielding wheat varieties forLN conditions. This study also improves our understanding of the physiological basis of tolerance inhigh-yielding wheat genotypes under LN conditions. The tolerant genotype HD 2967 was found to bethe best candidate for physiological traits like high biological yield, NDVI, and CHL compared to theoverall population grand mean under LN conditions. The other tolerant genotypes like DBW 39 werealso found to be superior for some of the physiological traits, i.e., high BY, NDVI, Fv/Fm, and Fv/Fo.RAJ 4037 showed superior performance for NDVI and Fv/Fo, while MACS 6478 showed superiorperformance for CHL compared to the overall population grand mean under LN conditions.
Supplementary Materials: The following are available online at http://www.mdpi.com/2073-4395/10/3/417/s1,Table S1: Mean performance of 36 wheat genotypes for various yield based selection indices under Low Nconditions over the years (2013–2014 and 2014–2015), Table S2: Percent reduction in the mean performance ofseven yield components under low N and high N conditions over two years (2013–2014 and 2014–2015), Table S3:Percent reduction in grain yield under low N and high N conditions in 2013–2014, 2014–2015 and across the year.Table S4: Parameters of PCA for low and high N conditions during 2013–2014 and 2014–2015 for the indices.Table S5: Correlation between grain and agronomic traits under high nitrogen and low nitrogen conditions during2014 and 2015.
Author Contributions: Conceptualization, B.S.T.; Data curation, M.B. and J.S.K.; Formal analysis, M.R.B., G.K.and I.P.K.; Funding acquisition, B.S.T.; Investigation, B.S.T., P.K., V.G., G.K. and A.O.; Methodology, B.S.T., J.F.,G.S. and S.S.; Project administration, B.S.T.; Resources, G.P.S.; Software, V.G., G.K. and J.S.K.; Supervision, G.P.S.;Visualization, B.S.T.; Writing—original draft, G.S., P.K. and G.K.; Writing—review & editing, B.S.T., J.F., S.S., I.P.K.and G.P.S. All authors have read and agreed to the published version of the manuscript.
Funding: This research was funded by BBSRC/DBT/ICAR.
Acknowledgments: The authors acknowledge the financial support given by BBSRC/DBT/ICAR and also to thecooperators for providing experimental data that enabled this manuscript publication jointly.
Conflicts of Interest: The authors declare no conflict of interest.
References
1. FAO. FOASTAT, Food and Agriculture Data. 2016. Available online: http://www.fao.org/faostat (accessed on20 November 2018).
2. Hall, A.J.; Richards, R.A. Prognosis for genetic improvement of yield potential and water-limited yield ofmajor grain crops. Field Crops Res. 2013, 143, 18–33. [CrossRef]
3. Hodge, A.; Robinson, D.; Fitter, A. Are microorganisms more effective than plants at competing for nitrogen?Trends Plant Sci. 2000, 5, 304–308. [CrossRef]
4. Guarda, G.; Padovan, S.; Delogu, G. Grain yield, nitrogen use efficiency and baking quality of old andmodern Italian bread-wheat cultivars grown at different nitrogen levels. Eur. J. Agron. 2004, 2, 181–192.[CrossRef]
5. Foulkes, M.; Hawkesford, M.; Barraclough, P.; Holdsworth, M.; Kerr, S.; Kightley, S.; Shewry, P. Identifyingtraits to improve the nitrogen economy of wheat: Recent advances and future pros pects. Field Crops Res.2009, 114, 329–342. [CrossRef]
6. Swain, E.Y.; Leonidas, R.; Caroline, H.O.; Hall, G.; Chapman, R.; Almadni, M.; Elizabeth, A.S.; Kidd, J.;Carlo, L.; Julia, M. Optimizing nitrogen use efficiency in wheat and potatoes: Interactions between genotypesand agronomic practices. Euphytica 2014, 199, 119–136. [CrossRef]
7. Reynolds, M.; Foulkes, J.; Furbank, R.; Griffiths, S.; King, J.; Murchie, E.; Parry, M.; Slafer, G. Achieving yieldgains in wheat. Plant Cell Environ. 2012, 35, 1799–1823. [CrossRef] [PubMed]
8. Aisawi, K.; Reynolds, M.; Singh, R.; Foulkes, M. The physiological basis of the genetic progress in yieldpotential of CIMMYT spring wheat cultivars from 1966 to 2009. Crop Sci. 2015, 55, 1749–1764. [CrossRef]
9. Moll, R.H.; Kamprath, E.J.; Jackson, W.A. Analysis and interpretation of factors which contribute to efficiencyof nitrogen-utilization. Agron, J. 1982, 74, 562–564. [CrossRef]
10. Muurinen, S.; Slafer, G.A.; Peltonen-Sainio, P. Breeding effects on nitrogen use efficiency of spring cerealsunder northern conditions. Crop Sci. 2006, 46, 561–568. [CrossRef]
11. Barraclough, P.B.; Howarth, J.R.; Jones, J.; Lopez-Bellido, R.; Parmar, S.; Shepherd, C.E.; Hawkesford, M.J.Nitrogen efficiency of wheat: Genotypic and environmental variation and prospects for improvement.Eur. J. Agron. 2010, 33, 1–11. [CrossRef]
12. Gaju, O.; Allard, V.; Martre, P.; Snape, J.W.; Heumez, E.; LeGouis, J.; Moreau, D.; Bogard, M.; Griffiths, S.;Orford, S.; et al. Identification of traits to improve the nitrogen-use efficiency of wheat genotypes. Field CropsRes. 2011, 123, 139–152. [CrossRef]
13. Gaju, O.; Allar, V.; Martre, P.; LeGouis, J.; Moreau, D.; Bogard, M.; Hubbart, S.; Foulkes, M.J. Nitrogenpartitioning and remobilization in relation to leaf senescence, grain yield and grain nitrogen concentration inwheat cultivars. Field Crops Res. 2014, 155, 213–223. [CrossRef]
14. Brancourt-Hulmel, M.; Doussinault, G.; Lecomte, C.; Berard, P.; Le-Buanec, B.; Trottet, M. Geneticimprovement of agronomic traits of winter wheat cultivars released in France from 1946 to 1992. Crop Sci.2003, 43, 37–45. [CrossRef]
15. Cormier, F.; Faure, S.; Dubreuil, P.; Heumez, E.; Beauchene, K.; Lafarge, S.; Praud, S.; LeGouis, J.A multi-environmental study of recent breeding progress on nitrogen use efficiency in wheat (Triticumaestivum L.). Theor. Appl Genet. 2013, 126, 3035–3048. [CrossRef] [PubMed]
16. Brancourt-Hulmel, M.; Heumez, E.; Pluchard, P.; Beghin, D.; Depatureaux, C.; Giraud, A.; Le, G.J. Indirectversus direct selection of winter wheat for low-input or high-input levels. Crop Sci. 2005, 45, 1427–1431.[CrossRef]
17. Przystalski, M.; Osman, A.M.; Thiemt, E.M.; Rolland, B.; Ericson, L.; Ostergard, H.; Levy, L.; Wolfe, M.S.;Buchse, A.; Piepho, H.P.; et al. Comparing the performance of cereal varieties in organic and non-organiccropping systems in different European countries. Euphytica 2008, 16, 417–433. [CrossRef]
18. Annicchiarico, P.; Chiapparino, E.; Perenzin, M. Response of common wheat varieties to organic andconventional production systems across Italian locations and implications for selection. Field Crops Res. 2010,116, 230–238. [CrossRef]
19. Fischer, R.A.; Maurer, R. Drought resistance in spring wheat cultivars, 1. Grain yield responses. Aust. J.Agric. Res. 1978, 29, 897–912. [CrossRef]
20. Bouslama, M.; Schapaugh, W.T. Stress tolerance in soybean. Part 1: Evaluation of three screening techniquesfor heat and drought tolerance. Crop Sci. 1984, 24, 933–937. [CrossRef]
21. Sio-Se Mardeh, A.; Ahmadi, A.; Poustini, K.; Mohammadi, V. Evaluation of drought resistance indices undervarious environmental conditions. Field Crops Res. 2006, 98, 222–229. [CrossRef]
22. Singh, G.; Singh, M.K.; Tyagi, B.S.; Singh, J.B.; Kumar, P. Germplasm characterization and selection indices inbread wheat for waterlogged soils in India. Indian J. Agric. Sci. 2017, 87, 1139–1148.
23. Clarke, J.M.; Towenley-Smith, T.M.; McCaig, T.N.; Green, D.G. Growth analysis of spring wheat cultivars ofvarying drought resistance. Crop Sci. 1984, 24, 537–541. [CrossRef]
24. Choukan, R.; Taherkhani, T.; Ghannadha, M.R.; Khodarahmi, M. Evaluation of drought tolerance in grainmaize inbred lines using drought tolerance indices. Iranian J. Crop Sci. 2006, 8, 79–89.
25. Hossain, A.B.S.; Sears, A.G.; Cox, T.S.; Paulsen, G.M. Desiccation tolerance and its relationship to assimilatepartitioning in winter wheat. Crop Sci. 1990, 30, 622–627. [CrossRef]
26. Fernandez, G.C.J. Effective selection criteria for assessing plant stress tolerance. In Adaptation of Vegetablesand Other Food Crops to Temperature Water Stress; Asian Vegetable Research and Development Center: Tainan,Taiwan, 1992; pp. 257–270.
27. R Core Team. R: A Language and Environment for Statistical Computing; R Foundation for Statistical Computing:Vienna, Austria, 2013.
28. Hitz, K.; Clark, J.A.; Sanford, D.A.V. Identifying nitrogen-use efficient soft red winter wheat lines in high andlow nitrogen environments. Field Crops Res. 2017, 200, 1–9. [CrossRef]
29. Sarcevic, H.; Jukic, K.; Ikic, I.; Lovric, A. Estimation of quantitative genetic parameters for grain yield andquality in winter wheat under high and low nitrogen fertilization. Euphytica 2014, 199, 57–67. [CrossRef]
30. Singh, G.; Kulshreshtha, N.; Singh, B.N.; Setter, T.L.; Singh, M.K.; Saharan, M.S.; Tyagi, B.S.; Verma, A.;Sharma, I. Germplasm characterization, association and clustering for salinity and water logging tolerancein bread wheat (Triticum aestivum). Indian J. Agric. Sci. 2014, 84, 1102–1110.
33. Clarke, J.M.; DePauw, R.M.; Townley-Smith, T.F. Evaluation of methods for quantification of droughttolerance in wheat. Crop Sci. 1992, 32, 728–7232. [CrossRef]
34. Mohammadi, R. Efficiency of yield-based drought tolerance indices to identify tolerant genotypes in durumwheat. Euphytica 2016, 211, 71–89. [CrossRef]
36. Bansal, K.C.; Sinha, S.K. Assessment of drought resistance in 20 accessions of Triticum aestivum and relatedspecies total dry matter and grain yield stability. Euphytica 1991, 56, 7–14.
37. Nagar, C.K.; Gayatri, B.A.; Sinha, S.K.; Venkatesh, K.; Mandal, P.K. Nitrogen stress induced changes in rootsystem architecture (RSA) in diverse wheat (T. aestivum L.) genotypes at seedling stage. Wheat Barley Res.2018, 10, 93–101. [CrossRef]
38. Xu, Y.; Ma, B.; Nussinov, R. Structural and functional consequences of phosphate–arsenate substitutions inselected nucleotides: DNA, RNA, and ATP. J. Phys. Chem. 2012, 116, 4801–4811. [CrossRef]
39. Pathak, R.R.; Ahmad, A.; Lochab, S.; Raghuram, N. Molecular physiology of plant nitrogen use efficiencyand biotechnological options for its enhancement. Curr. Sci. 2008, 94, 1394–1403.
40. Raghuram, N.; Sachdev, M.S.; Abrol, Y.P. Towards an integrative understanding of reactive nitrogen.Agric. Nitrogen Use Environ. Implic. 2007, 1–6.
41. Mansour, E.; Merwad, A.M.A.; Yasin, M.A.T.; Abdul-Hamid, M.I.E.; El-Sobky, E.E.A.; Oraby, H.F. Nitrogenuse efficiency in spring wheat: Genotypic variation and grain yield response under sandy soil conditions.J. Agric. Sci. 2017, 155, 1407–1423. [CrossRef]