UNIVERSITY OF NAIROBI SCHOOL OF ENGINEERING IDENTIFICATION AND ANALYSIS OF ENERGY SAVING OPPORTUNITIES FOR REHEAT FURNACE AT DEVKI STEEL ROLLING MILLS CLEMENT LUMBASI REG. NO. F56/80243/2012 REPORT SUBMITTED IN PARTIAL FULFILLMENT FOR THE DEGREE OF MASTER OF SCIENCE IN ENERGY MANAGEMENT DEPARTMENT OF MECHANICAL AND MANUFACTURING ENGINEERING AUGUST 2016
Transcript
UNIVERSITY OF NAIROBI
SCHOOL OF ENGINEERING
IDENTIFICATION AND ANALYSIS OF ENERGY SAVING OPPORTUNITIES FOR REHEAT FURNACE AT DEVKI STEEL ROLLING MILLS
CLEMENT LUMBASI
REG. NO. F56/80243/2012
REPORT SUBMITTED IN PARTIAL FULFILLMENT FOR THE DEGREE OF MASTER OF SCIENCE IN ENERGY MANAGEMENT
DEPARTMENT OF MECHANICAL AND MANUFACTURING ENGINEERING
AUGUST 2016
ii
DECLARATION
I Clement C. Lumbasi declare that this report is my original work, and except where acknowledgements and references are made to previous work, this work has not been submitted for examination in any other University.
Signature ………………….. Date……………………
Approval by Supervisors
I confirm that the study was carried out under our supervision and has been submitted for examination with our approval as University supervisors
Prof. J.A. Nyang’aya Signature…………………..Date………….
Dr. A. Aganda Signature…………………...Date…………
iii
DEDICATION
I dedicate this work to my family for their continual love and unwavering support during the journey of learning.
iv
ACKNOWLEDGEMENT
I acknowledge the support and guidance of my supervisors: Prof. J.A. Nyang’aya and Dr. Aganda who have been patient and supportive throughout this entire study.
I would also like to extend my sincere gratitude to members of the Mechanical Engineering workshop for their support and assistance during the performance of Experiments for this study.
My friend Collins Manyasi, who supported me with information I required to assist me get this study done on time.
Special acknowledgment goes to my family for their support during this entire process.
v
ABSTRACT
This study seeks to identify energy cost saving measures that if implemented can cut down on
energy consumption. In this study, the areas identified, analyzed and evaluated for energy
efficiency improvement and cost savings include; the upgrade of the damaged furnace door,
proper lagging of combustion air pipes, furnace wall and recuperator and billet preheating.
The processes in steel mills will be discussed with an emphasis on energy consumption,
current prevalent practices in the industry and potential measures for energy use and cost
savings elaborated. The results from an energy analysis at Devki steel mills Ruiru will be
presented using tables and graphs.
This study which is an energy analysis of Devki steel mills reheat furnace will be based on the
following research objective; to assess the energy efficiency of reheat furnace and analyze the
feasibility of waste heat recovery of reheat furnace. This will be achieved through
identification and quantification of energy losses through reheat furnace efficiency calculation
and the evaluation of feasibility of billet preheating by energy recovered from flue gases.
A feasibility analysis for the areas identified for improvements which are; the upgrade of the
reheat furnace door, proper lagging of recuperator, furnace wall and combustion air pipes and
billet preheating will be carried out. Data obtained will be analyzed and presented with
suitable illustration tables, charts and diagrams which will then be benchmarked with other
world class steel rolling companies. This will then be scrutinized for ways to cut energy use,
reduce waste and thereby reduce production costs.
vi
TABLE OF CONTENT
UNIVERSITY OF NAIROBI ................................................................................................. i SCHOOL OF ENGINEERING............................................................................................... i DECLARATION................................................................................................................... ii DEDICATION ..................................................................................................................... iii ACKNOWLEDGEMENT .................................................................................................... iv
5.1.1 FURNACE EFFICIENCY BY DIRECT METHOD .................................................... 34
5.1.2 FURNACE EFFICIENCY CALCULATION BY INDIRECT METHOD .................... 35
5.2 GENERAL ENERGY EFFICIENCY IMPROVEMENT MEASURES IN THE REHEAT FURNACE ........................................................................................................... 42
5.2.1 Prevention of Heat Loss through Openings .................................................................. 42
5.2.3 Upgrading furnace door ............................................................................................... 43
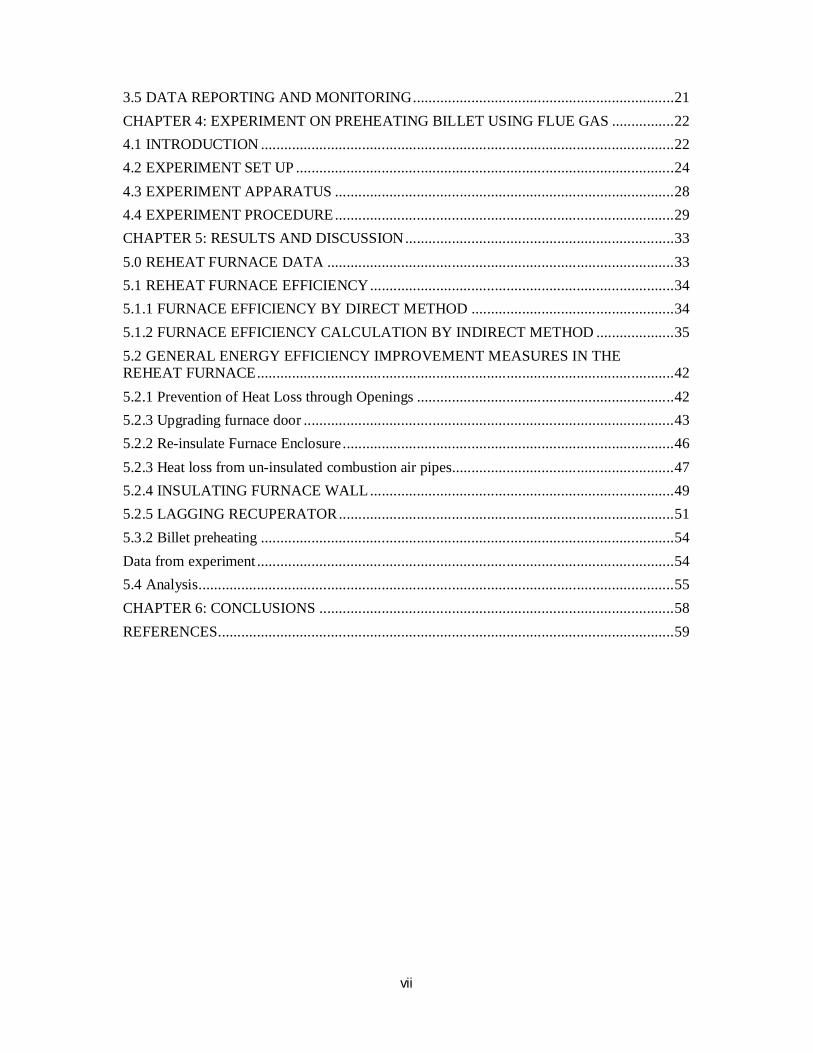
Figure 2. 1Heat losses in an industrial furnace ...................................................................... 14 Figure 3. 1Side view of Reheat furnace................................................................................. 20 Figure 4. 1 Alignment of preheating box, collecting duct and Aluminium crucible furnace ... 24 Figure 4. 2 Thermometers for temperature readings at inlet exhaust and steel billet .............. 25 Figure 4. 3 Parts of preheating box and collecting duct ......................................................... 26 Figure 4. 4 Aluminium Crucible Furnace .............................................................................. 27 Figure 4. 5 Flue gas Temperature at Entry to preheat box ..................................................... 31 Figure 4. 6 Flue Gas Exhaust Temperature Measurement...................................................... 32 Figure 5. 1 Factor for Determining the Equivalent of Heat Release from Openings to the Quantity of Heat Release from Perfect Black Body............................................................... 39 Figure 5. 2 Quantity of Heat Release at Various Temperatures ............................................. 40 Figure 5. 3 Damaged furnace door ........................................................................................ 46 Figure 5. 4 Recuperator and combustion air lines .................................................................. 49 Figure 5. 5 Recuperator not lagged ....................................................................................... 53 Figure 5. 6 Graph of Preheating Box Temperature (OC) against time (Hrs) ........................... 55
ix
LIST OF TABLES
Table 1. 1 Furnace fuel consumption ......................................................................................2 Table 2. 1 World sources of energy used in industries (2008) .................................................7 Table 3. 1 Furnace dimensions.............................................................................................. 19 Table 3. 2 Product mass of the steel billets ............................................................................ 21
Table 5. 1Temperature readings during the experiment ......................................................... 33 Table 5. 2 Temperature of sample of billets .......................................................................... 33 Table 5. 3 Furnace Efficiency ............................................................................................... 41 Table 5. 4 Heat Balance ........................................................................................................ 42 Table 5. 5 Billet measurements ............................................................................................. 54 Table 5. 6 Preheating Box Temperature Readings ................................................................. 55 Table 5. 7 Summary of the Energy saving opportunities for the Reheat furnace .................... 57
1
CHAPTER 1: INTRODUCTION
1.0 DEVKI STEEL ROLLING MILLS
Devki steel rolling Mills limited was established in 1994. The company was founded by Mr.
Narendra Raval. The company is located at Ruiru, off Thika super highway in Kiambu. The
company imports steel bars and rolls these bars into reinforcement bars and hot rolled
sections, used mainly in the construction and transport sectors.
1.1 PROCESS DESCRIPTION
According to Devki standard operation procedures for steel rolling, the company imports
billets of various sizes (120mm×120mm, 100mm×100mm) according to the best price/quality
availability. The billets are cut into 2m length. These billets are fed in two rows to the heating
area of the reheating furnace. This furnace is a batch type furnace, where billets are heated in
three sequential heating zones (preheating zone, heating zone and soaking zone). The furnace
is fired using furnace oil and combustion air is pre heated using a recuperator.
The red hot billets are pushed into a conveyor channel as they are passed through the various
heating zones in the furnace. The billets are thereafter taken to the roller for the rolling
process. During rolling, the thickness of the billets is reduced in seven steps at eight rolling
stations or sets. The rolled products are cooled down on a walking beam conveyor. Electrical
air blower fans are used from the bottom side of the walking beam conveyor to achieve the
fast cooling rate. The end products are cut as per customer requirements, products are
stretched and twisted to achieve the correct straightness and shape (Devki production report,
2010)
1.2 ENERGY SITUATION AT DEVKI
The effective use of energy in an industry is of utmost importance, this is because energy is an
integral part of the final product cost. The main objective of this study is to analyze the
feasibility of waste heat recovery from reheat furnace flue gas for preheating steel billets. At
Devki rolling mills, the main forms of energy used are fuel oil and electricity
Energy requirement is a quantitative measure of the total energy required for the manufacture
of a product, including energy used in converting materials, providing heating for the process,
conveying, lighting and so on; usually has the units of mega-joules/tone of product. Since this
is related only to the number of units used in the manufacture of a particular mass of product,
2
it can be used to make a judgment about the energy efficiency with which a product is made.
(Barret, 1996)
The table 1.0 below shows fuel consumption, production in tons and product type for August
and September for the reheat furnace. This data is necessary for determining energy
consumption per unit product, hence energy intensity.
The quantity of heat to be imparted (Q) to the stock can be found from;
Q = m×CP× (T1-T2) kcal/h … (1)
Where
Q= Quantity of heat stock in Kcal
M =Weight of the stock in Kg
CP = Mean specific heat of stock in Kcal/KgOC
T1= Final temperature of stock desired, OC
T2= Initial temperature of the stock before it enters the furnace, OC
Heat in the fuel consumed for heating the stock (kcal/h)
=
… (2)
2.10.2 Furnace efficiency by indirect method
According to bureau of energy efficiency, furnace efficiency is calculated by indirect method as follows;
1. Sensible heat loss in Flue gas
Excess air= % × %
… (3)
O2 % is the % of oxygen in the Flue gas
Theoretical air required to burn 1kg of oil= 14kg (Typical value for all fuel oil)
Total air supplied =theoretical × (1+ excess air/100)
Sensible heat loss =m×CP× (T1-T2) kcal/h
m =actual mass of air supplied/ Kg of fuel +mass of fuel (1Kg)
2. Loss due to evaporation of moisture present in fuel
% Heat loss= ×{ ( )}×
… (4)
M- Mass of moisture in 1kg of fuel oil (0.15kg/kg of fuel oil)
16
Tfg –Flue gas temperature
Tamb-Ambient temperature
3. Loss due to evaporation of water formed due to Hydrogen in Fuel
% Heat loss= × { ( )}×
… (5)
H2-kg of H2 in kg of fuel oil (0.1123kg/ kg of fuel oil)
Furnace efficiency= 100%-{(sensible heat loss in flue gas)+(loss due to evaporation of
moisture in fuel)+(loss due to evaporation of water from Hydrogen in fuel)+(heat loss due to
openings)+(heat loss through wall)}
17
CHAPTER 3: METHODOLOGY
3.1 Research Methods
This study utilizes a quantitative methodology employing a single multi-site case study, at
Devki rolling mills and University of Nairobi mechanical engineering workshop to investigate
energy cost saving opportunities in the steel rolling industry. This methodology was chosen
because it was considered the best approach to answer the research question; what are the
energy efficiency and cost saving opportunities in a steel rolling industry.
In this chapter, the process followed during the case study is outlined. Research tools, data
collection methods are also discussed. This study is based on a practical walk through and
experimentation in which energy consumption records as well as related costs are collected
and analyzed.
By undertaking an energy analysis, it was possible to analyze energy consumption data to
determine the feasibility of waste heat recovery to preheat billets. This research undertook the
following steps;
The first step was to determine energy distribution, historical energy consumption data was
collected by reviewing monthly energy bills. The next step was to identify energy losses in
the reheat furnace. The structural data for the reheat furnace was measured including reheat
furnace dimensions, opening areas and wall information.
The third step was the quantification of energy losses in the reheat furnace, production data
was collected including Flue gas temperature, furnace temperature, discharge temperature,
inside furnace temperature, opening cycle and time between charge and discharge ends during
full production.
3.2 Data Collection
In this study, three data collection methods were used namely; interviews, observation and
study of documentation.
3.2.1 Interviews
Following selection and contact with staff, two weeks were spent in separate weekly
interviews for each section. A further two weeks were spent completing follow up visits and
data collection. All staff who indicated they would like to be involved in the study was
interviewed.
18
Interviews were used to confirm saturation of the data collected; where further interviews
yielded little new knowledge until repetition from multiple sources was obtained. In this
study, structured interviews were conducted with engineering staff, production staff and
management. The focus of these interviews was on energy consumption, energy efficiency
and cost saving measures opportunities and aspects of implementation of these measures.
The interviews entailed inviting participants to reflect on and discuss their experiences with
energy management and to share the significance of these experiences to the study.
To facilitate gathering of data using this method, an open ended flexible approach to
interviewing was used rather than a totally prescriptive standardized interview format. In
addition to semi-structured interviewing, data was also collected through informal
conversations in particular; chats with participants before and after formal interview times.
Information from such conversations was written down at first opportunity, while details were
still fresh.
Interview questions on staff background included;
a. How long have staff members worked at the company
b. Where did they work before joining the company?
Interview questions on relational factors included;
a. Do staff members have access to energy bills?
b. Any energy management initiative by the company
c. Staff understanding of energy management through company trainings/seminars
d. Any energy management professionals in the company
e. Any energy saving measures in place/implemented
f. Availability of resources on energy management, energy management technology
Notes were taken during interviews and field notes kept throughout the study process. This
included description of settings, processes and operations and observations from social
interactions. At the end of each day, after interviews and observation, using brief notes, more
comprehensive notes were written.
3.2.2 Study of Documents
The study of documents involved studying Devki energy consumption records especially
records on reheat furnace oil consumption, reheat furnace manual, handbooks on furnaces,
19
company newsletters on company prospective and development plans. Data was obtained
from systematic study of the company’s official and unofficial documents.
The contents of the documents were analyzed in relation to energy management and
efficiency improvement data from interviews. This provided vital information on energy
consumption, waste heat recovery technology and trends and the company’s prospects on
energy management.
3.2.3 Observation
Observation was a valuable technique and it involved extended immersion in the operations of
a steel rolling mills company in order to discern trends, cycles, schedules and patterns in
operations as well as decipher ways of improving on the existing opportunities to save energy.
Observations were conducted in a variety of settings within the different sections and stages
of the rolling process. When interviewing was not being conducted, data was being collected
from a range of planned events such as meeting, independent research and problem solving
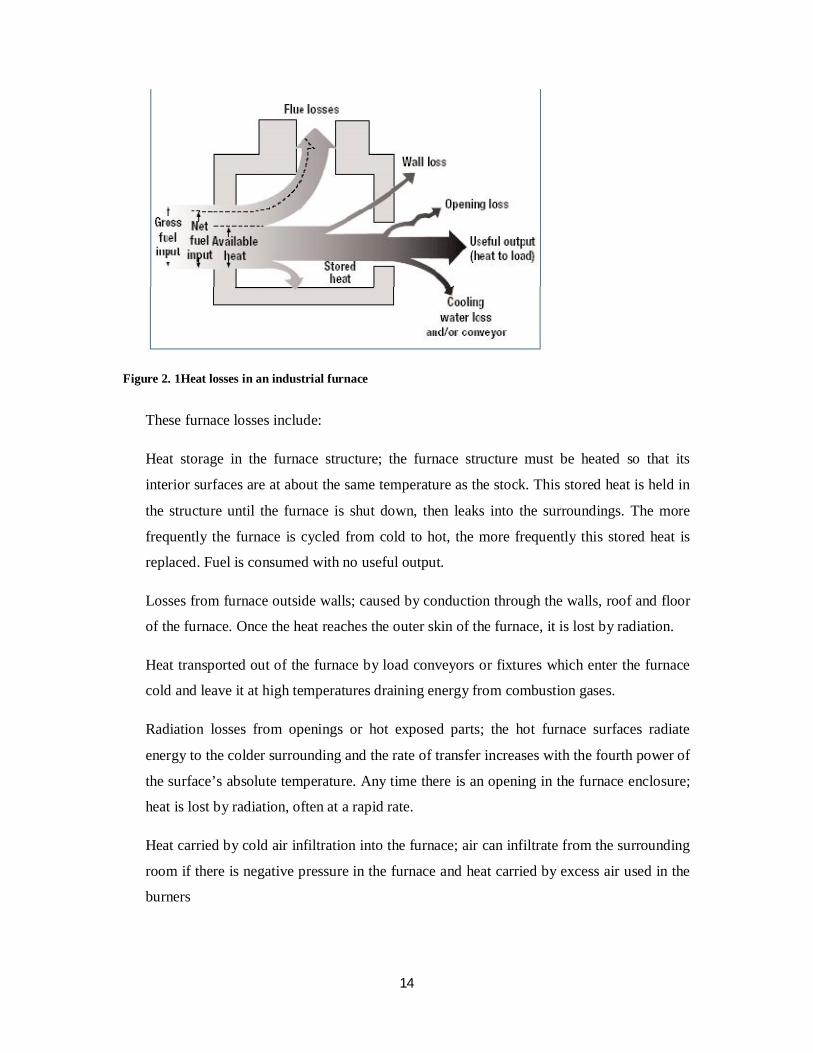
3.3 Study area
The study is at Devki steel rolling mills reheat furnaces, the energy study will include; energy
losses identification and a breakout of all energy conservation measures identified and
estimated costs.
Description of the reheat furnace
Furnace dimensions
Table 3. 1 Furnace dimensions
Section Dimensions (meters) Furnace length 8.5 Furnace width 3.2 Furnace height 2.2 Entry door 2.2×0.30 Discharge door 0.56×0.30 Wall thickness 0.56 Source: Devki records 2012
Figure 3.1 below shows a side view of the reheating furnace at Devki steel rolling mills.
Captured in this figure is the oil pre-heater, combustion air lines and furnace oil lines. This
20
figure shows the general layout of the furnace from the billet discharge area, next to oil pre-
heater to the billet charging end.
Figure 3. 1Side view of Reheat furnace
Combustion air pipes
Oil preheater
Oil pipes
21
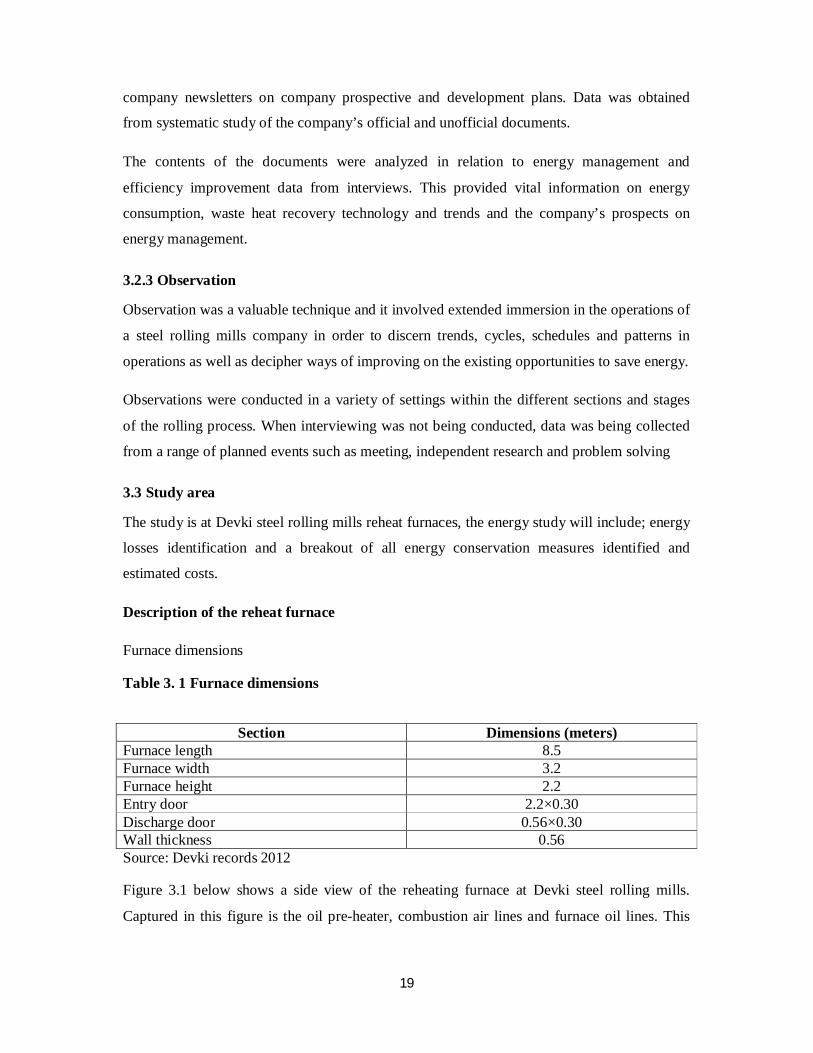
The product mass of the steel billets used in this study is as shown in the table 3.2 below Table 3. 2 Product mass of the steel billets
Product type Mass (Kg)
Y16 18.25
Y20 28.5
Y25 44.5
Y32 73.0
Source: Devki rolling mills records 2012
3.4 Data Analysis
This study will use descriptive analysis to analyze data. The descriptive statistics which will
be used will be mean to indicate average performance. During analysis, emphasis will be
put energy wastage in the steel rolling industry, an overview of unit operations and important
process steps. Areas of material and energy use and sources of energy waste generation will
be presented using pie charts and tables and analyzed using graphs and tables.
The investigations will be initiated by gathering relevant information from company records.
The data to be collected in the case study plant so as to execute the audit will include:
1. Energy consumption by type of energy, by department, by major items of process
equipment and by end use. (Total kilowatt hours &Total litres of boiler fuel used per
month)
2. Material balance data (Production per month).
3. Energy cost data
4. Process and material flow diagrams
5. Energy efficiency improvement measures
The existing power consumption and operational records for engineering utilities will be
useful in obtaining energy consumption pattern.
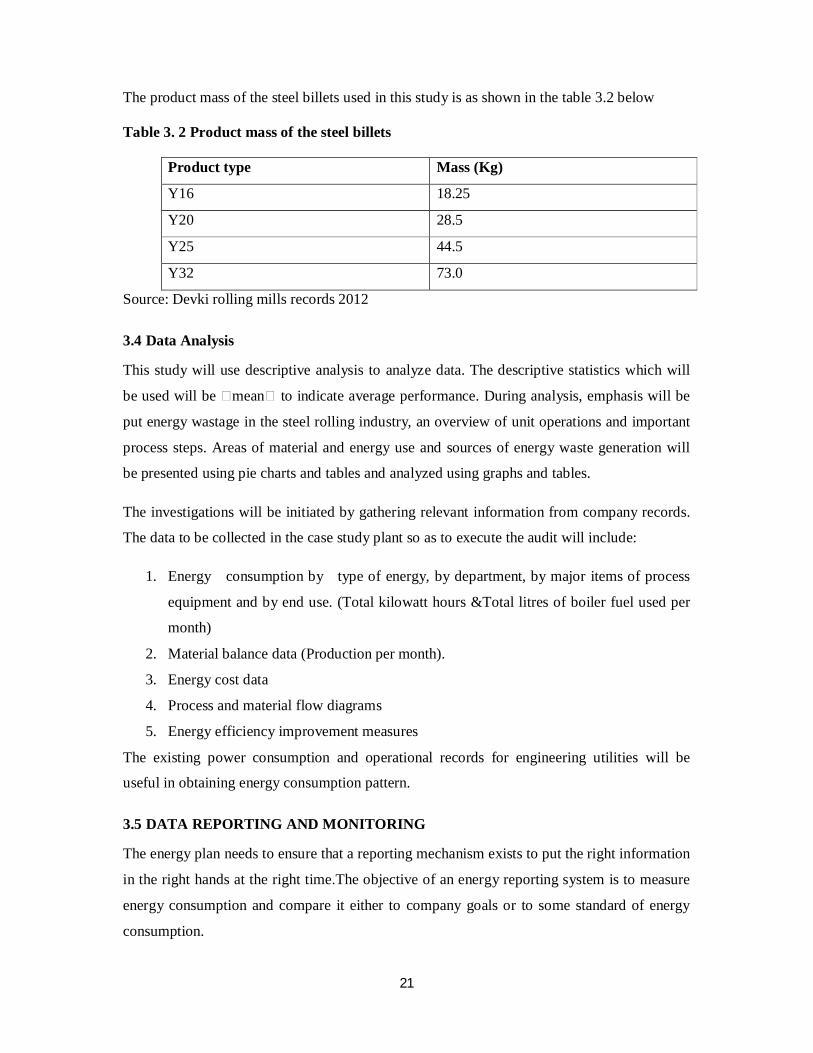
3.5 DATA REPORTING AND MONITORING
The energy plan needs to ensure that a reporting mechanism exists to put the right information
in the right hands at the right time.The objective of an energy reporting system is to measure
energy consumption and compare it either to company goals or to some standard of energy
consumption.
22
CHAPTER 4: EXPERIMENT ON PREHEATING BILLET USING FLUE GAS
This experiment was performed at Mechanical Engineering sheet metal workshop, on 15th and
22nd October 2015. The experiment involved determining the final temperature of a steel
billet in a preheating box that was to be heated using flue gas of Aluminium smelting furnace.
4.1 INTRODUCTION
In a steel rolling mill, steel billets are first heated in a reheat furnace to a temperature close to
the required rolling temperature so that the billets can be milled without causing any damage
to the rolling machine. A typical reheating furnace has three zones; preheating, heating and
soaking. After the billet is charged into a reheat furnace, the billet goes through these zones
from inlet to outlet and finally reaches the target temperature before it’s discharged.
Waste heat recovery involves capturing and re-using waste heat in industrial process for
heating or generating mechanical or electrical work. Heat recovery technology frequently
reduces energy and operating costs.
In a reheat furnace, the products of combustion leave the furnace at a temperature higher than
the stack temperature. Sensible heat losses in flue gases while leaving the stack account for
30-35% of heat input to furnace. The sensible heat in flue gas can be used for charge/stock
preheating.
4.1.1 Purpose; to determine the feasibility of using flue gas to preheat steel billets before they
are charged into a reheat furnace
Nomenclature
T-billet temperature (OC)
t- Time (S)
ρ- Density of steel
cp- specific heat
K-thermal conductivity
The quantity of heat to be imparted (Q) to the stock can be found from;
Q = m×CP× (T1-T2) kcal/h … (1)
(Natural Resources Canada, 2009a; United Nations Environment Programme, 2006)
23
Sensible heat loss in Flue gas
Excess air= % × %
… (3)
O2 % is the % of oxygen in the Flue gas
Theoretical air required to burn 1kg of oil= 14kg (Typical value for all fuel oil)
Total air supplied =theoretical × (1+ excess air/100)
Sensible heat loss =m×CP× (T1-T2) kcal/h
m =actual mass of air supplied/ Kg of fuel +mass of fuel (1Kg)
24
4.2 EXPERIMENT SET UP
Apparatus
In this experiment, steel billets are placed across a rack in a preheating box, with thermocouple probes for temperature measurements touching the surface of the billets. Flue gases from a Crucible Aluminium melting furnace are tapped via a chimney and directed into the preheating box via a door as is shown in the figure below.
Figure 4. 1 Alignment of preheating box, collecting duct and Aluminium crucible furnace
Aluminium Crucible Furnace
Flue
Gases
Exhaust Collecting Duct
Preheat Box Thermometers
25
Figure 4. 2 Thermometers for temperature readings at inlet exhaust and steel billet
Point A Point B Point C
3
1
2
26
Figure 4. 3 Parts of preheating box and collecting duct
Preheat box Door Chimney Point B
Point C Preheat box Collecting Duct
27
Figure 4. 4 Aluminium Crucible Furnace
Collecting Duct
Scrap
Crucible
28
4.3 EXPERIMENT APPARATUS
Preheat Box
Figure 4:3 shows the front view of preheat box used in this experiment. The sectional drawing
of the preheat box is shown the attachment on the next page. The preheat box has a rack onto
which the steel billets being preheated are put. From Figure 4.3, Point B on the picture shows
an opening through which thermocouples are inserted to take temperature readings for the
steel billets being preheated and the temperature inside the preheat box.
The steel billets to be preheated are inserted in the preheat box through the preheat box door
shown in Figure 4:3. This preheat box door just like the rest of the preheat box is lagged and
firmly closed during the experiment to prevent any heat loss. The chimney in Figure 4:3 is
where temperature for exhaust flue gas is taken.
Collecting Duct
The collecting duct shown in Figure 4:3 taps Flue gases from the Aluminium crucible furnace
to the preheat box. As is shown the above figures, it is properly lagged to minimize heat loss
from the Flue gases being tapped from Aluminium crucible furnace. At Point C as is shown in
Figure 4:3, a hole is drilled on the duct, at this point a probe is inserted into the duct. It is at
this point that temperature of Flue gases before entry into the preheat box is taken.
Aluminum Crucible Furnace
Figure 4:4 shows the Aluminium crucible furnace used in this experiment. The crucible is
filled with scrap metal during the experiment to assist in heat retention, rather than losing all
the heat to Flue gases. The collecting duct is placed close to the crucible so as to trap most of
the Flue gases during the experiment. Before any temperature readings are taken, the furnace
has to be switched on and the entire set up of apparatus given time to warm up.
Thermocouple: Four thermocouples were required for the experiment; this is because four
temperature measurements were to be recorded instantaneously. The temperature readings are
taken at the entry to the preheating box, inside the preheating box, for the steel billet and for
the flue gas exiting the preheating box. The four thermocouples are shown in figure 4.1
Weighing scale: It is needed for measuring the mass of steel billets placed in the preheating
box.
29
Stop watch: Is needed for time measurements because temperature readings are taken at
intervals until these readings stabilize.
4.4 EXPERIMENT PROCEDURE
The mass of the steel billets to be heated is measured using a weighing scale. The steel billets
are then placed on a rack inside the preheat box. The rack is shown in the sketch showing the
arrangement of the various parts of the experiment set up. The billets are placed on the rack in
such a way that they do not interfere with the free flow of flue gases in the preheat box. The
billets are stacked on the rack with the flue gas duct entering the preheat box slightly beneath
the billets for free flow of the gases by convection as they heat the billets.
The flue gas duct is then fitted onto the preheat box via an opening beneath the preheat box
door. This entry point is sealed to prevent any heat loss from this point. The flue gas duct has
a hole at the top, near the entry point to the preheat box, it is at this point that temperature
readings for the flue gas are taken just before the gases enter the box. Figure 4.5 shows a side
view of the flue gas duct and how it is fitted to the preheat box. The flue gas duct is also
shown in the sketch. Also shown in these two diagrams is the point at which flue gas
temperature reading before entering the box is taken.
The four thermometer probes are then put in place and checked if they are working properly.
These probes are placed on the flue gas duct, inside the preheat box, on the steel billet and at
the chimney. Figure 4.5 shows the probe measuring temperature of flue gas before entry into
the preheat box and figure 4.6 shows the probe for measuring temperature of the flue gas at
the exit. The probe for measuring temperature inside the preheat box and the billet
temperature are shown in the sketch.
Once the probes are in place and thermometers confirmed to be working properly, the level of
fuel in the crucible furnace tank are measured after which the furnace is switched on. The
entire set up is left to warm up as the flue gas flows through the duct and preheat box until the
temperature readings inside the furnace begin to stabilize. The four temperature readings can
now be taken simultaneously after five minute intervals. These readings are taken until there
is no significant change in the temperature readings from the four points.
Once the temperature readings are taken, the furnace is switched off. The entire set up is left
to cool. The level of fuel in the crucible furnace tank is taken, the difference between the two
30
readings is the fuel consumed during the experiment. With all readings noted and photos or
sketches done, the set can now be dis-assembled.
Temperature Reading
In this experiment, four temperature readings are taken simultaneously namely;
1. Flue gas exhaust temperature
2. Steel Billet temperature
3. Inside preheat box temperature
4. Flue gas temperature before entry to preheat box
Figure 4:5 shows point at which temperature of flue gas before entry to the preheat box is
taken. The collecting duct has a hole on its surface through a thermocouple probe is inserted
and temperature readings taken.
Figure 4:6 shows point on the preheat box, at the exhaust from which Flue gas exhaust
temperature readings are taken, as is shown in this figure, a thermocouple probe is inserted
into the opening on the preheat box stack.
For the temperature of steel billets, a thermocouple probe is inserted into the preheat box
through the opening at Point B in Figure 4:3. The probe is put on the surface of the steel billet
being preheated.
For the temperature inside the preheat box, a thermocouple probe is inserted in the preheat
box through the opening at Point B in Figure 4:3 and left hanging inside the preheat box.
Once the four thermocouple probes are in place and the apparatus has warmed up, the four
temperature readings are taken simultaneously at intervals and these readings noted in a table.
For this experiment, temperature readings were taken after five minutes intervals, these
readings are taken until the temperatures stabilize.
31
Figure 4. 5 Flue gas Temperature at Entry to preheat box
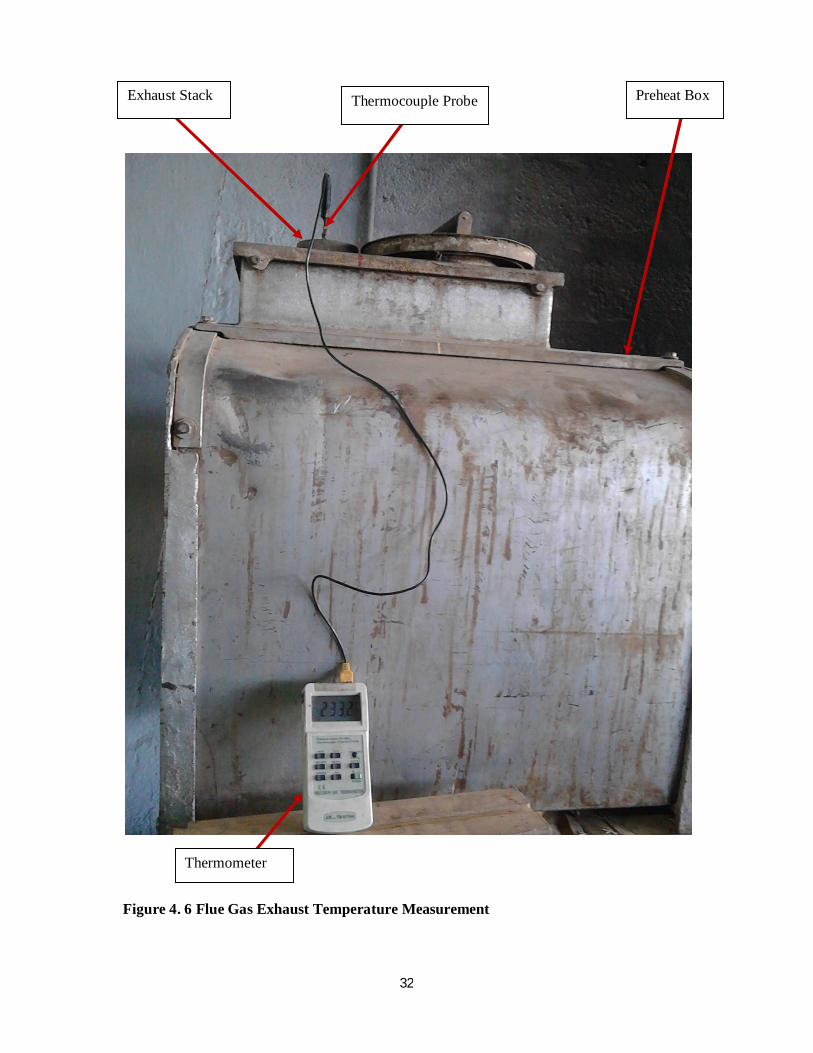
Figure 4. 6 Flue Gas Exhaust Temperature Measurement
Exhaust Stack Thermocouple Probe Preheat Box
Thermometer
33
CHAPTER 5: RESULTS AND DISCUSSION
5.0 REHEAT FURNACE DATA
The table below shows temperature readings of various sections of the furnace carried out
during the study;
Section Readings in oC
Inside furnace temperature 1180
Furnace wall temperature 116.4
Temperature of red hot billet 1080
Billet temperature before heating 32
Flue gas temperature 540 Table 5. 1Temperature readings during the experiment The combustion air temperature reading after the blower was 54.5OC, after the recuperator,
the reading was 141.2OC and the reading was 116.8OC just before the burner, indicating that
there was heat loss along the air lines.
During this study, surface temperature of a sample of billets was taken so as to determine the
average temperature of red hot steel billets from the furnace for use in calculating furnace
efficiency as is shown in table 5.2 below
Table 5. 2 Temperature of sample of billets
Billet sample no. Surface temperature (OC)
1 1098
2 1102
3 1100
4 1099
5 1101
Source: Devki production records 2013
34
Furnace oil consumption
Furnace oil being one of the main energy forms used at Devki steel rolling mills, data was
collected on the reheating furnace oil consumption and this is represented in table 1.2 ;
On 01/08/13; 3200 lts of oil was consumed in 12 hours;
Consumption rate =3200푙푡푠12퐻푟푠
=267lts/Hr
=267lts/Hr ×0.92
=245.64 Kg/hr
GCV of Oil 10,000 Kcal/Kg
Average O2 % in flue gas 12%
Specific heat of Billet 0.186 Kcal/Kg/ OC
Surface temperature of roof and sidewalls 116.4 OC
Theoretical air required is 14Kg of air to burn 1 Kg of fuel
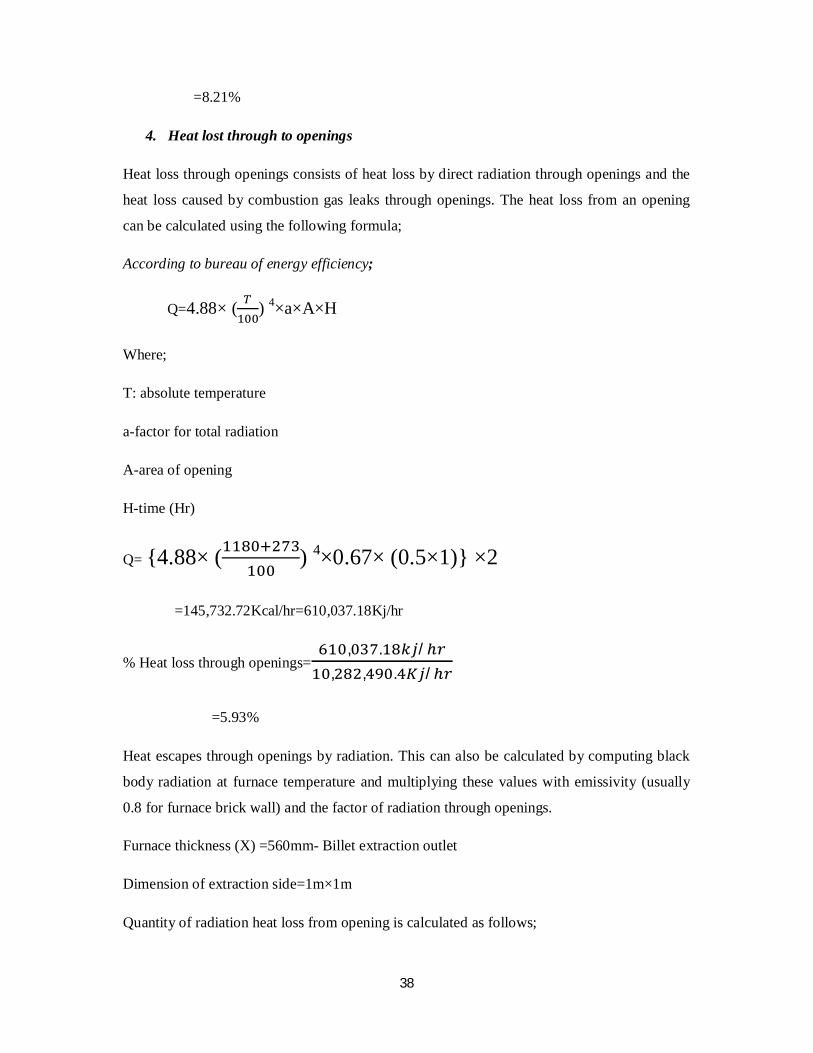
Quantity of radiation heat loss from opening is calculated as follows;
39
The shape of opening is square and =.
=1.8
Figure 5. 1 Factor for Determining the Equivalent of Heat Release from Openings to the Quantity of Heat Release from Perfect Black Body
Factor of radiation (Ref to fig. 5 for determining equivalent of heat release from openings to
quantity of heat release from perfect black body) is 0.67
Black body radiation corresponding to 1180OC is =22.0Kcal/cm2/hr (Refer to fig on black
body radiation)
Area opening =100cm×100cm= 10,000cm2
Emissivity =0.8
Total heat loss =22× 10,000 × 0.62 × 0.8
=109,120Kcal/hr=456,776.32
Heat loss through openings= , ., , .
40
=4.4%
5. Heat loss through furnace walls
Heat loss through roof and sidewalls;
Total average surface temperature =116.8OC
Heat loss at 116.8OC referring to the figure below is 1020Kcal/m 2hr
Figure 5. 2 Quantity of Heat Release at Various Temperatures
Total are of roof and sidewalls= {(8.2×3.2) ×2+ (8.2×3.2)} =62.32m2
Heat loss=1020Kcal/m 2hr×62.32m2
=63,566kcal/hr=266,087.276Kj/hr
% Heat loss through furnace wall=, . /
, , . /
=2.59%
Alternatively;
41
According to bureau of energy efficiency;
Quantity of heat release from reheating furnace is calculated with the following formula
Q=a× (T1-T2)5/4 +4.88E× {( ) 4 − ( ) 4
Where;
Q-quantity of heat released
a: factor regarding direction of surface of natural convection, ceiling=2.8, sidewalls=2.2,
hearth=1.5
T1-temperature of external wall surface of the furnace (OC)
T2-temperature of air around the furnace (OC)
E-emissivity of external wall surface of the furnace
The first term of the formula above represents the quantity of heat release by natural
convection, and the second term represents the quantity of heat release by radiation.
Sensible heat loss in Flue gas 40.98%
Loss due to evaporation of moisture in fuel 1.22%
Loss due to evaporation of water from
hydrogen in the fuel
8.21%
Heat loss due to openings 4.3%
Heat loss through furnace wall 2.59%
Total losses 57.3%
Furnace efficiency 100%-57.3%
=42.7%
Table 5. 3 Furnace Efficiency
HEAT BALANCE TABLE
HEAT INPUT HEAT OUTPUT
42
ITEM Kj/hr % ITEM Kj/hr %
Combustion heat of fuel
10,282,490.4 100 Quantity of heat in steel
42.7
Sensible heat in Flue gas
4,214,741.814 40.98
Moisture loss in fuel 125,446.38 1.22
Hydrogen loss in fuel 844,192.46 8.21
Heat loss due to openings
456,776.32 4.3
Heat loss through furnace wall
266,087.267 2.59
Total 100 Total 100
Table 5. 4 Heat Balance
5.2 GENERAL ENERGY EFFICIENCY IMPROVEMENT MEASURES IN THE
REHEAT FURNACE
Typical energy efficiency measures for the reheat furnace are;
1. Complete combustion with minimum excess air
2. Operating at the desired temperature
3. Reduction of heat losses from furnace openings
4. Minimum refractory losses
5. Waste heat recovery from flue gases
5.2.1 Prevention of Heat Loss through Openings
Heat loss through openings consists of the heat loss by direct radiation through openings and
the heat loss caused by combustion gas leaks through openings.
If the furnace pressure is slightly higher than outside (as in case of reheat furnace) during its
operation, the combustion gas inside ma blow off through openings and heat is lost with that.
Furnace doors that are damaged can be a source of considerable leakage of air into or gas out
of the furnace. These should be replaced by doors with tight fitting seals. Further
43
improvement would result from installing power operators on the doors to minimize the time
they are open as well as make it easier for operators.
From furnace efficiency calculations by indirect method;
Heat loss through openings Q=610,037.18 Kj/Hr
M-oil consumption (Kg/Hr)
5.2.3 Upgrading furnace door
Savings from upgrading furnace door
Since heat loss through opening is equal to heat from fuel used to generate this heat;
Q× 휂 = 퐻푒푎푡 푖푛푝푢푡 푓푟표푚 푓푢푒푙
610,037.18 Kj/Hr× 휂 = 푀 × , × 4.186 푘푗/퐻푟
M=, . / ×
, × . /
= {14.59× 휂} Kg/Hr
= {15.69× 휂} 퐿푡푠/퐻푟
Furnace doors should be open for 30 Minutes during extraction of red hot steel billets in a two hour cycle, in a normal 12 Hour day the furnace doors should remain closed for approximately 9 Hours.
Furnace fuel savings when furnace doors are open during billet extraction are thus;
Since heat quality is the main factor in determining the feasibility of recovering heat from a waste heat stream and having determined by experimentation that steel billet can be preheated by flue gases from ambient temperature of 27.60C to a temperature of about 206.40C, this is applied to the case study performed at Devki mills.
Figure 5. 6 Graph of Preheating Box Temperature (OC) against time (Hrs)
0
50
100
150
200
250
300
350
400
450
500
1145
1155
1205
1215
1225
1235
1245
1255
1305
1315
1325
1335
1345
1355
1405
1415
1425
1435
1445
Tem
pera
ture
Time
Preheating Billet Using Fuel Gas-Temperature (OC) against time (HR)
Inlet Temp.
Billet Temp
Exit Temp.
Insise Temp.
56
5.1.1 Billet preheating
Billets are heated from ambient temperature to target temperature of 11000C. This section
explores the feasibility of recovering waste heat from Flue gases for preheating billets. From
reheat furnace efficiency calculations for Devki steel mills, heat loss by flue gases is
4,214,741.814 Kj/Hr, this energy can be recovered.
Amount of recoverable heat
This is calculated by the following equation;
QR = m× CP× ΔT
Where,
QR-amount of recoverable heat
M-average annual production
From Table 1:0 Production (tons/day), the average annual production can be determined as follows;
M=67,195 Kg× × 4푊푘푠/푀표 × 12푀표/푌푟
=16,126,800 Kg
CP=0.12Kcal/Kg/0C× 4.186퐾푗/퐾푐푎푙
=0.5023 Kj/Kg/0C
Flue gas temperature a 4400C; preheating billets from ambient temperature of 27.6 0C to
Table 5. 7 Summary of the Energy saving opportunities for the Reheat furnace
58
CHAPTER 6: CONCLUSIONS
Several energy efficiency and cost saving measures were analyzed including; proper lagging
of combustion air pipes, proper lagging of recuperator, proper lagging of furnace and billet
preheating. In addition, this study also analyzed the feasibility of these measures.
Several measures were found feasible including;
The insulation reheat furnace combustion air pipes that would result in annual fuel savings of
14,976 Litres with an annual cost saving of Kshs 1,033,320. This measure has a simple
payback period is 10 months and is therefore feasible.
The insulation of the reheat furnace walls, this would result in annual fuel savings of 19,713
Litres translating to an annual cost saving of Kshs 1,360,211. The simple payback period for
this measure is 2.5 years.
Upgrading furnace door that was damaged and thus left open during the entire operation
cycle, this would result in annual fuel savings of 33,837 Litres and an annual cost saving of
Kshs 2,338,165 annual savings.
The Insulation of the recuperator, this would result in annual fuel savings of 97,496 Litres
with an annual cost saving of Kshs 6,725,385 annual. The simple payback period for this
measure is 1 month and it is therefore feasible.
Billet preheating using flue gas from ambient temperature to 206.4 OC, this would result in an
annual fuel savings of 37,204 liters and an annual cost saving of Kshs 3,162,365.
59
REFERENCES
British Petrol, (2008), Statistical Review of World Energy 2008.
Bergmeier,M.(2003) The history of waste energy recovery in Germany since 1920 Energy, 28(13) 1359-1379 DOI
Bureau of Energy Efficiency (BEE). (2004): General aspect of energy management and energy audit. Bureau of Energy Efficiency, New Delhi.
Canadian Industry Program for Energy Conservation (CIPEC). (1998): Heads Up Newsletter with a Focus on the Brewing Industry. II (22).
Capehart, B. L., C., Kennedy, W.J (2003): Guide to energy management (4th Ed). The Fairmont Press Inc, Lilburn.
CIPEC (2002): Energy efficiency planning and management guide. Natural Resources Canada, Ottawa..
Da'as, B. A. (2008). Energy Management Procedures and Audit Results of Palestinian Hospitals. Nablus – Palestine.: An-Najah National University.
DAEDEEC Thailand (2005) Total energy management handbook: New approach to energy conservation in Thailand
Department of Alternative Energy Development and Efficiency (NOVEMBER 2005) “TOTAL ENERGY MANAGEMENT HANDBOOK” Energy Conservation Center Thailand
Energy Information Administration (EIA), U.S. Department of Energy (1997) In: Manufacturing Consumption of Energy 1994. EIA, Office of Energy Markets and End Use, Washington, DC.
Howard W. Penrose (1999): A Novel approach to industrial assessments for Improved energy, waste stream, process and Reliability. Old Saybrook, Connecticut
IEEE Standard 141 (1993): Recommended practice for Electrical Power Distribution for Industrial Plants.
James J.Jackson, (1980): Steam Boiler Operation, Prentice-Hall Inc, New Jersey
James L. Williams (2012): Energy Economics Newsletter, WTRG Economics
Kenya Institute for Public Policy Research and Analysis (KIPPRA) (July 2010) A Comprehensive Study and Analysis on Energy Consumption Patterns in Kenya, report for The Energy Regulatory Commission (ERC)
Leo I. P (1962): Practical Boiler Water Treatment, McGraw Hill Inc, New
60
Liptak, Béla G. (1999):Optimization of Industrial Unit Processes, CRC Press LLC, USA.
Manan, Z. A. (2001): Course Module for Energy Management for M.Sc. in Industrial Process Plant Management(IPPMS).
Miketa, A. (2001): Analysis of Energy Intensity Developments in Manufacturing Sectors inIndustrialized and Developing Countries. Energy Policy 29 (2001): 769-775.
Spirax Sarco. Module 3 of Spirax Sarco’s web based Learning Centre. www.spiraxsarco.com/learn
Tabti, M. T. and Mandi, W. (1985): Energy Indicators.OPEC Review 9 (winter) 417-455
The Kenya Association of Manufacturers (2010): Energy training manual, KAM
UNEP (2006): Energy Efficiency Guide for Industry in Asia – www.energyefficiencyasia.org. Thermal Energy Equipment: Boilers & Thermic Fluid Heaters
Zainuddin A. M (2003): Identifying energy saving opportunities in a process plant through preliminary energy audit,Jurnal Teknologi, 38(A) Universiti Teknologi Malaysia.