C. N. Belcher and C. A. Jennings. In Press. Identification and evaluation of shark bycatch in Georgia’s commercial shrimp trawl fishery with implications for management. Fisheries Management and Ecology. (SEDAR21-DW-23) 1 Identification and evaluation of shark bycatch in Georgia’s commercial shrimp trawl fishery with 1 implications for management 2 3 DO NOT CITE WITHOUT PERMISSION FROM THE AUTHORS 4 5 6 C. N. BELCHER 7 Marine Fisheries Section, Coastal Resources Division, Georgia Department of Natural 8 Resources, Brunswick, Georgia, USA 9 & 10 C. A. JENNINGS 11 U.S. Geological Survey, Georgia Cooperative Fish and Wildlife Research Unit, Athens, Georgia, 12 USA 13 14 KEYWORDS: penaeid shrimp fishery – turtle excluder device – bycatch reduction device – 15 Southeastern US – Atlantic sharpnose shark – fishery-dependent sampling 16 17 Correspondence: Carolyn N. Belcher, Marine Fisheries Section, Coastal Resources Division, 18 Georgia Department of Natural Resources, One Conservation Way, Suite 300, Brunswick, 19 Georgia 31520, USA (e-mail: [email protected]) 20 21
Transcript
C. N. Belcher and C. A. Jennings. In Press. Identification and evaluation of shark bycatch in Georgia’s commercial shrimp trawl fishery with implications for management. Fisheries Management and Ecology. (SEDAR21-DW-23)
1
Identification and evaluation of shark bycatch in Georgia’s commercial shrimp trawl fishery with 1
implications for management 2
3
DO NOT CITE WITHOUT PERMISSION FROM THE AUTHORS 4
5
6
C. N. BELCHER 7
Marine Fisheries Section, Coastal Resources Division, Georgia Department of Natural 8
Resources, Brunswick, Georgia, USA 9
& 10
C. A. JENNINGS 11
U.S. Geological Survey, Georgia Cooperative Fish and Wildlife Research Unit, Athens, Georgia, 12
C. N. Belcher and C. A. Jennings. In Press. Identification and evaluation of shark bycatch in Georgia’s commercial shrimp trawl fishery with implications for management. Fisheries Management and Ecology. (SEDAR21-DW-23)
2
22
Abstract Many US states have recreational and commercial fisheries that occur in nursery 23
areas occupied by subadult sharks and can potentially affect their survival. Georgia is one of few 24
US states without a directed commercial shark fishery, but the state has a large, nearshore 25
penaeid shrimp trawl fishery in which small sharks occur as bycatch. During our 1995-1998 26
investigation of bycatch in fishery-dependent sampling events, 34% of 127 trawls contained 27
sharks. This bycatch totaled 217 individuals from six species, with Atlantic sharpnose shark, 28
Rhizoprionodon terraenovae (Richardson), the most common and finetooth shark, Carcharhinus 29
isodon ( Müller and Henle), and spinner shark, Carcharhinus brevipinna (Müller and Henle), the 30
least common. The highest catch rates for sharks occurred during June and July and coincided 31
with the peak months of the pupping season for many species. Trawl tow speed and tow time 32
did not significantly influence catch rates for shark species. Gear configurations (net type, turtle 33
strategies that may reduce shark bycatch in this fishery include gear restrictions, a delayed 35
season opening, or reduced bar spacing on turtle excluder devices. 36
37
C. N. Belcher and C. A. Jennings. In Press. Identification and evaluation of shark bycatch in Georgia’s commercial shrimp trawl fishery with implications for management. Fisheries Management and Ecology. (SEDAR21-DW-23)
3
Introduction 38
39
Bycatch associated with commercial fisheries throughout the world has become a 40
growing concern for fisheries management since the 1980s (Alverson et al. 1994). The 2007 41
Magnuson-Stevens Fishery Conservation Act defines bycatch as “fish which are harvested in a 42
fishery, but are not sold or kept for personal use, and includes economic discards and regulatory 43
discards” (National Marine Fisheries Service 2007a). The general public and many conservation 44
groups consider bycatch a source of unnecessary mortality of vulnerable resources or endangered 45
species such as dolphins caught in tuna seine fisheries and sea turtles caught in shrimp trawl and 46
pelagic longline fisheries (Alverson et al. 1994). 47
In the northwestern Atlantic Ocean, the penaeid shrimp trawl fishery has the highest ratio 48
of bycatch to target species, with 10.30 kg of bycatch to 1 kg of shrimp in the Gulf of Mexico 49
and 8.00 kg of bycatch to 1 kg of shrimp in waters off the southeastern coast of the United States 50
(Alverson et al. 1994). Since the late 1980s, bycatch has become a key management issue facing 51
this fishery (Diamond 2003). In 1989, the National Marine Fisheries Service (NMFS) required 52
trawlers in the South Atlantic and the Gulf of Mexico to use turtle excluder devices (TEDs) to 53
reduce mortalities of sea turtles encountered during fishing operations. Bycatch reduction 54
devices (BRDs) were required in the late 1990s by NMFS to reduce the amount of finfish 55
bycatch, especially overfished species such as red snapper, Lutjanus campechanus (Poey), in the 56
Gulf of Mexico (Gulf of Mexico Fishery Management Council 1997), and weakfish, Cynoscion 57
regalis (Bloch & Schneider), and Spanish mackerel, Scomberomorus maculatus (Mitchill), in the 58
southeastern USA (South Atlantic Fishery Management Council 1996). 59
C. N. Belcher and C. A. Jennings. In Press. Identification and evaluation of shark bycatch in Georgia’s commercial shrimp trawl fishery with implications for management. Fisheries Management and Ecology. (SEDAR21-DW-23)
4
Sharks are particularly vulnerable to overfishing because most have slow growth and late 60
sexual maturity, produce few offspring, and have long life spans (Camhi 1998; Stevens et al. 61
2000). Some of the U.S. populations of sharks have declined by as much as 85% since the late 62
1970s (Camhi 1998). Generally, these declines are attributed to directed fishing pressure from 63
commercial and recreational fisheries, but effects from other fisheries that encounter sharks as 64
bycatch also play a role (Barker and Schluessel 2005). 65
Incidental catch (i.e. bycatch) in the commercial shrimp trawl fishery has been identified 66
as a large source of subadult shark mortality (Camhi 1998; Stobutski et al. 2002; Shepherd & 67
Myers 2005). The most recent stock assessment for small coastal sharks indicated that as much 68
as 45% of the fishing mortality associated with blacknose sharks, Carcharhinus acronotus 69
(Poey), was attributed to the Gulf of Mexico shrimp trawl fishery (National Marine Fisheries 70
Service 2007b). Annual bycatch estimates for small coastal sharks in the Gulf of Mexico trawl 71
fishery ranged from 443,215 to 1,172,572 fish, whereas similar estimates for the South Atlantic 72
range from 55,718 to 147,409 fish (National Marine Fisheries Service 2007b). Because the 73
results of the most recent peer-reviewed stock assessment (National Marine Fisheries Service 74
2007b) indicated that blacknose sharks are both overfished and undergoing overfishing, the 75
Highly Migratory Species Division (HMS) of the National Marine Fisheries Service is required 76
to implement management actions that will end overfishing for this species. Under the 77
Service 2007a), eight regional management councils are given the authority to manage federal 79
fisheries in the Exclusive Economic Zone (EEZ), which extends from the edge of a state’s 80
territorial waters out to 370 km (200 nautical miles). State management agencies manage 81
fisheries that occur within their territorial waters out to the EEZ. As the Gulf of Mexico and the 82
C. N. Belcher and C. A. Jennings. In Press. Identification and evaluation of shark bycatch in Georgia’s commercial shrimp trawl fishery with implications for management. Fisheries Management and Ecology. (SEDAR21-DW-23)
5
South Atlantic shrimp fisheries are managed by their respective regional fishery management 83
councils and the corresponding states, HMS will have to work with the councils and states to 84
ensure the necessary reductions in blacknose shark bycatch are met. 85
Georgia’s shrimp trawl fishery is the most economically important commercial fishery in 86
the state (Page 2007). The fishery operates in state territorial waters outside of the sound/beach 87
boundary (i.e. 0 to 4.8 km off the coast) and the EEZ throughout much of the year. The purpose 88
of this study was to examine the composition and temporal distribution of shark species taken as 89
bycatch in the Georgia shrimp trawl fishery. Additionally, the effects of gear configuration (e.g. 90
net type, TEDs and BRDs), tow time and tow speed on the capture rates of sharks were 91
examined. Based on the results of this study and an assessment of regulations presently applied 92
to the shrimp trawl fishery, potential management approaches were identified that may help 93
reduce the amount of shark bycatch with minimal effects to the shrimp trawl fishery. 94
95
Methods 96
97
Shrimp trawl bycatch data were collected monthly during the shrimp trawling season in 98
Georgia’s state waters and adjacent federal waters from April 1995 to January 1998. All months 99
except February and March were sampled during the study period. The Georgia Department of 100
Natural Resources (GADNR) has the authority to open state waters for the commercial shrimp 101
trawl season as early as mid-May, with a season closure at the end of December (Title 27, 102
Official Code of Georgia Annotated, chapter 4). However, the season can be extended through 103
the end of February if shrimp size and quantity remain sufficient (Title 27, Official Code of 104
Georgia Annotated, chapter 4). Federal waters are open year-round to commercial shrimp 105
C. N. Belcher and C. A. Jennings. In Press. Identification and evaluation of shark bycatch in Georgia’s commercial shrimp trawl fishery with implications for management. Fisheries Management and Ecology. (SEDAR21-DW-23)
6
trawling, which allows for continued fishing after state waters are closed (Title 27, Official 106
Codeof Georgia Annotated, chapter 4). 107
Observers onboard commercial shrimp trawlers fishing in both state and federal waters 108
recorded bycatch information. Sampling was conducted under the Shrimp Trawl Bycatch 109
Characterization Sampling Protocol (National Marine Fisheries Service 1992), which was 110
designed to characterize the complete species composition of bycatch associated with the shrimp 111
trawl fishery; therefore, shark data used for this study were a subset of the available data. 112
Additional data collected during each trip and examined for this study included vessel 113
information (e.g. length, horsepower) and gear specifications (e.g. TED type, BRD type). Data 114
included at the individual-tow level included location, tow time, tow speed and catch 115
characteristics. 116
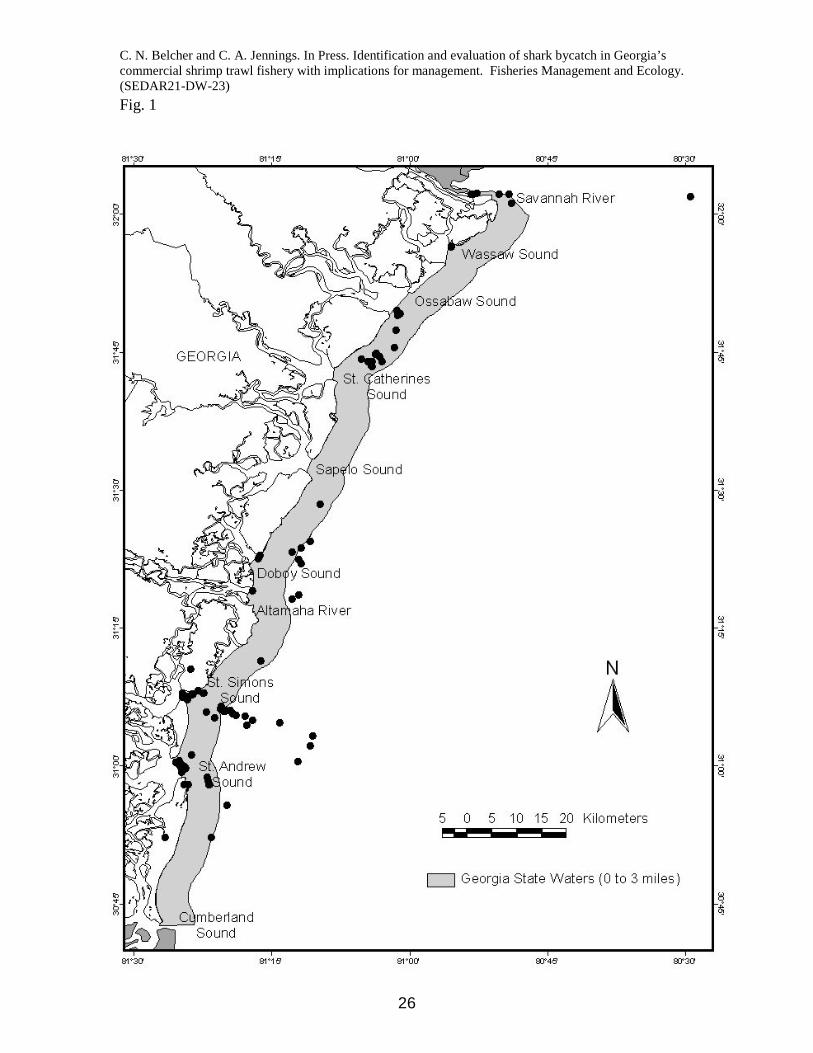
Shark bycatch evaluated in this study came from shrimp trawl vessels operated in state 117
waters east of the barrier islands and in adjacent federal waters at depths ranging from 2.0 to 15.2 118
m (Fig. 1). The target species were penaeid shrimp species, predominantly white shrimp, 119
Litopenaeus setiferus (Linnaeus), during the spring and fall, and brown shrimp, Farfantepenaeus 120
aztecus (Ives), during the summer months. Participation in the study was voluntary on the part 121
of boat captains, and therefore not random. Initially, sampling was intended to be coastwide, but 122
reduced cooperation from some trawler captains during the latter portion of the study limited 123
sampling to waters off the central part of the Georgia coast. 124
Flat, mongoose and triple wing trawls are commonly used in the commercial shrimp 125
fishery. Flat nets do not have a bib (an extension in the middle of the top of the net; Harrington 126
et al. 1988). The mongoose net has a single bib on the upper edge of the net and is the most 127
commonly used net in the southeastern US (Harrington et al. 1988). The triple wing net is 128
C. N. Belcher and C. A. Jennings. In Press. Identification and evaluation of shark bycatch in Georgia’s commercial shrimp trawl fishery with implications for management. Fisheries Management and Ecology. (SEDAR21-DW-23)
7
similar to the mongoose net, but has bibs on both the upper and bottom edges of the net 129
(Harrington et al. 1988). 130
Turtle excluder devices used by the commercial vessels observed during this study were 131
either mesh ramps or metal grids installed in front of the bag, or codend, of a trawl. TEDs are 132
angled towards openings at either the top or bottom of the net allowing large organisms to 133
escape, with the primary purpose of excluding sea turtles. Two types of hard TEDs were used on 134
trawls in the study, and both types excluded turtles downward or under the net but differed in the 135
angle of the bars. The Georgia Jumper has an oval face with straight bars, whereas the Super 136
Shooter has an oval face with angled bars. 137
BRDs are openings in the trawl net that allow for the escapement of finfish and other 138
organisms that are too small to be excluded by the TED. Whereas TEDs mechanically deflect 139
organisms out of the net, BRDs rely on behavioral differences of fish and shrimp (Crespi and 140
Prado 2008). Fish are capable of swimming while in the net and can orient themselves to the 141
direction of the trawl, whereas shrimp species exhibit less directional swimming and are more 142
easily swept into the codend of the net (Crespi and Prado 2008). BRDs were categorised by both 143
design and dimension. A large-mesh funnel BRD is a section of the trawl behind the TED made 144
of larger mesh. A fish eye design is an oval metal frame sewn into the net behind the TED that 145
provides an opening to the outside of the net; the most common sizes were the 30.5 cm x 12.7 146
cm fish eye and the 22.9 cm x 11.4 cm North Carolina diamond fish eye. 147
Participating vessels fished multiple nets, and the net sampled during a given tow was 148
randomly selected. Larger vessels usually fished a “try net”, a smaller trawl located in front of 149
the main nets, to determine if an area was producing enough shrimp to continue the effort with 150
the larger nets or if the tow should be terminated and relocated. Only main nets were used for 151
C. N. Belcher and C. A. Jennings. In Press. Identification and evaluation of shark bycatch in Georgia’s commercial shrimp trawl fishery with implications for management. Fisheries Management and Ecology. (SEDAR21-DW-23)
8
bycatch characterization. If the random net to be sampled was located behind the try net, another 152
net was randomly selected to avoid bias associated with the try net. 153
After the catch from the net to be sampled was emptied onto the deck and the shrimp 154
were removed, the bycatch was mixed with a shovel to homogenize the composition. A 12 kg 155
subsample for each hour towed was sampled from the mixed bycatch for characterisation. The 156
number of individuals and collective weight were recorded for each species. If more than 30 157
individuals of a species were in the subsample, they were mixed and 30 individuals were 158
randomly selected for length measurements. Lengths of finfish, including sharks, were reported 159
in cm TL. Catch rate was calculated as the estimated number of sharks captured per net per hour 160
towed. The total number of sharks captured per net was calculated, as recommended by National 161
Marine Fisheries Service (1992), with the following equation: 162
WeightSample TotalNet Weight Total Samplein Sharks ofNumber Net per Sharks •= 163
where total net weight is the weight of the total catch in the sampled net and sample weight is the 164
weight of the complete sample. Number of sharks per net divided by the number of hours towed 165
provided an estimate of the number of sharks caught per net hour. Catch rates were calculated 166
for the aggregate shark catch and for frequently encountered species (i.e. those that occurred in 167
10% or more of the tows sampled). 168
Catch rates for frequently encountered species and the aggregate catch were evaluated for 169
normality prior to analysis. Species-specific and aggregate catch rates were non-normally 170
distributed, and a log10 transform was applied to the catch data to correct for positive skews 171
(Mertler and Vannata 2005). Although the log10 transformations normalized the data, the 172
variances remained heterogeneous, suggesting a non-parametric approach would be more 173
appropriate for analysis. Parametric tests on rank-transformed data can be useful as analogs for 174
C. N. Belcher and C. A. Jennings. In Press. Identification and evaluation of shark bycatch in Georgia’s commercial shrimp trawl fishery with implications for management. Fisheries Management and Ecology. (SEDAR21-DW-23)
9
non-parametric tests (Conover and Iman 1981). Accordingly, catch rate data were rank 175
transformed prior to analysis. 176
Aggregate and species-specific shark catch rates were compared among months with 177
one-way ANOVAs of rank-transformed data and post-hoc analysis by Student-Newman-Keuls 178
(SNK) multiple comparison test. The SNK test was chosen over the other multiple comparison 179
tests because it is neither liberal nor conservative relative to its associated power and Type I error 180
rate (Dowdy and Wearden 1983). 181
The effects of trawl type, TED type and BRD type were tested using only samples from 182
gear types that captured sharks during the months of highest abundance and had a minimum 183
sample size of four tows. This approach was precautionary to better ensure any differences 184
identified would be attributed appropriately to the gear and not confounded with monthly 185
differences in abundance, as not all gear combinations were observed during each month of the 186
sampling period. A one-way ANOVA and SNK test were used to compare the rank-transformed 187
catch rates for frequently encountered species and all species combined for the gear 188
combinations that met the criteria above. 189
Because of the non-normality of the catch data, Spearman rank correlations (Zar 1999) 190
were used to determine if the number of sharks caught per net were associated with tow time and 191
tow speed. Correlations were examined for the aggregate catch and frequently encountered 192
species. Because of the seasonality associated with shark catches, only those tows made during 193
months when sharks were captured were included in the analysis. All analyses were performed 194
using SAS1
1 Reference to trade names does not constitute US Government endorsement of commercial products.
9.1 software (SAS Institute 2002), and resulting P values were compared to an α of 195
0.05 to determine the significance of all analyses. 196
C. N. Belcher and C. A. Jennings. In Press. Identification and evaluation of shark bycatch in Georgia’s commercial shrimp trawl fishery with implications for management. Fisheries Management and Ecology. (SEDAR21-DW-23)
10
197
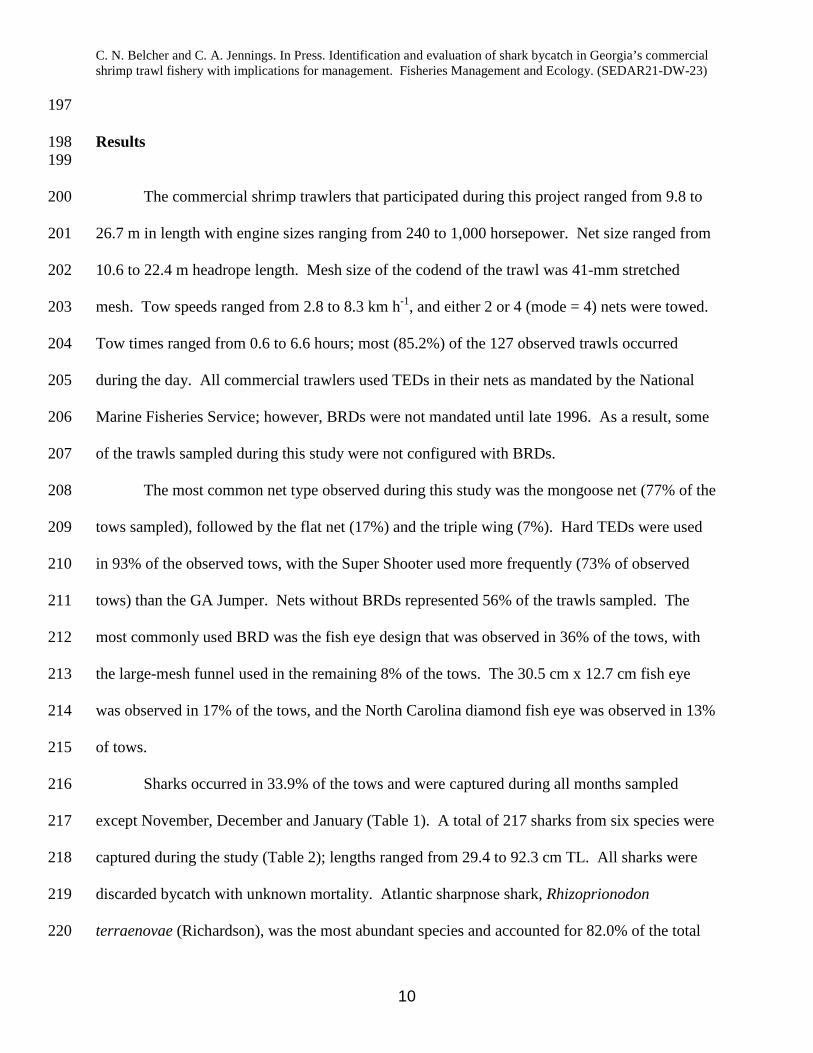
Results 198 199
The commercial shrimp trawlers that participated during this project ranged from 9.8 to 200
26.7 m in length with engine sizes ranging from 240 to 1,000 horsepower. Net size ranged from 201
10.6 to 22.4 m headrope length. Mesh size of the codend of the trawl was 41-mm stretched 202
mesh. Tow speeds ranged from 2.8 to 8.3 km h-1, and either 2 or 4 (mode = 4) nets were towed. 203
Tow times ranged from 0.6 to 6.6 hours; most (85.2%) of the 127 observed trawls occurred 204
during the day. All commercial trawlers used TEDs in their nets as mandated by the National 205
Marine Fisheries Service; however, BRDs were not mandated until late 1996. As a result, some 206
of the trawls sampled during this study were not configured with BRDs. 207
The most common net type observed during this study was the mongoose net (77% of the 208
tows sampled), followed by the flat net (17%) and the triple wing (7%). Hard TEDs were used 209
in 93% of the observed tows, with the Super Shooter used more frequently (73% of observed 210
tows) than the GA Jumper. Nets without BRDs represented 56% of the trawls sampled. The 211
most commonly used BRD was the fish eye design that was observed in 36% of the tows, with 212
the large-mesh funnel used in the remaining 8% of the tows. The 30.5 cm x 12.7 cm fish eye 213
was observed in 17% of the tows, and the North Carolina diamond fish eye was observed in 13% 214
of tows. 215
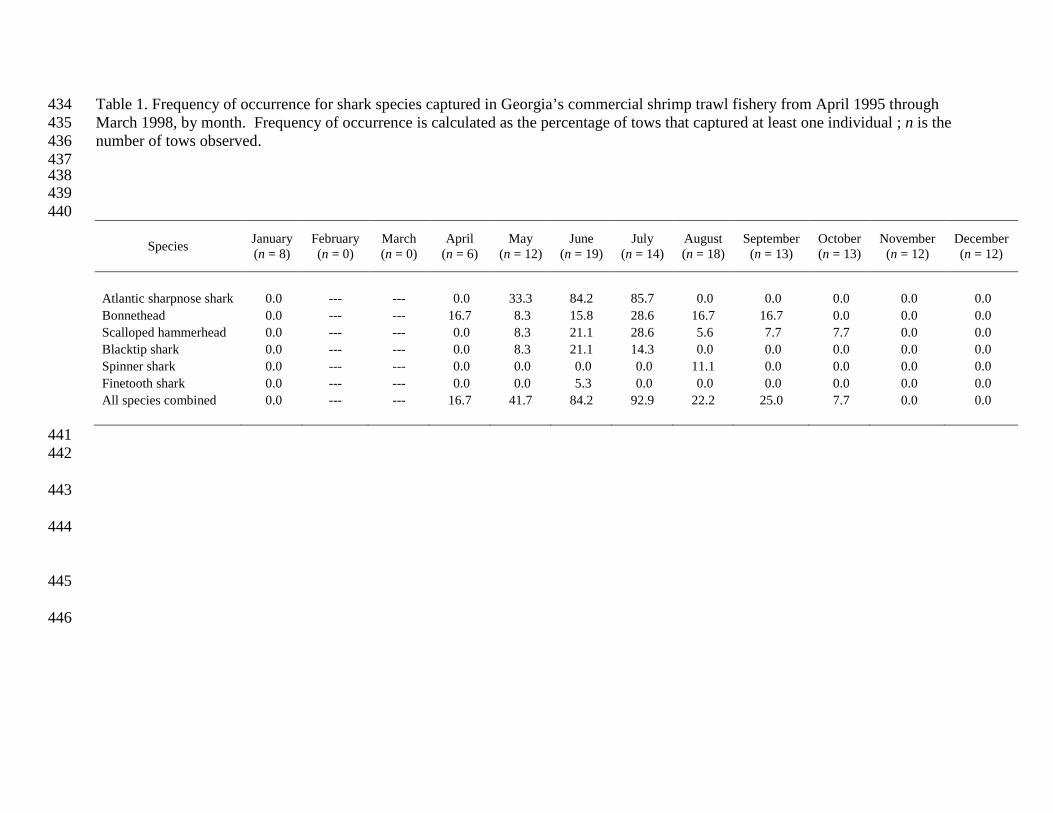
Sharks occurred in 33.9% of the tows and were captured during all months sampled 216
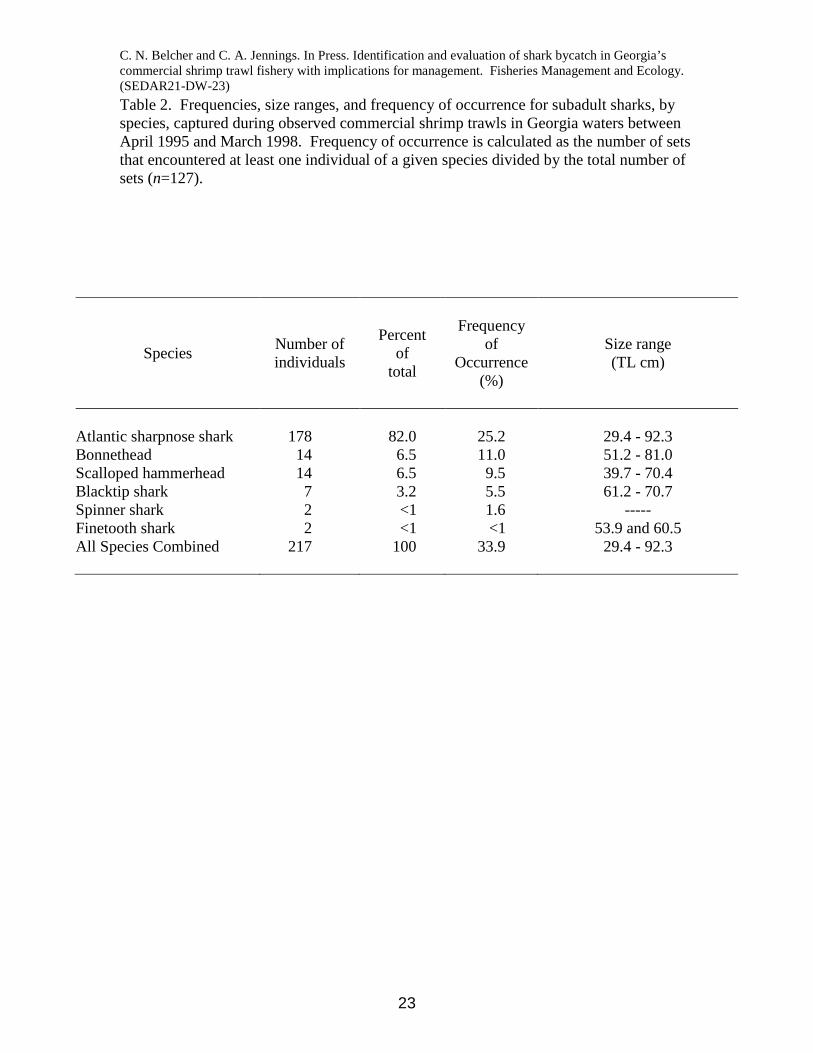
except November, December and January (Table 1). A total of 217 sharks from six species were 217
captured during the study (Table 2); lengths ranged from 29.4 to 92.3 cm TL. All sharks were 218
discarded bycatch with unknown mortality. Atlantic sharpnose shark, Rhizoprionodon 219
terraenovae (Richardson), was the most abundant species and accounted for 82.0% of the total 220
C. N. Belcher and C. A. Jennings. In Press. Identification and evaluation of shark bycatch in Georgia’s commercial shrimp trawl fishery with implications for management. Fisheries Management and Ecology. (SEDAR21-DW-23)
11
number of sharks sampled (Table 2). Atlantic sharpnose sharks occurred in 25.2% of the tows 221
sampled and were captured during May, June and July (Table 2; Fig. 2). 222
Catch rates for all shark species combined differed among months (F6, 88 = 16.60, P < 223
0.001). Catch rates in June and July were not significantly different but were greater than the 224
other months (Fig. 2). During June, sharks occurred in 84.2% of the observed; in July that 225
percentage increased to 92.9% (Table 1). Neither tow time nor tow speed correlated with the 226
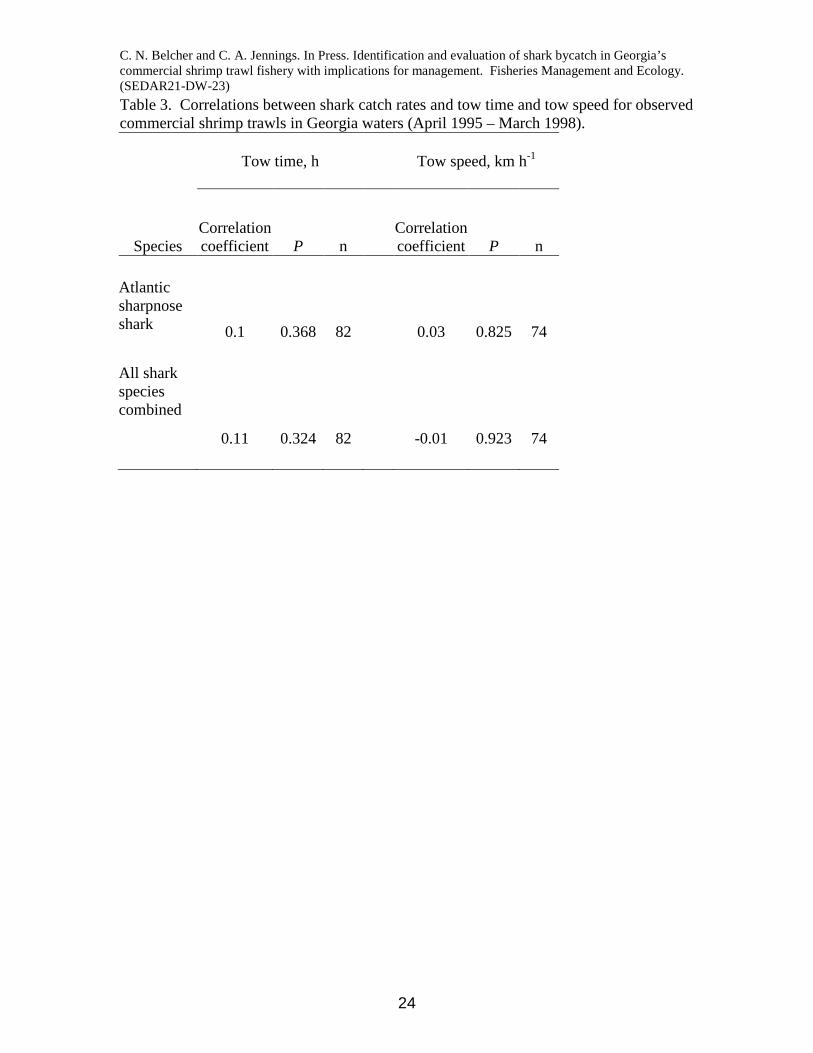
total number of sharks caught per net (Table 3). 227
Atlantic sharpnose shark catch rates also differed significantly among months (F2,42 = 228
14.66, P <0.001),with the greatest catch rate in June (Fig.2). Atlantic sharpnose sharks occurred 229
in 84.2% of June trawls and 85.7% of July trawls (Table 1). Neither tow time nor tow speed 230
correlated with the number of Atlantic sharpnose sharks caught per net (Table 3). 231
The aggregate catch rates for sharks differed among the gear combinations (F4,25 = 3.19, 232
P = 0.030). Because catch rates of mongoose nets configured with Super Shooters were highly 233
variable (Fig. 3), it was not possible to conclude how the mean catch rate for this gear 234
configuration related to the means of the other gear combinations. It was possible to conclude 235
from the analysis that highest catch rates were associated with triple wing nets configured with a 236
Super Shooter TED and without a BRD, and lower catch rates were associated with mongoose 237
nets configured with a Georgia Jumper and without a BRD and flat nets configured with a Super 238
Shooter and without a BRD. 239
The results of the multiple comparison procedure allowed for general contrasts to be 240
made among net, TED, and BRD types. By comparing the catch rates for the three net types 241
configured with just the super shooter TED, a reasonable conclusion would be that triple wing 242
nets caught greater numbers of sharks as bycatch, with flat nets catching the least (Fig. 3). 243
C. N. Belcher and C. A. Jennings. In Press. Identification and evaluation of shark bycatch in Georgia’s commercial shrimp trawl fishery with implications for management. Fisheries Management and Ecology. (SEDAR21-DW-23)
12
Because of the high variability of catch rates associated with the mongoose net, it was not 244
possible to conclude if the associated average catch rate of sharks was significantly lower than 245
the average catch rate of the triple wing. Of the three TED types observed during this study, 246
only the two hard TEDs could be evaluated for potential effects on shark catch rates. By looking 247
at the resulting groupings for mongoose nets configured with either the Georgia Jumper or Super 248
Shooter TED and without a BRD, it is possible to conclude that TED type does not have an 249
effect on shark catch rates (Fig. 3). Similarly, by looking at the difference in mean catch rates 250
associated with mongoose nets configured with Super Shooters and either a fish eye BRD or 251
without a BRD, it is possible to conclude that the fish eye BRD does not have an effect on shark 252
catch rates. 253
254
Discussion 255
256
Six species of sharks were captured in commercial shrimp trawls fishing off the Georgia 257
coast, and Atlantic sharpnose shark was the most abundant (i.e. in frequency of occurrence and 258
total numbers) species caught. Atlantic sharpnose sharks are common small coastal sharks in 259
estuarine and near shore waters in the southeastern Atlantic and in the Gulf of Mexico (Castro 260
1983; McCandless et al. 2007). Their presence in shrimp trawls is a function of their abundance 261
and, possibly, their small size. Most of the Atlantic sharpnose sharks captured were neonates 262
and small juveniles less than 55 cm TL. Similar size and life stage characteristics for Atlantic 263
sharpnose sharks were observed during a fishery-independent trawl survey conducted in Georgia 264
waters (Belcher 2008). With the exception of bonnetheads, Sphyrna tiburo (Linnaeus), the other 265
four species [spinner shark, Carcharhinus brevipinna (Müller and Henle), blacktip shark, C. 266
C. N. Belcher and C. A. Jennings. In Press. Identification and evaluation of shark bycatch in Georgia’s commercial shrimp trawl fishery with implications for management. Fisheries Management and Ecology. (SEDAR21-DW-23)
13
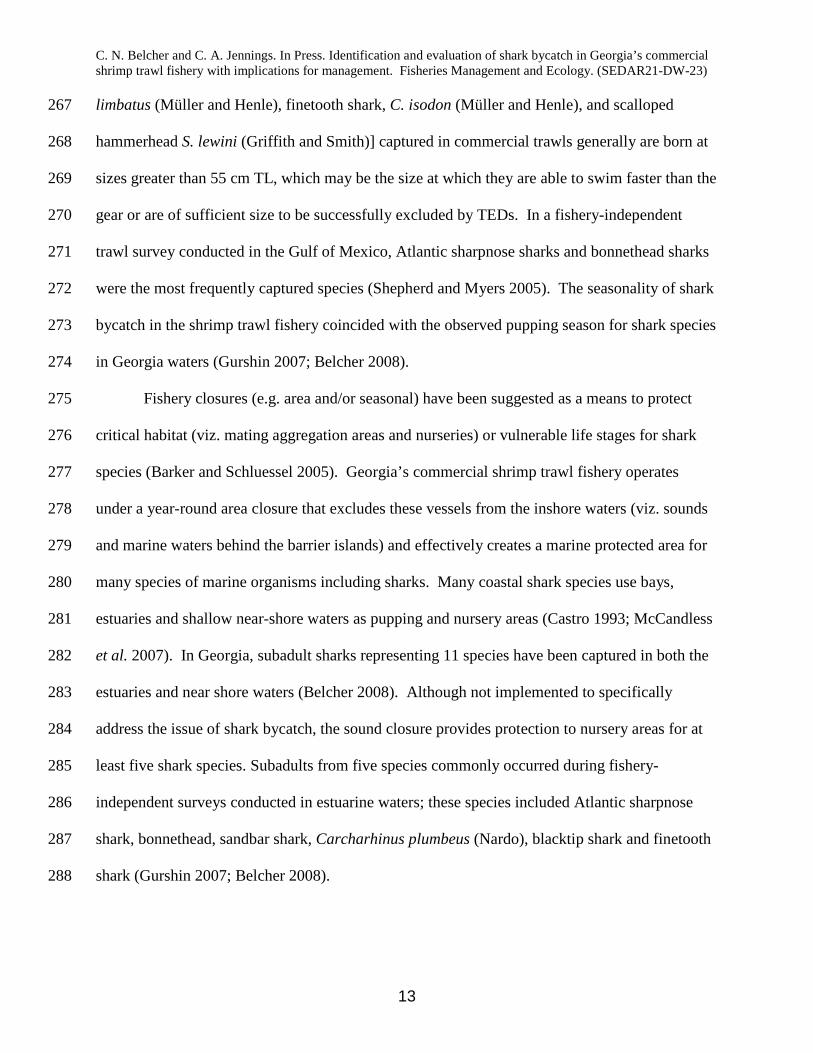
limbatus (Müller and Henle), finetooth shark, C. isodon (Müller and Henle), and scalloped 267
hammerhead S. lewini (Griffith and Smith)] captured in commercial trawls generally are born at 268
sizes greater than 55 cm TL, which may be the size at which they are able to swim faster than the 269
gear or are of sufficient size to be successfully excluded by TEDs. In a fishery-independent 270
trawl survey conducted in the Gulf of Mexico, Atlantic sharpnose sharks and bonnethead sharks 271
were the most frequently captured species (Shepherd and Myers 2005). The seasonality of shark 272
bycatch in the shrimp trawl fishery coincided with the observed pupping season for shark species 273
in Georgia waters (Gurshin 2007; Belcher 2008). 274
Fishery closures (e.g. area and/or seasonal) have been suggested as a means to protect 275
critical habitat (viz. mating aggregation areas and nurseries) or vulnerable life stages for shark 276
species (Barker and Schluessel 2005). Georgia’s commercial shrimp trawl fishery operates 277
under a year-round area closure that excludes these vessels from the inshore waters (viz. sounds 278
and marine waters behind the barrier islands) and effectively creates a marine protected area for 279
many species of marine organisms including sharks. Many coastal shark species use bays, 280
estuaries and shallow near-shore waters as pupping and nursery areas (Castro 1993; McCandless 281
et al. 2007). In Georgia, subadult sharks representing 11 species have been captured in both the 282
estuaries and near shore waters (Belcher 2008). Although not implemented to specifically 283
address the issue of shark bycatch, the sound closure provides protection to nursery areas for at 284
least five shark species. Subadults from five species commonly occurred during fishery-285
independent surveys conducted in estuarine waters; these species included Atlantic sharpnose 286
C. N. Belcher and C. A. Jennings. In Press. Identification and evaluation of shark bycatch in Georgia’s commercial shrimp trawl fishery with implications for management. Fisheries Management and Ecology. (SEDAR21-DW-23)
14
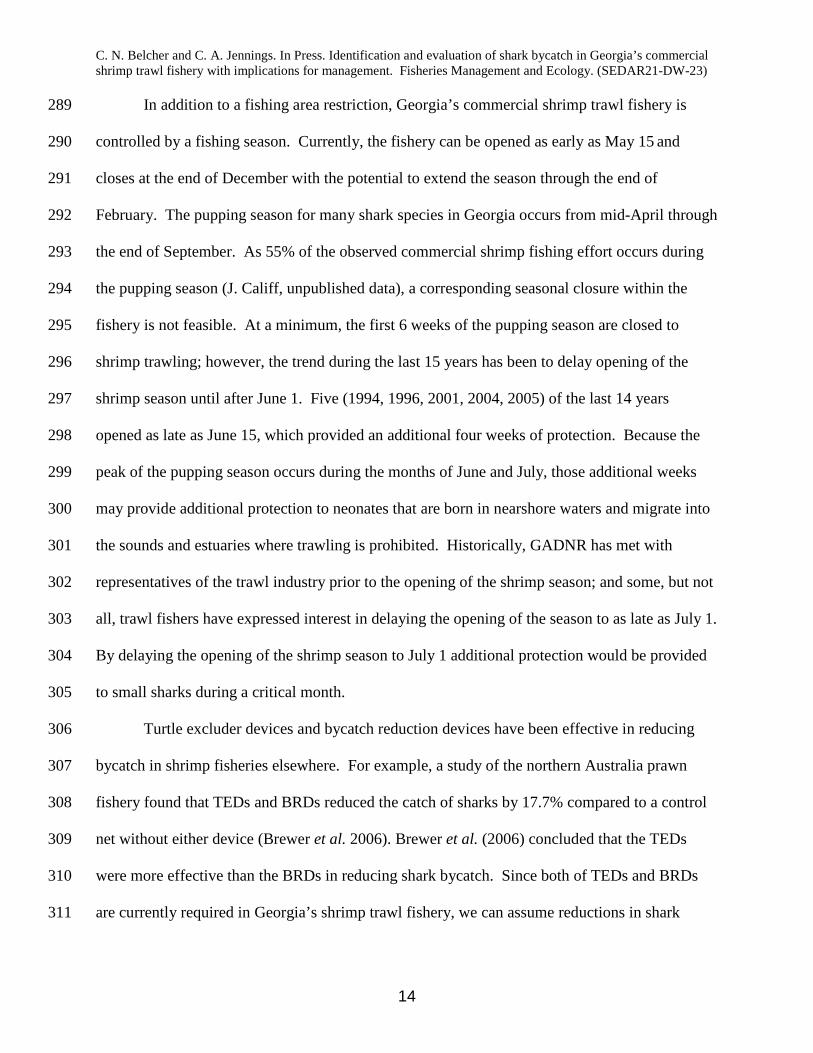
In addition to a fishing area restriction, Georgia’s commercial shrimp trawl fishery is 289
controlled by a fishing season. Currently, the fishery can be opened as early as May 15 and 290
closes at the end of December with the potential to extend the season through the end of 291
February. The pupping season for many shark species in Georgia occurs from mid-April through 292
the end of September. As 55% of the observed commercial shrimp fishing effort occurs during 293
the pupping season (J. Califf, unpublished data), a corresponding seasonal closure within the 294
fishery is not feasible. At a minimum, the first 6 weeks of the pupping season are closed to 295
shrimp trawling; however, the trend during the last 15 years has been to delay opening of the 296
shrimp season until after June 1. Five (1994, 1996, 2001, 2004, 2005) of the last 14 years 297
opened as late as June 15, which provided an additional four weeks of protection. Because the 298
peak of the pupping season occurs during the months of June and July, those additional weeks 299
may provide additional protection to neonates that are born in nearshore waters and migrate into 300
the sounds and estuaries where trawling is prohibited. Historically, GADNR has met with 301
representatives of the trawl industry prior to the opening of the shrimp season; and some, but not 302
all, trawl fishers have expressed interest in delaying the opening of the season to as late as July 1. 303
By delaying the opening of the shrimp season to July 1 additional protection would be provided 304
to small sharks during a critical month. 305
Turtle excluder devices and bycatch reduction devices have been effective in reducing 306
bycatch in shrimp fisheries elsewhere. For example, a study of the northern Australia prawn 307
fishery found that TEDs and BRDs reduced the catch of sharks by 17.7% compared to a control 308
net without either device (Brewer et al. 2006). Brewer et al. (2006) concluded that the TEDs 309
were more effective than the BRDs in reducing shark bycatch. Since both of TEDs and BRDs 310
are currently required in Georgia’s shrimp trawl fishery, we can assume reductions in shark 311
C. N. Belcher and C. A. Jennings. In Press. Identification and evaluation of shark bycatch in Georgia’s commercial shrimp trawl fishery with implications for management. Fisheries Management and Ecology. (SEDAR21-DW-23)
15
bycatch are occurring in that fishery as well. A controlled study that uses a net without TEDs 312
and BRDs is needed to determine the actual reduction amount. 313
Unfortunately, Brewer et al. (2006) did not compare the catch rates among the varying 314
gear types to determine which combinations performed better; nor was net type considered a 315
factor because all vessels were outfitted with the same net type. The present study was able to 316
provide insight into the effect of net type on shark bycatch. As the triple wing had the highest 317
catch rate, a potential gear restriction could be to prohibit its use in the fishery. 318
Although hard TEDs are capable of excluding large fish, the bar spacing (generally 10.2 319
cm) of hard TEDs allows small sharks to pass through. Atlantic sharpnose and bonnethead 320
sharks are born at small sizes (<35 cm TL), which may allow them to more readily pass between 321
the bars than other species. Smaller bar spacing may help reduce the numbers of small sharks 322
caught in trawls because the minimum size of excluded fish would be reduced. Research 323
currently conducted by the University of Georgia’s Marine Extension Service is examining the 324
effects of closer bar spacings on TEDs as a substitute for requiring a BRD (L. Parker University 325
of Georgia – pers. comm.) 326
The 12” x 5” fish eye was the only BRD observed in trawls frequently enough during 327
periods of high shark abundance to be evaluated for effects on shark bycatch. This study found 328
the fish eye was ineffective in reducing the number of sharks captured. Brewer et al. (2006) 329
reached similar conclusions about the limited effects of BRDs on the bycatch of elasmobranchs 330
in an Australian prawn fishery. 331
As scientists work to produce estimates of shark bycatch in shrimp trawls, addressing 332
data collection issues will be beneficial to shark management. For example, sampling all sharks 333
(instead of a subset) from the total catch of the sampled net will increase accuracy of the data on 334
C. N. Belcher and C. A. Jennings. In Press. Identification and evaluation of shark bycatch in Georgia’s commercial shrimp trawl fishery with implications for management. Fisheries Management and Ecology. (SEDAR21-DW-23)
16
which management decisions are made. Because of the large sizes and relatively low abundance 335
of sharks compared to other finfish species captured in trawls, ensuring that shark species are 336
adequately accounted for in a subsample will be difficult. Continuing to use the methodology 337
described in this study to estimate the number of sharks captured will result in less precise 338
estimates of the shark bycatch. 339
340
Conclusions 341
The current management regime for the shrimp trawl fishery in Georgia already provides 342
additional protections to subadult sharks and as such, future restrictions may not be necessary. 343
The closure of the sounds, although not enacted for protection of subadult sharks, has acted as a 344
Marine Protected Area for the majority (53%) of shark nursery habitat in state waters. Delaying 345
the start of the shrimp season would provide protection to small sharks migrating from nearshore 346
to inshore waters. The use of TEDs in nets has helped reduce the number and sizes of sharks 347
captured in shrimp trawls elsewhere (Brewer et al. 2006); however, smaller bar spacing on 348
TEDS may be a gear modification that could help reduce the number of small sharks caught. 349
Presently, Georgia’s commercial fleet is encountering increased attrition because of the high cost 350
of fuel and the reduced market value for domestic product compared to inexpensive foreign 351
imports. This reduction in the number of boats, as well as the reduction in the number of trips, 352
will lead to decreased shark bycatch as well. 353
354
Acknowledgments 355
Dominic Guadagnoli and Alex Ottley were the two marine technicians responsible for the data 356
collection and management associated with this project. Funding for this project was 357
C. N. Belcher and C. A. Jennings. In Press. Identification and evaluation of shark bycatch in Georgia’s commercial shrimp trawl fishery with implications for management. Fisheries Management and Ecology. (SEDAR21-DW-23)
17
administered by the Georgia Department of Natural Resources and was conducted in cooperation 358
with the U. S. Department of Commerce, National Oceanic and Atmospheric Administration, 359
National Marine Fisheries Service and financed under the Atlantic Coastal Fisheries Cooperative 360
Management Act. Robert Cooper, Gary Grossman, and Randy Walker provided useful 361
comments to an earlier draft of this manuscript. The Georgia Cooperative Fish and Wildlife 362
Research Unit is sponsored jointly by the U.S. Geological Survey, the U.S. Fish and Wildlife 363
Service, Georgia Department of Natural Resources, the University of Georgia and the Wildlife 364
Management Institute.365
C. N. Belcher and C. A. Jennings. In Press. Identification and evaluation of shark bycatch in Georgia’s commercial shrimp trawl fishery with implications for management. Fisheries Management and Ecology. (SEDAR21-DW-23)
18
REFERENCES 366
Alverson D. L., Freeberg M. H., Murawski S. A., & Pope J. G. (1994) A Global Assessment of 367
Fisheries Bycatch and Discards. FAO Fisheries Technical Paper No. 339. 233 pp. 368
Barker M. J. & Schluessel V. (2005) Managing global shark fisheries: suggestions for 369
prioritizing management strategies. Aquatic Conservation: Marine and Freshwater 370
Ecosystems 15, 325-347. 371
Belcher, C. N. (2008) Investigating Georgia’s Shark Nurseries: Evaluation of Sampling Gear, 372
Habitat Use, and a Source of Subadult Mortality. Ph.D. Dissertation, Athens, GA: 373
University of Georgia, 137 pp. 374
Brewer, D., Heales D., Milton D., Dell Q., Fry G., Venables B., & Jones P. (2006) The impact of 375
turtle excluder devices and bycatch reduction devices on diverse tropical marine 376
communities in Australia’s northern prawn fishery. Fisheries Research 81, 176-188. 377
Camhi, M. (1998) Sharks on the Line: A State-by-State Analysis of Sharks and Their Fisheries. 378
Islip, NY: National Audubon Society, 156 pp. 379
Castro, J. I. (1983) The Sharks of North American Waters. College Station, TX: Texas A&M 380
University Press, 179 pp. 381
Castro, J. I. (1993) The shark nursery of Bulls Bay, South Carolina, with a review of the shark 382
nurseries of the southeastern coast of the United States. Environmental Biology of Fishes 383
38, 37-48. 384
Conover, W. J. & Iman R. L. (1981) Rank transformations as a bridge between parametric and 385
nonparametric statistics. American Statistician 35 (Suppl. 3), 124-129. 386
Crespi V. & J. Prado. (2008) Fishing Equipment. Bycatch Reduction Devices (BRD). January 387
C. N. Belcher and C. A. Jennings. In Press. Identification and evaluation of shark bycatch in Georgia’s commercial shrimp trawl fishery with implications for management. Fisheries Management and Ecology. (SEDAR21-DW-23)
19
Diamond, S. L. (2003) Estimation of bycatch in shrimp trawl fisheries: a comparison of 389
estimation methods using field data and simulated data. Fishery Bulletin 101 (Suppl. 3), 390
484-500. 391
Dowdy, S. M. & Wearden S. (1983) Statistics for Research. New York: John Wiley and Sons, 392
Inc., 537 pp. 393
Gulf of Mexico Fishery Management Council (1997) Amendment 9 to the Fishery Management 394
Plan for the Shrimp Fishery of the Gulf of Mexico, U. S. Waters. Tampa, FL: Gulf of 395
Mexico Fishery Management Council, 516 pp. 396
Gurshin, C. W. D. (2007) Shark nursery grounds in Sapelo Island National Estuarine Research 397
Reserve, Georgia. In: C. T. McCandless, N. E. Kohler, & H. L. Pratt, Jr. (eds.) Shark 398
Nursery Grounds of the Gulf of Mexico and the East Coast Waters of the United States. 399
Bethesda, MD: American Fisheries Society, pp. 141 - 151. 400
Harrington, D.L., Watson J. W., Parker L. G., Rivers J. B. & Taylor C. W. (1988) Shrimp Trawl 401
Design and Performance. Marine Extension Bulletin Number 12. Athens, GA: 402
University of Georgia, Georgia Seagrant College Program, 41 pp. 403
McCandless, C. T., Kohler N. E., & Pratt, H. L. (eds.) (2007) Shark Nursery Grounds of the Gulf 404
of Mexico and the East Waters of the United States. Bethesda, MD: American Fisheries 405
Society, 390 pp. 406
Mertler, C. A. & Vannatta R. A. (2005) Advanced and Multivariate Statistical Methods: 407
Practical Application and Interpretation, Third Ed. Glendale, CA: Pyrczak Publishing, 408
348 pp. 409
C. N. Belcher and C. A. Jennings. In Press. Identification and evaluation of shark bycatch in Georgia’s commercial shrimp trawl fishery with implications for management. Fisheries Management and Ecology. (SEDAR21-DW-23)
20
National Marine Fisheries Service (1992) Shrimp Trawl Bycatch Characterization Sampling 410
Protocol Manual for Data Collection. Galveston, TX: National Marine Fisheries 411
Service. 62 pp. 412
National Marine Fisheries Service (2007a) Magnuson-Stevens Fishery Conservation and 413
Management Act. Silver Spring, MD : National Marine Fisheries Service. 178 pp. 414
National Marine Fisheries Service (2007b) SEDAR 13 Stock Assessment Report: Small Coastal 415
MD: National Marine Fisheries Service. 375 pp. 417
Page, J. M. (2008) Assessment of Georgia’s Marine Fishery Resources. Final Report, Award 418
No. NA05NMF4071001. Brunswick, GA: Georgia Department of Natural Resources, 419
Coastal Resources Division. 21pp. 420
Shepherd, T. D. & Myers R. A. (2005) Direct and indirect fishery effects on small coastal 421
elasmobranches in the northern Gulf of Mexico. Ecology Letters 8, 1095-1104. 422
South Atlantic Fishery Management Council (1996) Amendment 2 to the Fishery Management 423
Plan for the Shrimp Fishery of the South Atlantic Region. Charleston, SC: South Atlantic 424
Fisheries Management Council. 227 pp. 425
Stevens, J. D., Bonfil R., Dulvy N. K., & Walker P. A. (2000) The effects of fishing on sharks, 426
rays, and chimaeras (chondrichthyans), and the implications for marine ecosystems. 427
ICES Journal of Marine Science 55 (Suppl. 4), 476-494. 428
Stobutzki, I. C., Miller M. J., Heales D. S. & Brewer D. T. (2002) Sustainability of 429
elasmobranchs caught as bycatch in a tropical prawn (shrimp) fishery. Fishery Bulletin. 430
100, 800-821. 431
C. N. Belcher and C. A. Jennings. In Press. Identification and evaluation of shark bycatch in Georgia’s commercial shrimp trawl fishery with implications for management. Fisheries Management and Ecology. (SEDAR21-DW-23)
21
Zar, J. H. (1999) Biostatistical Analysis, Fourth Ed. Upper Saddle River, NJ: Prentice-Hall, 663 432
pp.433
Table 1. Frequency of occurrence for shark species captured in Georgia’s commercial shrimp trawl fishery from April 1995 through 434 March 1998, by month. Frequency of occurrence is calculated as the percentage of tows that captured at least one individual ; n is the 435 number of tows observed. 436 437 438 439 440
C. N. Belcher and C. A. Jennings. In Press. Identification and evaluation of shark bycatch in Georgia’s commercial shrimp trawl fishery with implications for management. Fisheries Management and Ecology. (SEDAR21-DW-23)
23
Table 2. Frequencies, size ranges, and frequency of occurrence for subadult sharks, by species, captured during observed commercial shrimp trawls in Georgia waters between April 1995 and March 1998. Frequency of occurrence is calculated as the number of sets that encountered at least one individual of a given species divided by the total number of sets (n=127).
C. N. Belcher and C. A. Jennings. In Press. Identification and evaluation of shark bycatch in Georgia’s commercial shrimp trawl fishery with implications for management. Fisheries Management and Ecology. (SEDAR21-DW-23)
24
Table 3. Correlations between shark catch rates and tow time and tow speed for observed commercial shrimp trawls in Georgia waters (April 1995 – March 1998).
Tow time, h
Tow speed, km h-1
Species Correlation coefficient P n
Correlation coefficient P n
Atlantic sharpnose shark 0.1 0.368 82 0.03 0.825 74 All shark species combined
0.11 0.324 82 -0.01 0.923 74
C. N. Belcher and C. A. Jennings. In Press. Identification and evaluation of shark bycatch in Georgia’s commercial shrimp trawl fishery with implications for management. Fisheries Management and Ecology. (SEDAR21-DW-23)
25
Figure Legend Figure 1. Map of commercial shrimp trawl locations off the coast of Georgia sampled by bycatch observers between April 1995 and January 1998. < filename: figure 1.tif > Figure 2. Mean catch rates of sharks by commercial shrimp trawls, April 1995 – March 1998. Months with different letters indicate significant differences (P<0.05); months without letters had observed trawls, but sharks were not captured. Error bars represent 95% confidence intervals. < filename: figure 2.tif > Figure 3. Comparison of average catch rates by gear combination for sharks captured as bycatch in Georgia’s commercial shrimp trawl fishery during the months of June and July. Gear combinations with different letters indicate significant differences (P<0.05). Error bars represent 95% confidence intervals. < filename: figure 3.tif >
C. N. Belcher and C. A. Jennings. In Press. Identification and evaluation of shark bycatch in Georgia’s commercial shrimp trawl fishery with implications for management. Fisheries Management and Ecology. (SEDAR21-DW-23)
26
Fig. 1
C. N. Belcher and C. A. Jennings. In Press. Identification and evaluation of shark bycatch in Georgia’s commercial shrimp trawl fishery with implications for management. Fisheries Management and Ecology. (SEDAR21-DW-23)
27
Fig 2.
All species combined
0
5
10
15
20
25
30
April
MayJu
ne July
Augus
t
Septem
ber
Octobe
r
Novembe
r
Decembe
r
Janu
ary
CP
UE
(Num
ber/
Net
/Hou
r)
AA
B
B
Atlantic sharpnose shark
0
2
4
6
8
10
12
14
16
18
20
April
MayJu
ne
July
Augus
t
Septem
ber
Octobe
r
Novembe
r
Decembe
r
Janu
ary
CP
UE
(Num
ber/
Net
/Hou
r)
C
A
B
C. N. Belcher and C. A. Jennings. In Press. Identification and evaluation of shark bycatch in Georgia’s commercial shrimp trawl fishery with implications for management. Fisheries Management and Ecology. (SEDAR21-DW-23)


![BYCATCH Catalog - Midyear 2011[1]](https://static.documents.pub/doc/80x56/54f613604a795949198b48ce/bycatch-catalog-midyear-20111.jpg)


