Identification and genetic mapping of variant forms of puroindoline b expressed in developing wheat grain Mark Wilkinson a , Yongfang Wan a , Paola Tosi a , Michelle Leverington b , John Snape b , Rowan A.C. Mitchell a , Peter R. Shewry a, * a Rothamsted Research, Harpenden, Hertfordshire AL5 2JQ, UK b John Innes Centre, Colney Lane, Norwich NR4 7UH, UK article info Article history: Received 2 January 2008 Received in revised form 11 March 2008 Accepted 18 March 2008 Keywords: Wheat Grain hardness Puroindolines Grain development Genetic mapping abstract Transcripts encoding three novel variant forms of puroindoline b have been identified in developing seeds of wheat. These show 57–60% sequence identity with the wild type form of Pin b but all lack one of the three tryptophan residues present in the ‘‘tryptophan loop’’ region of the wild type protein. Counts of ESTs and array analysis indicate that the transcripts encoding variant forms of Pin b are about an order of magnitude less abundant than those encoding wild type Pin b while array analysis also shows that expression of the variant form 1 declines more rapidly than that of the wild type form during the later stages of grain development. The gene(s) encoding variant form 1, named Pinb-A2, were mapped to the long arm of chromosome 7A of bread wheat where they show linkage to novel QTLs for hardness which have been identified in two doubled haploid populations derived from crosses between hard parental cultivars (Shamrock Shango, Malacca Charger). Ó 2008 Elsevier Ltd. All rights reserved. 1. Introduction Puroindolines (Pins) are a group of proteins which are restricted to seeds of wheat and related cereal species. They belong to an extensive superfamily of plant proteins which includes a number of other cereal seed proteins but are characterised by the presence of a short tryptophan-rich sequence (Douliez et al., 2000; Shewry et al., 2004). Two types of Pins are present in wheat, which differ mainly in the presence of either five (Pin a) or three (Pin b) tryp- tophan residues (Blochet et al., 1993). Although Pins were discov- ered as recently as 1993 they have since become one of the most intensively studied groups of cereal seed proteins. This is because of their role in determining grain texture, a property of fundamental importance in determining the milling and baking performance of wheat (Pomeranz and Williams, 1990). A range of studies have been carried out including extensive surveys of allelic variation in Pins in lines differing in grain texture and analyses of Pin alleles in the progeny of crosses between hard and soft genotypes (reviewed by Bhave and Morris, 2008a,b; Morris, 2002). These studies have shown that the expression of genes encoding the wild type forms of Pin a and Pin b results in soft texture while hardness is associated with two types of mutations. These are either ‘‘null’’ mutations which result in the silencing of the genes encoding Pin a and/or Pin b or mutations which affect the amino acid sequence of the Pin b protein. The structural genes encoding Pin a and Pin b map to the major Hardness (Ha) locus, which is located on chromosome 5D of bread wheat (Law et al., 1978), and nucleotide sequencing has shown that this locus comprises three genes within a region of about 82,000 bp (Chantret et al., 2005). These are the Pina and Pinb structural genes and the Gsp-1 gene encoding a protein called ‘‘grain softness pro- tein’’ (GSP) which is structurally related to the Pins. Genes related to Pina and Pinb are present in diploid species with genomes related to the A and B genomes of bread wheat but they appear to have been lost by independent deletions from the A and B genomes of bread wheat and tetraploid Triticum turgidum which includes cultivated durum (pasta) wheat. As a result durum wheat is harder in texture than even the hardest bread wheat genotypes. The fact that GSP genes are present, and presumably expressed, in durum wheat indicates that it does not play a major Abbreviations: CE, capillary electrophoresis; dbEST, GenBank Expressed Sequence Tag Database; DHLs, doubled haploid lines; ESTs, expressed sequence tags; GSP, grain softness protein; MDE, mutation detection enhancement matrix; MOPS, 3-[N-morpholino]propanesulfonic acid; NIR, near infra-red; PCR, poly- merase chain reaction; QTL, quantitative trait locus; SKCS, single kernel charac- terisation system; SSCP, single strand conformation polymorphism; SSR, simple sequence repeat; TEMED, tetramethylethylene diamine; UV, ultraviolet. * Corresponding author. Tel.: þ44 1582 763133; fax: þ44 1582 763010. E-mail address: [email protected](P.R. Shewry). Contents lists available at ScienceDirect Journal of Cereal Science journal homepage: www.elsevier.com/locate/jcs 0733-5210/$ – see front matter Ó 2008 Elsevier Ltd. All rights reserved. doi:10.1016/j.jcs.2008.03.007 Journal of Cereal Science 48 (2008) 722–728
Transcript
lable at ScienceDirect
Journal of Cereal Science 48 (2008) 722–728
Contents lists avai
Journal of Cereal Science
journal homepage: www.elsevier .com/locate/ jcs
Identification and genetic mapping of variant forms of puroindoline bexpressed in developing wheat grain
Mark Wilkinson a, Yongfang Wan a, Paola Tosi a, Michelle Leverington b, John Snape b,Rowan A.C. Mitchell a, Peter R. Shewry a,*
a Rothamsted Research, Harpenden, Hertfordshire AL5 2JQ, UKb John Innes Centre, Colney Lane, Norwich NR4 7UH, UK
a r t i c l e i n f o
Article history:Received 2 January 2008Received in revised form 11 March 2008Accepted 18 March 2008
0733-5210/$ – see front matter � 2008 Elsevier Ltd.doi:10.1016/j.jcs.2008.03.007
a b s t r a c t
Transcripts encoding three novel variant forms of puroindoline b have been identified in developing seedsof wheat. These show 57–60% sequence identity with the wild type form of Pin b but all lack one of thethree tryptophan residues present in the ‘‘tryptophan loop’’ region of the wild type protein. Counts of ESTsand array analysis indicate that the transcripts encoding variant forms of Pin b are about an order ofmagnitude less abundant than those encoding wild type Pin b while array analysis also shows thatexpression of the variant form 1 declines more rapidly than that of the wild type form during the laterstages of grain development. The gene(s) encoding variant form 1, named Pinb-A2, were mapped to thelong arm of chromosome 7A of bread wheat where they show linkage to novel QTLs for hardness whichhave been identified in two doubled haploid populations derived from crosses between hard parentalcultivars (Shamrock� Shango, Malacca� Charger).
� 2008 Elsevier Ltd. All rights reserved.
1. Introduction
Puroindolines (Pins) are a group of proteins which are restrictedto seeds of wheat and related cereal species. They belong to anextensive superfamily of plant proteins which includes a number ofother cereal seed proteins but are characterised by the presence ofa short tryptophan-rich sequence (Douliez et al., 2000; Shewryet al., 2004). Two types of Pins are present in wheat, which differmainly in the presence of either five (Pin a) or three (Pin b) tryp-tophan residues (Blochet et al., 1993). Although Pins were discov-ered as recently as 1993 they have since become one of the mostintensively studied groups of cereal seed proteins. This is because oftheir role in determining grain texture, a property of fundamentalimportance in determining the milling and baking performance ofwheat (Pomeranz and Williams, 1990).
A range of studies have been carried out including extensivesurveys of allelic variation in Pins in lines differing in grain textureand analyses of Pin alleles in the progeny of crosses between hardand soft genotypes (reviewed by Bhave and Morris, 2008a,b;Morris, 2002). These studies have shown that the expression ofgenes encoding the wild type forms of Pin a and Pin b results in softtexture while hardness is associated with two types of mutations.These are either ‘‘null’’ mutations which result in the silencing ofthe genes encoding Pin a and/or Pin b or mutations which affect theamino acid sequence of the Pin b protein.
The structural genes encoding Pin a and Pin b map to the majorHardness (Ha) locus, which is located on chromosome 5D of breadwheat (Law et al., 1978), and nucleotide sequencing has shown thatthis locus comprises three genes within a region of about 82,000 bp(Chantret et al., 2005). These are the Pina and Pinb structural genesand the Gsp-1 gene encoding a protein called ‘‘grain softness pro-tein’’ (GSP) which is structurally related to the Pins.
Genes related to Pina and Pinb are present in diploid specieswith genomes related to the A and B genomes of bread wheat butthey appear to have been lost by independent deletions from the Aand B genomes of bread wheat and tetraploid Triticum turgidumwhich includes cultivated durum (pasta) wheat. As a result durumwheat is harder in texture than even the hardest bread wheatgenotypes. The fact that GSP genes are present, and presumablyexpressed, in durum wheat indicates that it does not play a major
M. Wilkinson et al. / Journal of Cereal Science 48 (2008) 722–728 723
role in determining grain texture (Chantret et al., 2005) and this issupported by the analysis of genetic stocks of cv. Chinese Springdiffering in GSP content (Tranquilli et al., 2002).
Nevertheless genetic studies show that the Ha locus does notaccount for the full range of variation in grain texture in breadwheat, and minor quantitative trait loci (QTLs) have been mappedon several chromosomes (Galande et al., 2001; Law et al., 1978;Sourdille et al., 1996; Turner et al., 2004).
We are therefore interested in identifying novel componentswhich may contribute to variation in grain texture of wheat andreport the characterisation of transcripts encoding novel variantforms of Pin b which are expressed in the developing wheat grain.The biological role of these proteins has not been established butgenetic analysis shows that they map to chromosome 7A which isalso the location of minor hardness QTLs identified in two crossesbetween cultivars with hard grain texture.
2. Materials and methods
2.1. PCR amplification and sequence analysis
Total RNA for RT-PCR was isolated from developing whole grainsof bread wheat cv. Hereward (at 14 days after anthesis) and durumwheat cv. Ofanto (at 21 days after anthesis) following the method ofChang et al. (1993). The integrity of RNA was checked on 1.5% MOPsgel and an Agilent Bioanalyser 2000.
For cDNA synthesis, 5 mg of total RNA was digested with RNase-free DNase (from Promega or Ambion) to remove genomic DNA,according to the manufacturer’s instructions. The DNase-treatedRNA was reverse transcribed into cDNA using oligo-d(T)23 primer(Sigma) and SuperScript� III reverse transcriptase (Invitrogen).Twenty-five nanograms of cDNA was used for PCR amplification ofPin b variants.
Genomic DNA was extracted from leaf material of seedlingsusing a Promega Wizard kit according to the manufacturer’s in-structions. The primers and conditions for PCR were the same asthose used for cDNA amplification.
Full-length Pin variant forms 1 and 2 were amplified with gene-specific primers. The forward primers used to amplify Pin b variants1 and 2 were: Pinb-VF-50-ATGAAGACCTTATTCCTCCTAGCTC-30. Thereverse primer for Pin b variant 1 was a degenerate primer Pinb-VR1-50-TCAGTAGTAATAGCCATTAGTAKGGACG-30 while the reverseprimer for Pin b variant 2 was also degenerate, Pinb-VR2-50-TCACTAGTAATAGCCATTAKTAGCGACA-30, where K is Gþ T.
The reactions were performed in 25 ml containing approxi-mately 200 ng of cDNA, 0.5 mM of each primer, 200 mM of eachdNTP, 1� Phusion DNA polymerase reaction buffer and 0.03 U/ml ofPhusion DNA polymerase (Finnzymes Oy, Keilaranta 16A, 02150Espoo, Finland). The amplification conditions used for cv. Herewardwere 40 cycles at 96 �C for 15 min (Qiagen Hotstar Taq DNA poly-merase), 30 s at 96 �C, 1 min at 50 �C, 1 min at 72 �C and a finalextension of 7 min at 72 �C. The conditions for cv. Ofanto were 98 �Cfor 3 min, 35 cycles at 98 �C for 17.5 min, 30 s at 60 �C, 90 s at 72 �Cand a final extension of 10 min at 72 �C.
Five microlitres of the PCR products were analysed on 1.0% (w/v)agarose gels, stained with ethidium bromide and visualised by UVlight. PCR products were purified using a Wizard� SV Gel and PCRClean-Up System (Promega). Fragments were then ligated intopGem�-T Easy Vector System (Promega) and clones obtained usingthe Wizard� Plus SV Minipreps DNA purification system (Promega).All of the above procedures were carried out according to themanufacturer’s instructions. Sequencing reactions were performedwith the BigDye Terminator Version 3.1 Cycle Sequencing Kit (ABI)and all reactions were analysed at Geneservice (Department ofBiochemistry, University of Oxford, South Parks Road, Oxford OX1
3QU). Annotations of sequences were carried out using theSequencher 4.1 software package (MAC).
Phylogenetic trees were derived from multiple alignments ofprotein sequences with the MUSCLE algorithm (Edgar, 2004), re-moval of gapped columns followed by phylogeny analysis in thephyml package (Guindon et al., 2005) using the Whelan andGoldman (2001) model which was found to give the highest like-lihood of the models tested. An initial run optimised the gammaand invariant proportion parameters to 3.09 and 0.08, respectively.These were then held constant for 1000 runs for bootstrap non-parametric analysis.
2.2. Array analysis
The wheat Affymetrix Genechip� array data sets on developingwhole grain of hexaplod wheat cv. Hereward described by Wanet al. (2008) were normalised using gcRMA (Wu et al., 2004) andanalysed using GeneSpring GX 7.0. These data are deposited in theArrayExpress database (accession E-MEXP-1193).
2.3. Mapping and linkage analysis
To map the new Pin locus, named Pinb-2, in bread wheat, twoalternate but overlapping sets of primers were designed from the 30
untranslated region. Both sets of primers amplified polymorphicproducts on the parental varieties Spark and Rialto at an annealingtemperature of 52 �C, and showed the same scores on an initial testof 30 doubled haploid lines. The Pinb-2-1 forward primer was50-ACCTTATTCCTCCTAGCTCTC-30 and the reverse primer 50-TAGTTGCTGGCAACACTGGTC-30. The Pinb-2-2 forward primer was50-CGGTGCTTGGCTGTGAAG-30 and the reverse primer 50-CAC-TAGTAATAGCCATTATTAGCGAC-30.
Single strand conformation polymorphism (SSCP) analysis usingthe mutation detection enhancement (MDE�) matrix was used todetect sequence polymorphisms in the PCR amplicons. Sampleswere denatured at 95 �C for 3 min, plunged into an ice water bath,and loaded onto standard sequencing size gels (30 cm� 40 cm�0.4 mm) containing 12.5 ml MDE gel solution (Cambrex BioScience), 2 ml 20� TTE buffer (National Diagnostics), 27 ml water,and 9 ml 50% glycerol solution, polymerised by the addition of300 ml 10% (w/v) ammonium persulphate and 30 ml TEMED. Elec-trophoresis was carried out for 17 h at a constant power of 4.5 W at5 �C, and gels were stained with silver (Bassam et al., 1991).
For mapping the intra-chromosomal location of the new Pinb-2locus, the locus was genotyped on three recombinant doubledhaploid populations: Spark� Rialto, Shamrock� Shango and Mal-acca� Charger. These genotyping data were combined with alreadyavailable extensive genotype files based on SSR and DArT markerson these populations. Maps were then re-calculated using themapping software JoinMap Vs 3.0 to position the Pin locus. The LODthreshold selected was between 4 and 6, depending on the linkagegroup. The distances for recombination were calculated accordingto the Kosambi mapping function.
The grain hardness of the whole populations of Shamrock�Shango and Malacca� Charger recombinant doubled haploid lineswas measured on milled grain by NIR using a Bran and Lubbe NIR-Spectrometer Infralyser 2000 and calibrations validated by com-parison with measurements made with the Perten Single KernelCharacterisation System (SKCS) (Turner et al., 2004). These datawere obtained from pooled seed of each doubled haploid linegrown in two separate randomised and replicated experiments(three replicates per site) at two sites in Eastern England in 2005.The QTL analysis for hardness was carried out on the phenotypicdata obtained from the NIR measurements and analysed using QTLCafe software. The hardness of the parental lines from the samefield plots was also measured using the Perten SKCS.
Table 1Comparison of public bread wheat ESTs with the three Pin b variants identified here
Variant Accession Library Cultivar Alignedlength
Number ofdifferent SNPs
v1(Hereward)
CA707187 Kernel7 daa
Not given 457 7
CA712848a Kernel14 daa
Not given 415 16
AL814830 Endosperm14 daa
Mercia 161 3
BU607175 Seed Not given 282 8
v2(Hereward)
CD909262 Grain468 �C daa
Recital 468 8
CD885294 Grain118 �C daa
Recital 469 7
CD885317 Grain118 �C daa
Recital 468 7
CD918271 Grain608 �C daa
Recital 468 8
CD921178 Grain608 �C daa
Recital 362 7
CD901976 Grain356 �C daa
Recital 107 7
CD900486a Grain356 �C daa
Recital 468 7
CD919901 Grain608 �C daa
Recital 463 15
v3(Durum)
AL812097 Endosperm10 dpa
Mercia 357 1
BQ167247 Endosperm5–30 daa
Cheyenne 446 1
a These ESTs are in the opposite orientation to our variant sequences.
M. Wilkinson et al. / Journal of Cereal Science 48 (2008) 722–728724
3. Results
3.1. Identification of ESTs (expressed sequence tags) forPin b variants
The dbEST database of Genbank (Boguski et al., 1993) nowincludes the sequences of over 1 million wheat ESTs. ESTs areobtained by random sequencing of cDNA libraries constructed usingmRNA fractions from wheat tissues, with each EST corresponding toa single mRNA. The ESTs therefore correspond to genes expressed inthe tissue of origin and, because the sequencing is random, thenumbers of different ESTs derived from a given tissue give an esti-mate of the relative levels of gene expression in this tissue.
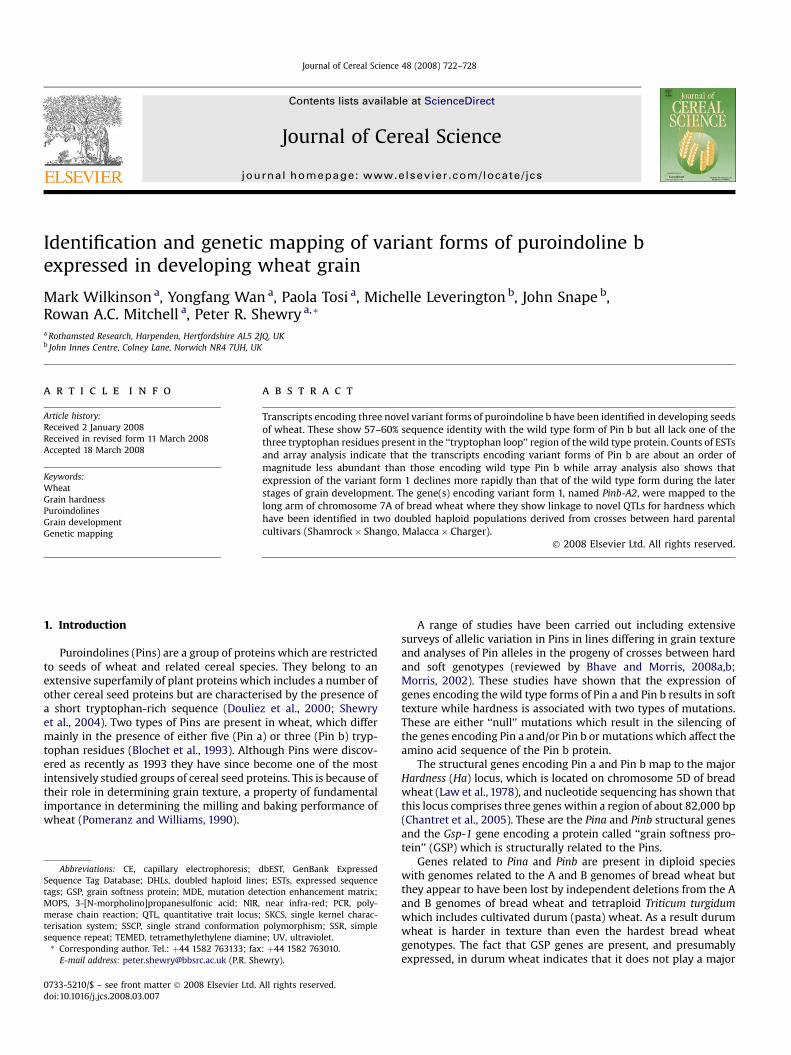
Fig. 1. Alignment of deduced protein sequences for
The wheat sequences in the dbEST database were thereforesearched to identify sequences related to those of Pin b. A total of163 ESTs corresponding to Pin b were identified, all of which werederived from grain or unspecified tissue libraries. In addition, threeadditional sequence types which were related but not identical toPin b were identified, all being derived from grain libraries. Thesewere called Pin b variants 1 (four ESTs from four libraries includingone EST from cv. Mercia), 2 (eight ESTs from four libraries all fromthe same cultivar, Recital) and 3 (two ESTs from cvs. Mercia andCheyenne). The accession numbers and other characteristics ofthese ESTs are given in Table 1.
3.2. Isolation and characterisation of cDNAs
EST sequences are generated by high throughput sequencing ofsingle cDNA strands and are frequently incomplete or containerrors. To confirm the authenticity of the novel Pin variants wetherefore isolated and sequenced cDNAs from the cv. Hereward,using primers designed based on the sequences of the ESTs. Thesewere designed to be specific for variants 1 and 2 but both would beexpected to also amplify variant 3.
This confirmed the presence of mRNAs encoding variants 1 and2 of Pin b in developing grain of cv. Hereward. Sequences corre-sponding to variant 3 were not amplified from this cultivar butrelated ESTs were derived from two bread wheat cultivars (Merciaand Cheyenne) (Table 1). PCR amplification of mRNA fromdeveloping grain of Triticum durum cv. Ofanto (tetraploid pastawheat, genome constitution AABB) using both primers setsamplified sequences encoding variant 3 but not variants 1 and 2while PCR using genomic DNA amplified variants 1 and 3. Thetranslated sequence alignments for the three Pin b variants andwild type Pin b are shown in Fig. 1 and the sequences of Pin b var-iants 1, 2 and 3 are deposited in EMBL/Genbank/DDBJ with acces-sion numbers of AM944731, AM9944732 and AM99734,respectively. The numbers of single nucleotide polymorphisms(SNPs) between these sequences and the ESTs are listed in Table 1.
It should be noted that the variants contain the tryptophan-richloop region between cysteine residues 3 and 4 which is used todefine puroindolines as a group. However, the first tryptophanresidue at position 39 of the mature Pin b protein (position 81 inFig. 1) is replaced by arginine or tyrosine in the variants, and onlytwo tryptophans are present. The overall sequence identitybetween variants 1, 2 and 3 with the Pin b (Pinb-D1a) protein was57%, 57% and 60%, respectively. Variant 1 has 93.3% and 91.8%identity at the DNA level with variants 2 and 3, respectively, while
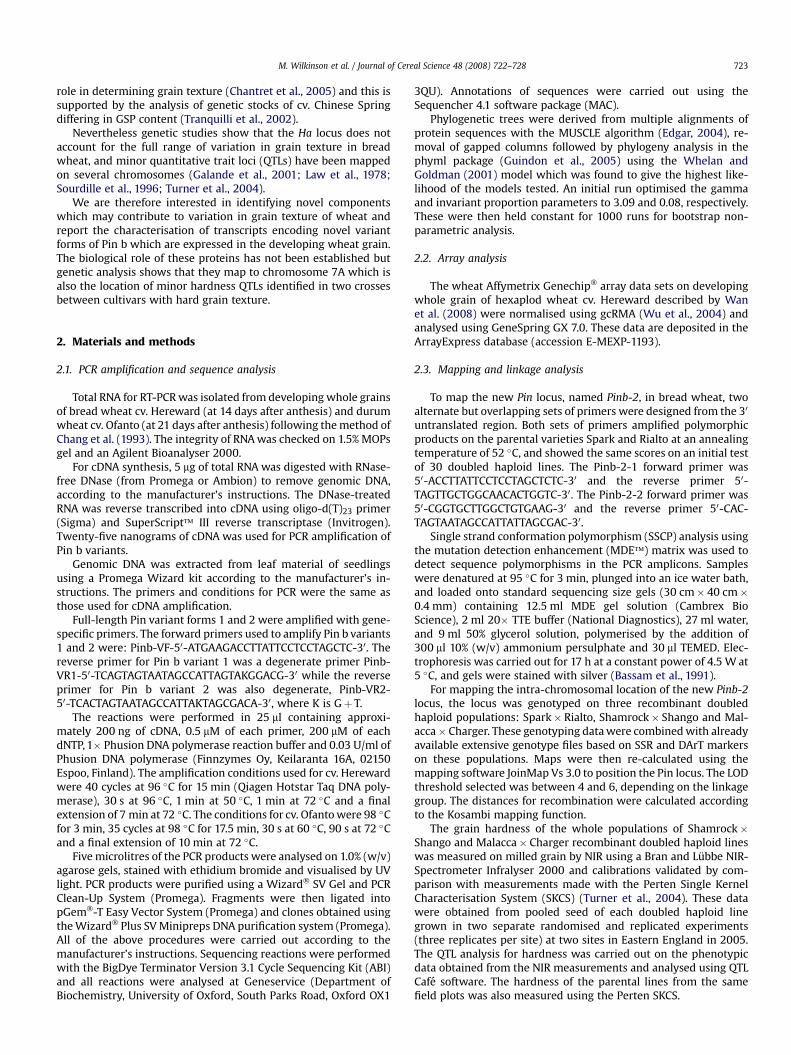
Fig. 2. Phylogenetic tree derived from alignment shown in Fig. 1. The values shown onbranches are the percentage of the trees which support this topology from 1000repeated runs in a bootstrap analysis. The TIGR rice locus Os06g31070, which is theonly close homolog to these genes in rice (blastp match to GSP has expect value<10�10), was included as an outgroup to root the tree. Scale bar indicates thehorizontal distance corresponding to a fractional change of 0.1 in the number ofidentical residues.
M. Wilkinson et al. / Journal of Cereal Science 48 (2008) 722–728 725
variant 2 has 94.3% identity with variant 3. Comparison of theamino acid sequences with GSP-1 shows 38%, 40% and 42% identitywith variants 1–3, respectively. The variants also differ from GSP-1in their tryptophan loop region, with only one conserved trypto-phan residue in common. These tryptophan residues have beenimplicated in the ability of puroindolines to bind lipids in vitro(Kooijman et al., 1997) indicating that the variant Pins differ in thisrespect from Pin b. Phylogenetic analysis suggested that the Pinb variant sequences diverged from the ancestor of Pin b after thePin b and Pin a ancestral lines had separated (Fig. 2).
PCR analysis was also used to amplify variant Pin sequencesfrom genomic DNA of diploid species with genomes related to thoseof bread wheat, Triticum monococcum (A genome), Triticum tauschii(D genome) Triticum searsii and Aegilops speltoides (both S genome).Sequences related to variants 1, 2 and 3 were amplified from T.searsii and Ae. speltoides and to variant 1 from T. tauschii. However,in most cases multiple isoforms of each variant were amplified,some containing in-frame stop codons meaning that they areunlikely to be expressed. This suggests that multiple gene dupli-cation events have occurred.
3.3. Expression of Pin variants in developing grain
The low numbers of ESTs for Pin b variants compared withthose for Pin a and Pin b indicate that they are expressed at low
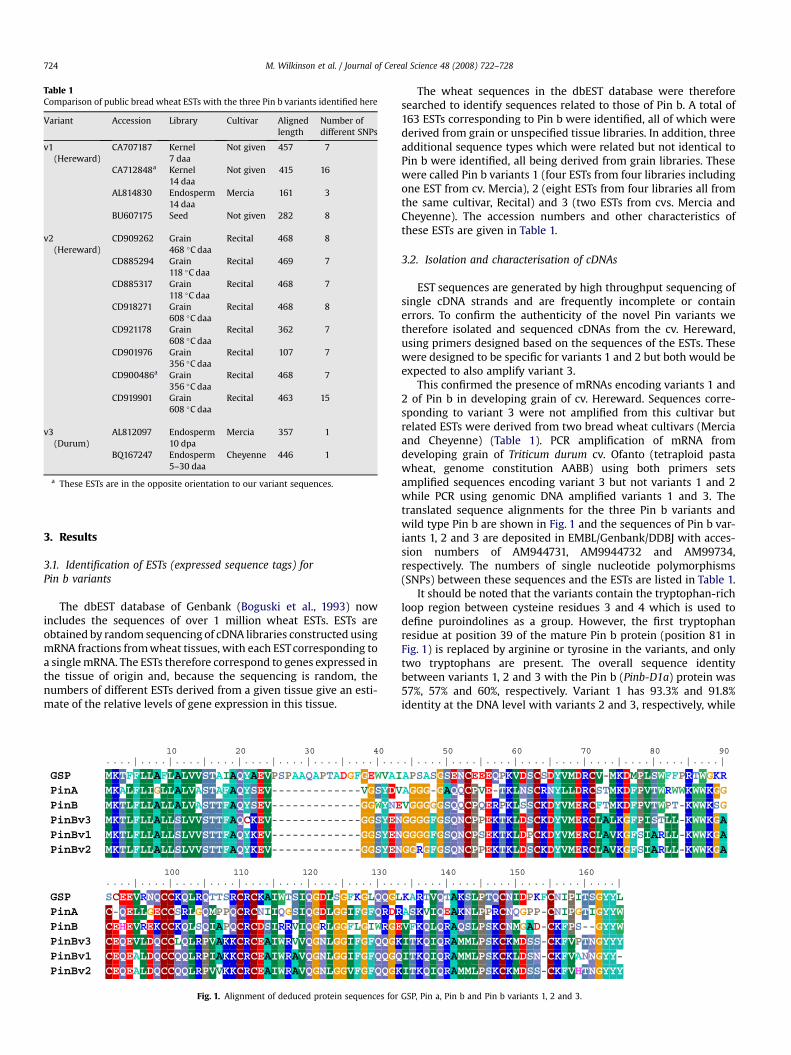
Fig. 3. Expression of Pin b and Pin b variant 1 in hexaploid wheat (cv. Hereward) grain degrown in a constant 18/15 �C day/night regime; in the four right hand panels, plants were gr(c) 23/15 �C, watering to 100% field capacity; dry (d) 23/15 �C, watering to 44% field capacity;to 44% field capacity. The left hand panel shows the mean of analyses of duplicate biologicshow the results of single analyses.
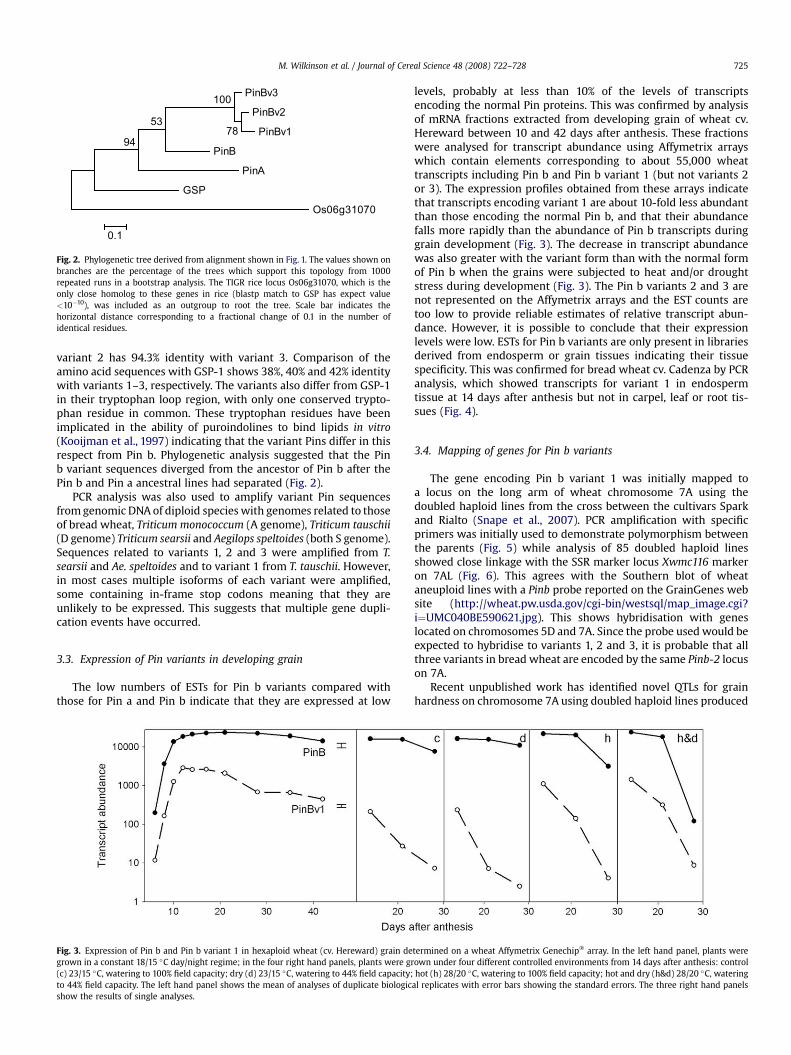
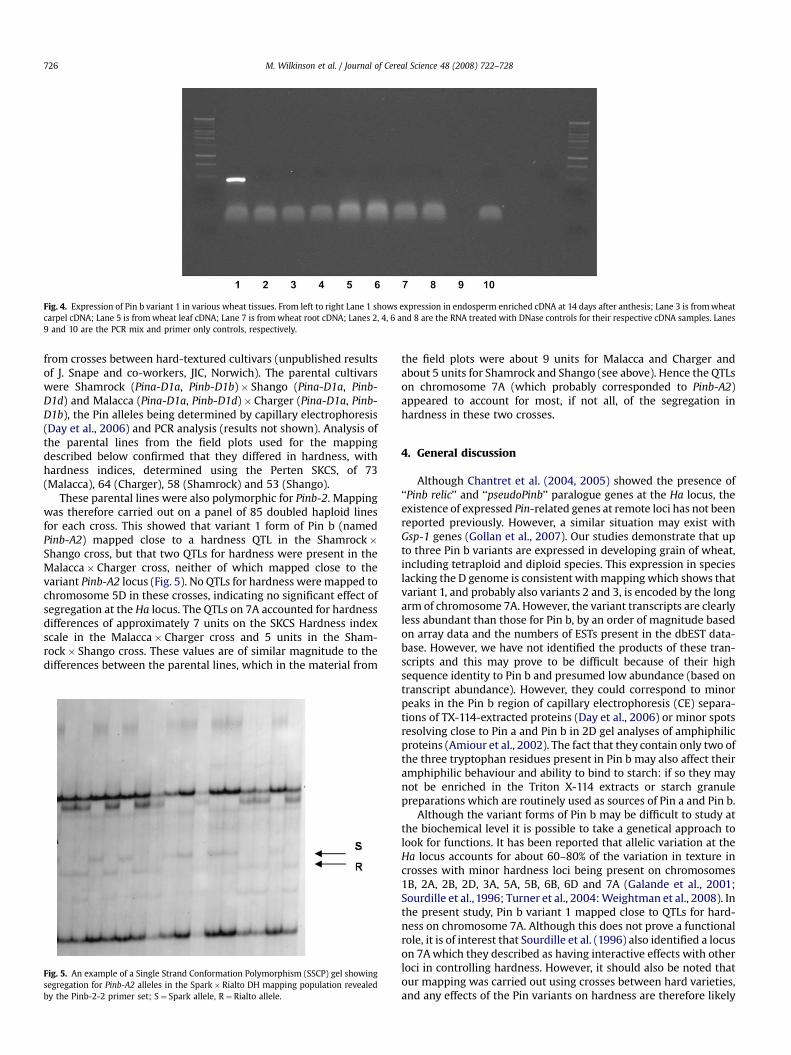
levels, probably at less than 10% of the levels of transcriptsencoding the normal Pin proteins. This was confirmed by analysisof mRNA fractions extracted from developing grain of wheat cv.Hereward between 10 and 42 days after anthesis. These fractionswere analysed for transcript abundance using Affymetrix arrayswhich contain elements corresponding to about 55,000 wheattranscripts including Pin b and Pin b variant 1 (but not variants 2or 3). The expression profiles obtained from these arrays indicatethat transcripts encoding variant 1 are about 10-fold less abundantthan those encoding the normal Pin b, and that their abundancefalls more rapidly than the abundance of Pin b transcripts duringgrain development (Fig. 3). The decrease in transcript abundancewas also greater with the variant form than with the normal formof Pin b when the grains were subjected to heat and/or droughtstress during development (Fig. 3). The Pin b variants 2 and 3 arenot represented on the Affymetrix arrays and the EST counts aretoo low to provide reliable estimates of relative transcript abun-dance. However, it is possible to conclude that their expressionlevels were low. ESTs for Pin b variants are only present in librariesderived from endosperm or grain tissues indicating their tissuespecificity. This was confirmed for bread wheat cv. Cadenza by PCRanalysis, which showed transcripts for variant 1 in endospermtissue at 14 days after anthesis but not in carpel, leaf or root tis-sues (Fig. 4).
3.4. Mapping of genes for Pin b variants
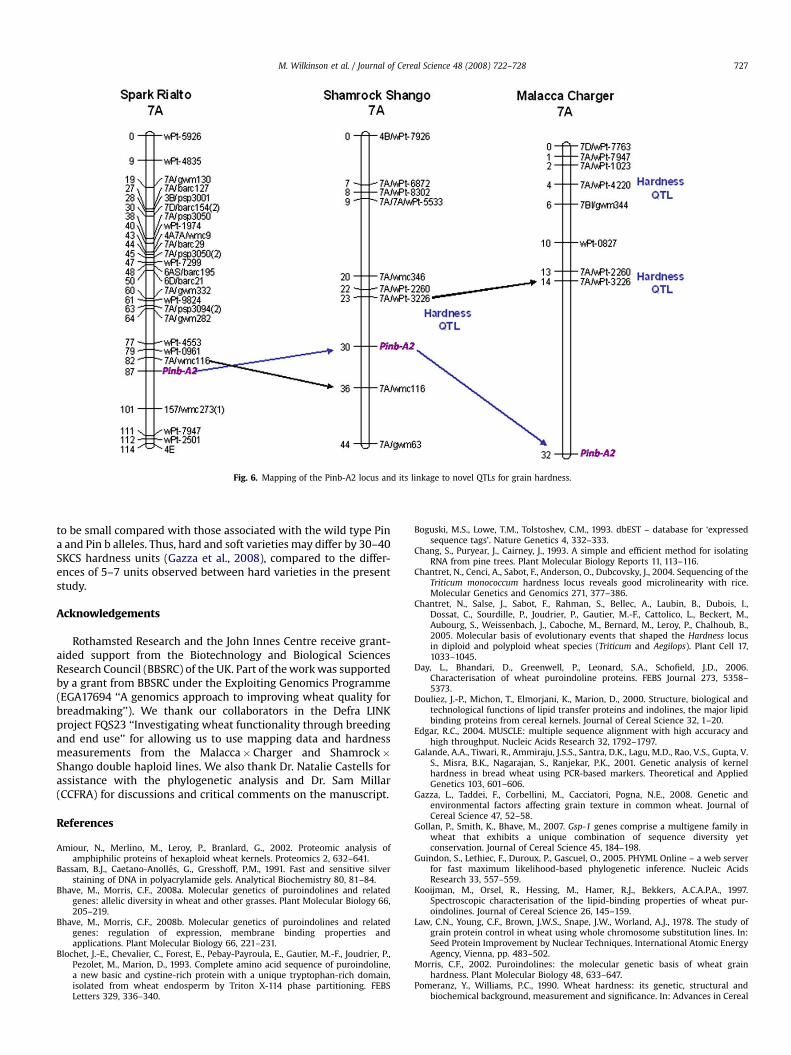
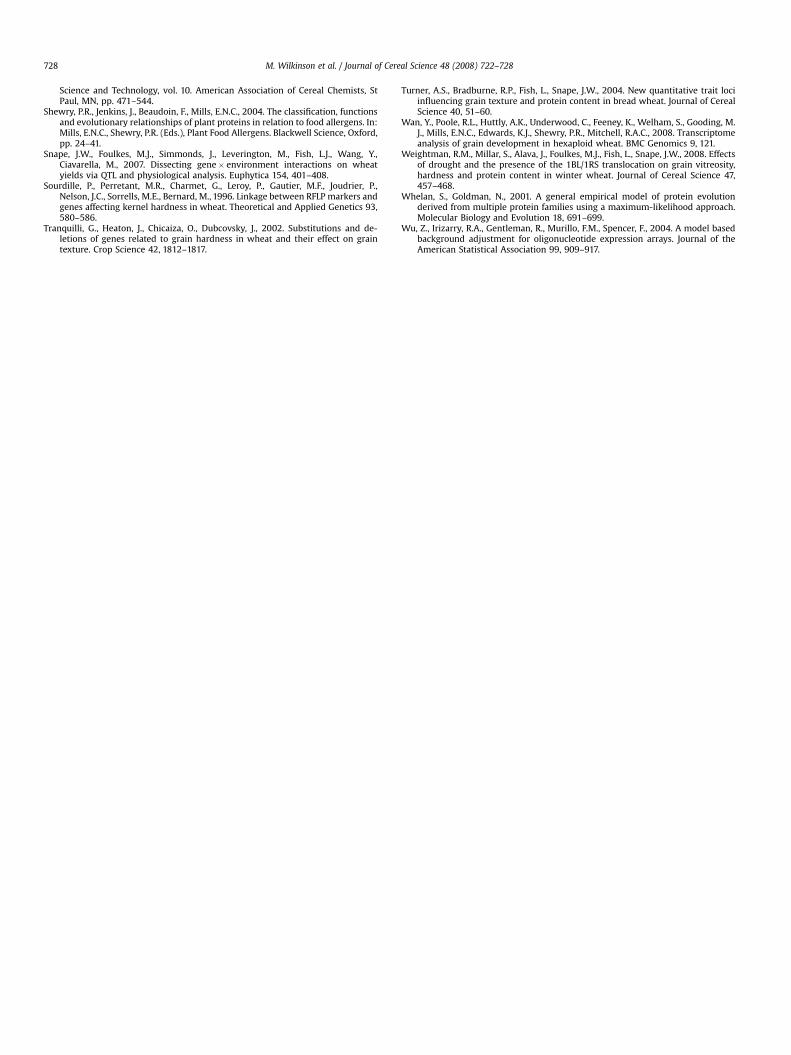
The gene encoding Pin b variant 1 was initially mapped toa locus on the long arm of wheat chromosome 7A using thedoubled haploid lines from the cross between the cultivars Sparkand Rialto (Snape et al., 2007). PCR amplification with specificprimers was initially used to demonstrate polymorphism betweenthe parents (Fig. 5) while analysis of 85 doubled haploid linesshowed close linkage with the SSR marker locus Xwmc116 markeron 7AL (Fig. 6). This agrees with the Southern blot of wheataneuploid lines with a Pinb probe reported on the GrainGenes website (http://wheat.pw.usda.gov/cgi-bin/westsql/map_image.cgi?i¼UMC040BE590621.jpg). This shows hybridisation with geneslocated on chromosomes 5D and 7A. Since the probe used would beexpected to hybridise to variants 1, 2 and 3, it is probable that allthree variants in bread wheat are encoded by the same Pinb-2 locuson 7A.
Recent unpublished work has identified novel QTLs for grainhardness on chromosome 7A using doubled haploid lines produced
termined on a wheat Affymetrix Genechip� array. In the left hand panel, plants wereown under four different controlled environments from 14 days after anthesis: controlhot (h) 28/20 �C, watering to 100% field capacity; hot and dry (h&d) 28/20 �C, watering
al replicates with error bars showing the standard errors. The three right hand panels
Fig. 4. Expression of Pin b variant 1 in various wheat tissues. From left to right Lane 1 shows expression in endosperm enriched cDNA at 14 days after anthesis; Lane 3 is from wheatcarpel cDNA; Lane 5 is from wheat leaf cDNA; Lane 7 is from wheat root cDNA; Lanes 2, 4, 6 and 8 are the RNA treated with DNase controls for their respective cDNA samples. Lanes9 and 10 are the PCR mix and primer only controls, respectively.
M. Wilkinson et al. / Journal of Cereal Science 48 (2008) 722–728726
from crosses between hard-textured cultivars (unpublished resultsof J. Snape and co-workers, JIC, Norwich). The parental cultivarswere Shamrock (Pina-D1a, Pinb-D1b)� Shango (Pina-D1a, Pinb-D1d) and Malacca (Pina-D1a, Pinb-D1d)� Charger (Pina-D1a, Pinb-D1b), the Pin alleles being determined by capillary electrophoresis(Day et al., 2006) and PCR analysis (results not shown). Analysis ofthe parental lines from the field plots used for the mappingdescribed below confirmed that they differed in hardness, withhardness indices, determined using the Perten SKCS, of 73(Malacca), 64 (Charger), 58 (Shamrock) and 53 (Shango).
These parental lines were also polymorphic for Pinb-2. Mappingwas therefore carried out on a panel of 85 doubled haploid linesfor each cross. This showed that variant 1 form of Pin b (namedPinb-A2) mapped close to a hardness QTL in the Shamrock�Shango cross, but that two QTLs for hardness were present in theMalacca� Charger cross, neither of which mapped close to thevariant Pinb-A2 locus (Fig. 5). No QTLs for hardness were mapped tochromosome 5D in these crosses, indicating no significant effect ofsegregation at the Ha locus. The QTLs on 7A accounted for hardnessdifferences of approximately 7 units on the SKCS Hardness indexscale in the Malacca� Charger cross and 5 units in the Sham-rock� Shango cross. These values are of similar magnitude to thedifferences between the parental lines, which in the material from
Fig. 5. An example of a Single Strand Conformation Polymorphism (SSCP) gel showingsegregation for Pinb-A2 alleles in the Spark� Rialto DH mapping population revealedby the Pinb-2-2 primer set; S¼ Spark allele, R¼ Rialto allele.
the field plots were about 9 units for Malacca and Charger andabout 5 units for Shamrock and Shango (see above). Hence the QTLson chromosome 7A (which probably corresponded to Pinb-A2)appeared to account for most, if not all, of the segregation inhardness in these two crosses.
4. General discussion
Although Chantret et al. (2004, 2005) showed the presence of‘‘Pinb relic’’ and ‘‘pseudoPinb’’ paralogue genes at the Ha locus, theexistence of expressed Pin-related genes at remote loci has not beenreported previously. However, a similar situation may exist withGsp-1 genes (Gollan et al., 2007). Our studies demonstrate that upto three Pin b variants are expressed in developing grain of wheat,including tetraploid and diploid species. This expression in specieslacking the D genome is consistent with mapping which shows thatvariant 1, and probably also variants 2 and 3, is encoded by the longarm of chromosome 7A. However, the variant transcripts are clearlyless abundant than those for Pin b, by an order of magnitude basedon array data and the numbers of ESTs present in the dbEST data-base. However, we have not identified the products of these tran-scripts and this may prove to be difficult because of their highsequence identity to Pin b and presumed low abundance (based ontranscript abundance). However, they could correspond to minorpeaks in the Pin b region of capillary electrophoresis (CE) separa-tions of TX-114-extracted proteins (Day et al., 2006) or minor spotsresolving close to Pin a and Pin b in 2D gel analyses of amphiphilicproteins (Amiour et al., 2002). The fact that they contain only two ofthe three tryptophan residues present in Pin b may also affect theiramphiphilic behaviour and ability to bind to starch: if so they maynot be enriched in the Triton X-114 extracts or starch granulepreparations which are routinely used as sources of Pin a and Pin b.
Although the variant forms of Pin b may be difficult to study atthe biochemical level it is possible to take a genetical approach tolook for functions. It has been reported that allelic variation at theHa locus accounts for about 60–80% of the variation in texture incrosses with minor hardness loci being present on chromosomes1B, 2A, 2B, 2D, 3A, 5A, 5B, 6B, 6D and 7A (Galande et al., 2001;Sourdille et al.,1996; Turner et al., 2004: Weightman et al., 2008). Inthe present study, Pin b variant 1 mapped close to QTLs for hard-ness on chromosome 7A. Although this does not prove a functionalrole, it is of interest that Sourdille et al. (1996) also identified a locuson 7A which they described as having interactive effects with otherloci in controlling hardness. However, it should also be noted thatour mapping was carried out using crosses between hard varieties,and any effects of the Pin variants on hardness are therefore likely
Fig. 6. Mapping of the Pinb-A2 locus and its linkage to novel QTLs for grain hardness.
M. Wilkinson et al. / Journal of Cereal Science 48 (2008) 722–728 727
to be small compared with those associated with the wild type Pina and Pin b alleles. Thus, hard and soft varieties may differ by 30–40SKCS hardness units (Gazza et al., 2008), compared to the differ-ences of 5–7 units observed between hard varieties in the presentstudy.
Acknowledgements
Rothamsted Research and the John Innes Centre receive grant-aided support from the Biotechnology and Biological SciencesResearch Council (BBSRC) of the UK. Part of the work was supportedby a grant from BBSRC under the Exploiting Genomics Programme(EGA17694 ‘‘A genomics approach to improving wheat quality forbreadmaking’’). We thank our collaborators in the Defra LINKproject FQS23 ‘‘Investigating wheat functionality through breedingand end use’’ for allowing us to use mapping data and hardnessmeasurements from the Malacca� Charger and Shamrock�Shango double haploid lines. We also thank Dr. Natalie Castells forassistance with the phylogenetic analysis and Dr. Sam Millar(CCFRA) for discussions and critical comments on the manuscript.
References
Amiour, N., Merlino, M., Leroy, P., Branlard, G., 2002. Proteomic analysis ofamphiphilic proteins of hexaploid wheat kernels. Proteomics 2, 632–641.
Bassam, B.J., Caetano-Anolles, G., Gresshoff, P.M., 1991. Fast and sensitive silverstaining of DNA in polyacrylamide gels. Analytical Biochemistry 80, 81–84.
Bhave, M., Morris, C.F., 2008a. Molecular genetics of puroindolines and relatedgenes: allelic diversity in wheat and other grasses. Plant Molecular Biology 66,205–219.
Bhave, M., Morris, C.F., 2008b. Molecular genetics of puroindolines and relatedgenes: regulation of expression, membrane binding properties andapplications. Plant Molecular Biology 66, 221–231.
Blochet, J.-E., Chevalier, C., Forest, E., Pebay-Payroula, E., Gautier, M.-F., Joudrier, P.,Pezolet, M., Marion, D., 1993. Complete amino acid sequence of puroindoline,a new basic and cystine-rich protein with a unique tryptophan-rich domain,isolated from wheat endosperm by Triton X-114 phase partitioning. FEBSLetters 329, 336–340.
Chang, S., Puryear, J., Cairney, J., 1993. A simple and efficient method for isolatingRNA from pine trees. Plant Molecular Biology Reports 11, 113–116.
Chantret, N., Cenci, A., Sabot, F., Anderson, O., Dubcovsky, J., 2004. Sequencing of theTriticum monococcum hardness locus reveals good microlinearity with rice.Molecular Genetics and Genomics 271, 377–386.
Chantret, N., Salse, J., Sabot, F., Rahman, S., Bellec, A., Laubin, B., Dubois, I.,Dossat, C., Sourdille, P., Joudrier, P., Gautier, M.-F., Cattolico, L., Beckert, M.,Aubourg, S., Weissenbach, J., Caboche, M., Bernard, M., Leroy, P., Chalhoub, B.,2005. Molecular basis of evolutionary events that shaped the Hardness locusin diploid and polyploid wheat species (Triticum and Aegilops). Plant Cell 17,1033–1045.
Day, L., Bhandari, D., Greenwell, P., Leonard, S.A., Schofield, J.D., 2006.Characterisation of wheat puroindoline proteins. FEBS Journal 273, 5358–5373.
Douliez, J.-P., Michon, T., Elmorjani, K., Marion, D., 2000. Structure, biological andtechnological functions of lipid transfer proteins and indolines, the major lipidbinding proteins from cereal kernels. Journal of Cereal Science 32, 1–20.
Edgar, R.C., 2004. MUSCLE: multiple sequence alignment with high accuracy andhigh throughput. Nucleic Acids Research 32, 1792–1797.
Galande, A.A., Tiwari, R., Ammiraju, J.S.S., Santra, D.K., Lagu, M.D., Rao, V.S., Gupta, V.S., Misra, B.K., Nagarajan, S., Ranjekar, P.K., 2001. Genetic analysis of kernelhardness in bread wheat using PCR-based markers. Theoretical and AppliedGenetics 103, 601–606.
Gazza, L., Taddei, F., Corbellini, M., Cacciatori, Pogna, N.E., 2008. Genetic andenvironmental factors affecting grain texture in common wheat. Journal ofCereal Science 47, 52–58.
Gollan, P., Smith, K., Bhave, M., 2007. Gsp-1 genes comprise a multigene family inwheat that exhibits a unique combination of sequence diversity yetconservation. Journal of Cereal Science 45, 184–198.
Guindon, S., Lethiec, F., Duroux, P., Gascuel, O., 2005. PHYML Online – a web serverfor fast maximum likelihood-based phylogenetic inference. Nucleic AcidsResearch 33, 557–559.
Kooijman, M., Orsel, R., Hessing, M., Hamer, R.J., Bekkers, A.C.A.P.A., 1997.Spectroscopic characterisation of the lipid-binding properties of wheat pur-oindolines. Journal of Cereal Science 26, 145–159.
Law, C.N., Young, C.F., Brown, J.W.S., Snape, J.W., Worland, A.J., 1978. The study ofgrain protein control in wheat using whole chromosome substitution lines. In:Seed Protein Improvement by Nuclear Techniques. International Atomic EnergyAgency, Vienna, pp. 483–502.
Morris, C.F., 2002. Puroindolines: the molecular genetic basis of wheat grainhardness. Plant Molecular Biology 48, 633–647.
Pomeranz, Y., Williams, P.C., 1990. Wheat hardness: its genetic, structural andbiochemical background, measurement and significance. In: Advances in Cereal
M. Wilkinson et al. / Journal of Cereal Science 48 (2008) 722–728728
Science and Technology, vol. 10. American Association of Cereal Chemists, StPaul, MN, pp. 471–544.
Shewry, P.R., Jenkins, J., Beaudoin, F., Mills, E.N.C., 2004. The classification, functionsand evolutionary relationships of plant proteins in relation to food allergens. In:Mills, E.N.C., Shewry, P.R. (Eds.), Plant Food Allergens. Blackwell Science, Oxford,pp. 24–41.
Snape, J.W., Foulkes, M.J., Simmonds, J., Leverington, M., Fish, L.J., Wang, Y.,Ciavarella, M., 2007. Dissecting gene� environment interactions on wheatyields via QTL and physiological analysis. Euphytica 154, 401–408.
Sourdille, P., Perretant, M.R., Charmet, G., Leroy, P., Gautier, M.F., Joudrier, P.,Nelson, J.C., Sorrells, M.E., Bernard, M., 1996. Linkage between RFLP markers andgenes affecting kernel hardness in wheat. Theoretical and Applied Genetics 93,580–586.
Tranquilli, G., Heaton, J., Chicaiza, O., Dubcovsky, J., 2002. Substitutions and de-letions of genes related to grain hardness in wheat and their effect on graintexture. Crop Science 42, 1812–1817.
Turner, A.S., Bradburne, R.P., Fish, L., Snape, J.W., 2004. New quantitative trait lociinfluencing grain texture and protein content in bread wheat. Journal of CerealScience 40, 51–60.
Wan, Y., Poole, R.L., Huttly, A.K., Underwood, C., Feeney, K., Welham, S., Gooding, M.J., Mills, E.N.C., Edwards, K.J., Shewry, P.R., Mitchell, R.A.C., 2008. Transcriptomeanalysis of grain development in hexaploid wheat. BMC Genomics 9, 121.
Weightman, R.M., Millar, S., Alava, J., Foulkes, M.J., Fish, L., Snape, J.W., 2008. Effectsof drought and the presence of the 1BL/1RS translocation on grain vitreosity,hardness and protein content in winter wheat. Journal of Cereal Science 47,457–468.
Whelan, S., Goldman, N., 2001. A general empirical model of protein evolutionderived from multiple protein families using a maximum-likelihood approach.Molecular Biology and Evolution 18, 691–699.
Wu, Z., Irizarry, R.A., Gentleman, R., Murillo, F.M., Spencer, F., 2004. A model basedbackground adjustment for oligonucleotide expression arrays. Journal of theAmerican Statistical Association 99, 909–917.