Page 1
Identification of DEGs in B cells of patients
with common variable immunodeficiency
and healthy donors
Master Degree Project in Systems Biology Molecular Biotechnology Two years Master 120 ECTS Spring semester 2019 Version 1 Shirin Pour Akaber Email: [email protected] Supervisor: Ola Grimsholm (University of Gothenburg) Email: [email protected] Co-supervisor: Andreas Tilevik (University of Skövde) Emails: [email protected] Examiner: Björn Olsson Email: [email protected] University of Skövde, department of Bioscience 541 28 Skövde
Page 3
Abstract
Common variable immunodeficiency (CVID) is a rare primary immune deficiency (1:25000) in which
patients have a reduction in antibody production and very low titres in one or more of their Ig isotypes,
(IgG, IgA and sometimes IgM). This disease can cause different symptoms such as: bronchiectasis,
chronic lung disease and even autoimmunity, polyclonal lymphocytic infiltration, lymphoma and death.
The underlying causes of CVID are still largely unknown but studies show that different factors like
primary B-cell dysfunctions, defects in T cells and antigen-presenting cells are involved. Quantitative
analysis of gene expression is of high importance in understanding the molecular mechanisms
underlying this diseases´ genome regulation. Next-generation RNA-seq has enabled researchers to
analyse both coding and non-coding regions of RNA, and therefore has made it possible to identify
differentially expressed genes in large-scale data, especially in polygenic diseases like CVID. The aim for
this study was to identify the differentially expressed genes between CVID patients and healthy donors
to identify important genes and molecular mechanisms underlying this diseases´ genome regulation. For
this matter, whole genome RNA-seq analysis was performed on RNA isolated from sorted peripheral
blood naïve and CD27bright memory B cells from healthy donors (n=7) and CVID patients (n=5). The RNA-
seq data for the samples was collected and undergone several bioinformatical and analytical steps to be
processed. After quality control and trimming, the data files were assembled to the human genome.
Then, the transcriptomic data of the CVID patients was compared with the healthy donors to identify
differentially expressed genes (DEGs). From this study, it was found that PAX5, ETS1, POU2AF1, SPIB,
BACH 2, EBF1 and PRDM1 play an important role on regulation of the B cells and especially this disease.
Also, the Ikaros family, toll-like receptors and a number of chemokine and cytokine receptors were
found out to have high importance regarding CVID.
Page 4
Popular scientific summary
Approximately 1:25,000 persons in the world are diagnosed with common variable immunodeficiency
(CVID), a rare clinically and genetically heterogeneous disorder with onset from pediatric to adult age,
which requires lifelong clinical follow-up. The clinical course is highly variable, but leads to substantial
excess mortality. CVID is characterized by impaired B-cell function, hypo-/a-gammaglobulinemia and
recurrent infections but many of the patients also develop more severe symptoms over time such as
inflammatory diseases, autoimmune diseases or lymphomas. Immunoglobulin substitution therapy
reduces frequency and severity of acute infections, but does not prevent inflammatory manifestations
and complications. The life of a B-cell starts in the bone marrow and continues in peripheral lymphoid
organs such as the spleen and lymph nodes. The main role of the B-cells is to produce antibodies to
protect human body from invading pathogens. As mentioned above, patients with CVID, produce lower
amounts of antibodies compared to a healthy individual and in many cases it is still unclear as to why
this happens. In this article, it was aimed to investigate two different subsets of B cells, naive and
CD27bright memory B cells. CD27 is a marker on the surface of memory B cells that is used to discriminate
them from their naive counterpart. The RNA from these two populations was sequenced and the
expression levels was determined for each gene. It was found that many genes were differentially
expressed when comparing naive and CD27bright memory B cells in healthy subjects but most
interestingly also when comparing healthy subjects to patients with CVID. The data analysis showed that
both the naive and CD27bright memory B cells separate well when comparing the two groups (healthy vs.
patients). When studying genes that are known to be involved in the regulation of B cell function it was
observed that many of them were dysregulated in both naive and memory B cells in the patient group.
Our results indicate that there is an imbalance already in the naive B cell pool of patients with CVID and
that these gene dysregulations will most probably have a profound effect on the production of
antibodies. However, functional studies are needed in order to prove this hypothesis. In the next step,
we want to compare the results from patients with only infections to those with more severe symptoms
such as inflammatory diseases to elucidate whether the observed dysregulations are correlated to the
clinical phenotype or not.
Page 5
List of abbreviations
BTLA B- And T-Lymphocyte-Associated Protein
CD Cluster of differentiation
CD27bright B cells Bright B cells
cDNA Complementary DNA
CDR Complementarity-determining regions
CDR Complementarity-determining regions
CNV Copy number variation
CVID Common variable immunodeficiency
DEGs Differentially expressed genes
EBV Epstein-Barr virus
GC Germinal center
GI tract Gastrointestinal tract
HD Healthy donors
I.V. Intravenous injection
Iga Immunoglobulin a
Igd Immunoglobulin d
Igg Immunoglobulin g
IgM Immunoglobulin M
IGRT Immunoglobulin replacement therapy
IKZF1 Ikaros
LRBA Beige-like anchor protein
MBCs Memory B cells
MHC Major histocompatibility complex
Page 6
NK cells Natural killer cells
NuRD Nucleosome Remodelling Deacetylase complex
PBMCs Peripheral blood mononuclear cells)
PBS Phosphate-buffered saline
PCA Principal Component Analysis
PID primary immunodeficiency
PLCƴ2 phospholipase Cƴ2
RPKM Reads per kilo base per million mapped reads
RR Relative risk
S.C. Subcutaneous injection
SHM Somatic hypermutation
TF Transcription factor
TFH Follicular B helper T cells
TLRs Toll-like receptors
TNF Tumor necrosis factor
Page 7
Table of contents
Introduction .................................................................................................................................................. 1
The immune system .................................................................................................................................. 1
B cells ........................................................................................................................................................ 2
CD antigens and their role in detection of lymphocyte subsets ............................................................... 4
CD 19 ..................................................................................................................................................... 4
CD 24 ..................................................................................................................................................... 5
CD 27 ..................................................................................................................................................... 5
CD 38 ..................................................................................................................................................... 5
Common variable immunodeficiency ....................................................................................................... 6
Symptoms of CVID ................................................................................................................................ 6
Autoimmunity in CVID .......................................................................................................................... 7
Lymphoma in patients with CVID .......................................................................................................... 7
Current treatment methods ................................................................................................................. 8
Aim .............................................................................................................................................................. 10
Materials and methods ............................................................................................................................... 11
Isolation of peripheral blood mononuclear cells .................................................................................... 11
Isolation of the B cells from the PBMCs .................................................................................................. 11
Flow cytometry ....................................................................................................................................... 11
Staining procedure .............................................................................................................................. 11
Cell sorting .......................................................................................................................................... 12
RNA extraction ........................................................................................................................................ 12
RNA Sequencing ...................................................................................................................................... 12
Quality control and filtering .................................................................................................................... 12
Analysis of DEGs ...................................................................................................................................... 13
Results ......................................................................................................................................................... 14
Quality control and trimming ................................................................................................................. 14
Counting the reads that were mapped to the human genome .............................................................. 16
General PCA plot ..................................................................................................................................... 18
DEG analysis ............................................................................................................................................ 19
Heatmaps ................................................................................................................................................ 24
PCA plots ................................................................................................................................................. 25
Page 8
Venn diagram .......................................................................................................................................... 26
Bar plots .................................................................................................................................................. 27
Discussion.................................................................................................................................................... 32
Ethical aspects ............................................................................................................................................. 35
Future perspectives: ................................................................................................................................... 36
Acknowledgements ..................................................................................................................................... 37
References .................................................................................................................................................. 38
Appendix ..................................................................................................................................................... 42
Sorting the peripheral blood mononuclear cells .................................................................................... 42
Gel electrophoresis ................................................................................................................................. 43
Page 9
1
Introduction
The immune system
The immune system is the primary defence mechanism of the body against all types of threats that can
potentially cause disease if the system fails in the defence function. (Scully et al., 2017). Human body
has different barriers which can be physical. Like skin, gastrointestinal tract, the respiratory tract and
sweat. It could also come as a form of body fluid such as mucous, bile, gastric acid, saliva, tears, and
sweat which have the responsibility to either digest or keep the microorganisms out of the body. First
and foremost, there are physical barriers that defends us against pathogens such as the skin, mucous
membrane of the mouth, respiratory tract, GI tract, sweat and urinary tract. There are also physiological
barriers such as diarrhea, vomiting, coughing and sneezing which are the body´s response to take out
the microorganisms from the body. Chemical barriers consist of relatively low PH levels of skin, gastric
acid and vagina, and the antimicrobial molecules The cells of the immune system originate in the bone
marrow and many of them mature in there too. The immune system can be divided into two main arms;
the innate immune system that is the body’s early natural response (Gangemi et al., 2015) encoded in
the germline and has an almost similar defence mechanism across species. This type of immunity
responds non-specifically to microbes and antigens (Yatim & Lakkis, 2015).
The second arm of the immune system is called adaptive immunity, which provides a long-lasting
specific immunity (Abbas et al., 2014) with the mediation of cells called lymphocytes. Lymphocyte are
further subdivided to B lymphocytes (B cells) and T lymphocytes (T cells). Using their numerous antigen
receptors, these cells can potentiate specific defence mechanisms against different types of invasions
(Janeway, 2005). Figure 1 is a schematic illustration of the innate and adaptive immune system.
Different types of immune cells can be seen in this figure.
Page 10
2
Figure 1. A schematic illustration of the innate and adaptive immunity systems. In this figure, different
types of immune cells can be seen. Dendritic cells, mast cells, macrophages, natural killer cells,
granulocytes, and complement proteins act as mediators in the inn ate immune system. B cells and T
cells are the initiators in the adaptive immune system.
B cells
B cells are generated in the bone marrow by hematopoietic stem cells that proliferate and differentiate
into a B cell lineage precursor named common lymphoid precursor cell. These cells are then stimulated
to turn into immature B cells in a stepwise manner. In the spleen, these immature cells mature into
mature naïve B cells, which have not yet had any contact with an antigen (Tobón et al., 2013). Affinity
maturation is a term used for the process in which the Tfh-activated T cells (B cells that are activated by
follicular B helper T cells) secret antibodies with increased affinity against a specific antigen during the
course of immune response to a pathogen (Victora & Nussenzweig, 2012). This process usually happens
in the surface immunoglobulin of germinal center B cells and consists of two interrelated processes in
the germinal center (GC): 1- Somatic hypermutation (SHM) in which mutations occur in the variable
region of the sequences (CDR regions). As a result of this step, the mutations change the binding
specificity and binding affinities of the generated antibodies. 2-the hypermutated B cells will then
compete for limited growth resources, the availability of antigens and paracrine signals from Tfh cells
(Teng & Papavasiliou, 2007).
Page 11
3
The GC is a secondary structure within follicles of lymphoid organs where B cells, as mentioned before,
undergo affinity maturation. The final output of the GC are memory B cells and terminally differentiated
cells called plasma cells (Goldman & Prabhakar, 1996). Memory B cells are important effector cells upon
a secondary infection of the same antigen when they very quickly become re-activated and differentiate
into plasma cells and/or re-enter the GC reaction (Seifert & Küppers, 2016). Memory antibody responses
are normally characterized by the rapid production of high titres of high-affinity antigen-specific
antibody. The hallmark of memory B cells is their expression of a somatically mutated, isotype-switched
B cell antigen receptor, which are features that are generated mainly in the GC (Kurosaki et al., 2010).
On the other hand there are also IgM-expressing memory B cells that are the first memory B cells that
appear in children and they are formed in the spleen by a still unknow mechanism. Later on IgM
memory B cells can be modified by entering the GC and thereby acquire somatic mutations (Aranburu et
al., 2017).
Figure 2. An illustration of the generation of plasma cells and memory B cells from naïve B cells. In T cell-
dependent activation of B cells, the B cell recognizes and internalizes an antigen. It then presents its´
MHC II molecule to the specific receptor of a helper T cell. The interaction between the helper T cell and
the B-cell antigen activates the T cell and stimulates the release of cytokines that results in the
activation of the B cell. Activation of the B cell triggers proliferation and differentiation of the naïve B
cell into memory B cells and plasma cells. In this figure, different levels of B cell maturation including
clonal expansion, SHM, selection, class switching and differentiation can be seen.
Approximately 30-60% of human B cells in the peripheral blood in adults are memory B cells, which are
composed of different subsets. Along with IgG- and IgA-expressing memory B cells, approximately 50%
of peripheral blood memory B cells express IgM with/without IgD. We can now show that the peripheral
blood memory B cell marker CD27 is differentially expressed dividing the memory B cells into CD27dull
and CD27bright populations (Grimsholm et al., under revision). In this paper we show that these two
Page 12
4
latter populations have different functions and are sequential stages in the memory B cell development.
CD27bright memory B cells are the most differentiated and express a highly somatically mutated antigen
receptor and differentiate into plasma cells. Furthermore, smaller subpopulations also exist that do not
express the memory B cell marker CD27. These various subsets share some common features specific
for memory B cells, but likely also fulfil unique functions (Goldman, & Prabhakar, 1996).
Memory B-cell clones are normally composed of different subsets. Therefore, it can be interpreted that
from a single GC B-cell clone, a variety of memory B cells with distinct functions is generated. As a result,
it can be suggested that the human memory B-cell compartment is highly diverse and flexible. Several B-
cell malignancies display features that suggest derivatives from memory B cells. As an example, a subset
of chronic lymphocytic leukaemia, hairy cell leukaemia and marginal zone lymphomas can be
mentioned. The exposure of memory B cells to oncogenic events during their generation in the GC, the
longevity of these B cells and the ease to activate them may be the key determinants for their malignant
transformation (Seifert, & Küppers, 2016). Furthermore, there are diseases such as common variable
immunodeficiency that display non-/dysfunctional memory B cells leading to chronic infections but also
autoimmune diseases and/or lymphomas.
CD antigens and their role in detection of lymphocyte subsets
CD (cluster of differentiation) molecules are markers on the surface of cells. There are approximately
371 known CD antigens that tag almost every cell of the body, which gives each of them their unique
mixture of markers (Misra et al., 2020). These cells are central components of the immune system which
work in regard to identification, targeting and neutralization of disease-causing pathogens. By
understanding these dynamics, these markers can be used for identification of different cell types,
evaluate the status of an infection by measuring the increase or decrease in cell numbers, and
determining the strength of the immune system in certain conditions such as HIV or organ
transplantation. For identification and differentiation purposes, a combination of monoclonal anti-CDs
ae used to increase the accuracy of the process (Sauls & Taylor, 2016).
CD 19
The human CD19 antigen is a 95 kd transmembrane glycoprotein which belongs to the immunoglobulin
superfamily (Thierry-Mieg, D. & Thierry-Mieg, J, 2006). It is encoded by cd19 gene which is located on
the short arm of the chromosome 16 (16p11.2) (Zhou et al., 1992). This molecule is mainly identified as
the B4 antigen of human B lymphocytes and has biased expression in lymph node (RPKM 43.1), spleen
(RPKM 28.3) and bone marrow (RPKM 19.8) (O'Leary et al., 2016). It is also expressed highly in
neoblastic B cells and follicular dendritic cells (Tedder, 2009). Expression of CD19 in mature B cells are 3-
fold higher than that found in immature B cells, with slightly higher expression in B1 cells than in B2 cells
(conventional B cells) (Haas & Tedder, 2012). This immunoglobulin forms a complex with CD21 (CR2) and
CD81 (TAPA-1) which are part of the co-receptor complex on B cells. The cytoplasmic domain binds to
cytoplasmic tyrosine, kinases and PI 3-kinase (Janeway, 2005).
Page 13
5
In general, CD19 is one of the most reliable surface biomarkers for identification and differentiation of B
lymphocytes since it is expressed from pre-B cells until the terminal differentiation to plasma cells
(Wang et al., 2012).
CD 24
CD24 is one of the earliest expressed proteins during human B cell maturation which is present at the
late pro-B cell stages (Duperray et al., 1990) along with surface markers such as CD21 and cytoplasmic μ
heavy chains (Bofill et al., 1985). It has biased expression in thyroid (RPKM 586.8), oesophagus (RPKM
431.3), heart, colons, liver and some other tissues (O'Leary et al., 2016). CD24 is a small, heavily
glycosylated protein which is expressed on mature granulocytes along with B cells and modulates
growth and differentiation signals in these cells. (Nakamura et al., 2017). In the peripheral lymphoid
system of humans, the expression of this antigen experiences continuous fluctuations throughout the
lifespan of mature B cells until CD24 is lost when B cells differentiate into antibody-producing cells
(Galibert et al., 1996). Studies have shown that there is a positive correlation between the expression of
CD24 and CD27 in B cells (Sanz et al., 2008).
In general, the expression level of CD24 in human B cells is used as an immune-phenotype marker,
especially for early-stage B cells where it is highest on newly exited (from bone marrow) transitional B
cells. Expression then dramatically decreases in mature naive B cells. Therefore, it can be a good
indicator for differentiation of early-stage, naive and memory B cells (Mensah et al., 2018).
CD 27
CD27 is a type I transmembrane glycoprotein which is a member of the tumor necrosis factor receptor
superfamily (Teplyakov et al., 2017). It is expressed as a surface antigen on memory B cells, natural killer
cells, antibody-secreting plasma cells and T cells (Borst et al., 2005) and has biased expression in lymph
node (RPKM 38.5), spleen (RPKM 21.6) and 14 other tissues (O'Leary et al., 2016). CD27 is required for
the generation and long-term maintenance of T-cell immunity. The ligation of CD27 and CD70 leads to
activation of NF-κB signalling pathways, which stimulates B-cell and T-cell proliferation, plasma cell
differentiation and subsequent antibody secretion (Yamamoto et al., 1998). Since this antigen is more
expressed in memory B cells and has a positive correlation with CD24 in B cells, it can be an ideal marker
for differentiation purposes (Chen et al., 2017).
CD 38
CD38 is a 45-kd, type II transmembrane glycoprotein with receptor-mediated signalling capabilities
(Jackson & Bell, 1990). It is mostly expressed in early B and T cells, activated T cells, germinal center B
cells, and plasma cells. This antigen is mostly identified as a leucocyte differentiation antigen (Reinherz
et al., 1980) and has biased expression in lymphoid tissues and non‐lymphoid tissues such as brain, eye,
pancreas, prostate, gut and muscle 6. In regards with it´ function, it is a NAD glycohydrolase, and
augments B cell proliferation (Guan et al., 2017).
Page 14
6
Common variable immunodeficiency
Common variable immunodeficiency (CVID) is the most common symptomatic primary
immunodeficiency (PID) which has a prevalence of 1:25,000 to 1:50,000 (Carsetti et al., 2005). It is
estimated that approximately 500 individuals have this immunodeficiency in Sweden (Maglione, 2016).
CVID occurs more often in women than men (Gathmann et al., 2014). The term “variable” is used in its´
description since symptoms and the degree of immunodeficiency are different among patients
(Janeway, 2005). In contradiction with most PIDs, CVID is mostly diagnosed in adults or late childhood
since there is limited awareness about this disorder. Sometimes the diagnosis is delayed to more than
15 years after symptom onset (Chapel, 2008).
CVID is most probably a conglomerate of different diseases and not a single disease. Being the most
common disorder among the 20 antibody deficiencies recognized, it is predominantly a B-cell disorder
(Murphy, 2009). CVID is a heterogeneous disorder which is characterized by severe reduction in two or
more Ig isotypes (IgA, IgG and sometimes IgM) along with normal or low B-cell numbers (Wolf et al.,
2015).
Symptoms of CVID
In this disorder, the count and functionality of B cells are reduced as well as the levels of antibodies.
Therefore, the most common symptom is recurrent upper and lower respiratory tract infections with
encapsulated bacteria, especially Streptococcus pneumoniae and unencapsulated Hemophilus
influenzae which may lead to bronchiectasis, chronic lung disease, even death if not treated (Bräuninger
et al., 2001). A rather strange outcome is that in contradiction with healthy individuals, these patients
have fewer sickness related symptoms like fever when infected with pathogens, but they may feel
inexplicably tired as the infection progresses. This can be due to the lack of immune cells which lead to
not exhibiting the signs of infection. Other common symptoms for CVID patients are otitis, sinusitis, and
gastric tract infections along with long periods of diarrhea. In addition, these patients also have an
increased risk for sepsis (Bräuninger et al., 2001).
There are still ongoing studies about the main reasons behind this deficiency, but it has been suggested
that the major factor contributing to lung disease in CVID patients is a defective antibody response
against capsular polysaccharides, which is a T cell-independent process. In an experiment with 54 CVID
patients, it was shown that memory B cells which secrete IgM, may also play a major role in protecting
against encapsulated bacteria. On the other hand, it was also shown that the reduced frequency of IgM
memory B cells may not be predictive for an increased risk to acquire pneumonia infections (Carsetti et
al., 2005).
In another large study which did follow ups on 334 CVID patients for 25.6 years researchers found that
patients with only infections survived longer than those with other severe complications such as
autoimmunity, polyclonal lymphocytic infiltration and lymphoma (Chapel, 2008). There are also
asymptomatic CVID patients who do not have recurrent pneumonia or any other severe symptom. The
Page 15
7
reason for these different symptoms among patients is still unknown and further experiments are
needed to clarify this aspect (Carsetti et al., 2005).
Autoimmunity in CVID
Although CVID patients do not have the ability to elicit an effective antibody response to exogenous
pathogens, many of them respond to self-antigens, which often leads to autoimmunity (Murphy, 2009).
Systemic and organ-specific autoimmune diseases may also develop in these patients but the most
common complications in a haematological context is Immune thrombocytopenic purpura (ITP) and
autoimmune haemolytic anaemia. CVID patients are also prone to lymphoid intestinal pneumonitis,
granulomatous disease and lymphomas. Patients with autoimmunity have a 2.5 relative risk (RR) for
mortality compared with CVID patients with only infections (Chapel, 2008). Furthermore, new studies
show that the deficiency of switched IgM- IgD- CD27+ memory B cells can be correlated with
autoimmunity development in CVID patients. Autoimmunity is generally treated with cortisone to
suppress the immune system, hence the autoimmune disease (Chapel et al., 2008).
Lymphoma in patients with CVID
The risk of developing lymphoma in CVID patients is 12-18-fold higher than in the rest of the population.
This increased risk for cancer development had previously been shown by a collaborative study from
Denmark and Sweden using registered data. Relatives of the CVID patients showed no increased risk of
developing any type of cancer, suggesting that the risk for morbidity in CVID may be coupled with the
immunodeficiency rather than genetic traits which are shared in their family (Knight & Cunningham-
Rundles, 2006).
In the majority of CVID lymphoma cases, no underlying infectious cause could be found (Murphy, 2009).
However, recent studies show some reasons for the increased risk of lymphoma development in CVID.
These reasons can be chronic infections, dysregulations of the immune system, genetic variants and
radiation sensitivity. Lymphoma is diagnosed more often in female CVID patients than males and
appears around 9 years after CVID diagnosis in females. In some patients, Epstein-Barr virus (EBV), an
opportunistic pathogen has been found to drive the lymphoproliferative disorder (Gangemi et al., 2015).
The prevalence of lymphoma is around 11-13% in CVID patients and usually occurs between the ages of
50-60 years.
The nature of lymphomas in CVID patients are non-infectious, which suggests that the disease could be
a manifestation of defective immune regulation contributing to poor B-cell function (Murphy, 2009).
This was illustrated by a case report where CVID patients had antibody production recovery after
acquiring human immunodeficiency virus (HIV) infection. IgG and IgM levels were particularly higher
after acquired infection (Jolles, 2001). However, the IgA levels did not normalize suggesting separate
factors predisposing a person genetically for selective IgA deficiency (Musolino et al., 2014). High levels
of polyclonal IgM antibodies have also been found to correlate with lymphoma development in patients
with CVID. Moreover, the RR for death due to lymphoma was 5.5 in comparison with subjects who only
had infections as their main symptom (Chapel, 2008).
Page 16
8
Genetics in CVID
CVID may arise from a large number of different genetic defects and mutations involved in B-cell
proliferation, activation and differentiation. Over the years many genetic variants have been identified
in patients with CVID that could play a role. From these variants can be named: TNF-like receptor
transmembrane activator and CALM interactor (TACI), CD19, CD20, CD21, CD81, inducible T-cell
costimulatory (ICOS), lipopolysaccharide responsive and beige-like anchor protein (LRBA) and
phospholipase Cƴ2 (PLCƴ2) (Yazdani et al., 2016). TACI is a receptor for APRIL and BAFF cytokines which
can provide co-stimulation, B-cell survival signal for activation and antibody class switching signal
(Janeway, 2005). Also, it has also been proven that in these patients, polymorphisms occur in DNA repair
genes (MSH2, MSH5, MLH1, NBS1 and RAD50) (Gangemi et al., 2015). in the event of an infection , the
genetic instability and continuous activation of lymphocytes and the lymphoid system increases the risk
of malignancy (Musolino et al., 2014).
Recent studies show that there is a connection between CVID and a dramatic increase in total copy
number variation (CNV) burden. But the reason for this is still unknown (Keller et al., 2014). On the other
hand, when another group of researchers explored the clinical significance and origin of these findings,
they were unable to find any correlation between higher total CNV and incidence of malignancy or any
other sub phenotypes (Kienzler et al., 2017). This might be due to the fact that the increased CNV
burden is static and intrinsic to CVID as a disease per se.
In a limited number of patients, a monogenic cause for CVID has been found, which is often identified as
genes involved in B-cell activation with the help of gene sequencing techniques like whole genome or
exome sequencing (Keller & Jyonouchi, 2013). But scientists suggest that most forms of CVIDs are
probably polygenic meaning that the patient has genetic defects in many different genes. The lack of
monogenic causality in the majority of CVID cases might also suggest that there is a combined
environmental, genetic and dysregulated immune system underlying the cause of this disease
(Maglione, 2016).
Current treatment methods
One treatment method is Immunoglobulin replacement therapy (IGRT) which may be an effective way in
bacterial infections in these patients. IGRT is administrated most commonly as an intravenous (I.V.) or
subcutaneous (S.C.) injection (Murphy, 2013). With this treatment, an ideal level of IgG may not be
reached and the goal is to rather improve clinical outcome. IGRT has been shown to substantially reduce
the frequency of bacterial infections in these patients, and is also possible that it reduces mortality. On
the other hand, it has little or no effect on different types of inflammation and the development of
lymphoma (Chapel et al., 2008). IGRT has also proved to have a limited effect in preventing the
development of autoimmunity (Knight & Cunningham-Rundles, 2006). In general, IGRT cannot replace
the function of B cells and with the widespread use of IGRT, a shift to lymphoproliferative based
morbidity and mortality instead of infection based diseases can be seen (Maglione, 2016). Another
approach for treatment is administration of antibiotics to treat the bacterial infections. This method is
used for patients with reduces level of IgGs with or without IgA. In general, patients with serum IgG level
Page 17
9
< 4 g/L are recommended to undergo IGRT, while for those with serum IgG level > 4 g/L, administration
of antibiotics can be sufficient for many year (Jolles et al., 2017)
Page 18
10
Aim
Since CVID is predominantly but not exclusively a B-cell disorder (Murphy, 2009), it was predicted that
studying the transcriptome of both naïve and CD27bright memory B cells in these patients could increase
our understanding of the cause of the disorder, therefore opening new ways for early diagnosis and
treatments for CVID patients.
In this study RNA sequencing was performed on sorted naive and CD27bright memory B cells from CVID
patients (n=5). Then the sequence data is going to be compared with the data from healthy donors
(n=7). Hence the aim of this experiment was to:
• Identify differentially expressed genes at the transcriptome level in naïve and CD27bright memory B
cells of CVID patients compared to healthy donors.
• Evaluate what biological and/or signalling pathways are altered in naive and/or CD27bright memory B
cells in patients with CVID as compared to healthy donors.
Page 19
11
Materials and methods
Isolation of peripheral blood mononuclear cells
For this purpose, density gradient centrifugation technique was performed. In this method, blood cells
are separated according to their relative density, size and shape. Human peripheral blood mononuclear
cells (PBMCs) were isolated from peripheral blood. B and T lymphocytes, monocytes, natural killer cells
(NK cells) and dendritic cells were found in the fraction of PBMCs. The frequency of these cells is
different from person to person but in general, lymphocytes compose 70-90% of the PBMCs, monocytes
have a range of 10-20%, and dendritic cells account for only 1-2% of the PBMCs. The majority of the
lymphocytes are CD 3(+) T cells with a range of 70-85%. NK cells form 5-20% and the B cells have the
lowest amount in lymphocytes with only 5-10% of the population (Kleiveland, 2015). In this technique,
blood samples were first diluted with sterile phosphate-buffered saline (PBS, Bacteriological laboratory,
Gothenburg) and then the blood diluted in PBS is going to be layered on top of the Ficoll reagent
(Producer), which works as a median between the low- and high-density cells. After centrifugation (400x
g, 25 mins, acc 1; deacc. 1), the PBMCs were gathered in a thin layer on top of the ficoll. The thin grey
layer in the middle were the desired PBMCs which were collected for further analysis and then washed
twice (400x g, 10 mins and then 300x g, 5 mins) in PBS.
The concentration of the PBMCs was measured by an automated cell counter (KX-21N, Sysmex). The
cells are diluted to contain the cell concentration of >1 x 10⁶ cells/mL but <20 x 106 cells/mL to ensure
good measuring precision. The concentration of the sample is needed for to correctly calculate flow
cytometry staining conditions and to have an ideal sample flow.
Isolation of the B cells from the PBMCs
EasySep™ Human B Cell Isolation Kit, which is based on Immunomagnetic negative selection of B cells
from PBMCs was employed. This technique targets non-B cells and removes them with EasySep™ Direct
RapidSpheres™ and antibodies recognizing specific surface antigens. Unwanted cells are then going to
be separated from desired cells using an EasySep™ magnet, and the untouched B cells are poured into a
new tube and stored for further analysis (EasySep™ Human B Cell Isolation Kit, product information
sheet). This generates normally 95-98% purity of B cells. The protocol from the manufacturer was
followed with the exception that only half the amount of antibody solution was required to have enough
high purity of B cells.
Flow cytometry
Staining procedure
The B cells were then stained with fluorochrome-conjugated monoclonal antibodies in order to separate
naïve and CD27bright memory B cells. The antibodies used were anti -CD19 BV510 , anti-CD24 Alexa
Fluor 647, anti-CD27 BV421, anti-CD38 PECy7. These antigens are all present on the B cell surface and in
combination with each other, give ideal discrimination between different B-cell subpopulations. The
Page 20
12
fluorochromes make it possible for the flow cytometer to identify and sort the cells according to the
gates optimized by the researcher.
Cell sorting
The next step would be to sort the B cells into naïve and CD27bright memory B cells. In order to do this,
flow cytometry is performed which is a method for analysing the physical and chemical characteristics of
fluorescently labelled particles in a sample as it passes through a laser. The laser excites the components
and they emit light at varying wavelength (Picot et al., 2012). This process makes it possible for the
machine to identify and sort the naïve (CD19+CD24+CD27-CD38+) and CD27bright
(CD19+CD24highCD27high) memory B cells and put them in two different tubes for further analysis.
Cells are then centrifuged at 2000x g for 5 minutes and the supernatant is removed. The cell pellets are
then snap-frozen in liquid nitrogen to inactivate endogenous RNases and stored at -80C until further
analysis.
RNA extraction
Next, the RNA was extracted from the obtained samples using RNeasy Micro Kit (Qiagen). This technique
is column-based and extracts high-quality RNA from the naïve and CD27bright memory B cells. This
produces high-integrity RNA for NGS or other PCR-based applications. The extracted RNA was eluted in
14µl of RNase free water and then stored at -80C for further analysis (RNA sequencing).
The quality of the samples was then controlled after extraction. For this purpose, Agilent TapeStation
system was used. This makes sensitive quantification and integrity measurement of RNA, DNA and also
proteins. It gives a RIN value as a value of RNA integrity and also runs an integrated gel electrophoresis
to identify any impurity in the samples before making the libraries for sequencing.
RNA Sequencing
The extracted RNA samples were then sent for sequencing to a collaborator in Rome, Italy. TruSeq®
Stranded mRNA Library Prep (ThermoFisher) was used for library preparation step. IDT for Illumina –
TruSeq RNA UD Indexes were used for indexing the samples, and NextSeq® 500/550 High Output Kit v2
(Illumina) machine was used for sequencing the samples.
Quality control and filtering
The generated FastQ files were checked in regard to data quality using FastQC High Throughput
Sequence QC Report. In this step, the data files were checked regarding the quality of the read
nucleotides, their length and the presence of remaining adapters.
The sequences were trimmed, the remainder of the adapters are removed, and too short or too low-
quality reads are removed. These steps are performed using Trimmomatic tool. The trimmed FastQ files
are again quality-controlled. This step is performed to find out if the filtering and trimming has been
Page 21
13
effective and if the data quality has been improved. This step is done using FastQC High Throughput
Sequence QC Report.
Analysis of DEGs
The trimmed reads are then aligned to the human genome using the tool Rsubread. This step is
performed to check the compatibility of the data file with the human genome, and to find any major
contamination or impurity. The mapped reads to the human genome are counted using FeatureCounts.
The data files from CVID patients and the healthy individuals are compared to identify any differentially
expressed genes. This process is done using DESeq2 package in R studio.
Page 22
14
Results
Quality control and trimming
The sequencing was on cDNA level and paired end. The samples included five CVID patients and three
healthy donors, from which three CVID patients and all three healthy donors (HD) had both naïve and
CD27 bright cells. From the other two samples, one had only the bright cells due to low RNA quality of
the naïve file (patients number 16) and the other one had only the naïve cells due to insufficient counts
for the bright cells (patient number 28). Each of the 8 samples had forward and reverse files, and the
sequencing process for each of these 16 files was done in four sequencing runs, hence having 4 FASTQ
files for each of the data files. The files for each subset were merged into one big zipped FASTQ file, 4-5
Gigabytes each, by using the “ZCAT” function in Cygwin, a Unix emulator in Windows.
These 16 zipped files were then opened in FastQC tool to check their primary quality before trimming.
This tool provides a detailed information on different quality parameters foreach dataset, giving a
general estimation for each parameter, in which green means “pass”, yellow means “warning”, and red
indicates “fail” in that parameter. The quality scores in this tool are in PHRED quality scale which ranges
from 0 to 40. The highest the number of PHRED score, the highest the accuracy of the base calling. The
reads for each file had a range of lengths between 35 - 76, meaning that the files were already trimmed
to remove the adapter contents. This was done by the Illumina sequencer itself. All of the data files had
the same overall quality. Figure 3 shows the generated FastQC analyses for the forward file of naive cells
for patient number 14 (CVID14-n-10-f).
Per base sequence quality (figure 3.A), shows a summary of the quality for all sequences at each
position. according to this figure, the data file had an excellent overall quality, since most of the reads
had a quality score higher than 28, which means that each base had been predicted with a high
accuracy. In the last few positions, the quality had become a bit lower, which was further solved during
the trimming process.
Per base sequence content (figure 3.B) shows the proportion of each base (T, A, C, G) in the whole
dataset. This figure showed a small deviation at the beginning of the reads, which is rather normal in the
first 15 bases, since at these positions, the sequencer is still trying to find the right position for each
cluster on the flow cell. The deviations at the end of the sequences were also natural, since they were a
result of trimming the adapter remains from the ends of the sequences. Therefore, this analysis also
showed no major issues in the files.
Per sequence GC content (figure 3.C) is the calculated GC content across the whole length of each
sequence of the file (red line) compared with a normal distribution of the GC content (blue line). This file
also showed no major deviation from the normal distribution and indicated a good sequencing run.
Sequence duplication levels (figure 3.D) shows the number of times a sequence is repeated. In this
figure, it can be seen that the duplication level for the sample was high and the tool gave fail signal for
this.
Page 23
15
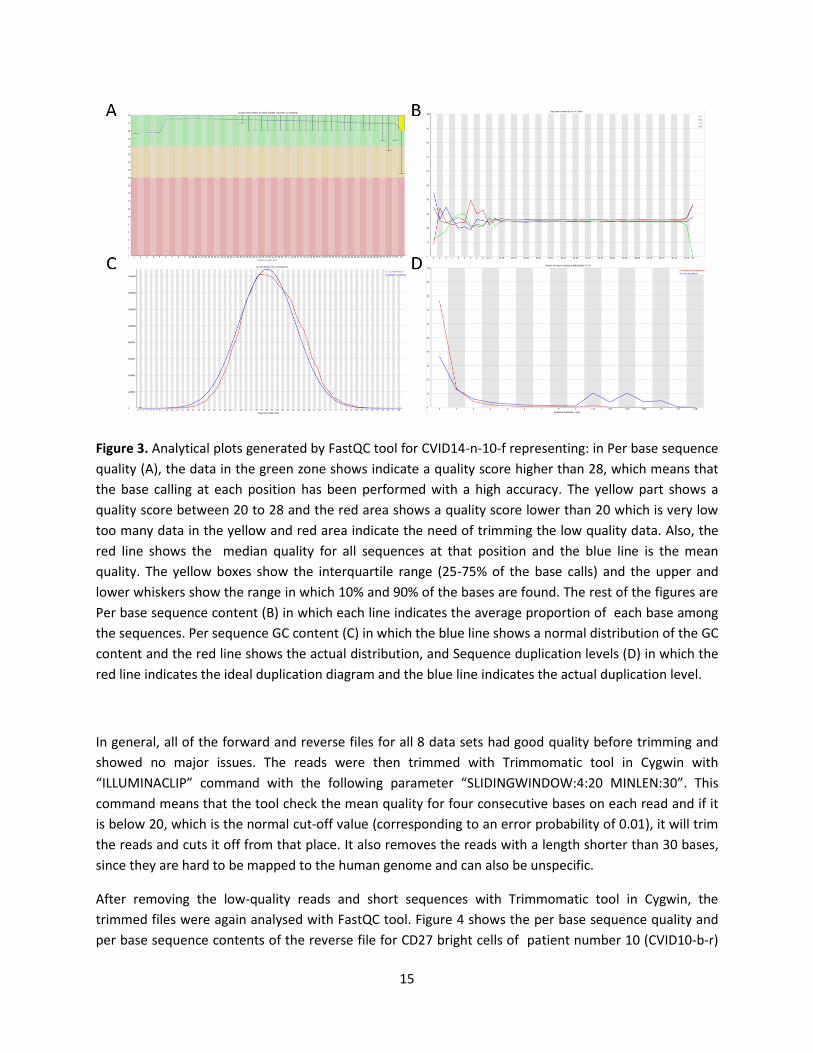
Figure 3. Analytical plots generated by FastQC tool for CVID14-n-10-f representing: in Per base sequence
quality (A), the data in the green zone shows indicate a quality score higher than 28, which means that
the base calling at each position has been performed with a high accuracy. The yellow part shows a
quality score between 20 to 28 and the red area shows a quality score lower than 20 which is very low
too many data in the yellow and red area indicate the need of trimming the low quality data. Also, the
red line shows the median quality for all sequences at that position and the blue line is the mean
quality. The yellow boxes show the interquartile range (25-75% of the base calls) and the upper and
lower whiskers show the range in which 10% and 90% of the bases are found. The rest of the figures are
Per base sequence content (B) in which each line indicates the average proportion of each base among
the sequences. Per sequence GC content (C) in which the blue line shows a normal distribution of the GC
content and the red line shows the actual distribution, and Sequence duplication levels (D) in which the
red line indicates the ideal duplication diagram and the blue line indicates the actual duplication level.
In general, all of the forward and reverse files for all 8 data sets had good quality before trimming and
showed no major issues. The reads were then trimmed with Trimmomatic tool in Cygwin with
“ILLUMINACLIP” command with the following parameter “SLIDINGWINDOW:4:20 MINLEN:30”. This
command means that the tool check the mean quality for four consecutive bases on each read and if it
is below 20, which is the normal cut-off value (corresponding to an error probability of 0.01), it will trim
the reads and cuts it off from that place. It also removes the reads with a length shorter than 30 bases,
since they are hard to be mapped to the human genome and can also be unspecific.
After removing the low-quality reads and short sequences with Trimmomatic tool in Cygwin, the
trimmed files were again analysed with FastQC tool. Figure 4 shows the per base sequence quality and
per base sequence contents of the reverse file for CD27 bright cells of patient number 10 (CVID10-b-r)
Page 24
16
before and after trimming with Trimmomatic. Comparing figures 4.A and 4.B shows that although
average base qualities at each position had already a great quality with an mean quality of around 34,
their quality improved even more after the trimming, with an average of 37 in the last few positions. It
can also be seen that the interquartile ranges became smaller after the trimming, indicating that those
few base calls which had lower PHRED scores were removed by Trimmomatic. By comparing figures 4.C
and 4.D, it can be seen that very few improvements has happened. Generally, the data files showed a
great quality after the trimming and needed no further alterations at this level.
Figure 4. Results of FastQC analysis for CVID10-b-r: Per base sequence quality before (A), and after (B)
trimming, and per base sequence content before (C) and after (D) trimming.
Counting the reads that were mapped to the human genome
In addition to the three available healthy donors, four more healthy donors were added to the data set
from previous studies (Grimsholm et al., under revision, 2019). This was done to ensure a more
comprehensive result by having more samples. The new (5 CVID and 3 HD) were then merged with the
old data files (4 HD). Then, a bar plot was generated to visualize the total number of counts in each
sample. Figure 5 shows the bar plots for all of the datasets, including the four healthy samples from a
previously generated dataset. It can be seen that the general number of mapped reads to the human
genome was more than 30,000,000 reads for each file. The only exception was the bright cells of CVID
patient number 10 (CVID10.b, second bar in the bar plot) which showed a much less mapability to the
human genome, around 15,000,000 reads (~21%). Also, the total number of counts for the healthy
Page 25
17
donors from the previous study was generally higher than the new samples, with more than 50,000,000
mapped reads to the human genome.
Figure 5. Bar plot of the total counts for all of the healthy donors and CVID patients. The X-axis shows
the name of the data files, while the Y-axis shows the number of counts in million. The old healthy donor
samples as well as the CVID10.b are shown with red lines.
Boxplot for the datasets were generated in order to check the distribution of the logged counts before
and after normalization. Figure 6 shows the boxplots of the data counts before and after normalization
of the files. Both of the boxplots showed similar logged counts across the samples. According to this
figure, it can be seen that there are some variations in the number of logged counts before
normalization (figure 6-A) which has been fixed after normalization (figure 6-B). it can also be seen that
CVID10-b sample (the second boxplot in the figures showed lower logged counts which was also
normalized in figure 6-B.
Page 26
18
Figure 6. box plots showing the counts of the data file before (A) and after (B) normalization.
General PCA plot
PCA plot of the combined genes files were generated to visualize their probable clustering regarding PC1
(being a healthy donor or a CVID patient) and PC2 (being part of the naive cells or the CD27 bright cells).
This two-dimensional way of visualizing the data is especially useful for seeing the similarity in the gene
expression profiles between the healthy and CVID sample, and between the naïve and bright cells.
Figure 7 shows the PCA plot and the clusters regarding PC1 and PC2. It can be seen that PC1 had
explained 37% of the variety, while PC2 could explain 30%. It seems that all the groups had clustered
perfectly. Both naïve and bright cells of the old healthy donors clustered very well with the naïve and
bright cells of the new healthy donors, although having slightly different average of expression regarding
PC1. In general, the naïve cells for both CVID patients and healthy donors showed a nearly similar
expression regarding PC2 compared with the bright cells of CVID and healthy donors. Furthermore, it is
also worth mentioning that CVID patient number 10, had a slightly different pattern of expression
compared with other CVID patients. But despite of this, both naïve and bright cells of this patient had
the same pattern as the rest of the patients and clustered with the right gene group.
Page 27
19
Figure 7. The PCA plot of all of the data files. The naive cells of CVID patients (CVID-n) can be seen on
top of the figure, the CD27 bright cells of CVID patients (CVID-b) are shown at the down left corner. The
naive cells of the healthy donors, for both the old and new samples can be seen at the top right corner,
and bright cells (CD27bright cells) of old and new healthy samples are depicted on the downright part of
the figure.
DEG analysis
In order to identify the differentially expressed genes, the Deseq2 package was used for four different
groups:
• The CD27bright cells of CVID patients (CVID bright) vs. the naïve cells of CVID patients (CVID naïve)
• The CD27bright cells of CVID patients (CVID bright) vs. the CD27bright cells of healthy donors (HD
bright)
• The naïve cells of CVID patients (CVID naïve) vs. the naïve cells of healthy donors (HD naïve)
• The CD27bright cells of healthy donors (HD bright) vs. the naïve cells of healthy donors (HD naïve)
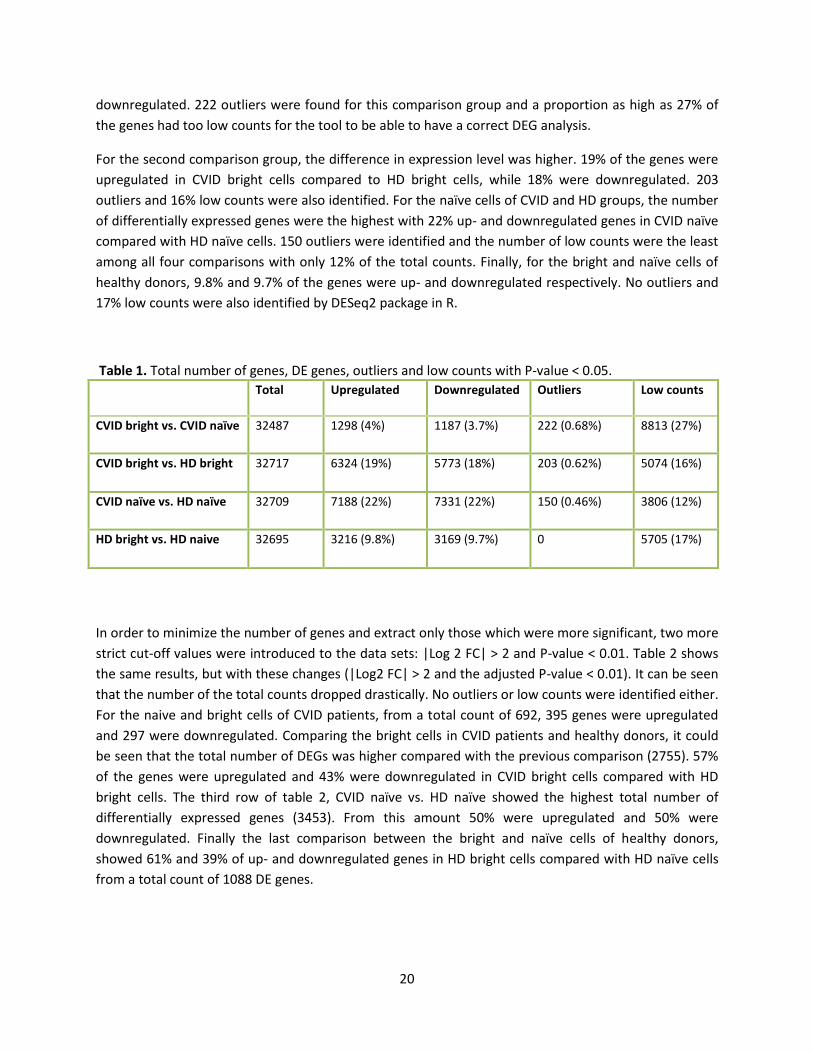
Table 1 shows the total number of differentially expressed genes in these four groups without any cut-
off values for log2FC and adjusted p- value of 0.05. The total number of genes for each comparison was
around 23,000 genes. The difference between CVID bright and naïve cells were minor: approximately 4%
of the genes in CVID bright cells were upregulates compared to CVID naïve cells, while 3.7% were
Page 28
20
downregulated. 222 outliers were found for this comparison group and a proportion as high as 27% of
the genes had too low counts for the tool to be able to have a correct DEG analysis.
For the second comparison group, the difference in expression level was higher. 19% of the genes were
upregulated in CVID bright cells compared to HD bright cells, while 18% were downregulated. 203
outliers and 16% low counts were also identified. For the naïve cells of CVID and HD groups, the number
of differentially expressed genes were the highest with 22% up- and downregulated genes in CVID naïve
compared with HD naïve cells. 150 outliers were identified and the number of low counts were the least
among all four comparisons with only 12% of the total counts. Finally, for the bright and naïve cells of
healthy donors, 9.8% and 9.7% of the genes were up- and downregulated respectively. No outliers and
17% low counts were also identified by DESeq2 package in R.
Table 1. Total number of genes, DE genes, outliers and low counts with P-value < 0.05.
Total Upregulated Downregulated Outliers Low counts
CVID bright vs. CVID naïve 32487 1298 (4%) 1187 (3.7%) 222 (0.68%) 8813 (27%)
CVID bright vs. HD bright 32717 6324 (19%) 5773 (18%) 203 (0.62%) 5074 (16%)
CVID naïve vs. HD naïve 32709 7188 (22%) 7331 (22%) 150 (0.46%) 3806 (12%)
HD bright vs. HD naive 32695 3216 (9.8%) 3169 (9.7%) 0 5705 (17%)
In order to minimize the number of genes and extract only those which were more significant, two more
strict cut-off values were introduced to the data sets: |Log 2 FC| > 2 and P-value < 0.01. Table 2 shows
the same results, but with these changes (|Log2 FC| > 2 and the adjusted P-value < 0.01). It can be seen
that the number of the total counts dropped drastically. No outliers or low counts were identified either.
For the naive and bright cells of CVID patients, from a total count of 692, 395 genes were upregulated
and 297 were downregulated. Comparing the bright cells in CVID patients and healthy donors, it could
be seen that the total number of DEGs was higher compared with the previous comparison (2755). 57%
of the genes were upregulated and 43% were downregulated in CVID bright cells compared with HD
bright cells. The third row of table 2, CVID naïve vs. HD naïve showed the highest total number of
differentially expressed genes (3453). From this amount 50% were upregulated and 50% were
downregulated. Finally the last comparison between the bright and naïve cells of healthy donors,
showed 61% and 39% of up- and downregulated genes in HD bright cells compared with HD naïve cells
from a total count of 1088 DE genes.
Page 29
21
Table 2. Total number of genes, DE genes, outliers and low counts with |Log2 FC|> 2 and P-value < 0.01.
Total Upregulated Downregulated Outliers Low counts
CVID bright vs. CVID naïve 692 395 (57%) 297 (43%) 0 0
CVID bright vs. HD bright 2755 1564 (57%) 1191 (43%) 0 0
CVID naïve vs. HD naïve 3453 1731 (50%) 1722 (50%) 0 0
HD bright vs. HD naive 1088 664 (61%) 424 (39%) 0 0
Table 3 shows the top 5 differentially expressed genes for each of the four comparisons. The top
differentially expressed genes in the four groups were mostly different from each other. HMGB3, or
High Mobility Group Box 3, encodes a member of a protein family that contains one or more high
mobility group DNA- binding motifs. This protein plays a crucial role in maintaining stem cell populations
and also may be highly expressed in tumor cells. This gene was highly differentially expressed in both
CVID bright vs. healthy bright cells and also in CVID naïve and healthy naïve cells. DBNDD1, CD38 and
TBXA2R were three differentially expressed genes in both CVID bright vs. CVID naïve and HD bright vs. HD naïve.
Page 30
22
Table 3. Top 3 DEGs for each of the four groups.
CVID bright vs. CVID naive
Ensembl gene id Hgnc symbol chromosome name gene biotype
1 ENSG00000003249 DBNDD1 16 protein_coding
2 ENSG00000004468 CD38 4 protein_coding
3 ENSG00000004866 ST7 7 protein_coding
4 ENSG00000006638 TBXA2R 19 protein_coding
5 ENSG00000007516 BAIAP3 16 protein_coding
CVID bright vs. healthy bright
1 ENSG00000015520 NPC1L1 7 protein_coding
2 ENSG00000015568 RGPD5 2 protein_coding
3 ENSG00000029993 HMGB3 X protein_coding
4 ENSG00000033327 GAB2 11 protein_coding
5 ENSG00000036672 USP2 11 protein_coding
CVID naive vs. healthy naive
1 ENSG00000001617 SEMA3F 3 protein_coding
2 ENSG00000006634 DBF4 7 protein_coding
3 ENSG00000029993 HMGB3 X protein_coding
4 ENSG00000052344
PRSS8
16
protein_coding
5 ENSG00000061656 SPAG4 20 protein_coding
Healthy bright vs. healthy naive
1 ENSG00000003249 DBNDD1 16 Protein coding
2 ENSG00000004468 CD38 4 protein_coding
3 ENSG00000004799 PDK4 7 protein_coding
4 ENSG00000005471 ABCB4 7 protein_coding
5 ENSG00000006638 TBXA2R 19 protein_coding
Page 31
23
Table 4 shows the top three differentially expressed pathways for each of the comparison groups.
Hematopoietic cell lineage pathway was the most differentially expressed pathway in all of the four
groups. Also, PI3K-Akt signalling pathway was differentially expressed in all the groups except HD bright
vs. HD naïve cells. ECM-receptor interaction was another pathway which was differentially regulated between
CVID naïve and HD naïve and also between HD bright and HD naïve.
Table 4. the 3 top pathways which were dysregulated in each of the comparison groups.
* Total number of genes in the pathway ** Number of differentially expressed genes in that pathway,
CVID bright vs. CVID naive
KEGG pathway ID Pathway N* DE** P-value
1 path:hsa04640
Hematopoietic cell lineage 99 11 3.234092e-05
2 path:hsa04151 PI3K-Akt signaling pathway
354 21 1.859480e-04
3 path:hsa05205
Proteoglycans in cancer 204 14 5.525154e-04
CVID bright vs. healthy bright
1 path:hsa00512 Mucin type O-glycan biosynthesis 31 4 0.001443150
2 path:hsa00770 Pantothenate and CoA biosynthesis 19 3 0.003276154
3 path:hsa04151 PI3K-Akt signaling pathway 354 13 0.004481573
CVID naive vs. healthy naive
1 path:hsa04640 Hematopoietic cell lineage 99 7 0.0004441827
2 path:hsa04512 ECM-receptor interaction 88 6 0.0013886052
3 path:hsa04151 PI3K-Akt signaling pathway 354 12 0.0037510771
Healthy bright vs. healthy
naive
1 path:hsa04640 Hematopoietic cell lineage 99 9 6.034527e-05
2 path:hsa00770 Pantothenate and CoA biosynthesis 19 4 2.993258e-04
3 path:hsa04512 ECM-receptor interaction 88 7 9.147132e-04
Page 32
24
Heatmaps
For each of the four groups, heatmaps of the top 100 genes were generated to visualize the proportion
of up- and down- regulated genes in each comparison, as well as to see how the samples would group
together and generate clusters. Figure 8 shows the four heatmaps of the differentially expressed genes.
In part A of this figure, the differentially expressed genes between the bright and naïve cells of CVID
patients. According to this figure, all the naïve and bright cells clustered well together. CVID patient
number 10, which is the first column for both CVID naïve and bright sections, showed a small deviation
from the rest of the samples. But still clustered with the right groups.
Section B of the heatmaps showed the DEGs between CVID bright and HD bright cells. Again, all the CVID
patients showed similar expression patterns and clustered together. The black line in this part indicates
the old samples, which interestingly, cluster closer together in the expression dendrogram. In figure 8-C,
the heatmap for CVID naïve vs. HD naïve cells can be seen. An interesting point here is that the number
of upregulated genes are much less than the number of downregulated genes. In other words, the major
number of genes in naïve cells of CVID patients are suppressed in comparison with the healthy donors.
The old healthy donors did also cluster together closer than the other healthy donors. Finally, part D of
figure 8 shows the DEGs in naïve and bright cells of healthy patients. In this figure, it can be seen that
not all old and new healthy samples have clustered together in the gene dendrogram and man cannot
find a specific pattern between them.
Page 33
25
Figure 8. The heatmaps of the differentially expressed genes for CVID bright vs. CVID naïve patients (A),
CVID bright vs. HD bright (B), CVID naïve and HD naïve (C) and for HD bright and HD naïve (D). the red
variants indicate downregulated genes, and the yellow variants indicate upregulated genes. The group
names can be seen at the bottom of each figure. The black lines in part A indicate the naïve and bright
cells of patient number 10 while in the other three, they are an indication of those healthy samples that
were obtained from the previous experiment.
PCA plots
To visualize the data and the differentially expressed genes from another different perspective, PCA
plots for each comparison were generated. Figure 9 shows the PCA plots for each of the comparisons. In
all of the figures, the samples were well clustered with their own group and the differentiation was
Page 34
26
completely obvious. For CVID bright vs. CVID naïve (figure 9-A), 50% of the variance was explained with
PC1 while 24% of it was explained with PC2. For CVID bright vs. HD bright (figure 9-B), 61% of the
variance of explained by PC1 and 13% by PC2. For CVID naïve vs. HD naïve comparison, 62% and 11% of
the variance was explained by PC1 and PC2 respectively. And finally, for HD bright and HD naïve DEG
analysis, 62% and 13% of the variety was explained by PC1 and PC2 respectively.
Figure 9. PCA plots of the four comparisons, CVID bright vs. naïve (A), CVID bright vs. HD bright (B), CVID
naïve vs. HD naïve (C) and HD bright vs. HD naïve (D).
Venn diagram
In order to identify the common and unique differentially expressed genes among the groups, a Venn
diagram was generated. This diagram is very informative for planning further analysis. Figure 10 shows
the Venn diagram of the DEGs in four groups and the proportion of common and unique differentially
expressed genes. The total number of differentially expressed genes for each of the four groups can be
obtained from summing up all the numbers in each oval. For example, the total number of DEGs for
CVID naïve vs. HD naïve (3453, table 2) are obtained by summing up all the numbers in the yellow oval
(1490+43+80+29+43+58+1695+15). It can be seen that in the CVID n vs. HD n group, a high number of
the genes (1490) are unique for this group and a smaller number are common between other groups.
For the other groups the number of differentially expressed genes that were unique to that group were
124, 431 and 785 gene respectively. Also, a total number of 58 gene were found to be highly expressed
in all of the four groups.
Page 35
27
Figure 10. Venn diagram showing the DEGs and their dispersion among the groups.
Bar plots
The developmental pathway of B cells in the periphery starts from naïve (transitional) B cells. The
differentiation level will then occur through a series of activation levels in which the transitional B cells
change into MBCs (mononuclear blood cells) and then into PCs (polynuclear cells). Progression along
this developmental pathway which can be associated to loss or acquisition of functions is controlled by
the regulated expression of TFs (transcription factors), TLRs (toll-like receptors) and receptors of
chemokines and cytokines (Carsetti et al., 2005). Based on this information, a more detailed analysis of
RNAseq data was performed on some selected genes from this pathway that had previously been shown
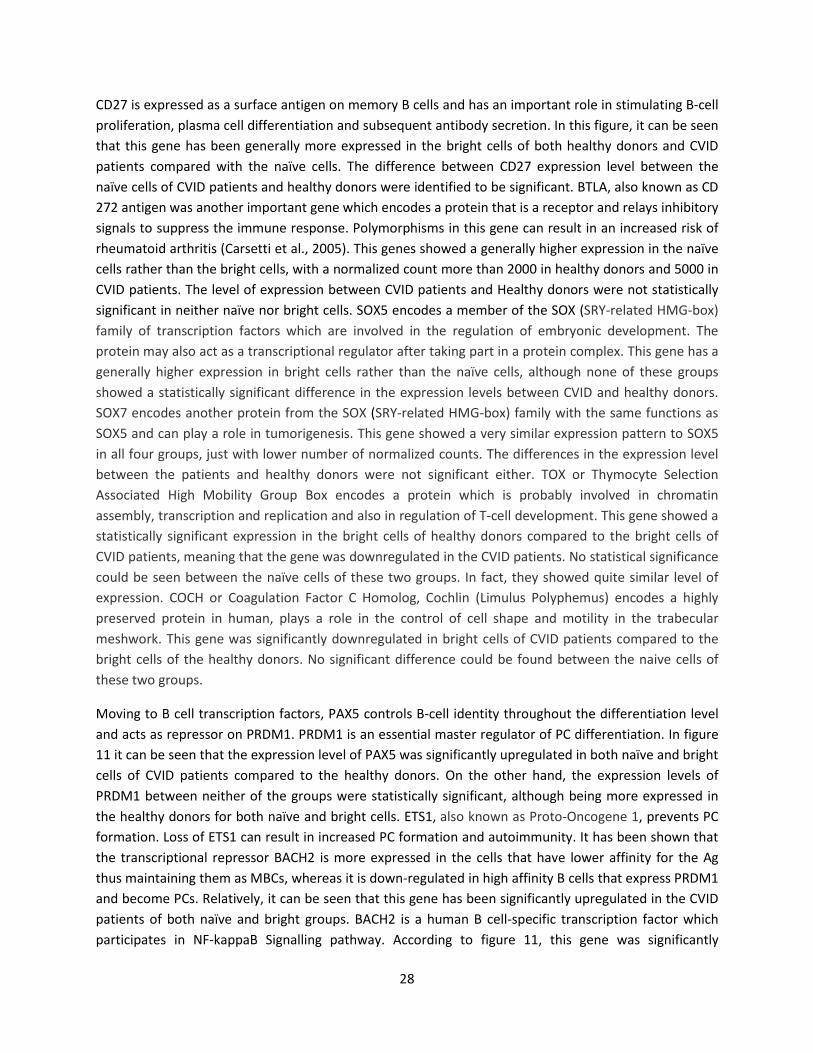
to play an important role in the developmental and functional aspects of B cell lifecycle. Figure 11 shows
the bar plots of the expression levels for these important genes. To find out if the genes were
Statistically significant, an unpaired, two-tailed Student’s t-test was performed. Data are presented as
mean, ± SEM.
Page 36
28
CD27 is expressed as a surface antigen on memory B cells and has an important role in stimulating B-cell
proliferation, plasma cell differentiation and subsequent antibody secretion. In this figure, it can be seen
that this gene has been generally more expressed in the bright cells of both healthy donors and CVID
patients compared with the naïve cells. The difference between CD27 expression level between the
naïve cells of CVID patients and healthy donors were identified to be significant. BTLA, also known as CD
272 antigen was another important gene which encodes a protein that is a receptor and relays inhibitory
signals to suppress the immune response. Polymorphisms in this gene can result in an increased risk of
rheumatoid arthritis (Carsetti et al., 2005). This genes showed a generally higher expression in the naïve
cells rather than the bright cells, with a normalized count more than 2000 in healthy donors and 5000 in
CVID patients. The level of expression between CVID patients and Healthy donors were not statistically
significant in neither naïve nor bright cells. SOX5 encodes a member of the SOX (SRY-related HMG-box)
family of transcription factors which are involved in the regulation of embryonic development. The
protein may also act as a transcriptional regulator after taking part in a protein complex. This gene has a
generally higher expression in bright cells rather than the naïve cells, although none of these groups
showed a statistically significant difference in the expression levels between CVID and healthy donors.
SOX7 encodes another protein from the SOX (SRY-related HMG-box) family with the same functions as
SOX5 and can play a role in tumorigenesis. This gene showed a very similar expression pattern to SOX5
in all four groups, just with lower number of normalized counts. The differences in the expression level
between the patients and healthy donors were not significant either. TOX or Thymocyte Selection
Associated High Mobility Group Box encodes a protein which is probably involved in chromatin
assembly, transcription and replication and also in regulation of T-cell development. This gene showed a
statistically significant expression in the bright cells of healthy donors compared to the bright cells of
CVID patients, meaning that the gene was downregulated in the CVID patients. No statistical significance
could be seen between the naïve cells of these two groups. In fact, they showed quite similar level of
expression. COCH or Coagulation Factor C Homolog, Cochlin (Limulus Polyphemus) encodes a highly
preserved protein in human, plays a role in the control of cell shape and motility in the trabecular
meshwork. This gene was significantly downregulated in bright cells of CVID patients compared to the
bright cells of the healthy donors. No significant difference could be found between the naive cells of
these two groups.
Moving to B cell transcription factors, PAX5 controls B-cell identity throughout the differentiation level
and acts as repressor on PRDM1. PRDM1 is an essential master regulator of PC differentiation. In figure
11 it can be seen that the expression level of PAX5 was significantly upregulated in both naïve and bright
cells of CVID patients compared to the healthy donors. On the other hand, the expression levels of
PRDM1 between neither of the groups were statistically significant, although being more expressed in
the healthy donors for both naïve and bright cells. ETS1, also known as Proto-Oncogene 1, prevents PC
formation. Loss of ETS1 can result in increased PC formation and autoimmunity. It has been shown that
the transcriptional repressor BACH2 is more expressed in the cells that have lower affinity for the Ag
thus maintaining them as MBCs, whereas it is down-regulated in high affinity B cells that express PRDM1
and become PCs. Relatively, it can be seen that this gene has been significantly upregulated in the CVID
patients of both naïve and bright groups. BACH2 is a human B cell-specific transcription factor which
participates in NF-kappaB Signalling pathway. According to figure 11, this gene was significantly
Page 37
29
downregulated in both naïve and bright cells of CVID patients. Also, it could be seen that the level of
expression was generally higher in the naïve cells compared to the bright ones. ZBTB32 is a negative
regulator of memory responses which its´ genetic deletion can result in rapid secondary responses and
high numbers of PCs. Its´ upregulation in human MBCs can mean that this gene has a role in preserving
the pool of MBCs by controlling their proliferation and preventing their differentiation into PCs
(Gathmann et al., 2014). Here, it could be seen that this gene was mainly expressed at the bright cells
and not at the naïve level. There was no statistically significant difference between the SEMs of CVID
and healthy donors. BATF, which controls CSR by directly inducing AID expression was not expressed in
the naïve cells of healthy people, but were significantly upregulated in the naïve cells of CVID patient.
Another important gene is EBF1, which functions similar to PAX5 and controls B cell identity early in
development. In mature naïve B cells EBF1 deletion leads to the reduction of GC B cells and loss of MZ
and B-1 B cells. Here, the bright cells had generally higher expression of this gene, and CVID patients had
significantly downregulated EBF1 genes in both naïve and bright level. POU2AF1 (OBF1/BOB1/OCAB),
another important gene, is a transcriptional coactivator which forms a complex with the POU family
protein OCT1 and OCT2. This gene plays a role early in development regulating the numbers of
transitional B cells. The highest expression of POU2AF1 is observed in the germinal center in which it
induces the expression of SPIB, another transcription factor and a member of the ETS family. Hence, low
level of SPIB or POU2AF1 leads to the impairment of GC responses (Gathmann et al., 2014). Here, it
could be seen that the expression level in the bright cells were generally higher than the naïve cells for
both POU2AF1 and SPIB. Also, the CVID patients had significantly upregulated genes in naïve cells for
both of these genes and also in bright cells for POU2AF1.
Ikaros (IKZF1) is the first member of a family of Krupple-type zinc-(Zn-) finger proteins. These proteins
have an important role in the development of B lymphocytes by controlling their differentiation and
proliferation. IKZF1 contains 4 N-terminal and two C-terminal Zn-finger domains. The C-terminal Zn
finger domains are play an important role in oligomerization of family members and the N-terminal
domains determine DNA-binding and selection of gene targets. IKZF1 has different isoforms which are
IKZF2 (Helios), IKZF3 (Eos) and IKZF4 (Aiolos). These isoforms are generated by differential splicing which
results in variations of the number of N-terminal Zn-finger domains. IKZF2 lacks the first N-terminal Zn-
finger, IKZF3 lacks the fourth and IKZF4 only has the second and third N-terminal Zn-fingers. Ikaros
transcription factors target the Nucleosome Remodelling Deacetylase complex (NuRD) to lymphoid
lineage genes and facilitate their transcription. The regulated expression of these genes may be
important for the appropriate choice of gene targets (Gathmann et al., 2014). In this figure, it could be
seen that the level of expression of IKZF1 is relatively the same between naïve and bright cells for both
healthy donors and CVID patients, but has significantly been upregulated in CVID naïve cells compared
to healthy donors. IKZF2 was significantly downregulated in CVID naïve cells compared to HD naïve cells,
but unexpectedly, it was upregulated in the bright cells, although it was not considered statistically
significant. IKZF3 and IKZF4 showed similar pattern, in which they were up-regulated in both naïve and
bright cells of CVID patients, although it was only significant for IKZF3 in CVID naïve cells. Overexpression
of IKZF2 can lead to follicular B-cell over-responsiveness and lymphoma development. Suppression or
deletion of IKZF3 in mice will also lead to loss of MZ and B-1 B cells and long-term immunity. In aging
Page 38
30
mice autoimmunity and lymphoma development were observed (Carsetti et al., 2005). The role of IKZF4
in B cells is still unknown.
Moving to Toll-like receptors, TLR1, TLR2, TLR4, TLR7, TLR9 and TLR10 were among those genes that
could be important, although the function of TLR1 regarding B cells is still unknown. TLR9 participates in
proliferation and differentiation of MBCs into PCs, while TLR10 does the opposite and suppresses both
T-dependent and T-independent B cell responses (Gathmann et al., 2014). These two genes were both
upregulated in the CVID patients compared to the healthy donors in both naïve and bright cells, while
TLR1 and TLR2 showed the opposite, with downregulation in CVID patients in both naive and bright
cells. TLR4 and TLR7 showed the same pattern as TLR9 and 10.
Regarding the chemokine receptors, CXCR3, CCR6 and CCR9 which are inflammatory chemokines,
showed upregulation in CVID patients in both naïve and bright cells. They should all have had higher
expression levels in the bright cells compared to the naïve cells too, but unexpectedly, the bright cells of
CVID patients showed a lower level of expression than naïve cells for CCR6. CCR7, which is a homeostatic
chemokine receptor, showed higher expression of naïve cells than the bright one, and also showed a
downregulation for both naïve and bright cells of CVID patients. CXCR4 also showed the same pattern as
CCR7. This gene and CXCR5 control trafficking in the germinal center. CXCR4 directs the migration to the
Dark Zone (DZ) while CXCR5 does the opposite, to the Light Zone (LZ). CXCR4 is reduced in MBCs and its´
function can be impaired by the increased expression of ACKR3, that works as a decoy receptor via
blocking the signalling process(Murphy et al., 2013). Interestingly, the plot for ACKR3 showed that the
CVID patients had an upregulation for this gene in the naïve cells, but a downregulation for the bright
cells.
Moving to cytokines, IL2RG, IL21R, IL4R and IL13RA1 are the ones which are necessary for the GC
reaction (Gathmann et al., 2014). IL2RG showed a significant upregulation for CVID naïve cells. IL21R
showed a significant downregulation in CVID bright cells. IL4R showed significant upregulation for CVID
naïve cells but interestingly downregulation for CVID bright cells. IL13RA1 did not show much of a
difference in the expression levels of CVID vs healthy donors, but showed a generally lower expression
in bright cells for both healthy and CVID groups. IL6R which is an inflammatory cytokine, showed some
upregulation in CVID patients for both naïve and bright cells, and also higher level of expression in the
bright cells. IL10RA and IL10RB are regulatory cytokines. IL10RA showed a significant downregulation in
CVID naïve cells, while IL10RB did not show any major difference in any of the groups.
Page 39
31
B cell transcription factors:
Ikaros family:
TOLL-like receptors:
Chemokine and chemokine receptors:
Cytokine receptors:
Figure 11. Bar plots of the expression levels in important genes regarding the development and function
of B cells showing B-cell TFs, Ikaros family TFs, Toll-like receptors, chemokine receptors and cytokine
receptors that are differentially expressed in naïve and CD27bright MBCs in healthy donors and CVID
patients. The naïve samples are illustrated on the left hand side of the bar plots, while the bright ones
are presented on the right hand sides of them. The healthy donors are illustrated in pink and the CVID
patients are in blue. Data are presented as mean, ±SEM and * P < 0.05, ** P < 0.01, *** P < 0.001.
Page 40
32
Discussion
The main aim of this study was to analyze RNA-seq data for naïve and CD27 bright memory B cells of
CVID patients and compare it with the same data of healthy donors. Furthermore, it was aimed to
identify the most important genes and pathways having a role in common variable deficiency and to also
analyze the expression level of the previously identified important genes during B-cell differentiation in
this data set. All of these aims were in order to come up with a set of genes which could help to make a
better prognosis and possibly develop personalized treatment of patients in the future.
For FastQC analysis, the data had generally very high quality and only a few warnings could be seen
before trimming. Per base sequence quality figures showed a minimum average of 34 with only a few
bases having a quality lower than 28. After trimming, the short and low-quality reads were removed,
resulting in improvement of the average PHRED scores to a minimum average of 37 at the last positions
of the reads. “Per base sequence content” files showed a fail signal, as there were some fluctuations in
the first 14 bases. This was most probably due to the fact that the primers which were used, were
chosen from random hexamers to get the cDNA for the sequencing process. Also, some smaller
deviations could be seen at the end of the data sets. This was a good indication that the adapters were
removed before hand by the Illumina machine itself. The adapter content files would also suggest the
same thing, since no major adapter content could be found in any of the data samples. After the
trimming, the fluctuation at the start and end of the files became smaller. Another important analysis
was “Per sequence GC content”. For all of the files, the actual GC content was quite similar to the
normal distribution and no major peak could be seen. “sequence length distribution” files did also show
a warning sign, due to having different lengths. This was due to the fact that the sequencer had
removed the adapters, resulting in reads with different lengths. “sequence duplication levels” was
another analysis which had fail signals. These figures indicated the number of time a sequence was
repeated. In this figure, if the level of duplication is low, it may indicate a high coverage level for the
target sequences and if it is high, it may indicate an enrichment bias, like PCR over amplification (Blachly
et al., 2015; Li et al., 2015). In this data sets, the duplication levels were rather high. This was most
probably due to the fact that the data file was in transcriptomic level; For this type of data, in order to
be able to detect the low-expressed transcripts, the sequencer performs different number of
amplification levels for each of the transcripts. This may result in some sequences being highly
expressed, creating large sets of duplicates. Therefore, this part did not indicate any major issues either,
which is a good indication to understand that the adapter remainders were removed beforehand.
In general, trimming ensured the complete removal of the adapters. Moreover, the too short reads were
also removed by trimming, since they would map non-specifically to the human genome and did not
have much of informational value. Trimming improved the data quality, especially per base sequence
quality and per base sequence content.
The bar plot showing the total number of mapped counts to human genome for all of the samples
showed some interesting facts as well. The first thing that would catch the eye was the really low
number of counts for the bright cells of CVID patient number 10 (CVID10-B) with almost 15,000,000
Page 41
33
reads and 21% mapability to the human genome. The exact reason could not be identified but this was
probably due to some kind of contamination or clinical error. Also, the counts for the old healthy donors
were rather higher than the new samples. Therefore, the need to do normalization was taken into
consideration. The box plots in figure 6 showed that the normalization had been performed optimally
and the count for all of the data sets including CVID10-B were normalized, although still having some
minor fluctuations at the 10% interquartile range for this sample.
The general PCA plot for all of the data sets showed a very good separation between the groups. As
expected, all of the naïve cells of CVID patients clustered together, although patient number 10 was a bit
far from the rest of the samples. CVID bright cells did also cluster together, with patient number 10
having almost the same distance as in the naïve cells. Although this patient showed a small deviation in
both naïve and bright cells, it was not removed from the data sets, since it would still cluster with the
right group and showed no major difference compared to the rest of the patients regarding expression.
Moreover, the old and new samples for healthy donors did cluster together in both naïve and bright
groups. The old healthy samples showed a very small deviation from the new samples, but since the
clusters were quite distinguishable, no further optimizations were done.
After DE analysis with p-value <0.05 the differentially expressed genes were obtained. The number of
identified upregulated and downregulated genes were so high, that more strict parameters were chosen
to extract only those genes that were more significantly differentially expressed. With |Log 2 FC| > 2
and P-value < 0.01, the number of obtained DEGs were significantly reduced. In general, the most
number of DEGs could be seen between CVID naïve and HD naïve cells.
Moving on to heatmaps, it could be seen that the proportion of up- and down regulated genes in each
comparison was a bit different from the statistics in table 2. Generating the heatmaps for all of the
differentially expressed genes was computationally problematic. Therefore the top 100 genes with the
highest |Log 2 FC| were used to generate the heatmaps. This could be the reason of differentiation
between the proportion of differentially expressed genes in the heatmaps and table 2. Apart from that,
the heatmaps indicated a very good clustering between the groups.
The individual PCA plots showed quite well clusters between the groups. Although a variation as small as
~10% could be seen between the 'old' and 'new' healthy donors. On the other hand, in the bar plots for
the important genes, there were many t-tests with P-values slightly more than 0.05 which were most
probably due to some deviation in one or two of the CVID or HD samples. The variations illustrated in
the individual PCA plots could explain the small deviations in the bar plots and could be the reason for
many of the failed t-tests. Moreover, the bright and naïve cell of patient number 10 which had a slightly
different expression pattern, could be another reason for many of the failed t. tests.
The developmental pathway of human B cells is tightly regulated by a number of transcription factors,
toll-like receptors and receptors of chemokines and cytokines. Through activation events, B cells will
enter the GC and differentiate into MBCs and finally into PCs. Since patients with CVID all have that
feature in common that they have a severely reduced capability to produce antibodies, analyses
comparing naive and CD27bright MBCs in healthy donors and CVID patients showed that naive B cells
Page 42
34
are already dysregulated in all of the analyzed patients. In particular it was found that several
transcription factors important for B-cell identity were differentially expressed in the patients with CVID.
PAX5, ETS1, POU2AF1 and SPIB were all more expressed in naive B cells of CVID patients whereas BACH
2 and EBF1 were both downregulated in naïve B cells of these patients. Together, these results would
indicate that the transcription factor balance normally found in naive B cells have been tilted and that
this most likely will affect the function of these cells. Indeed, PAX5 was kept high in CD27bright MBCs
from patients with CVID and an increase of PRDM1 could not be observed in CD27bright MBCs of the
patients ,although the difference was not significant, since PAX5 inhibits the expression of PRDM1. This
also goes with the fact that ETS1 is kept high in CD27bright MBCs thus repressing the PC program.
In the Ikaros family, a family of zinc finger proteins that play an essential role during B-cell development,
it was found that IKZF1 (Ikaros) and IKZF3 (AIOLOS) were upregulated in naive B cells from patients with
CVID whereas IKZF2 (Helios) was downregulated as compared to healthy controls. This is of interest
since both IKZF1 and IKZF3 are involved in the development of autoimmunity and that IKZF1 is crucial for
B cell development in humans (Blachly et al., 2015).
Toll-like receptors (TLRs) are expressed by many different immune cells and are so-called pattern
recognition receptors. These are important in order to recognize different conserved structures on
pathogens. In this experiment, it was observed that the expression patterns of several TLRs were
changed already in naïve B cells in the patients with CVID thus possibly changing the responsiveness of
these cells to certain pathogen structures. Interestingly, especially TLR9 and TLR10 were upregulated in
CD27bright MBCs and these might have opposing roles where TLR9 induces proliferation of memory B
cells whereas TLR10 might suppress their function.
Chemokine and cytokine receptor expression patterns determine the positioning and the fate of B cells.
It was noticed that the expression of CXCR4, important for the positioning of B cells in the germinal
center, and its decoy receptor ACKR3 are dysregulated in naïve B cells in CVID patients, indicating that
the GC reaction does not work properly in these patients. In addition, the two interleukin receptors, IL4-
R and IL-21R that are both important for the regulation of the germinal center are dysregulated in
patients with CVID thus further indicating that the GC reaction is dysfunctional in these patients.
In conclusion, PAX5, ETS1, POU2AF1, SPIB, BACH 2, EBF1 and PRDM1, the Ikaros family, toll-like
receptors and a couple of chemokine and cytokine receptors such as CXCR4, ACKR3, IL4-R, and IL-21R
were identified to have a very important role in inducing common variable immunodeficiency, therefore
these could be further investigated. Moreover, it is worth mentioning that this disease has two
subtypes: infection and inflammation. These two groups exhibit different clinical symptoms as well as
lymphocyte counts. In this experiment, the patients were from both of the subtypes and the data was
not analyzed regarding this matter. Therefore, it is possible that the variations in results, especially in
the bar plots would be a result of this matter.
Page 43
35
Ethical aspects
The RNA sequencing data files of the B cells of four healthy individuals was obtained from an experiment
which was previously conducted by the main supervisor, Ola Grimsholm. This experiment was approved
by Bambino Gesu Children Hospital, Rome, Italy with reference number of 727-17 on the 15th of
November 2017. All of these samples were collected anonymously and all of the donors were informed
about the flow of the experiment and its´ importance for developing new ways to diagnose and treat
the disease. This could lead to early diagnosis of the disease and also using accurate treatment protocols
for a faster and more personalized treatment. No personal information from the individuals was
obtained and no informed consent was given. The samples of the CVID patients were covered with the
ethical approval of another experiment performed by the supervisor. The study was approved by the
Central Ethical Review Board in Gothenburg in 15th of November 2017 with reference number of 727-17
for another experiment. Informed consent was obtained from each patient that would take part in this
study. The clinician did also provide patients with sufficient information about the objectives of the
experiment, and what their samples will be used for. All of the patients with common variable
immunodeficiency disorder were able to withdraw their donated samples at any time point they
wanted. The patient samples were gathered at Sahlgrenska university hospital, university of
Gothenburg, Gothenburg, Sweden. The study was performed following the guidelines of the Declaration
of Helsinki which is developed by the World Medical Association (WMA) for medical research on
identifiable human material and data.
Page 44
36
Future perspectives:
The obtained results from this data set was satisfactory but should be validated by another sequencing
run, preferably with both CVID and Healthy donors. Also a couple of samples could be used for a qPCR
run to verify the quantity and accuracy of the identified differentially expressed genes. Also, it could be a
good idea to identify the single nucleotide polymorphisms to identify the origin of the disease.
Apart from these, the Venn diagram showed quite interesting results regarding the common
differentially expressed genes between each of the groups. It could be of high importance to further
analyse these comparison groups. This could give a much better understanding of the genes that were
suppressed or highly activated in CVID patients, in their naïve or bright cells. From these important
comparison groups, a couple are mentioned here:
• DE genes only in CVID n vs. CVID b group (124).
• DE genes only in CVID n vs. HD n group (1490).
• DE genes only in HD n vs. HD b (431).
• DE genes only in CVID b vs. HD b (785).
• DE genes that were only present in HD n vs. HD b and not in CVID n vs. CVID b (431+72+80+43).
• DE genes that were only present in CVID n vs. CVID b and not in HD n vs. HD b (124+43+48+15).
• DE genes that were only present in CVID n vs. HD n and not in HD n vs. HD b
(1490+43+15+1695).
• DE genes that were only present in CVID b vs. HD b and not in HD n vs. HD b (785+1695+15+48).
• DE genes common between CVID n vs. HD n and CVID b vs. HD b that are not present in HD n vs.
HD b (1695+15).
On the other hand, as mentioned before, this disease has two subtypes: infection and inflammation.
These two groups show different clinical symptoms and lymphocyte counts. In this experiment, CVID
patients were chosen randomly from both of the subtypes and the data was not analysed regarding this
matter. Therefore, it is possible that the variations in results could be lower if this matter was taken into
account. For future experiments, it would be essential to analyse the expression levels of these groups
separately and compare the probable differences. This could lead to a better understanding of the
disease, as well as being able to have better prognostics and diagnostics.
Page 45
37
Acknowledgements
I would like to thank my supervisor, Dr. Ola Grimsholm from university of Gothenburg for his brilliant
advice and encouragement throughout the project and also my co-supervisor, Andreas Tilevik from
university of Skövde for his outstanding support and patience for me. I would also like to acknowledge
Professor Vanda Friman from Sahlgrenska university hospital who contributed with the clinical
expertise, selection of patients and scientific discussions as well as our contributors in Rome, Dr. Sabina
Barresi and Professor Marco Tartaglia who performed RNA library preparation and sequencing.
Page 46
38
References
Abbas, A. K., Lichtman, A. H., & Pillai, S. (2014). Cellular and molecular immunology E-book. Elsevier
Health Sciences
Antia, R., Ganusov, V. V., & Ahmed, R. (2005). The role of models in understanding CD8+ T-cell memory.
Nature Reviews Immunology, 5(2), 101.
Blachly, J. S., Ruppert, A. S., Zhao, W., Long, S., Flynn, J., Flinn, I., ... & Rassenti, L. Z. (2015).
Immunoglobulin transcript sequence and somatic hypermutation computation from unselected RNA-seq
reads in chronic lymphocytic leukemia. Proceedings of the National Academy of Sciences, 112(14), 4322-
4327.
Bofill, M., Janossy, G., Janossa, M., Burford, G. D., Seymour, G. J., Wernet, P., & Kelemen, E. (1985).
Human B cell development. II. Subpopulations in the human fetus. The Journal of Immunology, 134(3),
1531-1538.
Borst, J., Hendriks, J., & Xiao, Y. (2005). CD27 and CD70 in T cell and B cell activation. Current opinion in
immunology, 17(3), 275-281.
Bräuninger, A., Goossens, T., Rajewsky, K., & Küppers, R. (2001). Regulation of immunoglobulin light
chain gene rearrangements during early B cell development in the human. European journal of
immunology, 31(12), 3631-3637.
Budeus, B., de Reynoso, S. S., Przekopowitz, M., Hoffmann, D., Seifert, M., & Küppers, R. (2015).
Complexity of the human memory B-cell compartment is determined by the versatility of clonal
diversification in germinal centers. Proceedings of the National Academy of Sciences, 112(38), E5281-
E5289.
Carsetti, R., Rosado, M. M., Donnanno, S., Guazzi, V., Soresina, A., Meini, A., ... & Quinti, I. (2005). The
loss of IgM memory B cells correlates with clinical disease in common variable immunodeficiency.
Journal of Allergy and Clinical Immunology, 115(2), 412-417.
Chapel, H., Lucas, M., Lee, M., Bjorkander, J., Webster, D., Grimbacher, B., ... & Hammarstrom, L. (2008).
Common variable immunodeficiency disorders: division into distinct clinical phenotypes. Blood, 112(2),
277-286.
Chen, D., Gerasimčik, N., Camponeschi, A., Tan, Y., Wu, Q., Brynjolfsson, S., ... & Fogelstrand, L. (2017).
CD27 expression and its association with clinical outcome in children and adults with pro-B acute
lymphoblastic leukemia. Blood cancer journal, 7(6), e575.
Duperray, C., Boiron, J. M., Boucheix, C., Cantaloube, J. F., Lavabre-Bertrand, T., Attal, M., ... & Klein, B.
(1990). The CD24 antigen discriminates between pre-B and B cells in human bone marrow. The Journal
of Immunology, 145(11), 3678-3683.
Page 47
39
Gangemi, S., Allegra, A., & Musolino, C. (2015). Lymphoproliferative disease and cancer among patients
with common variable immunodeficiency. Leukemia research, 39(4), 389-396.
Garrone, P., Van Kooten, C., & Banchereau, J. CD40 and B Cell Antigen Receptor Dual Triggering of
Resting B Lymphocytes Turns on a Partial Germinal Center Phenotype By Laurent Galibert, Nicolas
Burdin, Blandine de Saint-Vis.
Gathmann, B., Mahlaoui, N., Gérard, L., Oksenhendler, E., Warnatz, K., Schulze, I., ... & Guzman, D.
(2014). Clinical picture and treatment of 2212 patients with common variable immunodeficiency.
Journal of Allergy and Clinical Immunology, 134(1), 116-126.
Goldman, A. S., & Prabhakar, B. S. (1996). Immunology overview. University of Texas Medical Branch at
Galveston, Galveston (TX).
Guan, X. H., Hong, X., Zhao, N., Liu, X. H., Xiao, Y. F., Chen, T. T., ... & Fu, M. (2017). CD38 promotes
angiotensin II‐induced cardiac hypertrophy. Journal of cellular and molecular medicine, 21(8), 1492-
1502
Haas, K. M., & Tedder, T. F. (2005). Role of the CD19 and CD21/35 receptor complex in innate immunity,
host defense and autoimmunity. In Mechanisms of Lymphocyte Activation and Immune Regulation X
(pp. 125-139). Springer, Boston, MA.
Jackson, D. G., & Bell, J. I. (1990). Isolation of a cDNA encoding the human CD38 (T10) molecule, a cell
surface glycoprotein with an unusual discontinuous pattern of expression during lymphocyte
differentiation. The Journal of Immunology, 144(7), 2811-2815.
Janeway, C. A., Travers, P., Walport, M., & Shlomchik, M. (1996). Immunobiology: the immune system in
health and disease (Vol. 7, pp. 3-26). London: Current Biology
Jolles, S., Tyrer, M., Johnson, M., & Webster, D. (2001). Long term recovery of IgG and IgM production
during HIV infection in a patient with common variable immunodeficiency (CVID). Journal of clinical
pathology, 54(9), 713-715.
Kay, R. M. R. P., Rosten, P. M., & Humphries, R. K. (1991). CD24, a signal transducer modulating B cell
activation responses, is a very short peptide with a glycosyl phosphatidylinositol membrane anchor. The
Journal of Immunology, 147(4), 1412-1416.
Keller, M., Glessner, J., Resnick, E., Perez, E., Chapel, H., Lucas, M., ... & Hakonarson, H. (2014). Burden of
copy number variation in common variable immunodeficiency. Clinical & Experimental
Immunology, 177(1), 269-271.
Keller, M. D., & Jyonouchi, S. (2013). Chipping away at a mountain: genomic studies in common variable
immunodeficiency. Autoimmunity reviews, 12(6), 687-689.
Kienzler, A. K., Hargreaves, C. E., & Patel, S. Y. (2017). The role of genomics in common variable
immunodeficiency disorders. Clinical & Experimental Immunology, 188(3), 326-332.
Page 48
40
Kleiveland, C. R. (2015). Peripheral blood mononuclear cells. In The impact of food bioactives on
health (pp. 161-167). Springer, Cham.
Knight, A. K., & Cunningham-Rundles, C. (2006). Inflammatory and autoimmune complications of
common variable immune deficiency. Autoimmunity reviews, 5(2), 156-159.
Kurosaki, T., Aiba, Y., Kometani, K., Moriyama, S., & Takahashi, Y. (2010). Unique properties of memory B
cells of different isotypes. Immunological reviews, 237(1), 104-116.
Maglione, P. J. (2016). Autoimmune and lymphoproliferative complications of common variable
immunodeficiency. Current allergy and asthma reports, 16(3), 19.
Mensah, F. F., Armstrong, C. W., Reddy, V., Bansal, A. S., Berkovitz, S., Leandro, M. J., & Cambridge, G.
(2018). CD24 expression and B cell maturation shows a novel link with energy metabolism: potential
implications for patients with Myalgic Encephalomyelitis/Chronic Fatigue Syndrome. Frontiers in
immunology, 9, 2421.Misra, A. K., Levy, M. M., & Ward, N. S. (2020). Biomarkers of Immunosuppression.
Critical Care Clinics, 36(1), 167-176.
Murphy, M. (2009). Post-transfusion purpura. Practical Transfusion Medicine. 3rd ed: Wiley-Blackwell,
117-21.
Musolino, C., Allegra, A., Minciullo, P. L., & Gangemi, S. (2014). Allergy and risk of hematologic
malignancies: associations and mechanisms. Leukemia research, 38(10), 1137-1144.
Nakamura, K., Terai, Y., Tanabe, A., Ono, Y. J., Hayashi, M., Maeda, K., ... & Tanaka, T. (2017). CD24
expression is a marker for predicting clinical outcome and regulates the epithelial-mesenchymal
transition in ovarian cancer via both the Akt and ERK pathways. Oncology reports, 37(6), 3189-3200.
O'Leary NA, Wright MW, Brister JR, Ciufo S, Haddad D, McVeigh R, Rajput B, Robbertse B, Smith-White
B, Ako-Adjei D, Astashyn A, Badretdin A, Bao Y, Blinkova O, Brover V, Chetvernin V, Choi J, Cox E,
Ermolaeva O, Farrell CM, Goldfarb T, Gupta T, Haft D, Hatcher E, Hlavina W, Joardar VS, Kodali VK, Li W,
Maglott D, Masterson P, McGarvey KM, Murphy MR, O'Neill K, Pujar S, Rangwala SH, Rausch D, Riddick
LD, Schoch C, Shkeda A, Storz SS, Sun H, Thibaud-Nissen F, Tolstoy I, Tully RE, Vatsan AR, Wallin C, Webb
D, Wu W, Landrum MJ, Kimchi A, Tatusova T, DiCuccio M, Kitts P, Murphy TD, Pruitt KD. (2015).
Reference sequence (RefSeq) database at NCBI: current status, taxonomic expansion, and functional
annotation. Nucleic acids research, 44(D1), D733-D745.
Picot, J., Guerin, C. L., Le Van Kim, C., & Boulanger, C. M. (2012). Flow cytometry: retrospective,
fundamentals and recent instrumentation. Cytotechnology, 64(2), 109-130.• Reinherz, E. L.,
Kung, P. C., Goldstein, G., Levey, R. H., & Schlossman, S. F. (1980). Discrete stages of human intrathymic
differentiation: analysis of normal thymocytes and leukemic lymphoblasts of T-cell lineage. Proceedings
of the National Academy of Sciences, 77(3), 1588-1592.• Sauls, R. S., & Taylor, B. N. (2018). Histology,
T-Cell Lymphocyte. In StatPearls [Internet]. StatPearls Publishing.
Page 49
41
Sanz, I., Wei, C., Lee, F. E. H., & Anolik, J. (2008, February). Phenotypic and functional heterogeneity of
human memory B cells. In Seminars in immunology (Vol. 20, No. 1, pp. 67-82). Academic Press.
Scully, C., Georgakopoulou, E. A., & Hassona, Y. (2017). The immune system: basis of so much health and
disease: 4. immunocytes. Dental update, 44(5), 436-442.
Seifert, M., & Küppers, R. (2016). Human memory B cells. Leukemia, 30(12), 2283.
Tobón, G. J., Izquierdo, J. H., & Cañas, C. A. (2013). B lymphocytes: development, tolerance, and their
role in autoimmunity—focus on systemic lupus erythematosus. Autoimmune diseases, 2013.
Tedder, T. F. (2009). CD19: a promising B cell target for rheumatoid arthritis. Nature reviews
Rheumatology, 5(10), 572.
Teng, G., & Papavasiliou, F. N. (2007). Immunoglobulin somatic hypermutation. Annu. Rev. Genet., 41,
107-120.
Teplyakov, A., Obmolova, G., Malia, T. J., & Gilliland, G. L. (2017). Crystal structure of CD27 in complex
with a neutralizing noncompeting antibody. Acta Crystallographica Section F: Structural Biology
Communications, 73(5), 294-299.
Thierry-Mieg, D., & Thierry-Mieg, J. (2006). AceView: a comprehensive cDNA-supported gene and
transcripts annotation. Genome biology, 7(1), S12.
Victora, G. D., & Nussenzweig, M. C. (2012). Germinal centers. Annual review of immunology, 30, 429-
457.
Wang, K., Wei, G., & Liu, D. (2012). CD19: a biomarker for B cell development, lymphoma diagnosis and
therapy. Experimental hematology & oncology, 1(1), 36.
Wolf, H. M., Thon, V., Litzman, J., & Eibl, M. M. (2015). Detection of impaired IgG antibody formation
facilitates the decision on early immunoglobulin replacement in hypogammaglobulinemic patients.
Frontiers in immunology, 6, 32.
Yamamoto, H., Kishimoto, T., & Minamoto, S. (1998). NF-κB activation in CD27 signaling: involvement of
TNF receptor-associated factors in its signaling and identification of functional region of CD27. The
Journal of Immunology, 161(9), 4753-4759.
Yatim, K. M., & Lakkis, F. G. (2015). A brief journey through the immune system. Clinical Journal of the
American Society of Nephrology, 10(7), 1274-1281.
Yazdani, R., Fatholahi, M., Ganjalikhani-Hakemi, M., Abolhassani, H., Azizi, G., Hamid, K. M., ... &
Aghamohammadi, A. (2016). Role of apoptosis in common variable immunodeficiency and selective
immunoglobulin A deficiency. Molecular immunology, 71, 1-9.
Zhou, L. J., Ord, D. C., Omori, S. A., & Tedder, T. F. (1992). Structure of the genes encoding the CD19
antigen of human and mouse B lymphocytes. Immunogenetics, 35(2), 102-111.
Page 50
42
Appendix
Sorting the peripheral blood mononuclear cells
Gating strategy was used to sort the naïve and CD27 bright peripheral blood mononuclear cells from
other lymphocytes and cell debris. Figure 12 shows the gating method step by step. First mononuclear
cells and especially Lymphocytes were gated to remove any cell debris by using the side scatter-area
(SSC-A) and forward scatter-area (FSC-A). then, by using FSC-A (area) and FSC-W (width), the double or
multiple cells were gated out and only single cells were chosen. After this, CD19 and FSC-A were used to
extract the B cells. By using CD24 vs. CD27, two groups of cells were isolated (4th scatter plot):
CD24(+)CD27(+) cells were the CD27 bright cells, while the CD24(+)CD27(-) gated the pre-immune cells
which are not yet activated. The pre-immune cells were put in another scatter plot with CD24 on Y-axis
and CD38 on the X-axis to extract only the naïve B cells.
To check the purity of the sorted cells, a post-sorting level was performed with the naïve and CD27
bright- specific markers (CD24 vs. CD38 for naïve and CD 24vs. CD27 for the bright cells).
Figure 12. a schematic representation of the gating strategy used for sorting the naïve and CD27 bright B
cells. The first plot shows gating the lymphocytes with SSC-A and FSC-A. the second one indicates the
extraction of the singlets using FSC-A and FSC-W. the third shows the gating of the B cells using CD19
and FSC-A. the fourth scatter plot represents the isolation of pre-immune cells as well as the CD 27
bright cells, and the fifth one shows the extraction of the naïve cells from pre-immune cells, using CD24
and CD38. The last two figures show post-sorting levels to ensure the purity of the final sorted cells.
Page 51
43
Gel electrophoresis
Figure 13 illustrates the result of running the CVID and healthy samples on gel electrophoresis to ensure
the RNA quality of the samples before sequencing. The two visible lines in each sample are 18S and 28S
markers. It can be seen that the RIN value (RNA integrity number) for samples in well G2 and H2 were
very low, therefore, these two samples were removed. The first six samples were preserved and further
sequenced.
Figure 13. the results of gel electrophoresis on the isolated samples. The first six samples showed a high
quality with RIN value more than 7.0, but the last two had a low RIN value, 5.3 and 3.5 respectively.
Therefore, these samples were removed from further analysis.