IDENTIFICATION OF MAGNETIC MINERALS BY SCANNING ELECTRON MICROSCOPE AND APPLICATION OF FERROFLUID
G. KLETETSCHKA1,2,3, A. KONTNY4
1 Department of Physics, Catholic University of America, Washington DC, USA 2 Institute of Geology, Acad. Sci. Czech Republic, Rozvojová 6, 160 00 Prague 6, Czech
Republic 3 NASA Goddard Space Flight Center, Greenbelt, USA ([email protected]) 4 Geological-Paleontological Institute, University of Heidelberg, Heidelberg, Germany
Received: September 27, 2004; Revised: January 6, 2005; Accepted: January 13, 2005
ABSTRACT
Magnetic minerals are mostly identified by a combination of rock magnetic and microscopic techniques and the ferrofluid method in combination with an optical microscope was applied during the last decades. But today, scanning electron microscopy (SEM) is preferred for the observation of mineral phases because its depth of focus and resolving capability at the same magnification. In this study, we report on a method, which allows ferrofluid application under the SEM. We coated a polished basalt sample containing titanomagnetite grains with high demagnetizing fields, with a colloidal suspension containing magnetite particles (ferrofluid) ranging in size between 11 and 20 nm. Due to large gradients of multidomain grains the ferrofluid particles adhered to their surfaces. Other grains of similar composition present (ilmenohematite) but with low demagnetizing fields do not generate large magnetic gradients and therefore do not attract the colloidal particles. Upon evaporation of the ferrofluid and covering the sample with conducting material the magnetic grains with high demagnetizing field are easily identifiable under the scanning electron microscope. The different mineralogy observed by this method is confirmed by temperature dependent variation of magnetic susceptibility, revealing titanomagnetite and ilmenohematite as magnetic carriers in the basaltic samples.
K eyw ord s : magnetic mineralogy, ferrofluid, SEM, magnetism, magnetic
susceptibility, titanomagnetite, ilmenohematite
1. INTRODUCTION
Small magnetic particles are of interest to the geophysical community because they control remanence behavior and high variation in magnetic susceptibility, often giving important clues concerning the genesis of the rock containing these particles. Magnetic
minerals are mostly identified by a combination of rock magnetic and microscopic techniques like low- and high-temperature susceptibility or remanence, Bitter pattern imaging using an optical microscope and scanning electron microscope (e.g. Muxworthy and Heider, 2001; Kontny et al., 2003a). Electron microscope observations are increasingly essential and can be subdivided in two groups. The scanning electron microscope (SEM) that are mostly used for geoscientific applications resolves grain sizes larger than about 1 µm, while the transmission electron microscope (TEM) resolves the submicron range down to a few Å. These techniques are used to provide detailed information of the microstructure, crystallography and composition of magnetic mineral phases (e.g. Evans and Wayman, 1997; Cloete et al., 1999; Otofuji et al., 2000; Pósfai et al., 2000; Shau et al., 2000; Zhou et al., 1997; 2000; Weil and van der Voo, 2002; McEnroe et al., 2004). Although the magnification of a good optical polarizing microscope, which is used for the ferrofluid method, is similar to the SEM, in recent studies the latter microscope is preferred choice because of its depth of focus and resolving capability at the same magnification (for basics of electron microscopy see e.g. Goldstein et al., 2003).
Basalts generally have abundant fine-grained magnetic minerals related to the quenching process during lava extrusion. Magnetic methods like temperature-dependence of magnetic susceptibility often indicate more than one magnetic phase within basaltic rocks and a large variation in ilmenohematite and titanomagnetite abundance and grain size strongly influences the interpretation of magnetic properties (e.g. Kontny et al., 2003b, Just et al., 2004). A rapid method to distinguish between those two phases is the ferrofluid method, which has been used for decades to detect magnetic material and their domain structures under an optical microscope (Bitter, 1931). The ferrofluid method has also been used in several studies on pyrrhotite distinguishing ferri- and antiferromagnetic modifications (e.g. Soffel, 1981; Zapletal, 1993; Kontny et al., 2000) or for the distinction between magnetite and hematite (Just et al., 2004). This method is also widely applied in nanotechnology studies as e.g. shown by Yellen et al. (2004).
A ferrofluid is a stable colloidal suspension of magnetite/maghemite particles that range in size from 11 to 20 nm (Dr. Raj, Ferrotech Corp., personal communication), which are distributed in a liquid medium. We applied this solution on petrographic thin sections or polished pieces of rock that contain an unknown concentration of magnetic carriers. Some magnetic carriers (magnetite, iron, maghemite) have values of saturation magnetization above 80 kA/m (Dunlop and Özdemir, 1997) and therefore contain large number of magnetic domains packed closely together due to large demagnetizing fields. Magnetic domain arrangement generates large magnetic gradients above the polished surface and attracts the particles of the ferrofluid. Other magnetic grains that have low saturation magnetization (hematite, titanohematite) do not contain magnetic domains and therefore do not attract the ferrofluid particles. This allows detection of grains with induced magnetic component in the polished piece of rock under an optical microscope. However, various extrusive, intrusive and sedimentary rocks often contain magnetic particles that are less than a few micrometers in size. Determination of the magnetic carriers of such small size is nearly impossible when using a regular optical microscope and it is also problematic when using a Scanning Electron Microscope (SEM) where the composition detected by Electron Diffracted X-ray (EDX) is limited by the beam size and
154 Stud. Geophys. Geod., 49 (2005)
Identification of Magnetic Minerals by SEM and Ferrofluid
does not allow for a definite distinction of minerals with close chemical composition (e.g. ilmenohematite and titanomagnetite).
2. PROPOSED METHOD
We report a simple and effective method to detect the micron-scale carriers of induced magnetization in rocks by modifying a classical use of ferrofluid in optical microscopy and applying this modification in SEM analysis. The first attempt to use a colloid-SEM method (Goto and Sakurai, 1977) was published as an effort to identify magnetic domains via SEM microscopy. The method consists of two parts. The first is to obtain Bitter pattern and the second to observe dry colloidal particles on domain boundaries by a scanning electron microscope (SEM). We modify this method for observation of geological material. A part of a polished specimen with unknown presence of remanence carriers is protected by tape while the exposed surface of the rest of the specimen is exposed to ferrofluid. The fluid nature of ferrofluid allows the contained superparamagnetic (SP) nanoparticles to react to large magnetic gradients produced by grains with large demagnetizing fields and attract to their surfaces. Forces of attraction act on a time scale much shorter than the time required for ferrofluid to evaporate. Therefore, after the ferrofluid is left to evaporate, the distribution of superparamagnetic particles present on the surface is controlled by magnetic gradients within the rock sample. After the tape is removed from rest of the sample the entire specimen is coated with a conducting carbon film to allow SEM analysis. The grains with large demagnetizing fields will have clusters of superparamagnetic magnetite grains around them as well as on them. These clusters are identified as bright halos around the grains when using the backscattered (BSE) imaging mode. The degree of the halo brightness depends on the magnetic nanoparticle concentration. Magnetic grains that do not have large intrinsic demagnetizing fields will not contain bright halos as they do not provide a strong enough magnetic gradient to attract nanometer scale superparamagnetic magnetite particles from the ferrofluid film.
3. MATERIALS AND MAGNETIC MEASUREMENTS
We used ferrofluid (EMG 807) from Ferrofluidics Corporation, New Hamshire, for staining the polished basalt samples. The aqueous based domain detection ferrofluid was diluted with distilled water in a ratio 1:10. The sample comes from Hawaii and is part of the basaltic tree mold obtained from Prof. James H. Stout, University of Minnesota. This 65 mm large sample provides a gradient of the oxygen fugacity causing a formation of varying amounts of titanomagnetite and ilmenohematite. The occurrence of this mineralogy made this sample suitable for our technique.
High temperature susceptibility measurements between room temperature and 970 K were done on a KLY-2 susceptometer (Agico Inc.) partly at the University of Minnesota, and partly at the University of Heidelberg. Additionally, susceptibility was measured in the temperature range between 77 and 273 K with the same instrument. The susceptibility meter uses alternating fields at 920 Hz and amplitude of 300 A/m.
Stud. Geophys. Geod., 49 (2005) 155
G. Kletetschka and A. Kontny
For scanning electron microscope (SEM) analysis we used a Leo type 440 (Zeiss) equipped with an EDX system (Oxford Instruments). We used an accelerating voltage of 20 kV. SEM images and temperature-dependent magnetic susceptibility curves presented in this study correlate on mm distance to each other. We selected three of a suite of twelve samples of the rock specimen, which is characterized by a strong change in magnetic properties and grain size (Kletetschka, 2001; and this study).
4. RESULTS AND INTERPRETATION
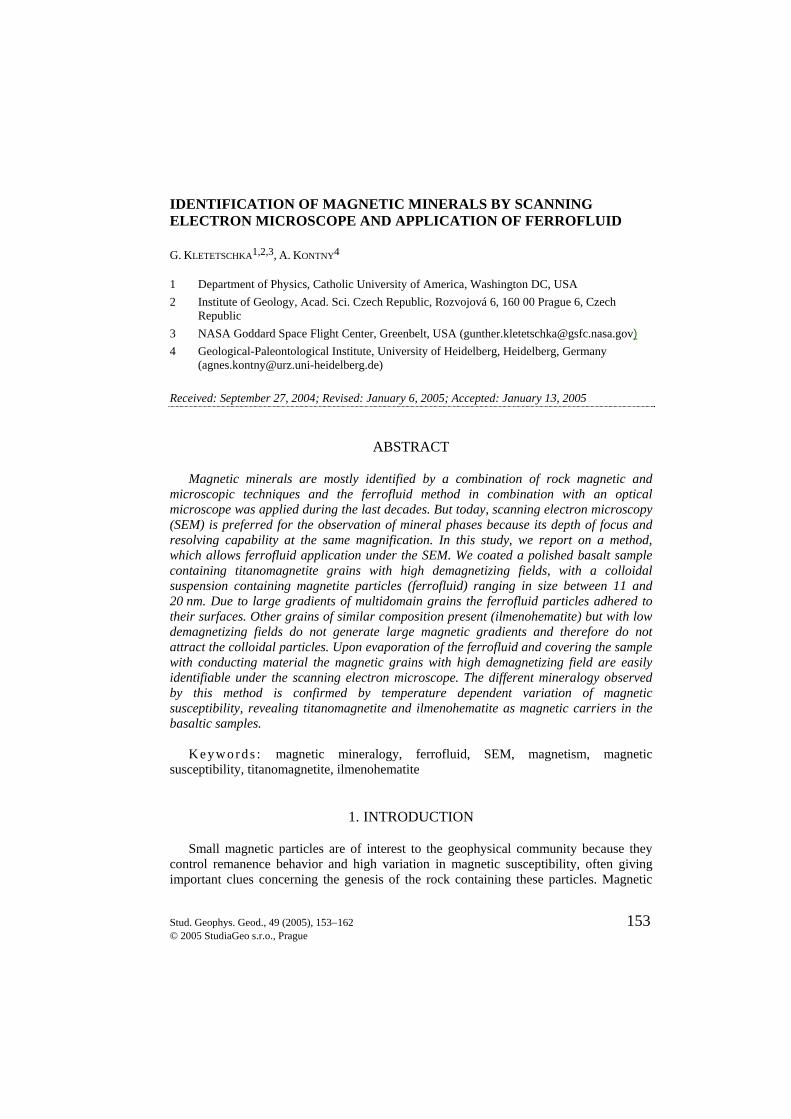
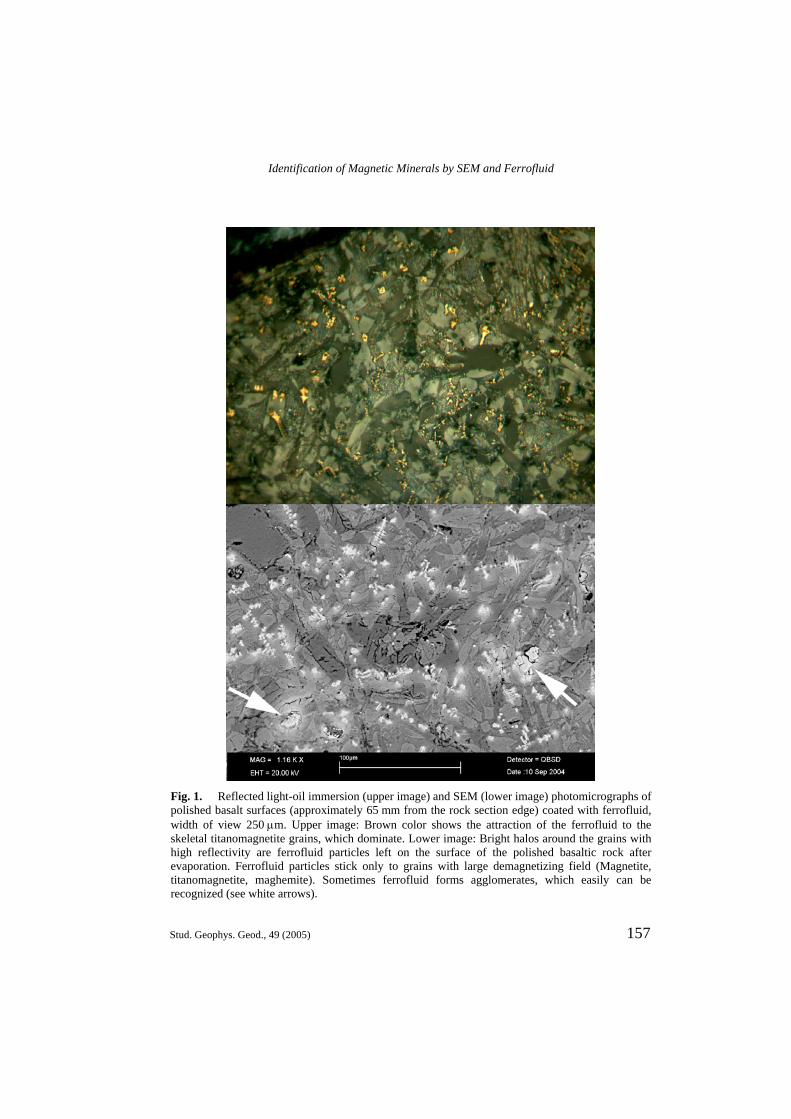
Fig. 1 shows an SEM image of the part of the sample with previously applied ferrofluid. The image shows very dark areas that represent fractures on the surface. The rest of the image features are grains of dark gray color (plagioclases), grains of light gray color (pyroxenes) and grains of bright white color (iron oxides). Note the blurry edges of these bright grains. The ferrofluid particles on top of the magnetic grains enhances the back scattering effect of the electrons in the microscope and create the strong reflecting halos around them. This rock sample was also examined by temperature dependent magnetic susceptibility in the temperature range 77 to 970 K. It shows two prominent susceptibility peaks (one much larger than the other) above room temperature (see upper curve in Fig. 2) and one small peak near 100 K (well below room temperature at which the ferrofluid was applied). This smaller peak may relate to the Verwey transition of magnetite with small titanium content often seen in loess deposits (Miyahara, 1972; Aragón et al. 1993; Kletetschka and Banerjee, 1995).
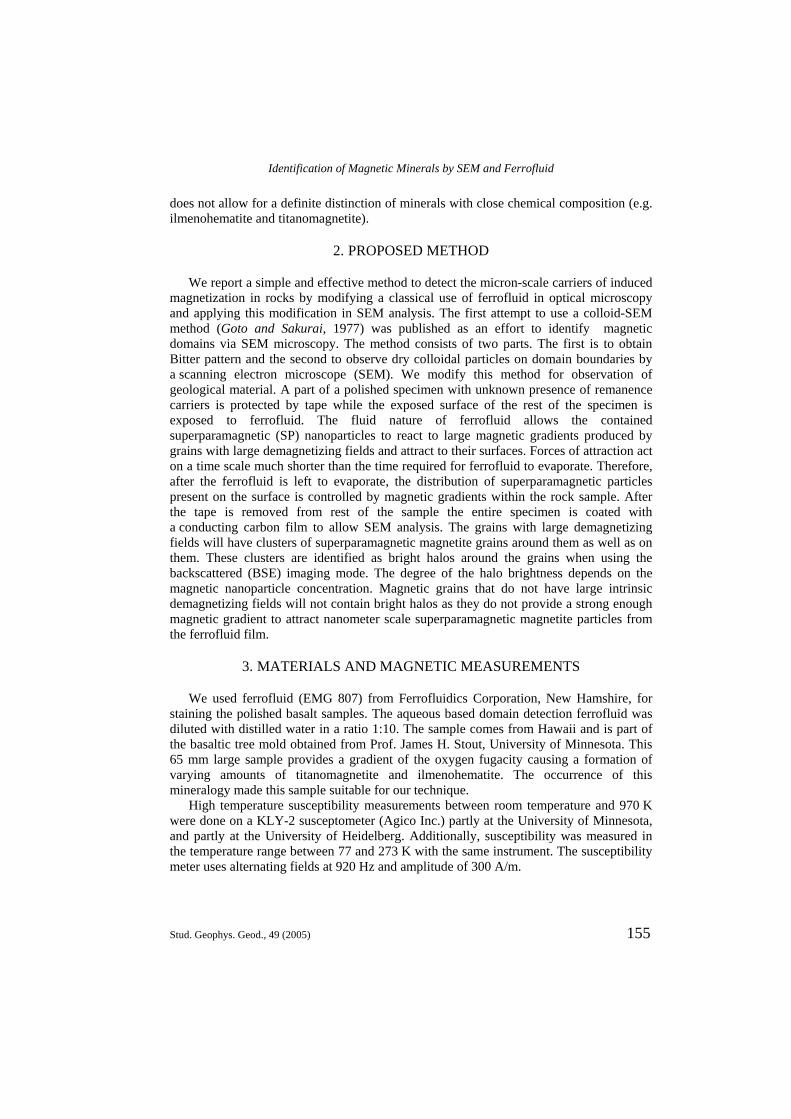
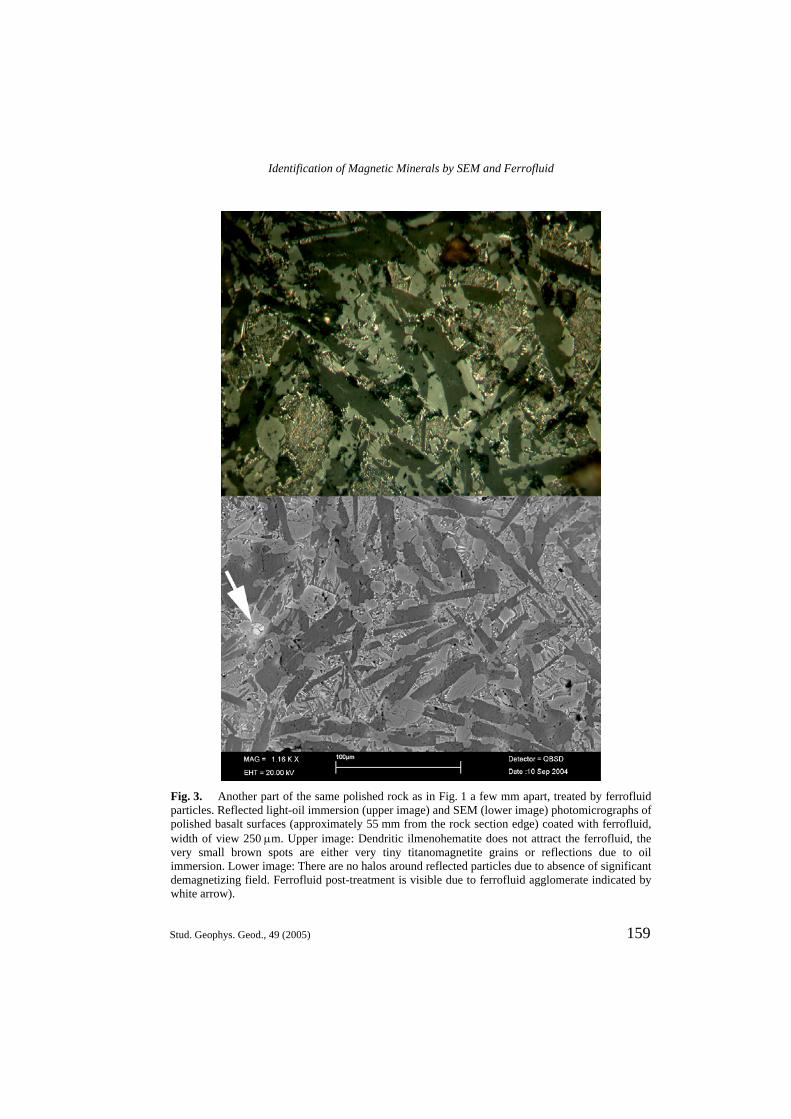
The ferrofluid-coated sample containing very weakly magnetic rock characterized by low susceptibilities (lower curve in Fig. 2) is shown in Fig. 3. Plagioclase and pyroxene are again characterized by dark gray and light gray colors, respectively. The bright color grains are the oxide particles and do not show blurry edges as in Fig. 1. The susceptibility curves in Fig. 2 shows a complete absence of the high susceptibility phase above the room temperature but shows a susceptibility peak just below 200 K, well below room temperature, which indicates the hemoilmenite phase.
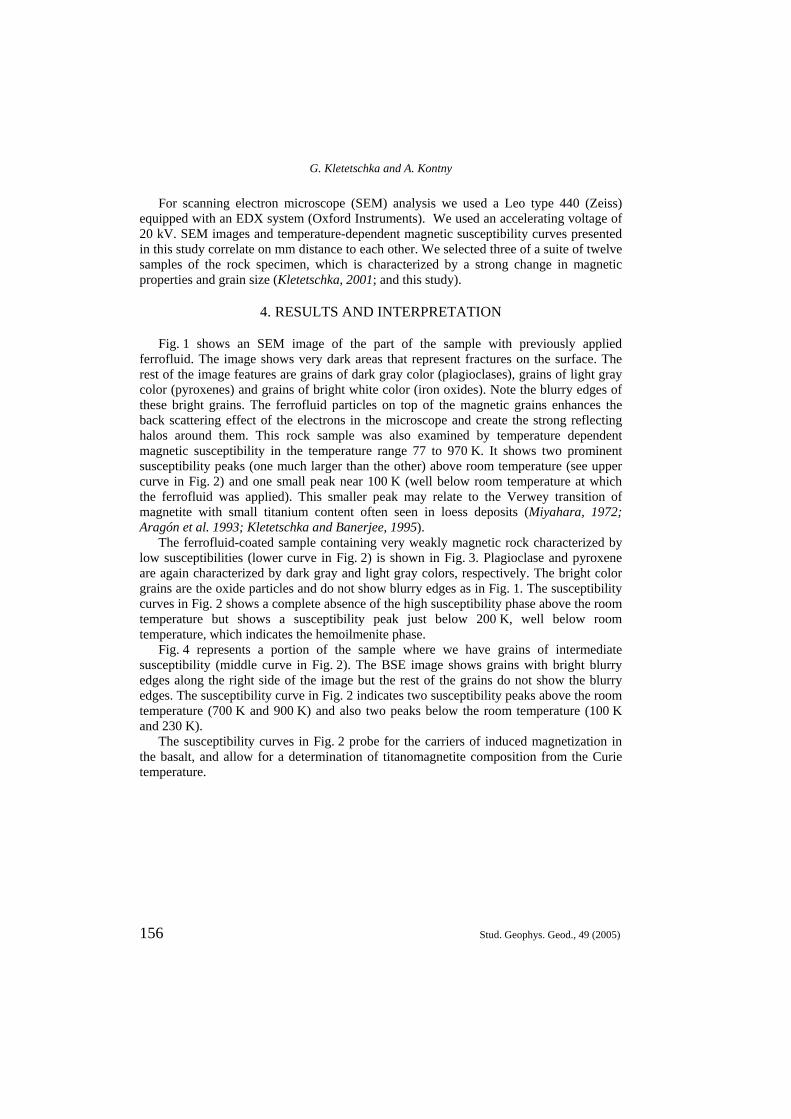
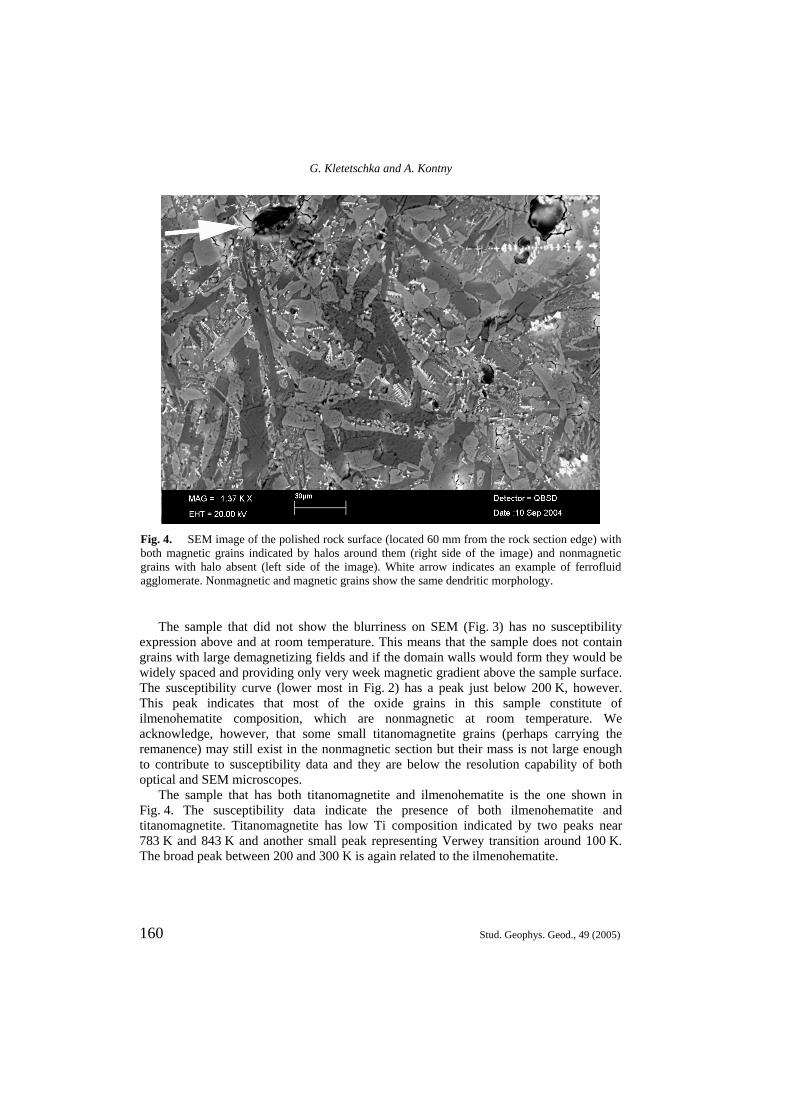
Fig. 4 represents a portion of the sample where we have grains of intermediate susceptibility (middle curve in Fig. 2). The BSE image shows grains with bright blurry edges along the right side of the image but the rest of the grains do not show the blurry edges. The susceptibility curve in Fig. 2 indicates two susceptibility peaks above the room temperature (700 K and 900 K) and also two peaks below the room temperature (100 K and 230 K).
The susceptibility curves in Fig. 2 probe for the carriers of induced magnetization in the basalt, and allow for a determination of titanomagnetite composition from the Curie temperature.
156 Stud. Geophys. Geod., 49 (2005)
Identification of Magnetic Minerals by SEM and Ferrofluid
Fig. 1. Reflected light-oil immersion (upper image) and SEM (lower image) photomicrographs of polished basalt surfaces (approximately 65 mm from the rock section edge) coated with ferrofluid, width of view 250 µm. Upper image: Brown color shows the attraction of the ferrofluid to the skeletal titanomagnetite grains, which dominate. Lower image: Bright halos around the grains with high reflectivity are ferrofluid particles left on the surface of the polished basaltic rock after evaporation. Ferrofluid particles stick only to grains with large demagnetizing field (Magnetite, titanomagnetite, maghemite). Sometimes ferrofluid forms agglomerates, which easily can be recognized (see white arrows).
Stud. Geophys. Geod., 49 (2005) 157
G. Kletetschka and A. Kontny
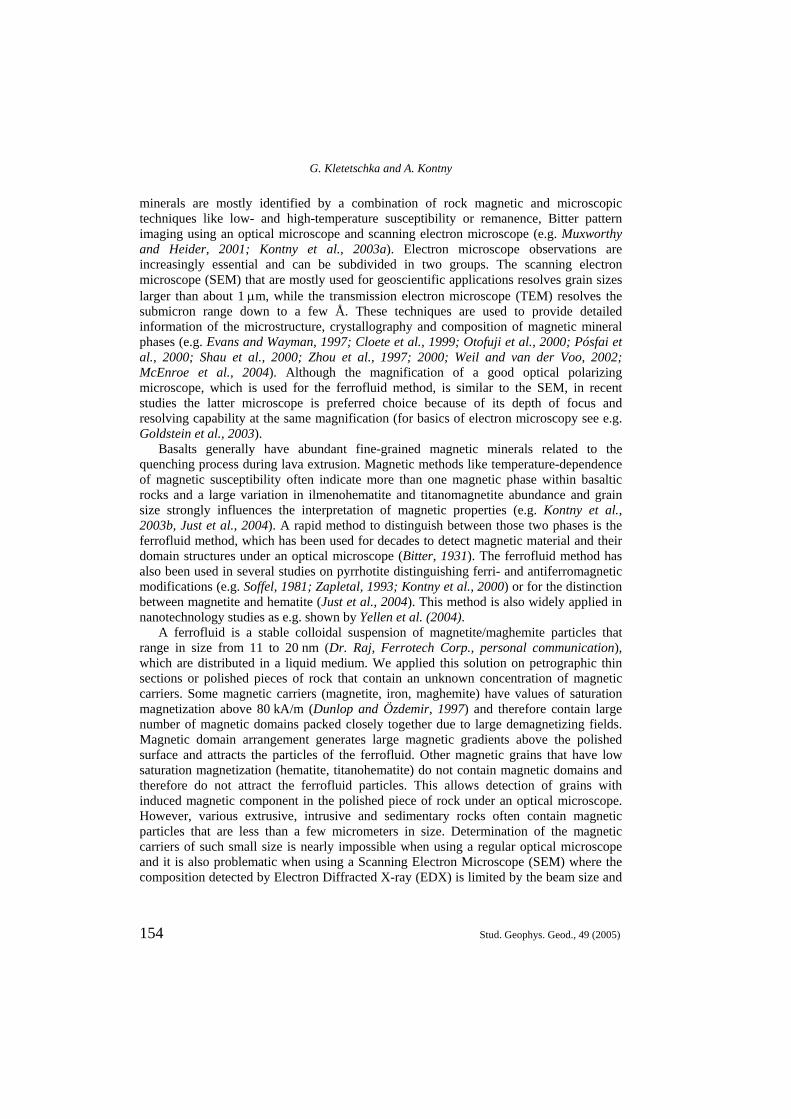
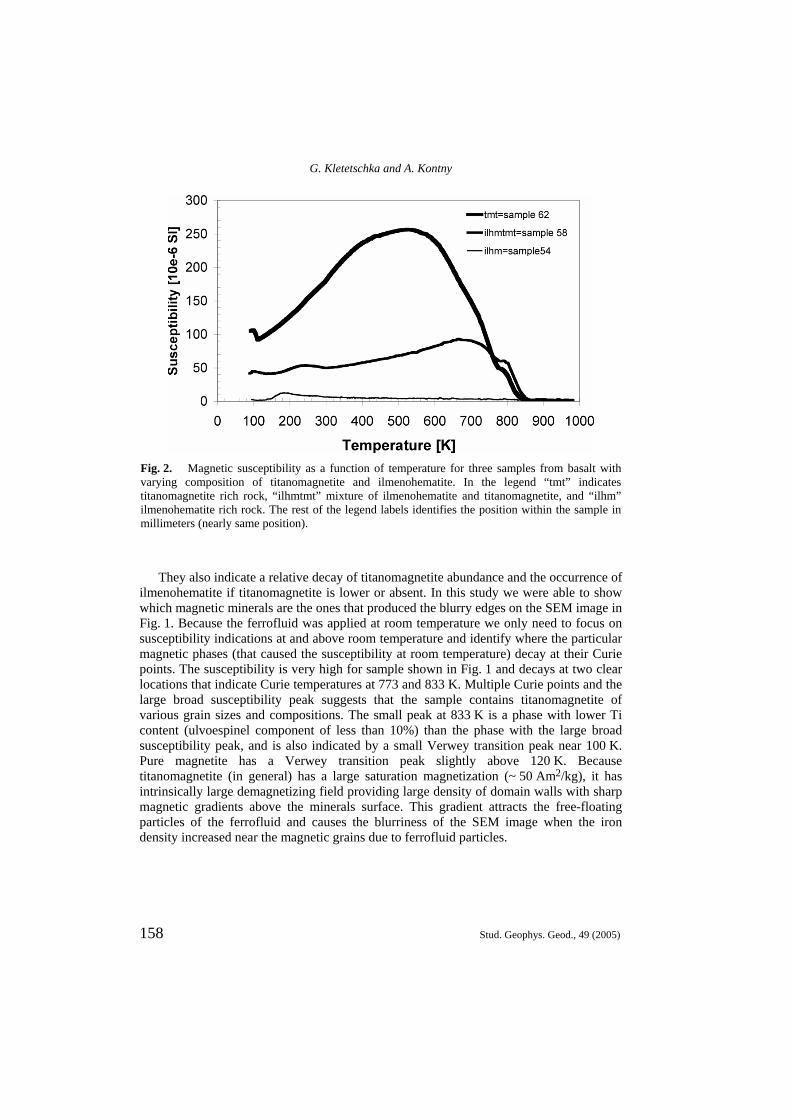
Fig. 2. Magnetic susceptibility as a function of temperature for three samples from basalt with varying composition of titanomagnetite and ilmenohematite. In the legend “tmt” indicates titanomagnetite rich rock, “ilhmtmt” mixture of ilmenohematite and titanomagnetite, and “ilhm” ilmenohematite rich rock. The rest of the legend labels identifies the position within the sample in millimeters (nearly same position).
They also indicate a relative decay of titanomagnetite abundance and the occurrence of ilmenohematite if titanomagnetite is lower or absent. In this study we were able to show which magnetic minerals are the ones that produced the blurry edges on the SEM image in Fig. 1. Because the ferrofluid was applied at room temperature we only need to focus on susceptibility indications at and above room temperature and identify where the particular magnetic phases (that caused the susceptibility at room temperature) decay at their Curie points. The susceptibility is very high for sample shown in Fig. 1 and decays at two clear locations that indicate Curie temperatures at 773 and 833 K. Multiple Curie points and the large broad susceptibility peak suggests that the sample contains titanomagnetite of various grain sizes and compositions. The small peak at 833 K is a phase with lower Ti content (ulvoespinel component of less than 10%) than the phase with the large broad susceptibility peak, and is also indicated by a small Verwey transition peak near 100 K. Pure magnetite has a Verwey transition peak slightly above 120 K. Because titanomagnetite (in general) has a large saturation magnetization (~ 50 Am2/kg), it has intrinsically large demagnetizing field providing large density of domain walls with sharp magnetic gradients above the minerals surface. This gradient attracts the free-floating particles of the ferrofluid and causes the blurriness of the SEM image when the iron density increased near the magnetic grains due to ferrofluid particles.
158 Stud. Geophys. Geod., 49 (2005)
Identification of Magnetic Minerals by SEM and Ferrofluid
Fig. 3. Another part of the same polished rock as in Fig. 1 a few mm apart, treated by ferrofluid particles. Reflected light-oil immersion (upper image) and SEM (lower image) photomicrographs of polished basalt surfaces (approximately 55 mm from the rock section edge) coated with ferrofluid, width of view 250 µm. Upper image: Dendritic ilmenohematite does not attract the ferrofluid, the very small brown spots are either very tiny titanomagnetite grains or reflections due to oil immersion. Lower image: There are no halos around reflected particles due to absence of significant demagnetizing field. Ferrofluid post-treatment is visible due to ferrofluid agglomerate indicated by white arrow).
Stud. Geophys. Geod., 49 (2005) 159
G. Kletetschka and A. Kontny
Fig. 4. SEM image of the polished rock surface (located 60 mm from the rock section edge) with both magnetic grains indicated by halos around them (right side of the image) and nonmagnetic grains with halo absent (left side of the image). White arrow indicates an example of ferrofluid agglomerate. Nonmagnetic and magnetic grains show the same dendritic morphology.
The sample that did not show the blurriness on SEM (Fig. 3) has no susceptibility expression above and at room temperature. This means that the sample does not contain grains with large demagnetizing fields and if the domain walls would form they would be widely spaced and providing only very week magnetic gradient above the sample surface. The susceptibility curve (lower most in Fig. 2) has a peak just below 200 K, however. This peak indicates that most of the oxide grains in this sample constitute of ilmenohematite composition, which are nonmagnetic at room temperature. We acknowledge, however, that some small titanomagnetite grains (perhaps carrying the remanence) may still exist in the nonmagnetic section but their mass is not large enough to contribute to susceptibility data and they are below the resolution capability of both optical and SEM microscopes.
The sample that has both titanomagnetite and ilmenohematite is the one shown in Fig. 4. The susceptibility data indicate the presence of both ilmenohematite and titanomagnetite. Titanomagnetite has low Ti composition indicated by two peaks near 783 K and 843 K and another small peak representing Verwey transition around 100 K. The broad peak between 200 and 300 K is again related to the ilmenohematite.
160 Stud. Geophys. Geod., 49 (2005)
Identification of Magnetic Minerals by SEM and Ferrofluid
5. CONCLUSIONS
This extended method allows one to find grains with large demagnetizing fields under SEM examination, which has always been a problem because ferrous and ferric iron are very similar in SEM analysis which complicates their detection (EDX, Microprobe).
Our image observations are verified by magnetic analysis indicating that the new technique is capable of selecting the magnetic grains. This seems to be possible even for very small grains as the size of the ferrofluid particles is only several nanometers. Further investigation has to be accomplished to test the magnetically oriented applications of this method in geoscientific studies.
Acknowledgements: We thank the IPP program at the University of Heidelberg for providing
travel and lodging funds for G. Kletetschka. We thank two reviewers (Prof. R. Van der Voo and Prof. M.E.. Evans) for their constructive comments and Prof. James H. Stout from University of Minnesota for kindly providing his sample for magnetic and SEM analysis. Portion of high-temperature susceptibility data was measured at Institute of Rock Magnetism, University of Minnesota, which is funded by NSF and the Keck Foundation. Thanks also to Alexander Varychev for his kind introduction to the SEM at Heidelberg. This study was carried out within a project of Grant Agency of the Academy of Sciences of the Czech Republic No.A3013406.
References
Aragón R., Buttrey D.J., Shepherd J.P. and Honig J.M., 1985. Influence of nonstoichiometry on the Verwey transition. Phys. Rev. B, 31, 430−436.
Bitter F., 1931. On Inhomogeneities in the magnetization of ferromagnetic materials. Physical Review, 38, 1903.
Cloete M., Hart R.J., Schmid H.K., Drury M., Demanet C.M. and Sankar K.V., 1999, Characterization of magnetite particles in shocked quartz by means of electron- and magnetic force microscopy: Vredefort, South Africa. Contrib. Mineral. Petrol., 137, 232−245.
Evans M.E. and Wayman M.L., 1997. Electron microscopy of small magnetic particles in geonomy. Phys. Earth Planet. Inter., 103, 343−348.
Goldstein J., Newbury D.E., Joy D.C., Lyman C.E., Echlin P., Lifshin E., Sawyer L.C. and Michael J.R., 2003. Scanning Electron Microscopy and X-ray Microanalysis. Kluwer Academic/Plenum Publishers, New York, 689 pp.
Just J., Kontny A., de Wall H., Hirt A.M. and Martin-Hernandez F., 2004. Development of magnetic fabrics during hydrothermal alteration in the Soultz-sous-Forets granite from the EPS-1 borehole, Upper Rhine Graben. In: Martin-Hernandez F., Luneburg C.M., Aubourg C. and Jackson M. (Eds.), Magnetic Fabric: Methods and Apllications. Geol. Soc. London Spec. Publ., 238, 509−526.
Kletetschka G., 2001. Remanent magnetism record in a recent basaltic tree mold. IRM Quarterly, 11(4), 2−3.
Kletetschka G. and Banerjee S.K., 1995. Magnetic stratigraphy of Chinese loess as a record of natural fires. Geophys. Res. Lett., 22, 1341−1343.
Stud. Geophys. Geod., 49 (2005) 161
G. Kletetschka and A. Kontny
Kontny A., de Wall H., Sharp T.G. and Pósfai M., 2000. Mineralogy and magnetic behavior of pyrrhotite from a 260°C section at the KTB drilling site, Germany. Am. Miner., 85, 1416−1427.
Kontny A., Engelmann R., Frederichs T., Lattard D. and Vahle C., 2003a. Low-Temperature Magnetic Behavior: Diagnostic for the Interpretation of Magnetic Mineralogy of Basalt? EOS Trans., American Geophysical Union, 84(46), F526.
Kontny A., Vahle C. and de Wall H., 2003b. Characteristic magnetic behavior of subaerial and submarine lava units from the Hawaiian Scientific Drilling Project (HSDP-2). Geochem. Geophys. Geosyst., 4, Art. No. 8703.
McEnroe S.A., Langenhorst F., Robinson P., Brimiley G.D. and Shaw C.S.J., 2004. What is magnetic in the lower crust? Earth Planet. Sci. Lett., 226, 175−192.
Miyahara Y., 1972. Impurity Effects on the Transition Temperature of Magnetite. J. Phys. Soc. Jpn., 32, 629−634.
Muxworthy A.R. and Heider F., 2001. Rock magnetic investigation of historical lavas used in palaeointensity studies. Stud. Geophys. Geod., 45, 283−296.
Otofuji Y., Uno K., Higashi T., Ichikawa T., Ueno T., Mishima T. and Matsuda T., 2000, Secondary remanent magnetization carried by magnetite inclusions in silicates: a comparative study of unremagnetized and remagnetized granites. Earth Planet. Sci. Lett., 180, 271−285.
Pósfai M., Sharp T.G. and Kontny A., 2000. Pyrrhotite varieties from the 9.1-km deep borehole of the KTB project. Am. Miner., 85, 1406−1415.
ShauY.H., Torii M., Horng C.-S. and Peacor D.R., 2000. Subsolidus evolution and alteration of titanomagnetite in ocean ridge basalts from Deep sea Drilling Project/Ocean Drilling Program Hole 504B, leg 83: implications for the timing of magnetization. J. Geophys. Res., 105(B10), 23,635−23,649.
Soffel H.-C., 1981. Domain structure of natural fine-grained pyrrhotite in a rock matrix (diabase). Phys. Earth Planet. Inter., 26, 98−106.
Weil A.B. and Van der Voo R., 2002. Insights into the mechanism for orogen-related carbonate remagnetization from growth of authigenic Fe-oxide: A scanning electron microscopy and rock magnetic study of Devonian carbonates from northern Spain. J. Geophys. Res., 107, doi 10.1029/2001JB000200.
Yellen B.B., Fridman G. and Friedman G., 2004. Ferrofluid lithography. Nanotechnology, 15, S562−S565.
Zapletal K., 1993. Effect of intergrowths of the ferromagnetic and antiferromagnetic phases on the rock magnetic properties of natural pyrrhotites. Phys. Earth Planet. Inter., 76, 151−162.
Zhou W., Van der Voo R. and Peacor D.R., 1997. Single domain and superparamagnetic titanomagnetite with variable Ti content in young ocean-floor basalts: No evidence for rapid alteration. Earth Planet. Sci. Lett., 150, 353−362.
Zhou W., Van der Voo R., Peacor D. R. and Zhang Y., 2000. Variable Ti-content and grain size of titanomagnetite as a function of cooling rate in very young MORB. Earth Planet. Sci. Lett., 179, 9−20.