INTRODUCTION During last decade, a number of studies related to mapping malaria risk along with identification of risk fac- tors have been published using modern data acquisition tools like remote sensing (RS) and global positioning sys- tem (GPS) and sophisticated analysis by means of geo- graphical information system (GIS) 1–5 . Assessment of risk factors at local scale is crucial for focused and cost-effec- tive control of disease. Socioeconomic and other attribute data contribute to detailed understanding of the disease etiology. Identification of risk factors ensures that if a localized spurt of the disease occurs, it can be associated rapidly with a likely cause, a specific vector and a prob- able human source so that appropriate preventive actions can be taken to arrest any rising trend 6 . Ranchi, the capital of Jharkhand state is endemic for malaria with Plasmodium falciparum (Pf) accounting for 50% of cases. Ranchi is situated between 22°52’ to 23°43’ N latitude and 84°56’ to 85°54’ E longitude covering an area of 5231 km 2 under 14 PHCs. The temperature in the district ranges from 5.3°C in winter to 41.2°C during sum- mer and annual rainfall is 153 cm, most of which occur during monsoon months from June to September. Entire terrain of the district is full of high and lowlands. The district is characterized by large network of streams and other water bodies which provide innumerable breeding sites for malaria vectors throughout the year. These breed- ing sites may be diverse and species-specific as per ter- rain profile. Malaria transmission risk of a location may be attributed to the presence of the breeding sites and appropriate vectors at that location. Anopheles culicifacies, J Vector Borne Dis 51, December 2014, pp. 276–281 Identification of risk factors for malaria control by focused interventions in Ranchi district, Jharkhand, India Rekha Saxena 1 , M.K. Das 2 , B.N. Nagpal 1 , Aruna Srivastava 1 , Sanjeev Kumar Gupta 1 , Anil Kumar 1 , Arvind Singh Tomar 1 , A.T.S. Sinha 3 , Rajkumari Vidyotma 3 , A.T. Jeyaseelan 4 , Vijay Kumar Baraik 5 & V.P. Singh 1 1 National Institute of Malaria Research (ICMR), New Delhi; 2 IDVC Project Field Unit, Itki, Ranchi; 3 State Health Department, Ranchi; 4 Jharkhand Space Application Centre, Dhurwa, Ranchi; 5 School of Sciences (SoS), Indira Gandhi National Open University, New Delhi, India ABSTRACT Background & objectives: Ranchi, the capital of Jharkhand state is endemic for malaria, particularly the Bundu Primary Health Centre (PHC) is the worst affected. Therefore, a study was initiated during 2009 using remote sensing (RS) and geographical information system (GIS) to identify risk factors responsible for high endemicity in this PHC. Methods: Bundu and Angara in Ranchi district were identified as high and low malaria endemic PHCs based on epidemiological data of three years (2007–09). The habitation, streams, other water body, landform, PHC and village boundary thematic maps were prepared using IRS-P6/LISS III-IV imageries and macro level breeding sites were identified. Digital elevation model (DEM) of the PHCs was generated using Cartosat Stereo Pair images and from DEM, slope map was derived to calculate flat area. From slope, aspect map was derived to indicate direction of water flow. Length of perennial streams, area under rocky terrain and buffer zones of 250, 500 and 750 m were constructed around streams. High resolution remote sensing imageries were used to identify micro level breeding sites. Based on macro-micro breeding sites, six villages from each PHC were selected randomly having combination of different parameters representing all ecotypes. Entomological data were collected during 2010–11 in pre- and post-monsoon seasons following standard techniques and analyzed statistically. Differential analysis was attempted to comprehend socioeconomic and other determinants associated with malaria transmission. Results: The study identified eight risk factors responsible for higher malaria endemicity in Bundu in comparison to Angara PHC based on ecological, entomological, socioeconomic and other local parameters. Conclusion: Focused interventions in integrated vector management (IVM) mode are required to be carried out in the district for better management and control of disease. Key words DEM; GIS; malaria risk factors; remote sensing; slope; stone quarries
Transcript
INTRODUCTION
During last decade, a number of studies related tomapping malaria risk along with identification of risk fac-tors have been published using modern data acquisitiontools like remote sensing (RS) and global positioning sys-tem (GPS) and sophisticated analysis by means of geo-graphical information system (GIS)1–5. Assessment of riskfactors at local scale is crucial for focused and cost-effec-tive control of disease. Socioeconomic and other attributedata contribute to detailed understanding of the diseaseetiology. Identification of risk factors ensures that if alocalized spurt of the disease occurs, it can be associatedrapidly with a likely cause, a specific vector and a prob-able human source so that appropriate preventive actionscan be taken to arrest any rising trend6.
Ranchi, the capital of Jharkhand state is endemic formalaria with Plasmodium falciparum (Pf) accounting for50% of cases. Ranchi is situated between 22°52’ to 23°43’N latitude and 84°56’ to 85°54’ E longitude covering anarea of 5231 km2 under 14 PHCs. The temperature in thedistrict ranges from 5.3°C in winter to 41.2°C during sum-mer and annual rainfall is 153 cm, most of which occurduring monsoon months from June to September. Entireterrain of the district is full of high and lowlands. Thedistrict is characterized by large network of streams andother water bodies which provide innumerable breedingsites for malaria vectors throughout the year. These breed-ing sites may be diverse and species-specific as per ter-rain profile. Malaria transmission risk of a location maybe attributed to the presence of the breeding sites andappropriate vectors at that location. Anopheles culicifacies,
J Vector Borne Dis 51, December 2014, pp. 276–281
Identification of risk factors for malaria control by focused interventions inRanchi district, Jharkhand, India
1National Institute of Malaria Research (ICMR), New Delhi; 2IDVC Project Field Unit, Itki, Ranchi; 3State Health Department, Ranchi;4Jharkhand Space Application Centre, Dhurwa, Ranchi; 5School of Sciences (SoS), Indira Gandhi National Open University, New Delhi,India
ABSTRACT
Background & objectives: Ranchi, the capital of Jharkhand state is endemic for malaria, particularly the BunduPrimary Health Centre (PHC) is the worst affected. Therefore, a study was initiated during 2009 using remotesensing (RS) and geographical information system (GIS) to identify risk factors responsible for high endemicityin this PHC.
Methods: Bundu and Angara in Ranchi district were identified as high and low malaria endemic PHCs based onepidemiological data of three years (2007–09). The habitation, streams, other water body, landform, PHC andvillage boundary thematic maps were prepared using IRS-P6/LISS III-IV imageries and macro level breedingsites were identified. Digital elevation model (DEM) of the PHCs was generated using Cartosat Stereo Pairimages and from DEM, slope map was derived to calculate flat area. From slope, aspect map was derived toindicate direction of water flow. Length of perennial streams, area under rocky terrain and buffer zones of 250,500 and 750 m were constructed around streams. High resolution remote sensing imageries were used to identifymicro level breeding sites. Based on macro-micro breeding sites, six villages from each PHC were selectedrandomly having combination of different parameters representing all ecotypes. Entomological data were collectedduring 2010–11 in pre- and post-monsoon seasons following standard techniques and analyzed statistically.Differential analysis was attempted to comprehend socioeconomic and other determinants associated with malariatransmission.
Results: The study identified eight risk factors responsible for higher malaria endemicity in Bundu in comparisonto Angara PHC based on ecological, entomological, socioeconomic and other local parameters.
Conclusion: Focused interventions in integrated vector management (IVM) mode are required to be carried out inthe district for better management and control of disease.
Key words DEM; GIS; malaria risk factors; remote sensing; slope; stone quarries
277Saxena et al: Risk factors for malaria control in Ranchi district, India
An. fluviatilis and An. annularis (Diptera: Culicidae) arevectors in Ranchi district7. Anopheles culicifacies breedsmainly in pools formed in streams and riverbeds, the mostproductive breeding sites of An. fluviatilis are slow mov-ing streams located in foothills and undulating areas whileAn. annularis breeds in margins of ponds, rivers andstreams with abundant vegetation8.
This paper identifies risk factors responsible for ma-laria in a highly endemic Bundu PHC of Ranchi districtusing ecological, entomological, socioeconomic and otherlocal parameters. Identification of risk factors at PHC levelis crucial to improve planning of control strategies.
MATERIAL & METHODS
Study sitePHC-wise annual parasite incidence (API) data were
collected from 2007–09 from the State Health Depart-ment of Ranchi district. These data were processed andclassified. Average API indicated Bundu as highly ma-laria endemic PHC while Angara was found to be lowendemic. Bundu is situated about 70 km south and Angarais about 21 km north of Ranchi City. Bundu covers anarea of 264 km2 consisting of 0.062 million populationand Angara covers an area of 445 km2 with populationbeing 0.11 million9.
The habitation, streams and other water body, landform, PHC and village boundary thematic maps were pre-pared for Bundu and Angara PHCs using IRS-P6/LISSIII imageries of 2009 (23.5 m spatial resolution), surveyof India topo sheets and cadastral map in collaborationwith Jharkhand Space Application Centre (JSAC), Ranchi.These maps were further updated by JSAC using IRS-P6/LISS IV (5.0 m spatial resolution) imageries of 2009.All the thematic layers were geo-referenced in GIS envi-ronment in the Universal Transverse Mercator (WGS-84)projection.
Digital elevation model (DEM) was generated usingCartosat Stereo Pair images of the study area by JSAC.From DEM, slope map was generated following standardGIS routines and it was divided into six categories as perstandard classification-gentle (flat area), moderate, mod-erate high, high, steep and very high. Slope measures therate of change of elevation at surface location. Area wascalculated for different classified categories of slope.Aspect map was derived from slope which indicated di-rection of water flow. Habitation map was overlaid onslope map and number of hamlets in flat areas was iden-tified.
Habitation map of the study area indicated sporadic
pattern of population settlement and tendency to settle inhamlets consisting of about 10–25 houses. Each hamletwas identified as a polygon for analysis purpose. Lengthof the perennial streams in both the PHCs was calculatedusing GIS analysis. From landform map, rocky terrainlandform was extracted. Rocky terrain is an eroded landstructure which leads to formation of seasonal pools ofwater. Area under rocky terrain in both the PHCs wascalculated. Buffer zones of 250, 500 and 750 m were con-structed around streams in both the PHCs and habitationmap was overlaid. Number of hamlets settled within eachbuffer zone was calculated using GIS analysis.
Thematic layers related to streams and other waterbodies, rocky terrain and village map were overlaid inArcGIS 9.3 software and macro level breeding sites wereidentified. Selected PHCs were also screened throughhigh resolution remote sensing imageries of 2008–09(<1 m spatial resolution) and micro level breeding siteswere identified. For rural areas, suitable high resolutionsatellite imageries are generally not available for the pe-riod of field sampling of breeding sites. However, usingsatellite imageries taken at different times than the larvalsamplings helps address the general utility of satelliteimages for identifying larval habitats across different sea-sons and years10.
Based on identified macro-micro breeding sites, sixvillages from each PHC were selected randomly havingcombination of different parameters representing allecotypes. From Bundu PHC—Humta, Taimara, Jareya,Reladih, Gutuhatu and Baruhatu villages were included.From Angara PHC—Rupru, Kuchu, Pirtaul, Getalsud,Ambajhariya and Sataki villages were included.
Two surveys were undertaken in both the PHCs dur-ing April–May 2010 (pre-monsoon) and October 2011(post-monsoon). Anopheline larvae and adults were col-lected following standard techniques. The identified macroand micro breeding sites in the selected villages werematched in the field using Garmin handheld Montana 650GPS during field data collection.
Total catch was performed to identify mosquito spe-cies resting inside the houses and cattlesheds. All the ex-its were covered, a white cotton sheet was placed on thefloor and a pyrethrum-based insecticide was sprayed. Fif-teen minutes following the spraying, the mosquitoes werecollected and identified simultaneously and species-wiserecording was done. Four houses and two coveredcattlesheds from each selected village were covered un-der total catch. Differences in collected vectors in boththe PHCs during pre- and post-monsoon seasons weretested by using Student’s t-test. Per room vector density
J Vector Borne Dis 51, December 2014278
The parameters investigated were education level, occu-pation, monthly income, type of houses, sleeping habits,etc. Other attribute data collected through survey was—local/migratory labour settlement around brick kilns andstone quarries, knowledge about malaria and its breedingsites, use of repellents/traditional methods to protect frommosquito bites and use of insecticide treated nets (ITNs)by the population. Ethical clearance was not required forthis data collection. Differential analysis was attemptedto comprehend socioeconomic and other determinants as-sociated with malaria transmission.
RESULTS
Overlaying of habitation map over aspect map indi-cated 37% of the hamlets affected due to water loggingduring rains in Bundu PHC and 32% hamlets in Angara.Flat area (gentle slope) with respect to total area, calcu-lated from slope map was found to be 71% in Bundu PHCand 56% in Angara. Total length of perennial streams ascalculated using GIS routines was 0.95 km/km2 area inBundu PHC and 0.80 km/km2 area in Angara. In BunduPHC, the area under rocky terrain landform was 24.68km2 while in Angara, it was 20.86 km2.
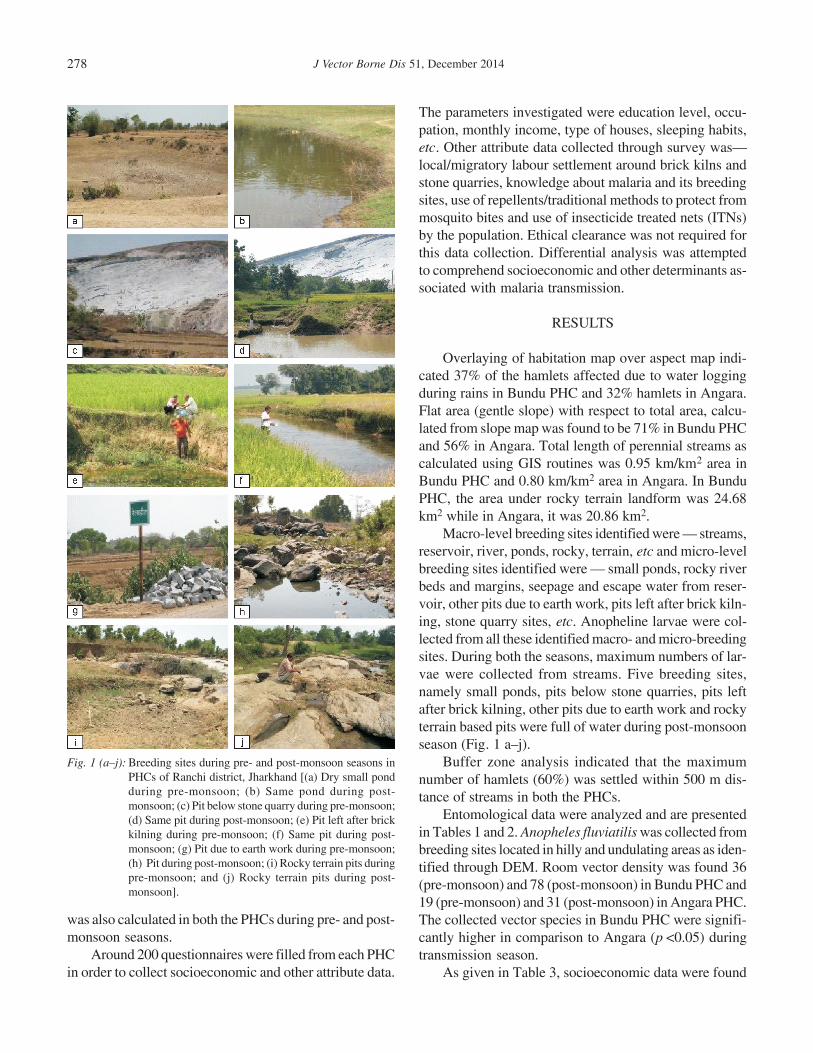
Macro-level breeding sites identified were — streams,reservoir, river, ponds, rocky, terrain, etc and micro-levelbreeding sites identified were — small ponds, rocky riverbeds and margins, seepage and escape water from reser-voir, other pits due to earth work, pits left after brick kiln-ing, stone quarry sites, etc. Anopheline larvae were col-lected from all these identified macro- and micro-breedingsites. During both the seasons, maximum numbers of lar-vae were collected from streams. Five breeding sites,namely small ponds, pits below stone quarries, pits leftafter brick kilning, other pits due to earth work and rockyterrain based pits were full of water during post-monsoonseason (Fig. 1 a–j).
Buffer zone analysis indicated that the maximumnumber of hamlets (60%) was settled within 500 m dis-tance of streams in both the PHCs.
Entomological data were analyzed and are presentedin Tables 1 and 2. Anopheles fluviatilis was collected frombreeding sites located in hilly and undulating areas as iden-tified through DEM. Room vector density was found 36(pre-monsoon) and 78 (post-monsoon) in Bundu PHC and19 (pre-monsoon) and 31 (post-monsoon) in Angara PHC.The collected vector species in Bundu PHC were signifi-cantly higher in comparison to Angara (p <0.05) duringtransmission season.
As given in Table 3, socioeconomic data were found
Fig. 1 (a–j): Breeding sites during pre- and post-monsoon seasons inPHCs of Ranchi district, Jharkhand [(a) Dry small pondduring pre-monsoon; (b) Same pond during post-monsoon; (c) Pit below stone quarry during pre-monsoon;(d) Same pit during post-monsoon; (e) Pit left after brickkilning during pre-monsoon; (f) Same pit during post-monsoon; (g) Pit due to earth work during pre-monsoon;(h) Pit during post-monsoon; (i) Rocky terrain pits duringpre-monsoon; and (j) Rocky terrain pits during post-monsoon].
was also calculated in both the PHCs during pre- and post-monsoon seasons.
Around 200 questionnaires were filled from each PHCin order to collect socioeconomic and other attribute data.
279Saxena et al: Risk factors for malaria control in Ranchi district, India
Table 1. Total catch from houses and cattlesheds in Angara PHC
S.No. Village An. An. An. Totalannularis culicifacies fluviatilis
Room vector density: Pre-monsoon–36; and Post-monsoon–78.
pellents/traditional methods to protect from mosquito biteswas found negligible in both the PHCs as per conductedsurvey. This may be due to low education level recordedfrom both the PHCs. In Bundu, 48% and in Angara 53%of the respondents ascerted the use of insecticide treatedbed nets (ITNs).
Eight risk factors were found to be responsible forhigher malaria endemicity in Bundu in comparison to
more or less same in both the PHCs. Poorly constructed-mud and thatched roof houses were recorded 80% inBundu and 50% in Angara PHC. Brick kilns and stonequarries (earth work) engaging local labours were the fea-tures in Angara PHC while in Bundu, stone quarries fromhills were observed and migratory population from nearbyendemic areas were found settled around them. Knowl-edge about malaria and its breeding sites and use of re-
Table 3. Socioeconomic and other attribute data collected from Angara and Bundu PHCs
S.No. Features Angara Bundu
1. Total population* 0.11 million 0.062 million2. Population density* 253 2333. Education level (illiterate population) >50% >50%4. Occupation Labour and farmer (90%) Labour and farmer (90%)5. Monthly income ` 2000–3000 (80%) ` 2000–3000 (80%)6. Type of houses Poorly constructed (Mud and Poorly constructed (Mud and
thatched roof) – 50% thatched roof) – 80%7. Sleeping habits Indoor (98%) Indoor (97%)8. Brick kilns Many Few9. Stone quarries (earth work) Many Few10. Stone quarries (hills) – Many11. Labour engaged in brick kilns, stone Local villagers Migratory population
quarries (earth work and hills)12. Knowledge about malaria and its breeding Unaware (100%) Unaware (100%)
sites as per conducted interviews13. Use of repellents/traditional methods to protect from None (100%) None (100%)
mosquito bites as per conducted interviews14. Use of insecticide-treated bednets (ITNs) as 53% 48%
per conducted interviews
*Census 2011.
J Vector Borne Dis 51, December 2014280
Angara PHC : (i) More number of hamlets affecteddue to water logging in low lying area and availability ofmore flat area capable of forming stagnant waterpools during rains; (ii) Higher length of perennialstreams; (iii) More area under rocky terrain leading toformation of water pools during rains; (iv) Abundance ofpoorly constructed houses; (v) Higher room vector den-sity; (vi) Significant higher collection of vector speciesduring transmission season; (vii) Migratory populationsettlement from endemic areas around stone quarries;and (viii) Less ITN coverage in comparison to AngaraPHC.
DISCUSSION
Remote sensing technology is well established foridentification, characterization, monitoring and surveil-lance of malaria vector breeding habitats11. Low and highresolution satellite data were used for identification ofmacro- and micro-level breeding sites in this study. Withimprovement in resolution and cut-down in data cost, infuture more useful applications of this technology areenvisaged. However, there is problem in getting latest highresolution imageries of rural areas as only scenes for lim-ited time period are available. As development is low inrural areas, using archived data is considered a good op-tion for detailed screening of the study area.
This study clearly identified role of ecological, ento-mological, socioeconomic and other local parameters inpropagating malaria in Bundu PHC. Some of the risk fac-tors identified were similar as found in other studies car-ried out in other parts of the world12–17.
In a study done in western Kenya highlands, topo-graphic wetness index (TWI) was derived from DEM usingGIS for predicting areas of high malaria risk18. In the presentstudy, DEM helped derive slope and aspect maps indi-cated availability of more flat area capable of formingstagnant water pools and identification of number of ham-lets affected due to water logging in low lying areas.
As per NVBDCP guidelines, every year two roundsof indoor space spraying (IRS) using insecticides are donefollowing blanket coverage. From 2008, World Bank as-sisted malaria control project became operational inRanchi district and stratified approach of IRS has beenrecommended19. Therefore, covering households within500 m of streams will lead to cost-effective control. An-other low cost measure suggested is the use of water man-agement for control of vector breeding20.
The population in the PHCs was not found using ei-ther repellants or personal protection methods to protectfrom mosquito bites. The reason may be low literacy rate
and complete unawareness regarding malaria caused bymosquito bites. This is in contrast to the study carried outin Sri Lanka where people living close to the streams usedmore preventive measures especially traditional fumi-gants12. The requirement to conduct intensive informa-tion, education and communication (IEC) activities amongpeople of PHC comes from the fact that none of the 400people interviewed knew about malaria and its breedingsites.
The study identified limited use of ITNs in BunduPHC which were distributed as per the existing practicesin vector control. During indepth review carried out byNational Vector Borne Disease Control Programme(NVBDCP) during 2006, the use of ITNs was observedto be inadequate due to multiple factors, such as social,cultural and operational problems to re-impregnate thenets. In World Bank assisted malaria control project,emphasis is on the introduction of long-lasting insecti-cidal nets (LLINs). Since, 60% of the population wasfound settled within 500 m buffer of streams, covering ofthis population by LLINs on priority basis will yield use-ful results.
Meteorological data could not be incorporated in thisstudy as the data were not available at PHC level. How-ever, in future with the help of HOBO temperature-rela-tive humidity data loggers and rain gauge, this datacan be generated and analyzed to identify more riskfactors21–22.
CONCLUSION
This is the first study of its kind carried out in Ranchidistrict using GIS and RS to identify risk factors for highmalaria endemicity. Focused interventions in integratedvector management (IVM) mode are required to be car-ried out in the district for better management and controlof disease.
ACKNOWLEDGEMENTS
Authors are thankful to the Indian Council of Medi-cal Research, New Delhi for providing funds for this study.Mr Jitendra Kumar, SRF and other field staffs are ac-knowledged for help regarding processing of spatial dataand field data collections. Institutional publication com-mittee is acknowledged for giving consent for publica-tion of the manuscript.
Conflicts of interestThe authors declare that they don’t have any conflict
of interest.
281Saxena et al: Risk factors for malaria control in Ranchi district, India
REFERENCES
1. Srivastava A, Nagpal BN, Saxena R, Wadhwa TC, Mohan S, PalG, et al. Malaria epidemicity of Mewat region, District Gurgaon,Haryana, India: A GIS-based study. Curr Sci 2004; 86(9): 1297–1303.
2. Rejmankova E, Roberts DR, Pawley A, Manguin S, Polanco J.Predictions of adult Anopheles albimanus densities in villagesbased on distances to remotely sensed larval habitats. Am J TropMed Hyg 1995; 53: 482–8.
3. Briet OJT, Galappaththy GNL, Konradsen F, Amerasinghe PH,Amerasinghe FP. Maps of the Sri Lanka malaria situation pre-ceding the tsunami and key aspects to be considered in the emer-gency phase and beyond. Malar J 2005; 4(8): 1–11.
4. Zhou G, Sirichaisinthop J, Sattabongkot J, Jones J, BjørnstadON, Yan G, et al. Spatio-temporal distribution of Plasmodiumfalciparum and P. vivax malaria in Thailand. Am J Trop MedHyg 2005; 72(3): 256–62.
5. Srivastava A, Nagpal BN, Saxena R, Sharma VP. Geographicinformation system as a tool to study malaria receptivity in NadiadTaluka, Kheda district, Gujarat, India. Southeast Asian J TropMed Public Health 1999; 30(4): 650–6.
6. Srivastava A, Nagpal BN, Saxena R, Eapen A, Ravindran KJ,Subbarao SK, et al. GIS based malaria information managementsystem for urban malaria scheme in India. Comput Methods Pro-grams Biomed 2003; 71(1): 63–75.
7. Saxena R, Nagpal BN, Das MK, Srivastava A, Gupta SK, KumarA, et al. A spatial statistical approach to analyze malaria situa-tion at micro level for priority control in Ranchi district,Jharkhand. Indian J Med Res, 2012; 136(5): 776–82.
8. Nagpal BN, Sharma VP. Indian Anophelines. New Delhi: Ox-ford & IBH Publishing Co. Pvt. Ltd. 1995; p. 416.
9. Block PHC wise population details, Ranchi district, Jharkhand.Available from: http://ranchi nic.in/block.htm (Accessed on Janu-ary 8, 2014).
10. Mushinzimana E, Munga S, Minakawa N, Li L, Feng C, Bian L,et al. Landscape determinants and remote sensing of anophelinemosquito larval habitats in the western Kenya highlands. MalarJ 2006; 5: 13.
plication of spatial technology in malaria research and control:Some new insights. Indian J Med Res 2009; 130: 125–31.
12. Hoek WV, Konradsen P, Amerasinghe PH, Perera D, PiyaratneMK, Amerasinghe FP. Towards a risk map of malaria in SriLanka: The importance of house location relative to vector breed-ing sites. Int J Epidemiol 2003; 32(2): 280–5.
13. Rejmankova E, Roberts DR, Pawley A, Manguin S, Polanco J.Predictions of adult Anopheles albimanus densities in villagesbased on distances to remotely sensed larval habitats. Am J TropMed Hyg 1995; 53(5): 482–8.
14. Guthmann JP, Hall AJ, Jaffar S, Palacios A, Lines J, Llanos-Cuentas A, et al. Environmental risk factors for clinical malaria:A case-control study in the Grau region of Peru. Trans R SocTrop Med Hyg 2001; 95(6): 577–83.
15. Gunawardena DM, Wickremasinghe AR, Muthuwatta L,Weerasingha S, Rajakaruna J, Senanayaka T, et al. Malaria riskfactors in an endemic region of Sri Lanka, and the impact andcost implications of risk factor-based interventions. Am J TropMed Hyg 1998; 58(5): 533–42.
16. Gamage Mendis AC, Carter R, Mendis C, Dezoysa AP, HerathPR, Mendis KN. Clustering of malaria infections within an en-demic population — Risk of malaria associated with the type ofhousing construction. Am J Trop Med Hyg 1991; 45(1): 77–85.
17. Konradsen F, Amerasinghe P, Hoek WV, Amerasinghe F, PereraD, Piyaratne M. Strong association between house characteris-tics and malaria vectors in Sri Lanka. Am J Trop Med Hyg 2003;68(2): 177–81.
18. Cohen JM, Ernst KC, Lindblade KA, Vulule JM, John CC, Wil-son ML. Topography-derived wetness indices are associated withhousehold-level malaria risk in two communities in the westernKenyan highlands. Malar J 2008; 7(40): 1–12.
19. National Vector Borne Disease Control Programme (NVBDCP)-World Bank Project. Available from: http://nvbdcp.gov.in/Doc/PIP.pdf (Accessed on January 8, 2014).
20. Konradsen F, Steele P, Perera D, Hoek WVD, Amerasinghe PH,Amerasinghe FP. Cost of malaria control in Sri Lanka. Bull WorldHealth Organ 1999; 77(4): 301–9.
21. Hobo data loggers. Available from: http://www.onsetcomp.com/products/hobo-data-loggers (Accessed on January 8, 2014).
22. Hobo rain gauge. Available from: http://www.onsetcomp.com/products/data-loggers/rg3 (Accessed on January 8, 2014).
Correspondence to: Dr B.N. Nagpal, Scientist ‘F’, National Institute of Malaria Research, Sector 8, Dwarka, New Delhi–110 077, India.E-mail: [email protected]
Received: 28 February 2014 Accepted in revised form: 6 August 2014


![MALARIA [Descriptive Epidemiology of Malaria] Dr …wp.cune.org/.../11/MALARIA-descriptive-epidemiology-of-malaria.pdfMALARIA [Descriptive Epidemiology of Malaria] Dr Adeniyi Mofoluwake](https://static.documents.pub/doc/80x56/5ac17de07f8b9ad73f8cf6b2/malaria-descriptive-epidemiology-of-malaria-dr-wpcuneorg11malaria-descriptive-epidemiology-of-.jpg)


