168


IDENTIFICATION OF SENSITIVE
AREAS AND VULNERABLE ZONES
IN TRANSITIONAL AND COASTAL
PORTUGUESE SYSTEMS
J. G. Ferreira T. Simas A. Nobre M. C. Silva K. Shifferegger J. Lencart-Silva
Application of the United States National Estuarine Eutrophication Assessment to the Minho, Lima,
Douro, Ria de Aveiro, Mondego, Tagus, Sado, Mira, Ria Formosa and Guadiana systems

ACKNOWLEDGEMENTS
Ac
kn
ow
led
ge
me
nt
s
v
The data required for this study exist for many Portuguese estuaries and coastal lagoons. However, data
producers often do not make this information widely available; as a result, very limited datasets are
sometimes extrapolated to describe the pressures and state of a particular system.
INAG, the Portuguese Water Institute, has strongly endorsed open standards in access to water quality
data, and has promoted many initiatives which help Portugal have a modern outlook on the relevance of
public data dissemination. We thank INAG for the opportunity which this work has given us to play a part
in information sharing in estuarine research.
Our sincere thanks go to all the scientific community, which contributed data and information for this study.
In particular, we must mention those who greatly improved the substance of this work, providing advice,
suggesting interpretations, and critically reviewing the text: they played a key consultancy role in the
development of the NEEA approach to Portuguese estuaries.
Suzanne Bricker, from the Special Projects Office, National Ocean Service, National Oceanic and
Atmospheric Administration, coordinator of the NEEA study carried out for 138 estuaries in the United
States. Suzanne was an enthusiastic supporter throughout, and supplied us with much good advice on
methodological issues. She worked with us both in Portugal and in the U.S. to solve problems as they
arose, and most of all, she believed in us right from the outset.
João Carlos Marques, IMAR – Coimbra University, who unconditionally supported the role of IMAR in this
study, and substantially improved the chapter on the Mondego estuary.
Graça Cabeçadas, from IPIMAR, who put her experience of many years in the Sado estuary to work in
helping us, improve the interpretation of NEEA for that system.
Alexandre Bettencourt, IMAR – Évora University, who reviewed the chapter on the Mira.
Alice Newton, IMAR – Algarve University, who reviewed the chapter on Ria Formosa.
Manuel Lacerda, Vitória Mira da Silva and Laudemira Ramos, from INAG, for helpful comments and
support throughout the work.

TABLE OF CONTENTS
Ta
ble
of
Co
nt
en
ts
v i i
EXECUTIVE SUMMARY
INTRODUCTION
METHODOLOGY
Data assimilation - water quality databases
NOAA’s National Estuarine Eutrophication Assessment
NEEA methodology
Overall Eutrophic Condition
Overall Human Influence
Determination of Future Outlook
Key references
RESULTS
1
9
11
11
12
13
14
18
18
19

Ta
ble
of
Co
nt
en
ts
v i i i
MINHO ESTUARY
General characteristics
Homogeneous areas
Data Completeness and Reliability
Overall Eutrophic Condition
Primary symptoms method
Secondary symptoms method
Overall Human Influence
Susceptibility
Nutrient inputs
Determination of Future Outlook
Summary of the NEEA index application
Conclusions
Key references
LIMA ESTUARY
General characteristics
Homogeneous areas
Data Completeness and Reliability
Overall Eutrophic Condition
Primary symptoms method
Secondary symptoms method
Overall Human Influence
Susceptibility
Nutrient inputs
Determination of Future Outlook
Summary of the NEEA index application
Conclusions
Key references
21
21
22
22
22
25
28
28
29
30
31
31
32
32
33
35
36
37
39
39
Ta
ble
of
Co
nt
en
ts
i x
DOURO ESTUARY
General characteristics
Homogeneous areas
Data Completeness and Reliability
Overall Eutrophic Condition
Primary symptoms method
Secondary symptoms method
Overall Human Influence
Susceptibility
Nutrient inputs
Determination of Future Outlook
Summary of the NEEA index application
Conclusions
Key references
RIA DE AVEIRO
General characteristics
Homogeneous areas
Data Completeness and Reliability
Overall Eutrophic Condition
Primary symptoms method
Secondary symptoms method
Overall Human Influence
Susceptibility
Nutrient inputs
Determination of Future Outlook
Summary of the NEEA index application
Conclusions
Key references
41
41
42
43
44
46
50
50
51
51
53
53
54
54
56
62
62
63
63
65

Ta
ble
of
Co
nt
en
ts
x
MONDEGO ESTUARY
General characteristics
Homogeneous areas
Overall Eutrophic Condition
Primary symptoms method
Secondary symptoms method
Overall Human Influence
Susceptibility
Nutrient inputs
Conclusions
Key references
TAGUS ESTUARY
General characteristics
Homogeneous areas
Data Completeness and Reliability
Overall Eutrophic Condition
Primary symptoms method
Secondary symptoms method
Overall Human Influence
Susceptibility
Nutrient inputs
Determination of Future Outlook
Summary of the NEEA index application
Conclusions
Key references
67
67
68
68
73
76
77
79
79
80
81
82
89
93
93
93
94
SADO ESTUARY
General characteristics
Homogeneous areas
Data Completeness and Reliability
Overall Eutrophic Condition
Primary symptoms method
Secondary symptoms method
Overall Human Influence
Susceptibility
Nutrient inputs
Determination of Future Outlook
Summary of the NEEA index application
Conclusions
Key references
MIRA ESTUARY
General characteristics
Homogeneous areas
Data Completeness and Reliability
Overall Eutrophic Condition
Primary symptoms method
Secondary symptoms method
Overall Human Influence
Susceptibility
Nutrient inputs
Determination of Future Outlook
Summary of the NEEA index application
Conclusions
Key references
Ta
ble
of
Co
nt
en
ts
x i
95
95
96
96
98
103
106
107
107
107
109
109
110
111
112
115
117
117
118
118

Ta
ble
of
Co
nt
en
ts
x i i
RIA FORMOSA
General characteristics
Homogeneous areas
Data Completeness and Reliability
Overall Eutrophic Condition
Primary symptoms method
Secondary symptoms method
Overall Human Influence
Susceptibility
Nutrient inputs
Determination of Future Outlook
Summary of the NEEA index application
Conclusions
Key references
GUADIANA ESTUARY
General characteristics
Homogeneous areas
Data Completeness and Reliability
Overall Eutrophic Condition
Primary symptoms method
Secondary symptoms method
Overall Human Influence
Susceptibility
Nutrient inputs
Determination of Future Outlook
Summary of the NEEA index application
Conclusions
Key references
GENERAL CONCLUSIONS
119
119
120
120
122
127
129
130
130
131
133
133
134
135
136
140
143
143
143
144


EXECUTIVE SUMMARY
Ex
ec
ut
ive
Su
mm
ar
y
1
This study was carried out to address the
potential classification of sensitive areas and/or
vulnerable zones in ten Portuguese systems, the
Minho, Lima, Douro, Ria de Aveiro, Mondego,
Tagus and Sado, Mira and Guadiana estuaries,
and the Ria Formosa coastal lagoon. The
evaluation presented in this document applies
the U.S. National Estuarine Eutrophication
Assessment, developed by the National Oceanic
and Atmospheric Administration of the United
States.
This work examines the ecological quality of
the ten systems, and asks six fundamental
questions:
• Sensitive areasDirective on urban wastewater treatment UWWTD (91/271/EEC)
• Vulnerable zonesNitrates directive ND (91/676/EEC)
SIX KEY QUESTIONS
1. What is the eutrophication status of each of
the ten systems, as a whole and in sections;
how does it compare with other estuaries and
coastal waters in Portugal and elsewhere?
2. Which systems or parts of systems should
be classified as sensitive areas and/or
vulnerable zones?
3. What are the potential management solutions,
for example through effluent treatment or
improvement of agricultural practices?
4. What will be the trends in nutrient loading to
these systems, from urban and agricultural
sources, over the next few decades?
5. Where are the main data gaps, and what are
the recommendations for monitoring and
research for the ten systems studied?
Ex
ec
ut
ive
Su
mm
ar
y
2
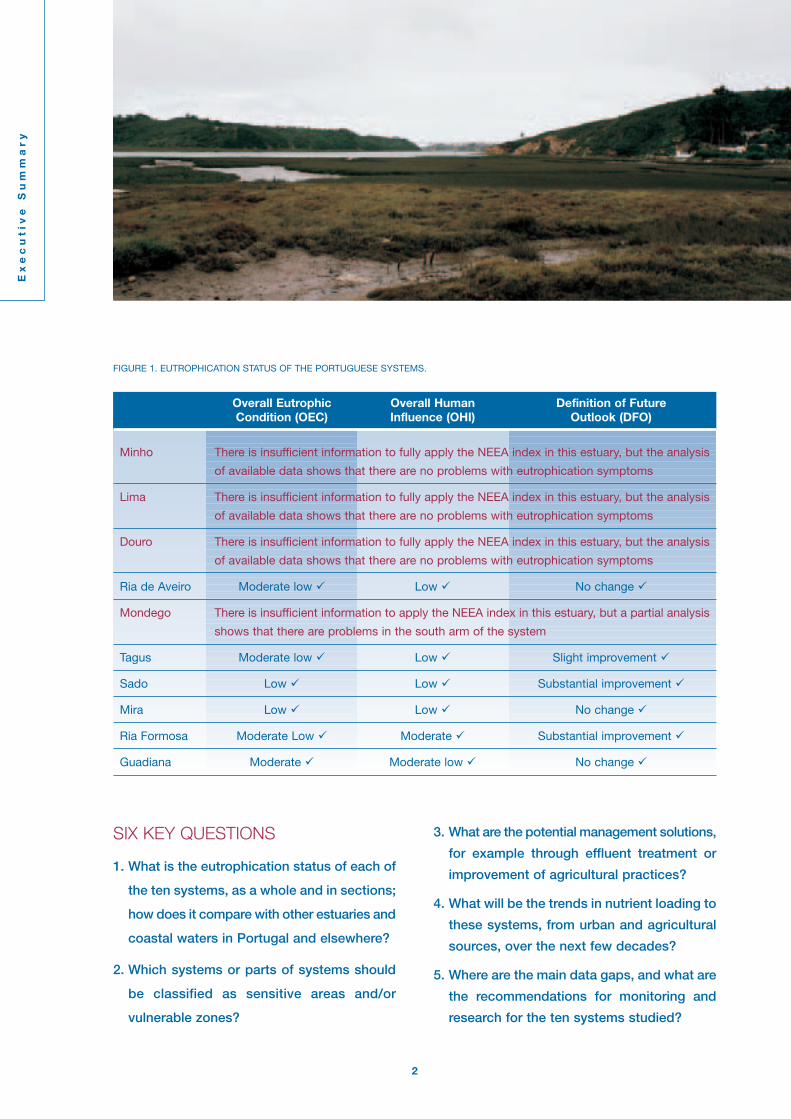
FIGURE 1. EUTROPHICATION STATUS OF THE PORTUGUESE SYSTEMS.
Overall Eutrophic Overall Human Definition of Future Condition (OEC) Influence (OHI) Outlook (DFO)
Minho There is insufficient information to fully apply the NEEA index in this estuary, but the analysis
of available data shows that there are no problems with eutrophication symptoms
Lima There is insufficient information to fully apply the NEEA index in this estuary, but the analysis
of available data shows that there are no problems with eutrophication symptoms
Douro There is insufficient information to fully apply the NEEA index in this estuary, but the analysis
of available data shows that there are no problems with eutrophication symptoms
Ria de Aveiro Moderate low � Low � No change �
Mondego There is insufficient information to apply the NEEA index in this estuary, but a partial analysis
shows that there are problems in the south arm of the system
Tagus Moderate low � Low � Slight improvement �
Sado Low � Low � Substantial improvement �
Mira Low � Low � No change �
Ria Formosa Moderate Low � Moderate � Substantial improvement �
Guadiana Moderate � Moderate low � No change �

IDENTIFICATION OF SENSITIVE AREAS AND VULNERABLE ZONES IN TRANSITIONAL AND COASTAL PORTUGUESE SYSTEMS
Ex
ec
ut
ive
Su
mm
ar
y
3
6. How can this assessment be used as the
basis for a national strategy?
The results obtained for the ten systems are
presented below.
EUTROPHICATION STATUS
Figure 1 shows the results of the NEEA assessment
of the ten systems. No eutrophication problems
are identified in the Minho, Lima, Douro, Ria de
Aveiro, Tagus, Sado and Mira estuaries. In the
Mondego, existing data for the South channel
suggest the occurrence of eutrophication
symptoms associated with macroalgal (seaweed)
growth. In the Ria Formosa, periodic blooms of
macroalgae have been detected in the Faro-
Olhão channels. In the tidal freshwater and mixing
zones of the Guadiana estuary, the eutrophic
symptoms are associated with medium to high
chlorophyll a values.
The study carried out by NOAA on 138 estuaries
in the United States, identified 34% with high
expression of eutrophication conditions, 37%
with moderate conditions and 29% with low
conditions – 17 of the 138 estuaries did not have
enough information available to apply the NEEA
methodology. Given the level of development of
the European Union, we would expect the
application of NEEA to European estuaries
to give similar results or perhaps even to identify
a greater proportion of systems with high
eutrophication conditions. Comparatively, the
Portuguese systems for which adequate data
exist have low eutrophic conditions when
considered on an EU-wide scale.
CLASSIFICATION OF VULNERABLEZONES AND/OR SENSITIVE AREAS
Designation of vulnerable zones
On the basis of the application of the NEEA
index to the ten systems, there is no justification
for designating vulnerable zones in the Minho,
Lima, Douro, Ria de Aveiro, Tagus, Sado, Mira

Ex
ec
ut
ive
Su
mm
ar
y
4
and Ria Formosa. In the Mondego estuary,
available data suggest that the South channel
is a problem area, and the measures required to
reduce macroalgal blooms and restore the
ecosystem balance should be urgently examined.
The designation of vulnerable zones in the
Guadiana estuary is dependent on the changes
in agricultural practices promoted by the future
availability of water for irrigation from the Alqueva
reservoir.
Designation of sensitive areas
On the basis of the application of the NEEA
index to the ten systems, there is no justification
for designating sensitive areas in any of them,
under the terms of the UWWTD Directive
(91/271/EEC), as regards eutrophication.
MANAGEMENTRECOMMENDATIONS
Minho, Lima and Douro estuaries
Due to the lack of information for these estuaries
no conclusions could be drawn on management
recommendations.
Mondego estuary
Improve the agricultural practices in the Pranto
river basin, and propose the application of
ecotechnology solutions. A comprehensive list
would include:
(i) Optimisation of the management of the
Pranto discharge;
(ii) Construction of artificial wetlands between
the upstream farmland and the Pranto sluice
connection to the Mondego Southern channel.
Guadiana estuary
The effective implementation of good agricultural
practices according to the EU agro-environmental
rules is essential to prevent environmental
quality degradation as regards eutrophication.
Other estuaries
The management measures currently being
applied in the estuaries of the Ria de Aveiro,
Tagus, Sado, Mira and Ria Formosa, with
respect to effluent treatment and discharge to
the receiving body, agricultural practices and
soil protection, appear to be adequate for
preserving and improving environmental quality
as regards eutrophication.
FUTURE OUTLOOK
The future trends are positive in the case of the
Douro, Tagus, Sado and Ria Formosa and
neutral in the case of the Lima, Ria de Aveiro
and Mira. No conclusions were drawn on
possible trends for the Mondego and Minho due
to lack of information. Negative future trends
should be considered in the case of the

IDENTIFICATION OF SENSITIVE AREAS AND VULNERABLE ZONES IN TRANSITIONAL AND COASTAL PORTUGUESE SYSTEMS
Ex
ec
ut
ive
Su
mm
ar
y
5
Guadiana estuary if appropriate management
recommendations are not implemented.
DATA GAPS ANDRECOMMENDATIONS
All the systems except the Tagus exhibit data
gaps, which should be filled by means of
an adequate monitoring programme. These
programmes should be implemented following
the recommendations of the Water Framework
Directive (WFD, Directive 2000/60/CE).
Minho estuary
The information on water quality parameters for
the Minho estuary is very limited. Some of the
parameters are only available as metadata and
the spatial and temporal coverage is not
sufficient to carry out an analysis of the system
as a whole. A Surveillance Monitoring programme
is recommended, following the definition set out
in the Water Framework Directive.
Lima estuary
The areas near the banks of the Lima estuary,
particularly the saltmarshes and saltpans, have
been studied, but there is a requirement for an
integrated approach to the whole system from
the head of the estuary to the mouth. Due to the
lack of information for this estuary, particularly
in what concerns hydrology, macroalgae,
epiphytes and submerged aquatic vegetation
dynamics, a Surveillance Monitoring programme
should be developed.
Douro estuary
The information for the Douro estuary is also
scarce concerning water quality, macrophytes
and nuisance and toxic blooms. For this estuary
a Surveillance Monitoring programme is necessary.
Ria de Aveiro
Some data gaps were detected for Ria de Aveiro
concerning spatial coverage for chlorophyll a,
Ex
ec
ut
ive
Su
mm
ar
y
6
macrophyte dynamics and nuisance and toxic
blooms. An adequate Surveillance Monitoring
programme should be developed to rectify
these gaps. Aditionally two investigative
monitoring programs should be carried out to
determine the reasons for general SAV loss and
high chlorophyll concentrations in the extreme
of Mira channel.
Mondego estuary
The South channel of the Mondego estuary is
well studied, but there is a requirement for an
integrated approach to the whole system, from the
head of the estuary to the mouth, considering
both the North and South channels. For this
estuary, apart from the Surveillance Monitoring
indicated in the WFD, an Investigative Monitoring
programme has now been implemented, in order
to respond to the outstanding issues.
Tagus estuary
The Tagus estuary is well characterized, and the
fulfilment of national obligations with regard to
WFD Surveillance Monitoring is sufficient.
Sado estuary
Some areas of the Sado estuary are not very
well known, particularly the upper part. These
knowledge gaps may be filled by an adequately
designed Surveillance Monitoring programme.
Elevated chlorophyll a peaks were identified on
one sampling date in February 2000, which are
clearly inconsistent with the overall dataset. As
a precaution, Investigative Monitoring is suggested
for the area in question.
Mira estuary
Sections of the Mira are poorly known,
particularly the upstream part. There is also a
need to improve the description of temporal
and spatial variation of chlorophyll a. The
monitoring programme falls clearly into the
Surveillance Monitoring area of the WFD.
Ria Formosa
The data gaps detected for the Ria Formosa
concern macrophyte dynamics, particularly
seaweeds and seagrasses. Efforts should be
made to obtain the necessary information by
means of an Investigative Monitoring programme.
Guadiana estuary
Although an extensive database for salinity and
dissolved oxygen is available for the Guadiana
estuary, the information on other biogeochemical
parameters is much more limited. The analysis
for chlorophyll a is the most obvious case, where
an uneven distribution of observations in space
and time may bias the data. A comprehensive
and carefully designed Surveillance Monitoring
programme (sensu WFD) is recommended, to
help to fill the gaps in the database.

IDENTIFICATION OF SENSITIVE AREAS AND VULNERABLE ZONES IN TRANSITIONAL AND COASTAL PORTUGUESE SYSTEMS
Ex
ec
ut
ive
Su
mm
ar
y
7
DEFINITION OF A NATIONALSTRATEGY
This study brings together valuable information
on the state of eutrophication of nine estuarine
systems and one coastal lagoon in Portugal,
and is a useful support for decision-making and
management of these systems. The existence
of a comparative methodology and results at an
international level reinforces the utility of this
approach. The general application of the NEEA
index to a large number of Portuguese estuaries
and coastal lagoons was shown to have the
following advantages:
• Contribution to the definition of priorities and decision-support at a national level
• In estuaries with serious problems, application of management measures. In systems
considered to be at risk, promotion of monitoring and preventive measures
• In estuaries where serious knowledge gaps exist, identification of the monitoring requirements
for quality assessment

INTRODUCTION
Int
ro
du
ct
ion
9
The objective of this document is to outline
the key methodological aspects and results
for the implementation of the Urban Waste
Water Treatment Directive - UWWTD (91/271/
EEC) and the Nitrate Directive - ND (91/676/
EEC) in transitional and coastal waters in
Portugal. It specifically excludes freshwater and
groundwater.
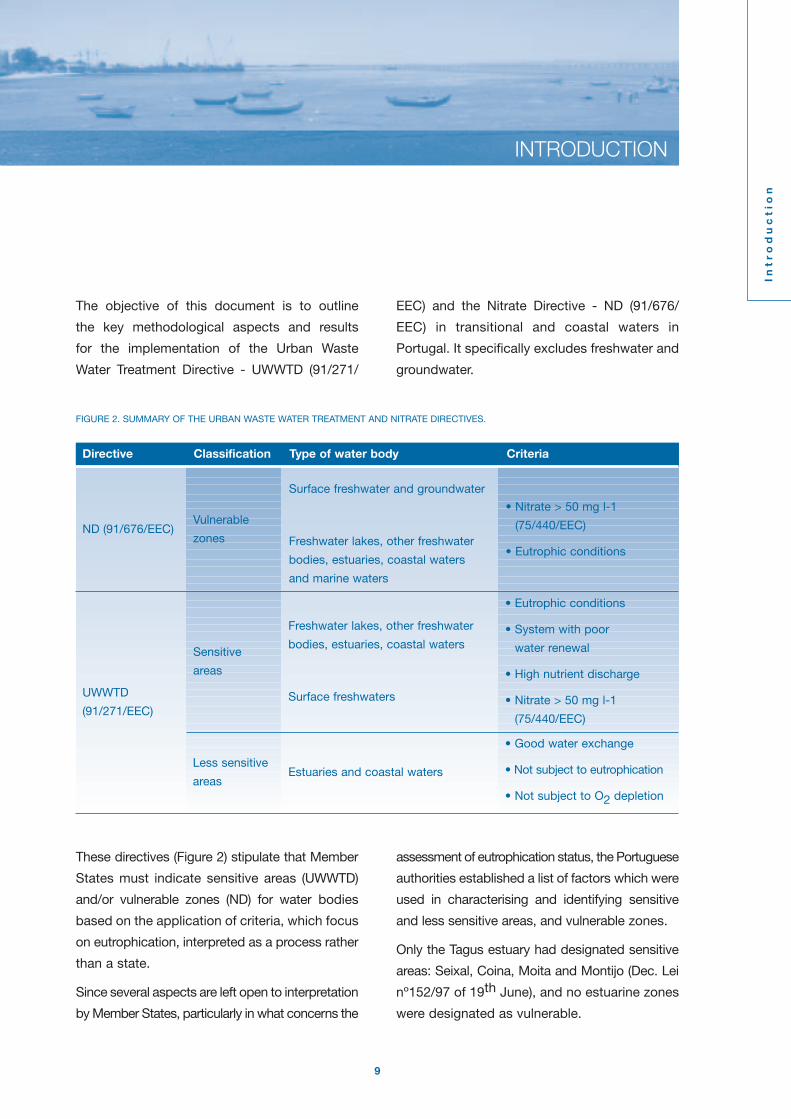
These directives (Figure 2) stipulate that Member
States must indicate sensitive areas (UWWTD)
and/or vulnerable zones (ND) for water bodies
based on the application of criteria, which focus
on eutrophication, interpreted as a process rather
than a state.
Since several aspects are left open to interpretation
by Member States, particularly in what concerns the
assessment of eutrophication status, the Portuguese
authorities established a list of factors which were
used in characterising and identifying sensitive
and less sensitive areas, and vulnerable zones.
Only the Tagus estuary had designated sensitive
areas: Seixal, Coina, Moita and Montijo (Dec. Lei
nº152/97 of 19th June), and no estuarine zones
were designated as vulnerable.
FIGURE 2. SUMMARY OF THE URBAN WASTE WATER TREATMENT AND NITRATE DIRECTIVES.
UWWTD
(91/271/EEC)
ND (91/676/EEC)
Directive Classification Type of water body Criteria
Sensitive
areas
Less sensitive
areas
Vulnerable
zones
Surface freshwater and groundwater
Freshwater lakes, other freshwater
bodies, estuaries, coastal waters
and marine waters
Freshwater lakes, other freshwater
bodies, estuaries, coastal waters
Surface freshwaters
• Eutrophic conditions
• System with poor
water renewal
• High nutrient discharge
• Nitrate > 50 mg l-1
(75/440/EEC)
• Nitrate > 50 mg l-1
(75/440/EEC)
• Eutrophic conditions
• Good water exchange
• Not subject to eutrophication
• Not subject to O2 depletion
Estuaries and coastal waters
Mira
S P A I N
Ria de Aveiro
Ria Formosa
Mondego
Sado
Minho
Lima
Tagus
Guadiana
Douro
INAG - INSTITUTO DA ÁGUA • IMAR - INSTITUTE OF MARINE RESEARCH
Int
ro
du
ct
ion
1 0
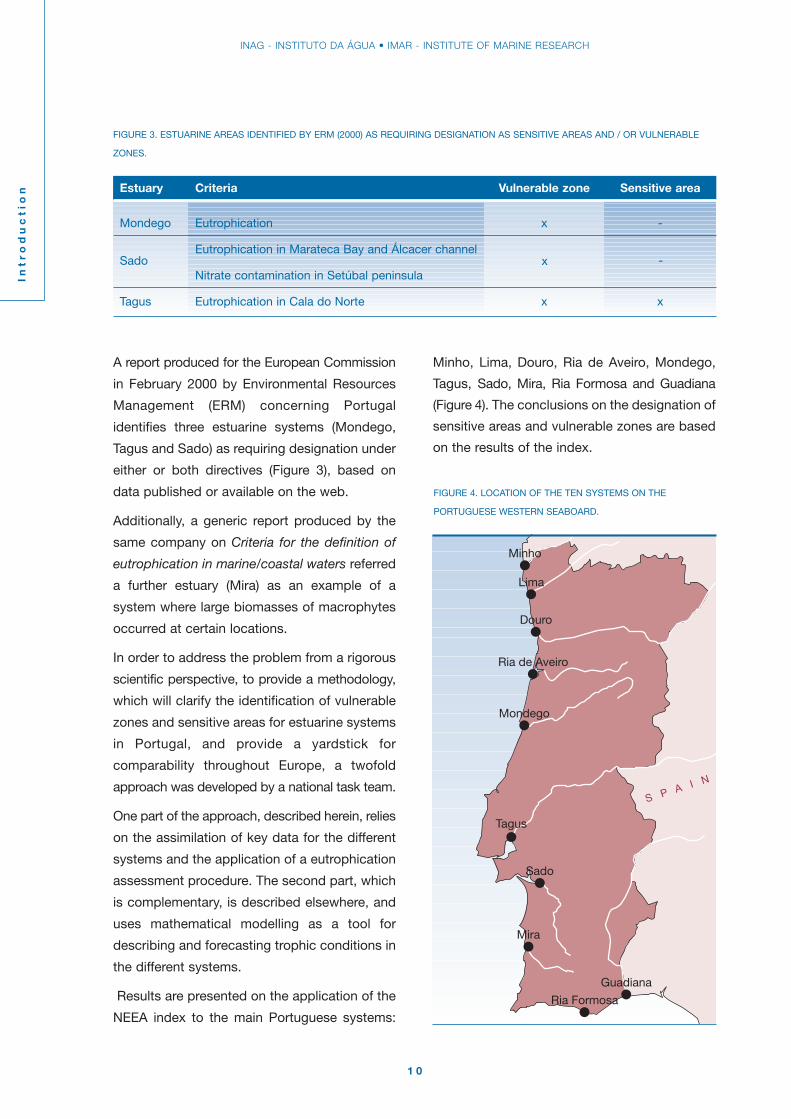
A report produced for the European Commission
in February 2000 by Environmental Resources
Management (ERM) concerning Portugal
identifies three estuarine systems (Mondego,
Tagus and Sado) as requiring designation under
either or both directives (Figure 3), based on
data published or available on the web.
Additionally, a generic report produced by the
same company on Criteria for the definition of
eutrophication in marine/coastal waters referred
a further estuary (Mira) as an example of a
system where large biomasses of macrophytes
occurred at certain locations.
In order to address the problem from a rigorous
scientific perspective, to provide a methodology,
which will clarify the identification of vulnerable
zones and sensitive areas for estuarine systems
in Portugal, and provide a yardstick for
comparability throughout Europe, a twofold
approach was developed by a national task team.
One part of the approach, described herein, relies
on the assimilation of key data for the different
systems and the application of a eutrophication
assessment procedure. The second part, which
is complementary, is described elsewhere, and
uses mathematical modelling as a tool for
describing and forecasting trophic conditions in
the different systems.
Results are presented on the application of the
NEEA index to the main Portuguese systems:
FIGURE 4. LOCATION OF THE TEN SYSTEMS ON THE
PORTUGUESE WESTERN SEABOARD.
Minho, Lima, Douro, Ria de Aveiro, Mondego,
Tagus, Sado, Mira, Ria Formosa and Guadiana
(Figure 4). The conclusions on the designation of
sensitive areas and vulnerable zones are based
on the results of the index.
FIGURE 3. ESTUARINE AREAS IDENTIFIED BY ERM (2000) AS REQUIRING DESIGNATION AS SENSITIVE AREAS AND / OR VULNERABLE
ZONES.
x -
Estuary Criteria Vulnerable zone Sensitive area
Mondego Eutrophication x -
Eutrophication in Marateca Bay and Álcacer channel
Nitrate contamination in Setúbal peninsula
Tagus Eutrophication in Cala do Norte x x
Sado
METHODOLOGY
Me
th
od
olo
gy
1 1
This section briefly describes the methodology
used for eutrophication assessment for the
different systems.
A review was carried out of the different
approaches currently available, including different
indices, the OSPAR discussion documents on
Common assessment criteria and their application
within the comprehensive procedure, and
the NOAA National Estuarine Eutrophication
Assessment (NEEA).
Following the review, a decision was taken to
apply the latter approach, for three reasons.
Reasons to choose NEEA
• It was applied to 138 estuaries in the whole of the United States, over a seven year period;
• It reflects a diversity of environmental conditions in estuarine use, morphology, river discharge
(magnitude and regime) and tidal ranges;
• It was consolidated through intense peer-review within the scientific community, and has been
published in the open literature.
Four stages were identified by this working
group as key milestones for the success of this
task:
• Assembly and loading of a relational database
for each system, consolidating all the raw
data available over the past twenty-five
years. These databases provide the support
for loading the index, trend analysis and
decision-making;
• Application of the index to the different systems,
and presentation of results on a custom-built
website, located at http://tejo.dcea.fct.unl/assets/
• Involvement of regional experts on each estuary
to provide guidance on local interpretation
issues, and of a NOAA expert to provide
guidance in the application of the NEEA;
• Where applicable, identification of vulnerable
zones and sensitive areas on the basis of the
results.
Some information is given below on the database
and NEAA methodologies.
DATA ASSIMILATION - WATERQUALITY DATABASES
The BarcaWin2000TM software was used for
building relational databases for the ten
systems. This team has extensive experience
with water quality databases; the software in
use has been developed from 1985 onwards,
and has been used for a wide range of data
storage and exploitation projects in estuaries
and coastal areas: these include Carlingford
three zones. In the U.S. study this was based on
NOAA’s National Estuarine Inventory (NEI):
• Tidal freshwater (<0.5)
• Mixing zone (0.5-25)
• Seawater (>25)
Data for each parameter are aggregated using
spatial rules, which are used for weighting values
at different sampling stations to provide a fair
representation of conditions within each system.
These salinity zones are determined for the
various systems using a relational database with
measured salinity data at different sampling
stations and a geographic information system
(GIS) to calculate surface areas.
Dataset
In order to be able to compare different systems,
an analysis of data completeness and reliability
(DCR) is carried out, with the objective of
intercalibrating the spatial and temporal quality
of the datasets (completeness) and the confidence
in the results (reliability – sensu lato, includes
sampling and analytical quality).
Indices
Following these initial steps, there are three indices
which may be calculated from the datasets. These
are:
Overall Eutrophic Condition (OEC) index
Overall Human Influence (OHI) index
Determination of Future Outlook (DFO) index
Although there is interaction between these
different indices, they are not specifically
combined into a final value. The susceptibility
part of the evaluation (see OHI, below) is
however used both in OHI and DFO.
INAG - INSTITUTO DA ÁGUA • IMAR - INSTITUTE OF MARINE RESEARCH
Me
th
od
olo
gy
1 2
Lough in Ireland, Marennes-Oléron in France,
the Northern Adriatic, S. Francisco Bay in the
U.S. and coastal embayments in China and
South Africa. More information may be found at
http://tejo.dcea.fct.unl.pt/b2k/
NOAA’S NATIONAL ESTUARINEEUTROPHICATION ASSESSMENT
NEEA methodology
The National Estuarine Eutrophication Assessment
(NEEA) was carried out for 138 estuaries in the
U.S., during a period of over seven years. It is the
most comprehensive survey of eutrophication in
estuarine systems carried out to date, encompassing
over 90% of the U.S. estuarine surface area.
It has a diverse set of outputs, including an
eutrophication index which has been implemented
for the different estuaries, based on a stepwise
procedure. The different components are briefly
reviewed in the next sections.
Homogeneous areas
The first step in applying the methodology is a
physical classification of an estuarine system,
with the objective of dividing each system into
The NEEA approach may be divided into three parts:
• Division of estuaries into homogeneous areas
• Evaluation of data completeness and reliability
• Application of indices

IDENTIFICATION OF SENSITIVE AREAS AND VULNERABLE ZONES IN TRANSITIONAL AND COASTAL PORTUGUESE SYSTEMS
Me
th
od
olo
gy
1 3
A short description of the methodology for each
component is detailed below.
OVERALL EUTROPHIC CONDITION
The Overall Eutrophic Condition (OEC) index
has a sequential (stepwise) approach based on
2 phases, which bring together six key parameters
(Figure 5). The primary symptoms correspond to
the first stage of water quality degradation and are
examined through the analysis of chlorophyll a
concentrations, epiphyte abundance and
macroalgal blooms. In some systems the primary
symptoms lead to secondary symptoms such as
submerged aquatic vegetation loss, nuisance and
toxic algal blooms and low dissolved oxygen
(anoxia or hypoxia).
FIGURE 5. EUTROPHICATION MODEL (ADAPTED FROM NEEA).
External Nutrient Inputs
Nitrogen and PhosphorusDiatoms to Flagellates
Benthic Dominance to Pelagic
Dominance
Algal Dominance Changes
Extreme Chl-a Concentrations
Problematic Macroalgal Growth
Increased Organic Decomposition
Primary Symptoms
Extreme Chl-a Concentrations
Problematic Epiphytic Growth
Problematic Macroalgal Growth
Decreased Light Availability
Secondary Symptoms
SAV Spatial Coverage
SAV Spatial Coverage Trends
Loss of SAV
Nuisance Blooms
Toxic Blooms
Harmful Algae
Anoxia
Hypoxia
Biological Stress
Low Dissolved Oxygen
>
>
>
>
>
>
Phase 1: Primary Symptoms Method (PSM),
considering algal biomass (using chlorophyll a
as an indicator), epiphyte and macroalgal
grouth.
Phase 2: Secondary Symptoms Method
(SSM), considering loss of submerged aquatic
vegetation (SAV), harmful algae and low
dissolved oxygen.
After the division into homogeneous zones and
application of DCR, followed by Phases 1 and 2
of OEC, the last stage is the determination of
the Overall Level of Expression of Eutrophic
Conditions (OLEC), which combines the Phase
1 (primary) symptoms on the Y-Axis with the
Phase 2 (secondary) symptoms on the X-Axis to
provide an OLEC matrix (Figure 6).

INAG - INSTITUTO DA ÁGUA • IMAR - INSTITUTE OF MARINE RESEARCH
Me
th
od
olo
gy
1 4
MODERATE
Primary symptoms high
but problems with more
serious secondary
symptoms still not being
expressed
MODERATE LOW
Primary symptoms
beginning to indicate
possible problems but still
very few secondary
symptoms expressed
LOW
Level of expression
of eutrophic conditions
is minimal
MODERATE LOW
Moderate secondary
symptoms indicate
substantial eutrophic
conditions, but low primary
indicates other factors
may be involved in
causing the conditions
MODERATE HIGH
High secondary
symptoms indicate
serious problems, but low
primary indicates other
factors may also
be involved in causing
conditions
MODERATE
Level of expression
of eutrophic conditions
is substantial
HIGH
Substantial levels of
eutrophic conditions
occurring with secondary
symptoms indicating
serious problems
MODERATE HIGH
Primary symptoms high
and substantial secondary
symptoms becoming
more expressed,
indicating potentially
serious problems
HIGH
High primary symptoms
and secondary symptom
levels indicate serious
eutrophication problems
OVERALL LEVEL OF EXPRESSION OF EUTROPHIC CONDITIONS
Low primary symptoms
Moderate primarysymptoms
High primary symptoms
1
0
0.6
0.3
0.3 0.6 1
Low secondarysymptoms
High secondarysymptoms
Moderate secondarysymptoms
FIGURE 6. OVERALL LEVEL OF EXPRESSION OF EUTROPHIC CONDITIONS MATRIX.
OVERALL HUMAN INFLUENCE
Following the determination of the Overall
Eutrophic Condition (OEC) using the approach
described above, there is a similar procedure
for determining the Overall Human Influence
(OHI) index, based on another set of stepwise
calculations.
Susceptibility Determining the estuarine export
potential (EXP), by defining a dilution potential
(DIL) and a flushing potential (FLU). Dilution is
determined as a function of the system volume,
weighted with a stratification term, where
applicable. Flushing is a function of tidal
amplitude and river flow.
Nutrient inputs based on watershed loads,
determined through direct (e.g. river discharge x
measured substance concentration) and indirect
(e.g. estimates for fertilizer application) methods.
The susceptibility approach and its combination
with the nutrient inputs are shown in Figure 7.
This approach has been extended by the
development of a simple loading-susceptibility
model (Figure 8), which is described below.

IDENTIFICATION OF SENSITIVE AREAS AND VULNERABLE ZONES IN TRANSITIONAL AND COASTAL PORTUGUESE SYSTEMS
Me
th
od
olo
gy
1 5
FIGURE 7. COMBINATION OF DILUTION AND FLUSHING FOR SUSCEPTIBILITY (TOP) AND SUSCEPTIBILITY AND NUTRIENT INPUT FOR
OHI (BOTTOM) (ADAPTED FROM NEEA).
MODERATE
Even low additions may
cause problems in these
estuaries
MODERATE LOW
Symptoms are minimally
to moderately related to
nutrient inputs
LOW
Symptoms have mainly
natural causes or are due
to other humanfactors
LOW
Symptoms have mainly
natural causes or are due
to other humanfactors
MODERATE LOW
Symptoms may be
naturally related, but high
inputs may cause
problems
MODERATE
Symptoms observed are
moderately to related to
nutrient inputs
MODERATE HIGH
Symptoms observed are
moderately to highly related
to nutrient additions
MODERATE HIGH
Symptoms observed are
moderately to highly related
to nutrient additions
HIGH
Symptoms are probably
closely related to nutrient
additions
OVERALL LEVEL OF HUMAN INFLUENCE
Nutrient Input
Sus
cep
tib
ility
Low
Moderate
High
Low HighModerate
Low Susceptibility
Low Susceptibility
Low SusceptibilityModerate
Susceptibility
Moderate
Susceptibility
Moderate
SusceptibilityHigh Susceptibility
High Susceptibility High Susceptibility
ESTUARINE EXPORT POTENTIAL & SUSCEPTIBILITY
High Potential. The estuary has the capacity to dilute and flush nutrients
Low Potential. The estuary does not have the capacity to dilute or flush nutrients
Flus
hing
Po
tent
ial
High
Low
Moderate
High
LowModerate
Dilution Potential
Moderate Potential. The estuary has the capacity to
dilute or flush nutrients

INAG - INSTITUTO DA ÁGUA • IMAR - INSTITUTE OF MARINE RESEARCH
Me
th
od
olo
gy
1 6
FIGURE 8. CONCEPTUAL SCHEME FOR LOADING-SUSCEPTIBILITY MODEL.

IDENTIFICATION OF SENSITIVE AREAS AND VULNERABLE ZONES IN TRANSITIONAL AND COASTAL PORTUGUESE SYSTEMS
Me
th
od
olo
gy
1 7
The nutrient loading to a system may be
determined by calculating the relative magnitude
of the different sources. These include the
boundary contributions (river and ocean), point-
source discharges and diffuse loading within the
estuarine perimeter. In this simple box model, the
ocean loading to an estuary during the flood
tide is balanced by the corresponding nutrient
outflow during the ebb.
Susceptibility is partly dependent on tidal
exchange, which will determine the capacity of
an estuary to assimilate nutrient inputs, simulated
as dispersive exchange due to the tide (Figure 9).
The model requires as input data basic estuarine
physiography, salinity, nutrient concentration in
adjacent ocean water, and anthropogenic loads.
The latter are divided into River load, Effluent
load and Other sources. In coastal areas (e.g.
coastal lagoons) with negligible freshwater
input, the nutrient input depends on effluent
discharge into the watershed and on tidal
exchanges. The modelling approach has been
adapted to determine the natural conditions
based on the nutrient concentration at the
seaward boundary and the water residence time
of the coastal system. The human influence is
determined from the model, by considering the
concentration of nutrients in the estuary if the
sole origin is human input, and the component of
the estuarine nutrient concentration, which is
due to inputs at the ocean boundary (Figure 10).
A set of categories has been defined heuristically
(Figure 11) where the intervals correspond to the
relative contribution of the anthropogenic load to
the total input, as measured according to the
Human influence metric.
This metric examines the relative role of natural
sources and anthropogenic sources of nutrients
in determining both the load and the concentration.
Although the input associated with a “Low” score
may not be low in absolute terms, when it is
14
12
10
8
6
4
2
00 100 200 300 400
Nutrient load (kg h-1)
Time (days)
Human input
Net outflow
due to river
Tidal exchange
100
85
70
55
40
250 100 200 300 400
Human influence (%)
Time (days)
FIGURE 9. COMPARATIVE NUTRIENT LOADS TO AN ESTUARY
FROM DIFFERENT SOURCES DURING THE EBB AND FLOOD.
FIGURE 10. HUMAN INFLUENCE FOR A “CONCEPT” ESTUARY.
THRESHOLDS ARE INDICATED WITH DOTTED LINES.
Class Thresholds Category
Low 0 to < 30% Low nutrient input
Moderate nutrient
input
High 70 to ≤ 100% High nutrient input
FIGURE 11. THRESHOLDS AND CATEGORIES USED TO CLASSIFY
NUTRIENT INPUTS IN THE ESTUARIES.
Moderate 30 to < 70%

INAG - INSTITUTO DA ÁGUA • IMAR - INSTITUTE OF MARINE RESEARCH
Me
th
od
olo
gy
1 8
examined in terms of the total load it is clear
that control measures would at best reduce
overall concentrations by 30%. The “Moderate”
and “High” classes would potentially allow a
more significant degree of control in reducing
overall nutrient concentrations.
DETERMINATION OF FUTUREOUTLOOK
Finally, there is a stage for determination of
future outlook (DFO), which looks at the
foreseeable evolution of the system. The
susceptibility component of the approach is
used for both OHI and DFO, and therefore
needs to be input only once. The choices to be
made in this part of the decision process are
heuristic.
This means that the user will be presented with
a list of three choices for the nutrient pressures
part of the matrix:
1. Future nutrient pressures decrease;
2. Future nutrient pressures are unchanged;
3. Future nutrient pressures increase.
The combined usage of the different components
of the NEEA approach is a powerful tool for
analysing eutrophication in estuaries and
coastal lagoons. In the next ten chapters, this
evaluation is carried out for the Minho, Lima,
Douro, Ria de Aveiro, Mondego, Tagus, Sado, Mira
and Guadiana estuaries and the Ria Formosa
coastal lagoon, to address the following
questions:
1. What is the eutrophication status of each of
the systems, as a whole and in sections;
how does it compare with other estuaries
and coastal systems, in Portugal and
elsewhere?
2. Which systems or parts of systems should be
classified as sensitive areas and/or vulnerable
zones?
3. What are the potential management solutions,
for example through effluent treatment or
improvement of agricultural practices?
4. What will be the trends in nutrient loading to
these estuaries, from urban and agricultural
sources, over the next few decades?
5. Where are the main data gaps, and what are
the recommendations for monitoring and
research in each of the systems?
6. How can this assessment be used as the
basis for a national strategy?
KEY REFERENCES
Bricker, S.B., Clement, C.G., Pirhalla, D.E.,
Orlando, S.P., Farrow, D.R.G., 1999. National
estuarine eutrophication assessment: Effects of
nutrient enrichment in the nation’s estuaries. (71
pp.). Silver Spring, MD: NOAA, National Ocean
Service, Special Projects Office and the
National Centers for Coastal Ocean Science.
Bricker, S.B., Ferreira, J.G., Simas, T., 2003. An
Integrated Methodology for Assessment of
Estuarine Trophic Status. Ecological Modelling,
In press.
OSPAR, 2000. Quality Status Report 2000:
Region IV - Bay of Biscay and Iberian Coast.
OSPAR Comission, London. 134 pp.
Tett, P., Gilpin, L., Svendsen, H., Erlandsson,
C.P., Larsson, U., Kratzer, S., Fouilland, E.,
Janzen, C., Lee, J., Grenz, C., Newton, A.,
Ferreira, J.G., Fernandes, T., Scory, S., 2003.
Eutrophication and some European waters of
restricted exchange. Coastal and Nearshore
Oceanography, In Press.

RESULTS
Re
su
lts
1 9
The results of this study are presented in ten
chapters, one for each system under analysis. The
information collected for each estuary was loaded
into a relational database, which was subsequently
used to perform calculations, extract time series
and export datasets for use in geographic
information systems (GIS). Figure 12 gives an
overview of the information in each database.
These databases bring together in MS-AccessTM
format all the relevant information for the application
of the NEEA index which was accessible to the
study team. There are up to 25 years of sampling
data stored, and whenever possible, complementary
data were included, which may prove useful for
other types of studies in the future.
The chapters on the Minho, Lima, Douro, Mondego
and Mira reflect some of the limitations of available
data: in the case of Minho and Lima, these are
related to the number of parameters and spatial
distribution. In the Mondego and Douro estuaries,
the main issue is the limited spatial distribution
of available data. In the case of the Mira, these
are mainly related to the number of parameters.
Despite these constraints, the structure of the
different chapters is whenever possible identical,
in order to allow for comparisons between the
different systems.
FIGURE 12. RECORDS LOADED INTO EACH SYSTEM DATABASE.
RecordsSystem Stations Samples Parameters Results
Minho 17 322 34 3 538
Lima 31 603 70 8 096
Douro 39 292 42 5 006
Ria de Aveiro 84 1 441 91 13 499
Mondego 4 339 22 3 485
Tagus 40 4 821 119 60 567
Sado 273 2 833 31 17 448
Mira 8 6 354 13 29 708
Ria Formosa 67 96 665 165 135 730
Guadiana 105 35 665 32 133 783
Sub-total 668 149 335 619 410 860
Total number of records: 561 482


MINHO ESTUARY
Min
ho
Es
tu
ar
y
2 1
GENERAL CHARACTERISTICS
The Minho river is about 300 km long. The
upper part of the river is in Spain and the lower
70 km lie within Portuguese territory. Only 5% of
the total catchment area (17 080 km2) is in Portugal.
The limit of salt intrusion is 35 km from the
mouth (Figure 13).
The Minho is a mesotidal estuary in which
vertical stratification occurs during periods of
high freshwater discharge. Better vertical mixing
occurs during spring tides when the tidal range
reaches 4 m.
The estuary has a maximum width of about 2
km near the mouth, decreasing to about 10 m at
the head. In the middle of the estuary the flow
FIGURE 13. MINHO ESTUARY: BATHYMETRY AND SAMPLING STATIONS.
SpainPortugal
0 4000 m
Depth (m)
- 5
0
10
20
> 40
No data
Land
City limits
Portugal - Spain frontier
Estuary upper limit
Metadata
Sampling stations
Raw data
#1#2
#8#12
#3
#4
#5
#9
#13
Caminha
Vila Nova de Cerveira
Valença
Monção
#10
#6
#14
#15
#11
#7
INAG - INSTITUTO DA ÁGUA • IMAR - INSTITUTE OF MARINE RESEARCH
Min
ho
Es
tu
ar
y
2 2
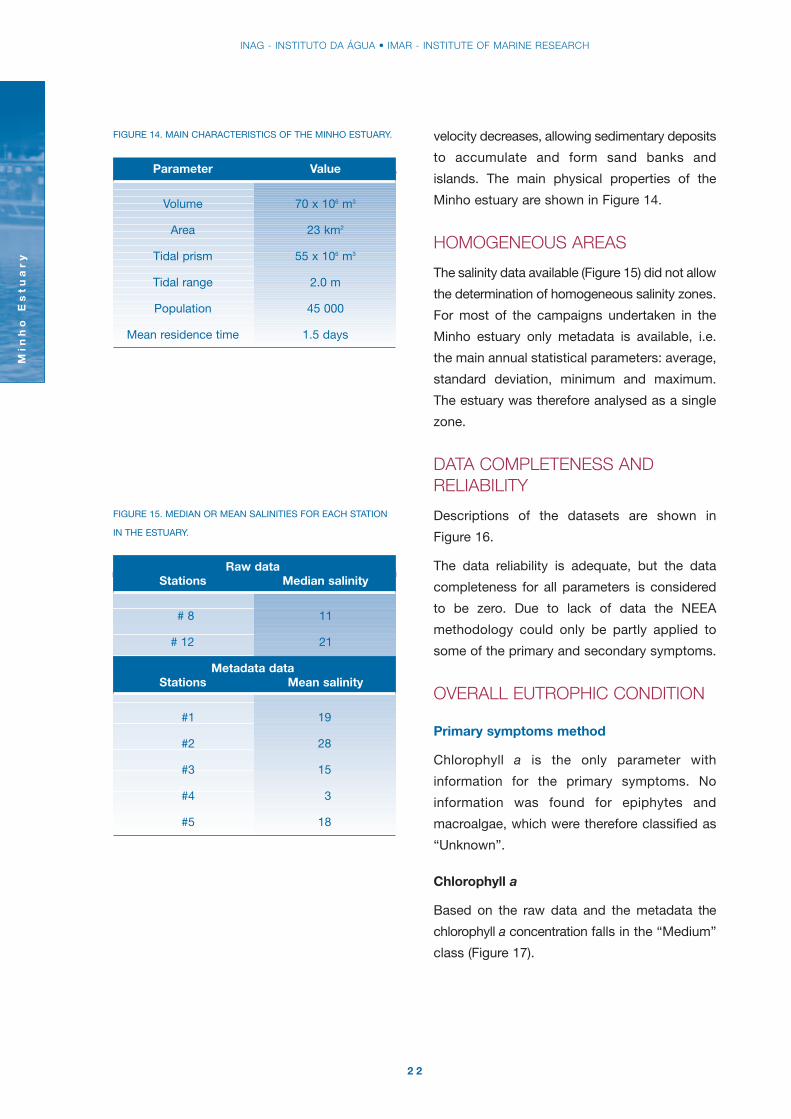
FIGURE 14. MAIN CHARACTERISTICS OF THE MINHO ESTUARY.
Parameter Value
Volume 70 x 106 m3
Area 23 km2
Tidal prism 55 x 106 m3
Tidal range 2.0 m
Population 45 000
Mean residence time 1.5 days
FIGURE 15. MEDIAN OR MEAN SALINITIES FOR EACH STATION
IN THE ESTUARY.
Raw dataStations Median salinity
# 8 11
# 12 21
Metadata dataStations Mean salinity
#1 19
#2 28
#3 15
#4 3
#5 18
velocity decreases, allowing sedimentary deposits
to accumulate and form sand banks and
islands. The main physical properties of the
Minho estuary are shown in Figure 14.
HOMOGENEOUS AREAS
The salinity data available (Figure 15) did not allow
the determination of homogeneous salinity zones.
For most of the campaigns undertaken in the
Minho estuary only metadata is available, i.e.
the main annual statistical parameters: average,
standard deviation, minimum and maximum.
The estuary was therefore analysed as a single
zone.
DATA COMPLETENESS ANDRELIABILITY
Descriptions of the datasets are shown in
Figure 16.
The data reliability is adequate, but the data
completeness for all parameters is considered
to be zero. Due to lack of data the NEEA
methodology could only be partly applied to
some of the primary and secondary symptoms.
OVERALL EUTROPHIC CONDITION
Primary symptoms method
Chlorophyll a is the only parameter with
information for the primary symptoms. No
information was found for epiphytes and
macroalgae, which were therefore classified as
“Unknown”.
Chlorophyll a
Based on the raw data and the metadata the
chlorophyll a concentration falls in the “Medium”
class (Figure 17).

IDENTIFICATION OF SENSITIVE AREAS AND VULNERABLE ZONES IN TRANSITIONAL AND COASTAL PORTUGUESE SYSTEMS
Min
ho
Es
tu
ar
y
2 3
FIGURE 16. DATASETS FOR THE MINHO ESTUARY.
Number of campaigns Date Stations Parameters
47
12
5*
26.02.2002
October 1993 to
September 1997
January to December
1982
Monthly from May until
September 1993
#8 to #11
#7
#8, #12.
#8, #9, #10,
#13, #14.
#8, #9, #10,
#12, #13,
#14, 15.
#1, #3, #4.
Temperature; salinity; pH; dissolved
oxygen; chlorophyll a, b and c;
phaeopigments; ammonia; nitrate;
nitrite; phosphate; silicate;
suspended matter.
Temperature; salinity; pH; conductivity;
dissolved oxygen; chlorophyll a;
phaeopigments; ammonia; nitrate;
nitrite; phosphate; total phosphorus;
suspended matter.
Salinity.
Suspended matter; % organic matter.
Temperature; pH; dissolved oxygen.
Temperature; salinity; pH; dissolved
oxygen; chlorophyll a; ammonia; nitrite;
nitrate; phosphate; total phosphorus.
12*Monthly from November
1992 until October 1993#1, #3, #4.
Temperature; salinity; pH; dissolved
oxygen; chlorophyll a; phaeopigments;
ammonia, nitrite, nitrate; phosphate,
total phosphorus.
10*
Monthly from
September 1996 until
June 1997
#2, #5, #6.
Temperature; salinity; pH; chlorophyll a;
phaeopigments; nitrate; phosphate,
total phosphorus; suspended
particulate matter.
12*Annual cycle in the
period of 1994-1997#1, #3.
Temperature; salinity; pH; dissolved
oxygen; chlorophyll a; ammonia; nitrite;
nitrate; phosphate; total phosphorus.
9*Monthly from October
1996 until June 1997#2, #4, #6. Temperature; salinity; pH.
12* Monthly during one year #1, #3.Temperature; salinity; conductivity; pH;
dissolved oxygen.
* For these campaigns only metadata (mean, standard deviation, minimum and maximum) were available for
each station, tidal situation and sample depth.
1

Min
ho
Es
tu
ar
y
2 4
These results are only indicative since:
1) Seasonal data are only available for one
station;
2) Metadata do not allow the determination of
percentile 90, used for classification of
typical chlorophyll a maxima in NEEA.
Secondary symptoms method
No information was reported in literature
concerning submerged aquatic vegetation and
nuisance and toxic blooms. Therefore these
parameters are classified as “Unknown”. For
dissolved oxygen, raw and metadata were
analysed.
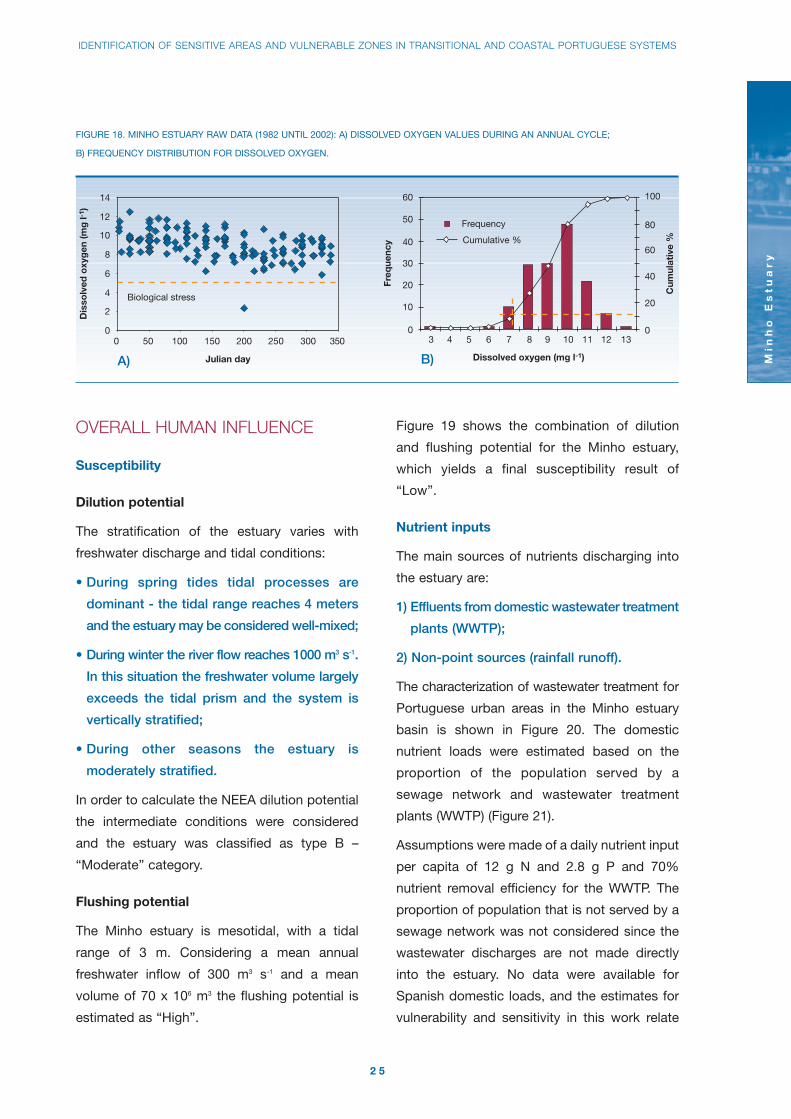
Dissolved oxygen
The percentile 10 value for dissolved oxygen is
above the threshold for biological stress
conditions (5 mg l-1). There is only one value for
the Minho estuary below the threshold.
Because it is unique and has a value completely
different from the universe of the sampling data
it was considered an outlier. The results obtained
with the raw data are confirmed by the
metadata (Figure 18). There is not one sample
with a minimum value below the biological
stress condition.
There appear to be no problems regarding
dissolved oxygen.
0
2
4
6
8
10
12
14
1 2 3 4 5 6 7 8 9 10 11 120
20
40
60
80
100
Cum
ulat
ive
%
Cumulative %
Frequency
Freq
uenc
y
B)
Chlorophyll a raw data:26.02.2002 sample stations #8 to #11Station #7 (1995-1997)
0
2
4
6
8
10
12
50 100 150 200 250 300 350 400
Julian day
Low
Medium
Percentile 90
A)
FIGURE 17. MINHO ESTUARY: A) CHLOROPHYLL CONCENTRATIONS DURING AN ANNUAL CYCLE; B) FREQUENCY DISTRIBUTION FOR
CHLOROPHYLL RAW DATA AND MAXIMUM VALUES OF METADATA (1993-2002).
IDENTIFICATION OF SENSITIVE AREAS AND VULNERABLE ZONES IN TRANSITIONAL AND COASTAL PORTUGUESE SYSTEMS
Min
ho
Es
tu
ar
y
2 5
OVERALL HUMAN INFLUENCE
Susceptibility
Dilution potential
The stratification of the estuary varies with
freshwater discharge and tidal conditions:
• During spring tides tidal processes are
dominant - the tidal range reaches 4 meters
and the estuary may be considered well-mixed;
• During winter the river flow reaches 1000 m3 s-1.
In this situation the freshwater volume largely
exceeds the tidal prism and the system is
vertically stratified;
• During other seasons the estuary is
moderately stratified.
In order to calculate the NEEA dilution potential
the intermediate conditions were considered
and the estuary was classified as type B –
“Moderate” category.
Flushing potential
The Minho estuary is mesotidal, with a tidal
range of 3 m. Considering a mean annual
freshwater inflow of 300 m3 s-1 and a mean
volume of 70 x 106 m3 the flushing potential is
estimated as “High”.
Figure 19 shows the combination of dilution
and flushing potential for the Minho estuary,
which yields a final susceptibility result of
“Low”.
Nutrient inputs
The main sources of nutrients discharging into
the estuary are:
1) Effluents from domestic wastewater treatment
plants (WWTP);
2) Non-point sources (rainfall runoff).
The characterization of wastewater treatment for
Portuguese urban areas in the Minho estuary
basin is shown in Figure 20. The domestic
nutrient loads were estimated based on the
proportion of the population served by a
sewage network and wastewater treatment
plants (WWTP) (Figure 21).
Assumptions were made of a daily nutrient input
per capita of 12 g N and 2.8 g P and 70%
nutrient removal efficiency for the WWTP. The
proportion of population that is not served by a
sewage network was not considered since the
wastewater discharges are not made directly
into the estuary. No data were available for
Spanish domestic loads, and the estimates for
vulnerability and sensitivity in this work relate
B)A)
0
2
4
6
8
10
12
14
0 50 100 150 200 250 300 350
Julian day
Dis
solv
ed o
xyg
en (m
g l-
1 )
Biological stress
0
10
20
30
40
50
60
3 4 5 6 7 8 9 10 11 12 13
Dissolved oxygen (mg l-1)
0
20
40
60
80
100
Cumulative %
Frequency
Cum
ulat
ive
%
Freq
uenc
y
FIGURE 18. MINHO ESTUARY RAW DATA (1982 UNTIL 2002): A) DISSOLVED OXYGEN VALUES DURING AN ANNUAL CYCLE;
B) FREQUENCY DISTRIBUTION FOR DISSOLVED OXYGEN.

INAG - INSTITUTO DA ÁGUA • IMAR - INSTITUTE OF MARINE RESEARCH
Min
ho
Es
tu
ar
y
2 6
FIGURE 20. POPULATION SERVED BY SEWAGE NETWORKS AND WASTEWATER TREATMENT IN THE MINHO ESTUARY.
Population served by sewage network and with WWTP
Caminha 9 600 5 000 Tertiary
Paredes de Coura 10 000 2 000 Tertiary
Valença 15 300 7 700 Secondary
V.N. de Cerveira 9 100 1 800 Secondary
Total 44 000 16 500
Town Resident population Treatment Level
directly to management measures which may
be taken in Portugal.
No data on nutrient inputs from industry were
available for calculations. Since industry has a
reduced importance in the watershed and
industrial effluents represent only 5% of the
mean annual domestic flow they were not
considered a significant source.
Non-point sources were estimated based on
the freshwater quality data and on the mean
annual river inflows (Figure 22).
Calculations for the Minho river were made
with water quality from a sampling station near
the head of the estuary and, for the Coura river,
using data from the Outeiro station. Spanish
rivers were not considered due to lack of data.
FIGURE 21. LOADS OF N AND P FROM DOMESTIC EFFLUENTS INTO THE MINHO ESTUARY.
Nutrient per capita Nutrient loads(kg pop. equiv.-1 yr-1) (ton yr-1)
Total N Total P Total N Total P
Served by sewage network
and WWTP
Without sewage network 27 500 - - - -
Total 44 000 - - 51 12
Populationequivalent
16 500 3 0.7 51 12
FIGURE 19. OVERALL SUSCEPTIBILITY FOR THE MINHO ESTUARY.
IF THEN THENType Vertical stratification Dilution volume Dilution potential
B Partly mixed 1/Vt 10-8 Moderate
Tidal prism Freshwater flow/estuary volume Flushing potential
Mesotidal Moderate 0.37 High
Overall susceptibility for the estuary: Low

IDENTIFICATION OF SENSITIVE AREAS AND VULNERABLE ZONES IN TRANSITIONAL AND COASTAL PORTUGUESE SYSTEMS
Min
ho
Es
tu
ar
y
2 7
FIGURE 22. N AND P LOADS FROM FRESHWATER INFLOW OF THE MAIN AFFLUENTS TO THE MINHO ESTUARY.
Flow River concentration Annual load(106 m3 yr-1) N (mg l-1) P (mg l-1) N (ton yr-1) P (ton yr-1)
Minho 9 617 1.3 0.02 13 000 200
Coura 3 719 2.0 0.03 7 000 100
Total - - - 20 000 300
River
FIGURE 23. NITROGEN AND PHOSPHORUS LOADS FROM THE
MAIN SOURCES OF NUTRIENTS TO THE ESTUARY.
Nitrogen Phosphorus(ton N y-1) (ton P y-1)
Treated and untreated
sources
Non-point sources
(runoff)
Total 20 051 312
20 000 300
51 12
Sources
The riverine nutrient inputs are considerable.
The soil uses in the Portuguese catchment of
the Minho river are shown in Figure 24. The
main factor contributing to this appears to be
cattle farming in the Spanish and Portuguese
areas of the watershed (estuary and river).
Additionally, some minor sources are:
• Runoff of domestic effluents which are not
linked to a sewage system;
• Direct discharge of domestic wastewater
into the Minho river at Monção, near the
upstream limit of the estuary.
The application of the loading–susceptibility
model described previously shows that the
human influence is about 96%, which falls into
the “High” category. The inputs to the Minho
estuary are therefore considered to be high.
Domestic effluents are negligible (Figure 23).
Although the freshwater nutrient loads to the
estuary are rated as “High” the system
susceptibility is “Low”, which leads to a final
classification of “Moderate Low” for Overall
Human Influence.

INAG - INSTITUTO DA ÁGUA • IMAR - INSTITUTE OF MARINE RESEARCH
Min
ho
Es
tu
ar
y
2 8
All nutrient data in the Minho estuary are below
the threshold for nitrate (50 mg l-1) given in EU
Directive 91/676/EEC (Figure 25).
DETERMINATION OF FUTUREOUTLOOK
No predictions about the evolution of domestic
or industrial wastewater treatment systems are
available. The land use proposals made by local
authorities anticipate the increase of urban and
industrial areas in the area of the Minho
watershed, which would suggest an increase of
nutrient loads. However, since the main input
appears to be linked to cattle, the relative
importance of these increases is debateable.
No predictions about nutrient input changes are
available for the Spanish part of the river. Since
this represents a high percentage of the total
drainage basin of the river Minho the DFO is
“Unknown”.
FIGURE 24. SOIL USES IN THE PORTUGUESE HYDROGRAPHIC BASIN OF THE MINHO RIVER.
0 2 4 6 km
Gauss projectionHayford ellipsoid
N
Urban areas
Agriculture: annual cultures
Grassland
Agriculture: diverse cultures
Forest
Shrubby vegetation
Fields with low vegetation
Wetlands
Continental waters
0
1
2
3
4
5
6
7
100 200 300
Julian day
Nit
rate
(mg
l-1 )
FIGURE 25. NITRATE CONCENTRATIONS IN THE MINHO
ESTUARY (STATIONS #7 TO #11).
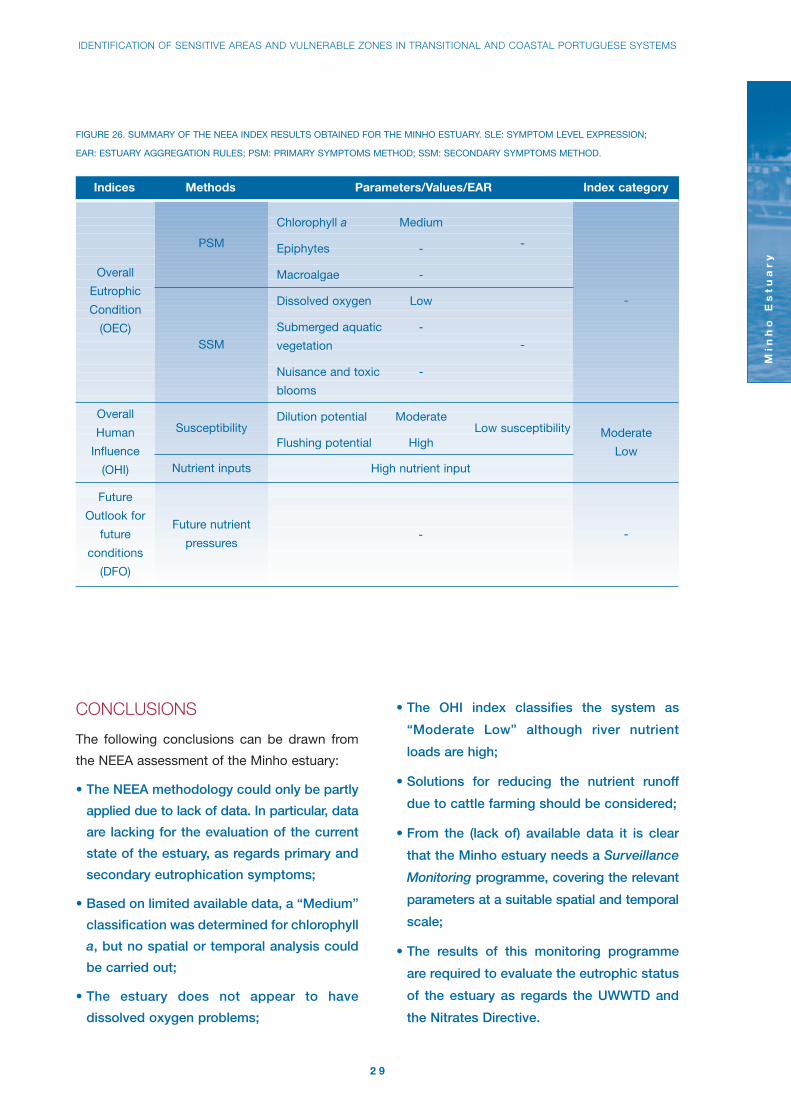
SUMMARY OF THE NEEA INDEXAPPLICATION
Figure 26 summarises the results obtained for
the NEEA index to the Minho estuary.
IDENTIFICATION OF SENSITIVE AREAS AND VULNERABLE ZONES IN TRANSITIONAL AND COASTAL PORTUGUESE SYSTEMS
Min
ho
Es
tu
ar
y
2 9
CONCLUSIONS
The following conclusions can be drawn from
the NEEA assessment of the Minho estuary:
• The NEEA methodology could only be partly
applied due to lack of data. In particular, data
are lacking for the evaluation of the current
state of the estuary, as regards primary and
secondary eutrophication symptoms;
• Based on limited available data, a “Medium”
classification was determined for chlorophyll
a, but no spatial or temporal analysis could
be carried out;
• The estuary does not appear to have
dissolved oxygen problems;
• The OHI index classifies the system as
“Moderate Low” although river nutrient
loads are high;
• Solutions for reducing the nutrient runoff
due to cattle farming should be considered;
• From the (lack of) available data it is clear
that the Minho estuary needs a Surveillance
Monitoring programme, covering the relevant
parameters at a suitable spatial and temporal
scale;
• The results of this monitoring programme
are required to evaluate the eutrophic status
of the estuary as regards the UWWTD and
the Nitrates Directive.
Overall
Human
Influence
(OHI)
Future
Outlook for
future
conditions
(DFO)
-
Moderate
Low
PSM
Susceptibility
Nutrient inputs
Future nutrient
pressures
Overall
Eutrophic
Condition
(OEC)
-
-
Low susceptibility
--
High nutrient input
Indices Methods Parameters/Values/EAR Index category
Chlorophyll a Medium
Epiphytes -
Macroalgae -
Dissolved oxygen Low
Submerged aquatic -
vegetation
Nuisance and toxic -
blooms
Dilution potential Moderate
Flushing potential High
SSM
FIGURE 26. SUMMARY OF THE NEEA INDEX RESULTS OBTAINED FOR THE MINHO ESTUARY. SLE: SYMPTOM LEVEL EXPRESSION;
EAR: ESTUARY AGGREGATION RULES; PSM: PRIMARY SYMPTOMS METHOD; SSM: SECONDARY SYMPTOMS METHOD.
Min
ho
Es
tu
ar
y
3 0
KEY REFERENCES
Fidalgo, M. L., 1998. Contribution to the
ecological characterization of the river Minho
estuary (northern Portugal). Verh. Internat.
Verein. Limnol., 26, 1448-1451.
References for grey literature consulted
for this chapter may be found at
http://www.imar.pt/perfect/

LIMA ESTUARY
Lim
a E
st
ua
ry
3 1
GENERAL CHARACTERISTICS
The Lima river has its source in Spain and
enters Portugal at Lindoso. It has a length of
108 km, 67 of which in Portugal, and reaches
the ocean at Viana do Castelo.
The Lima estuary is shown in Figure 27, and has
a mean depth of 2 m and a modular freshwater
inflow of 54 m3 s-1. Downstream, due to the
development of sandy channels near Cabedelo,
the estuary has a narrow, deep (> 5 m)
connection to the ocean with over 5 m depth.
The main physical properties of the Lima
estuary are shown in Figure 28.
FIGURE 27. LIMA ESTUARY: BATHYMETRY, SAMPLING STATIONS AND SALT INTRUSION LIMIT.
0 2 Km1
No data
Land
City limits
Barco do Porto
LM1
LM2B
SL
MP
L#1Darque
LM3
03F/03LM4
L#3
03F/02LM5
Lanheses
Bertiandos
Salt intrusion limit
Depth (m)
- 5
0
10
20
> 40
Viana do Castelo
Ponte de Lima
INAG - INSTITUTO DA ÁGUA • IMAR - INSTITUTE OF MARINE RESEARCH
Lim
a E
st
ua
ry
3 2
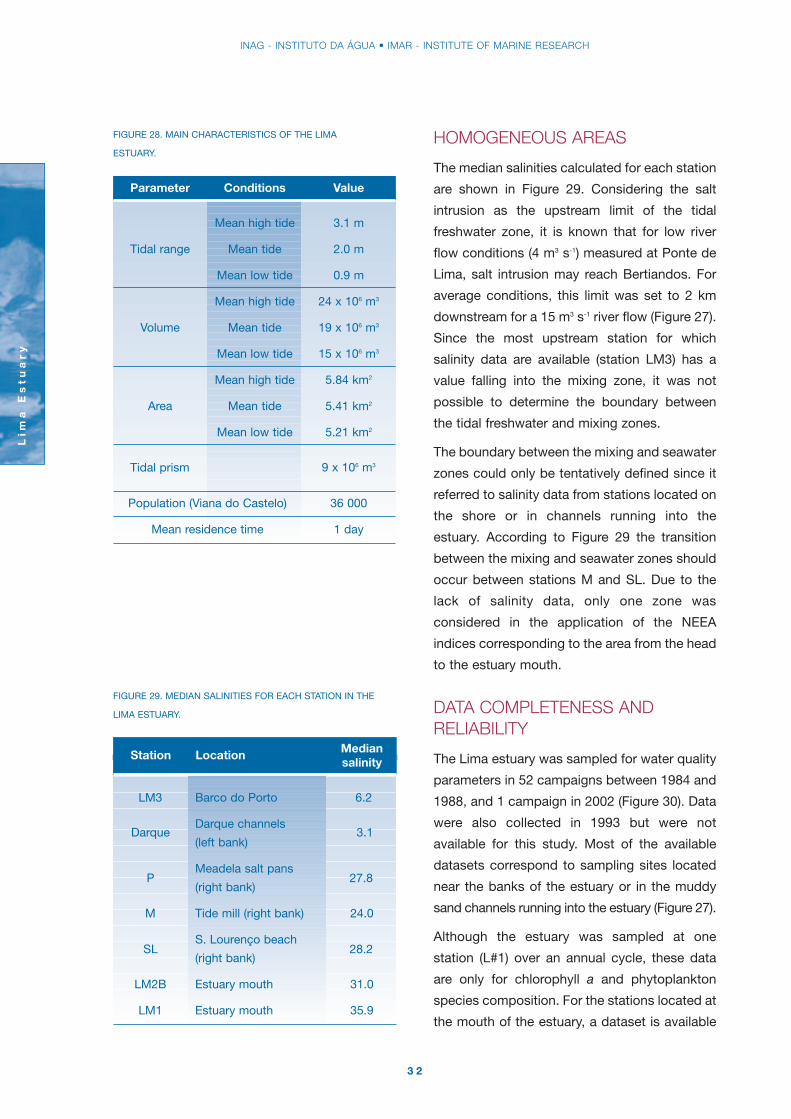
Parameter Conditions Value
Mean high tide 3.1 m
Tidal range Mean tide 2.0 m
Mean low tide 0.9 m
Mean high tide 24 x 106 m3
Volume Mean tide 19 x 106 m3
Mean low tide 15 x 106 m3
Mean high tide 5.84 km2
Area Mean tide 5.41 km2
Mean low tide 5.21 km2
Population (Viana do Castelo) 36 000
Mean residence time 1 day
FIGURE 28. MAIN CHARACTERISTICS OF THE LIMA
ESTUARY.
Tidal prism 9 x 10⁶ m3
Median salinity
LM3 Barco do Porto 6.2
Darque channels
(left bank)
Meadela salt pans
(right bank)
M Tide mill (right bank) 24.0
S. Lourenço beach
(right bank)
LM2B Estuary mouth 31.0
LM1 Estuary mouth 35.9
Station Location
FIGURE 29. MEDIAN SALINITIES FOR EACH STATION IN THE
LIMA ESTUARY.
3.1Darque
27.8P
28.2SL
HOMOGENEOUS AREAS
The median salinities calculated for each station
are shown in Figure 29. Considering the salt
intrusion as the upstream limit of the tidal
freshwater zone, it is known that for low river
flow conditions (4 m3 s-1) measured at Ponte de
Lima, salt intrusion may reach Bertiandos. For
average conditions, this limit was set to 2 km
downstream for a 15 m3 s-1 river flow (Figure 27).
Since the most upstream station for which
salinity data are available (station LM3) has a
value falling into the mixing zone, it was not
possible to determine the boundary between
the tidal freshwater and mixing zones.
The boundary between the mixing and seawater
zones could only be tentatively defined since it
referred to salinity data from stations located on
the shore or in channels running into the
estuary. According to Figure 29 the transition
between the mixing and seawater zones should
occur between stations M and SL. Due to the
lack of salinity data, only one zone was
considered in the application of the NEEA
indices corresponding to the area from the head
to the estuary mouth.
DATA COMPLETENESS ANDRELIABILITY
The Lima estuary was sampled for water quality
parameters in 52 campaigns between 1984 and
1988, and 1 campaign in 2002 (Figure 30). Data
were also collected in 1993 but were not
available for this study. Most of the available
datasets correspond to sampling sites located
near the banks of the estuary or in the muddy
sand channels running into the estuary (Figure 27).
Although the estuary was sampled at one
station (L#1) over an annual cycle, these data
are only for chlorophyll a and phytoplankton
species composition. For the stations located at
the mouth of the estuary, a dataset is available

IDENTIFICATION OF SENSITIVE AREAS AND VULNERABLE ZONES IN TRANSITIONAL AND COASTAL PORTUGUESE SYSTEMS
Lim
a E
st
ua
ry
3 3
only for one sample date collected during a
neap tide.
Due to the spatial and temporal data gaps, the
full application of the NEEA methodology was
not possible. However, all the primary and
secondary symptoms were examined for the
estuary as a whole.
OVERALL EUTROPHIC CONDITION
Primary symptoms method
Chlorophyll a is the only parameter with information
for the primary symptoms. No information was
found for epiphytes and macroalgae, which
were therefore classified as “Unknown”.
FIGURE 30. DATASETS FOR THE LIMA ESTUARY.
Number of campaigns Date Area Parameters
16
12
12
January to
December 1984
July 1984 to
October 1985
April 1985 to
March 1986
May 1987 to
April 1988
North shore
saltmarshes:
- Tide mill
(4.5 km from
the mouth)
- Salinas
(6.5 km from
the mouth)
Intertidal
zone in the
South bank
(3 km from
the mouth)
South bank
Salinas
(8 km from
the mouth)
One station
in the centre
of the estuary
(3.8 km from
the mouth)
Salinity
Temperature
Dissolved oxygen
Oxygen saturation
pH
Nitrate, nitrite and ammonia
Phosphate
Silicate
Chlorophyll a
Chlorophyll a
Phytoplankton species
Composition
1 February 20024 stations in
the estuary
Salinity
Temperature
S.P.M.
Dissolved oxygen
pH
Nitrate, nitrite and ammonia
Phosphate
Silicate
Chlorophyll a, b and c
12

Lim
a E
st
ua
ry
3 4
Chlorophyll a
Maximum chlorophyll a values in the Lima
estuary do not exceed the threshold indicated
in the NEEA for “Medium” eutrophic conditions.
The percentile 90 value falls within the 4.5 µg l-1
class, below the threshold defined for the “Low”
category (Figure 31).
Secondary symptoms method
Data for dissolved oxygen and phytoplankton
species composition were analysed. No information
was reported in the literature concerning
submerged aquatic vegetation. Therefore this
parameter is classified as “Unknown”.
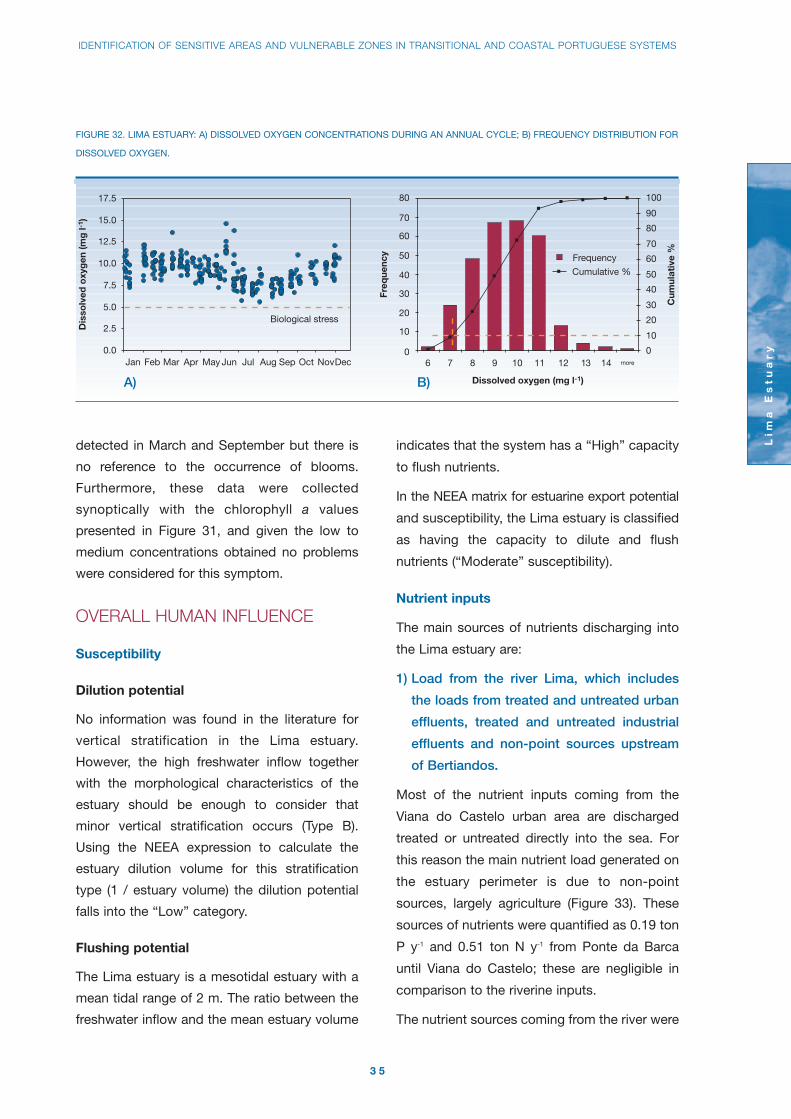
Dissolved oxygen
No values below the NEEA threshold for the
biological stress conditions (5 mg l-1) were
registered for the Lima estuary.
The minimum values were obtained during the
summer months (July and August) and the
percentile 10 is within the 7 mg l-1 class indicating
no problems with this parameter (Figure 32).
Nuisance and toxic blooms
Three species known to be toxic and/or harmful
were identified: Skeletonema sp., Ceratium
fusus and Ceratium furca. These species were
0.0
2.5
5.0
7.5
10.0
12.5
15.0
Jan Feb Mar Apr May Jun Jul Aug Sep Oct Nov Dec
Low
Medium
B)A)
0
10
20
30
40
50
60
70
0.5 1 1.5 2 2.5 3 3.5 4 4.5 5 5.5 6 more
0
10
20
30
40
50
60
70
80
90
100
Frequency
Cumulative %
Cum
ulat
ive
%
Freq
uenc
y
FIGURE 31. LIMA ESTUARY: A) CHLOROPHYLL CONCENTRATIONS DURING AN ANNUAL CYCLE; B) FREQUENCY DISTRIBUTION FOR
CHLOROPHYLL.
IDENTIFICATION OF SENSITIVE AREAS AND VULNERABLE ZONES IN TRANSITIONAL AND COASTAL PORTUGUESE SYSTEMS
Lim
a E
st
ua
ry
3 5
detected in March and September but there is
no reference to the occurrence of blooms.
Furthermore, these data were collected
synoptically with the chlorophyll a values
presented in Figure 31, and given the low to
medium concentrations obtained no problems
were considered for this symptom.
OVERALL HUMAN INFLUENCE
Susceptibility
Dilution potential
No information was found in the literature for
vertical stratification in the Lima estuary.
However, the high freshwater inflow together
with the morphological characteristics of the
estuary should be enough to consider that
minor vertical stratification occurs (Type B).
Using the NEEA expression to calculate the
estuary dilution volume for this stratification
type (1 / estuary volume) the dilution potential
falls into the “Low” category.
Flushing potential
The Lima estuary is a mesotidal estuary with a
mean tidal range of 2 m. The ratio between the
freshwater inflow and the mean estuary volume
indicates that the system has a “High” capacity
to flush nutrients.
In the NEEA matrix for estuarine export potential
and susceptibility, the Lima estuary is classified
as having the capacity to dilute and flush
nutrients (“Moderate” susceptibility).
Nutrient inputs
The main sources of nutrients discharging into
the Lima estuary are:
1) Load from the river Lima, which includes
the loads from treated and untreated urban
effluents, treated and untreated industrial
effluents and non-point sources upstream
of Bertiandos.
Most of the nutrient inputs coming from the
Viana do Castelo urban area are discharged
treated or untreated directly into the sea. For
this reason the main nutrient load generated on
the estuary perimeter is due to non-point
sources, largely agriculture (Figure 33). These
sources of nutrients were quantified as 0.19 ton
P y-1 and 0.51 ton N y-1 from Ponte da Barca
until Viana do Castelo; these are negligible in
comparison to the riverine inputs.
The nutrient sources coming from the river were
0.0
2.5
5.0
7.5
10.0
12.5
15.0
17.5
Jan Feb Mar Apr May Jun Jul Aug Sep Oct NovDec
Dis
solv
ed o
xyg
en (m
g l-
1 )
Biological stress
0
10
20
30
40
50
60
70
80
90
100
0
10
20
30
40
50
60
70
80
6 7 8 9 10 11 12 13 14 more
Frequency
Cumulative %
Cum
ulat
ive
%
Freq
uenc
yDissolved oxygen (mg l-1)B)A)
FIGURE 32. LIMA ESTUARY: A) DISSOLVED OXYGEN CONCENTRATIONS DURING AN ANNUAL CYCLE; B) FREQUENCY DISTRIBUTION FOR
DISSOLVED OXYGEN.

INAG - INSTITUTO DA ÁGUA • IMAR - INSTITUTE OF MARINE RESEARCH
Lim
a E
st
ua
ry
3 6
calculated using nitrogen and phosphorus
concentrations in Lanheses (station 03F/03,
Figure 28) and the modular river flow (54 m3 s-1).
The nitrogen and phosphorus loads reaching
the estuary are 1 077 ton y-1 and 86 ton y-1
respectively.
The application of the loading – susceptibility
model followed the approach described for
transitional waters in the methodology. The
results obtained show that the human influence
is about 72%, which falls into the “High”
category. The final classification for the OHI in
the Lima estuary is thus “Moderate High”.
However, the data gaps identified should be
borne in mind, since the median salinity of 26.8
used to run the model corresponds to sampling
sites which cannot be considered as temporally
and/or spatially representative of the whole
system.
Taking into account the threshold (50 mg l-1) in
the EU Directive 91/676/EEC for the nitrate
concentration, values in the Lima estuary are
generally two orders of magnitude below it with
a mean value of 0.6 mg l-1 (Figure 34).
DETERMINATION OF FUTUREOUTLOOK
The four wastewater treatment plants (WWTP) in
the Lima watershed serve about 45 000 inhabitants
and were planned for about 65 000 inhabitants
(Figure 35). Although the Ponte da Barca WWTP
has already reached its full capacity, an
FIGURE 33. SOIL USES IN THE LIMA WATERSHED.
0 5 10 15 km
Gauss projectionHayford ellipsoid
N
Urban areas
Agriculture: annual cultures
Agriculture: standing cultures
Agriculture: diverse cultures
Forest
Shrubby vegetation
Fields with low vegetation
Wetlands
Continental waters
Sea water

IDENTIFICATION OF SENSITIVE AREAS AND VULNERABLE ZONES IN TRANSITIONAL AND COASTAL PORTUGUESE SYSTEMS
Lim
a E
st
ua
ry
3 7
0.0000
0.0005
0.0010
0.0015
0.0020
0.0025
0.0030
0.0035
0.0040
Jan Feb Mar Apr May Jun Jul Aug Sep Oct Nov Dec
Nit
rate
co
ncen
trat
ion
(mg
l-1 )
FIGURE 34. NITRATE CONCENTRATIONS IN THE LIMA ESTUARY. enlargement is planned. Considering the current
level of WWTP use, which is about 70%, it can
be considered that the present and future
treatment of nutrients discharged into the Lima
watershed is assured and no change in future
nutrient pressures should occur.
SUMMARY OF THE NEEA INDEXAPPLICATION
Figure 36 summarizes the results obtained for the
application of the NEEA index to the Lima estuary.
FIGURE 35. CAPACITY OF THE WASTEWATER TREATMENT PLANTS IN THE LIMA WATERSHED AND FUTURE IMPROVEMENTS.
Resident Population to WWTP Treatment level Districts Discharge basin population be served
in 1998 in the project
Arcos de Arcos de River Vez
Valdevez Valdevez (Lima affluent)
Ponte de Lima Secondary Ponte de Lima Lima 3 898 6 000
Ponte da Barca Secondary Ponte da Barca Lima 2 345 1 950
Viana do Castelo Secondary Viana do Castelo Sea 35 650 52 400
Total 44 581 65 350
Secondary 2 688 5 000
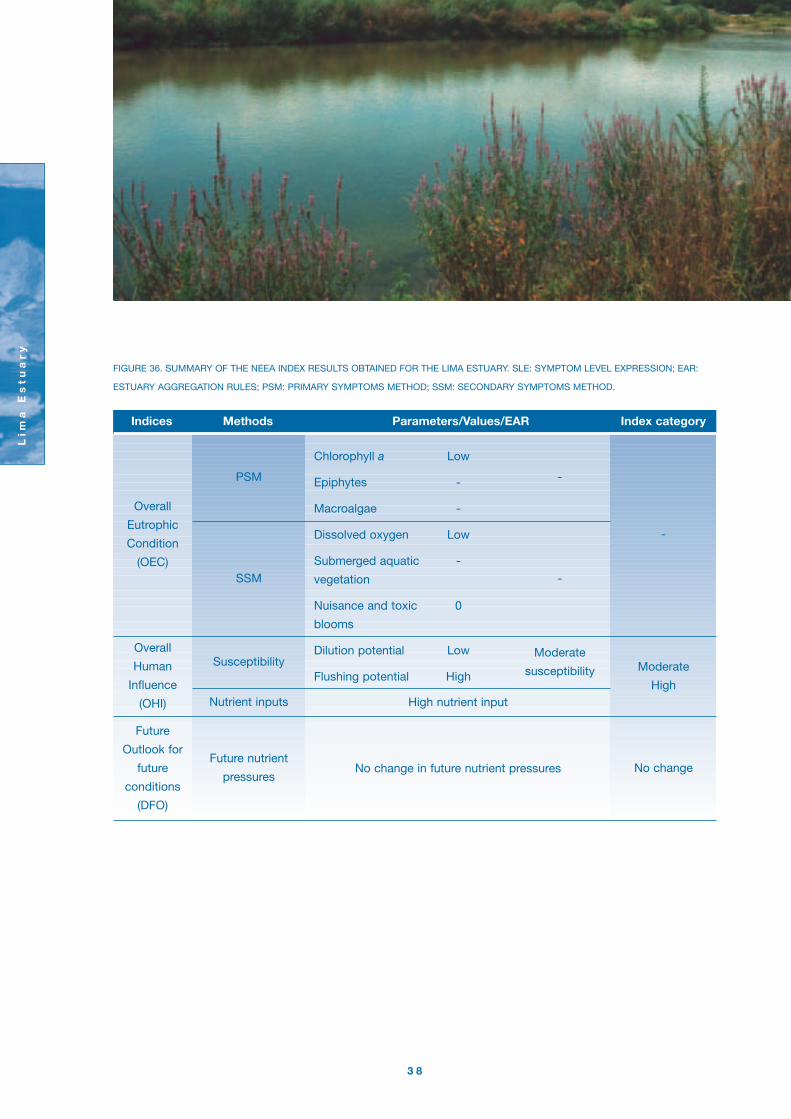
Lim
a E
st
ua
ry
3 8
Overall
Human
Influence
(OHI)
Future
Outlook for
future
conditions
(DFO)
-
Moderate
High
PSM
Susceptibility
Nutrient inputs
Future nutrient
pressures
Overall
Eutrophic
Condition
(OEC)
-
-
Moderate
susceptibility
No changeNo change in future nutrient pressures
High nutrient input
Indices Methods Parameters/Values/EAR Index category
Chlorophyll a Low
Epiphytes -
Macroalgae -
Dissolved oxygen Low
Submerged aquatic -
vegetation
Nuisance and toxic 0
blooms
Dilution potential Low
Flushing potential High
SSM
FIGURE 36. SUMMARY OF THE NEEA INDEX RESULTS OBTAINED FOR THE LIMA ESTUARY. SLE: SYMPTOM LEVEL EXPRESSION; EAR:
ESTUARY AGGREGATION RULES; PSM: PRIMARY SYMPTOMS METHOD; SSM: SECONDARY SYMPTOMS METHOD.

IDENTIFICATION OF SENSITIVE AREAS AND VULNERABLE ZONES IN TRANSITIONAL AND COASTAL PORTUGUESE SYSTEMS
Lim
a E
st
ua
ry
3 9
CONCLUSIONS
The following conclusions can be drawn from
the NEEA index application to the Lima estuary:
• The available values for chlorophyll a and
dissolved oxygen indicate no problems with
eutrophication in the system;
• The OEC index value could not be assessed
due to spatial and temporal data limitations
as well as lack on information for the other
primary and secondary symptoms (macroalgae,
epiphytes, submerged aquatic vegetation);
• Although no problems with eutrophication
were detected and the estuary is considered
to have the capacity to flush nutrients, the
inputs to the system are considered “High”
and the OHI index classifies the estuary in
the “Moderate High” category;
• The future nutrient pressure (DFO) are
expected to remain unchanged;
• The OEC symptoms, together with the Overall
Human Influence, show a clear need for a
comprehensive survey programme in the
Lima estuary. This Surveillance Monitoring
should take into account the characterization
of water quality, and the identification of the
key processes involving the main biotic
compartments related to eutrophication:
phytoplankton, macroalgae and submerged
aquatic vegetation. A monitoring exercise of
this nature, carried out at an appropriate
temporal and spatial scale, will allow a full
application of NEEA and an appropriate
classification under the UWWTD as regards
eutrophication and Nitrates Directive.
KEY REFERENCES
References for grey literature consulted
for this chapter may be found at
http://www.imar.pt/perfect/

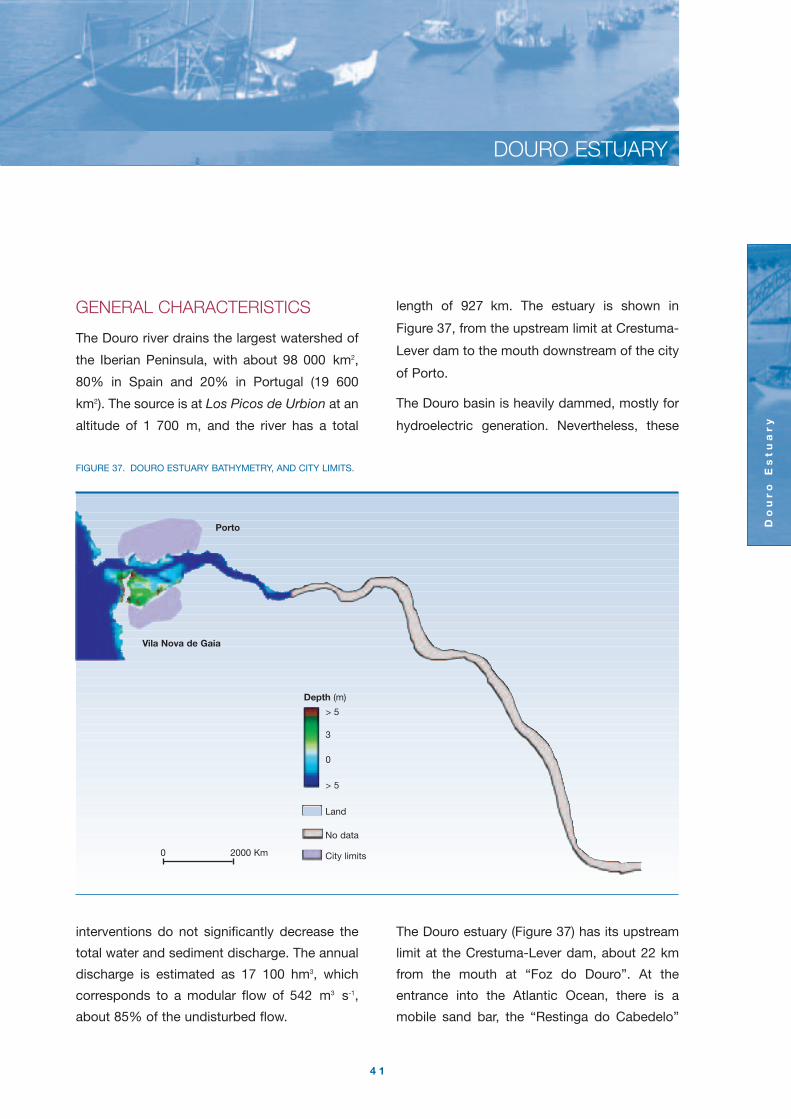
DOURO ESTUARY
Do
ur
o E
st
ua
ry
4 1
GENERAL CHARACTERISTICS
The Douro river drains the largest watershed of
the Iberian Peninsula, with about 98 000 km2,
80% in Spain and 20% in Portugal (19 600
km2). The source is at Los Picos de Urbion at an
altitude of 1 700 m, and the river has a total
length of 927 km. The estuary is shown in
Figure 37, from the upstream limit at Crestuma-
Lever dam to the mouth downstream of the city
of Porto.
The Douro basin is heavily dammed, mostly for
hydroelectric generation. Nevertheless, these
FIGURE 37. DOURO ESTUARY BATHYMETRY, AND CITY LIMITS.
0 2000 Km
No data
Land
City limits
Depth (m)
> 5
3
0
> 5
Porto
Vila Nova de Gaia
interventions do not significantly decrease the
total water and sediment discharge. The annual
discharge is estimated as 17 100 hm3, which
corresponds to a modular flow of 542 m3 s-1,
about 85% of the undisturbed flow.
The Douro estuary (Figure 37) has its upstream
limit at the Crestuma-Lever dam, about 22 km
from the mouth at “Foz do Douro”. At the
entrance into the Atlantic Ocean, there is a
mobile sand bar, the “Restinga do Cabedelo”

INAG - INSTITUTO DA ÁGUA • IMAR - INSTITUTE OF MARINE RESEARCH
Do
ur
o E
st
ua
ry
4 2
and the estuary develops upstream within a
narrow valley with rocky shores.
The estuary is generally divided into three
zones:
• Lower estuary, from the mouth until Arrábida
Bridge;
• Mid estuary, until Freixo Bridge;
• Higher estuary, until the Crestuma-Lever
Dam.
The main characteristics of the Douro estuary
are summarised in Figure 38. The estuary
exhibits vertical salinity gradients, due to the
important river discharge and due to its
physiography.
There are no significant intertidal areas. The
small salt marshes of S. Paio, Lordelo,
Massarelos, Areinho and Avintes are reported
as degraded and are the only remaining
wetlands.
FIGURE 38. MAIN CHARACTERISTICS OF THE DOURO ESTUARY.
Parameter Value
Volume 58.8 x 10⁶ m3
Total Area 9.8 x 10⁶ m2
River flow 542 m3 s-1
Tidal Range (max) 3.8 m
Tidal Prism 20.9 x 10⁶ m3
Population 755 000
1 day (winter flow)
9 days (summer flow)Mean residence time
HOMOGENEOUS AREAS
Published results on salinity are very limited,
with most sources providing only statistical
data. The longitudinal profile presented in
Figure 39 was made with raw data covering
Distance to the mouth (km)
Sal
init
y
0
5
10
15
20
25
30
35
5 10 15 20
FIGURE 39. LONGITUDINAL PROFILE OF SALINITY AT THE DOURO ESTUARY
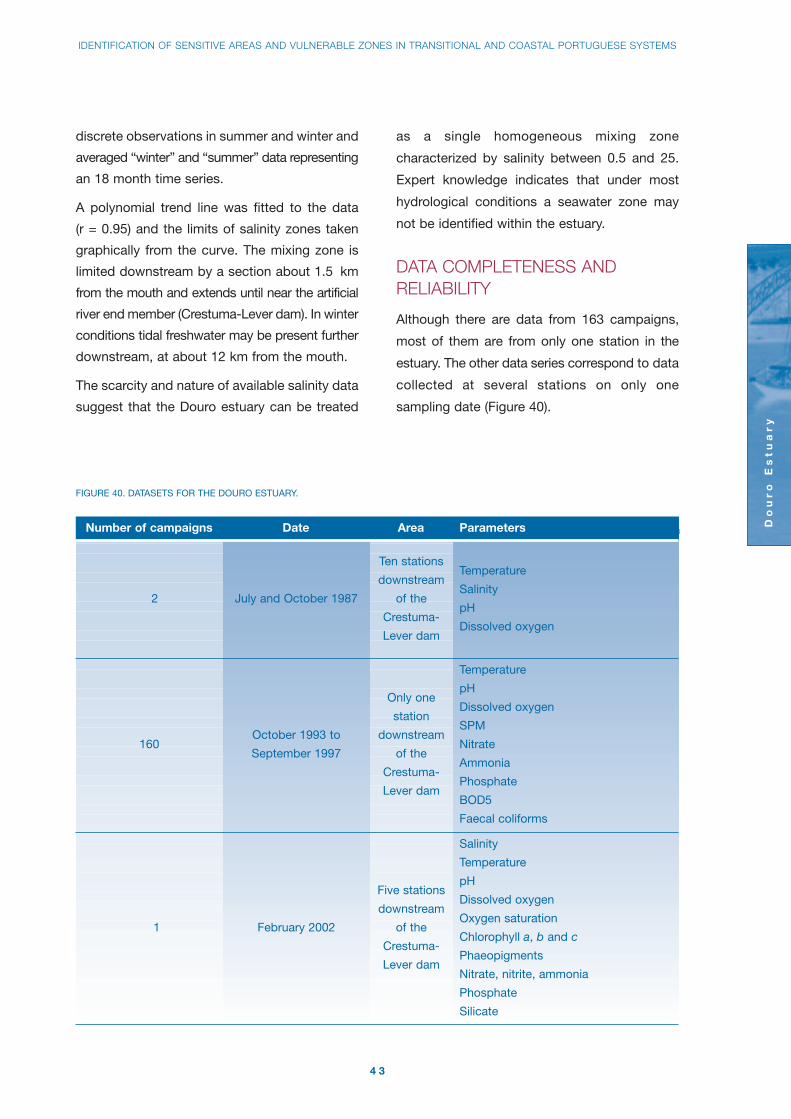
IDENTIFICATION OF SENSITIVE AREAS AND VULNERABLE ZONES IN TRANSITIONAL AND COASTAL PORTUGUESE SYSTEMS
Do
ur
o E
st
ua
ry
4 3
discrete observations in summer and winter and
averaged “winter” and “summer” data representing
an 18 month time series.
A polynomial trend line was fitted to the data
(r = 0.95) and the limits of salinity zones taken
graphically from the curve. The mixing zone is
limited downstream by a section about 1.5 km
from the mouth and extends until near the artificial
river end member (Crestuma-Lever dam). In winter
conditions tidal freshwater may be present further
downstream, at about 12 km from the mouth.
The scarcity and nature of available salinity data
suggest that the Douro estuary can be treated
as a single homogeneous mixing zone
characterized by salinity between 0.5 and 25.
Expert knowledge indicates that under most
hydrological conditions a seawater zone may
not be identified within the estuary.
DATA COMPLETENESS ANDRELIABILITY
Although there are data from 163 campaigns,
most of them are from only one station in the
estuary. The other data series correspond to data
collected at several stations on only one
sampling date (Figure 40).
FIGURE 40. DATASETS FOR THE DOURO ESTUARY.
Number of campaigns Date Area Parameters
160
1
July and October 1987
October 1993 to
September 1997
February 2002
Ten stations
downstream
of the
Crestuma-
Lever dam
Only one
station
downstream
of the
Crestuma-
Lever dam
Five stations
downstream
of the
Crestuma-
Lever dam
Temperature
Salinity
pH
Dissolved oxygen
Temperature
pH
Dissolved oxygen
SPM
Nitrate
Ammonia
Phosphate
BOD5
Faecal coliforms
Salinity
Temperature
pH
Dissolved oxygen
Oxygen saturation
Chlorophyll a, b and c
Phaeopigments
Nitrate, nitrite, ammonia
Phosphate
Silicate
2

Do
ur
o E
st
ua
ry
4 4
OVERALL EUTROPHIC CONDITION
Primary symptoms method
Chlorophyll a
Available chlorophyll a data for the Douro
estuary consist in a few discrete values and
graphs with average values per station and
season (winter and summer) for a period of 18
months (October 2000-March 2002) (Figure 41).
These data are unsuitable for determining
median values of chlorophyll a. Nevertheless,
for indicative purposes, the cumulative
frequency of this data set was calculated. The
percentile 90 falls into the “Low” category
(Figure 42), and the maximum value is 5 µg l-1,
although it should be noted that it is an average
value with no associated information on range
or standard deviation.
FIGURE 41. AVAILABLE DATA ON CHLOROPHYLL FOR THE DOURO ESTUARY.
Distance to mouth (km)
0
1
2
3
4
5
6
3 5 7.5 10 13.5 18.5
Winter (average values)
Summer (average values)
Discrete observations
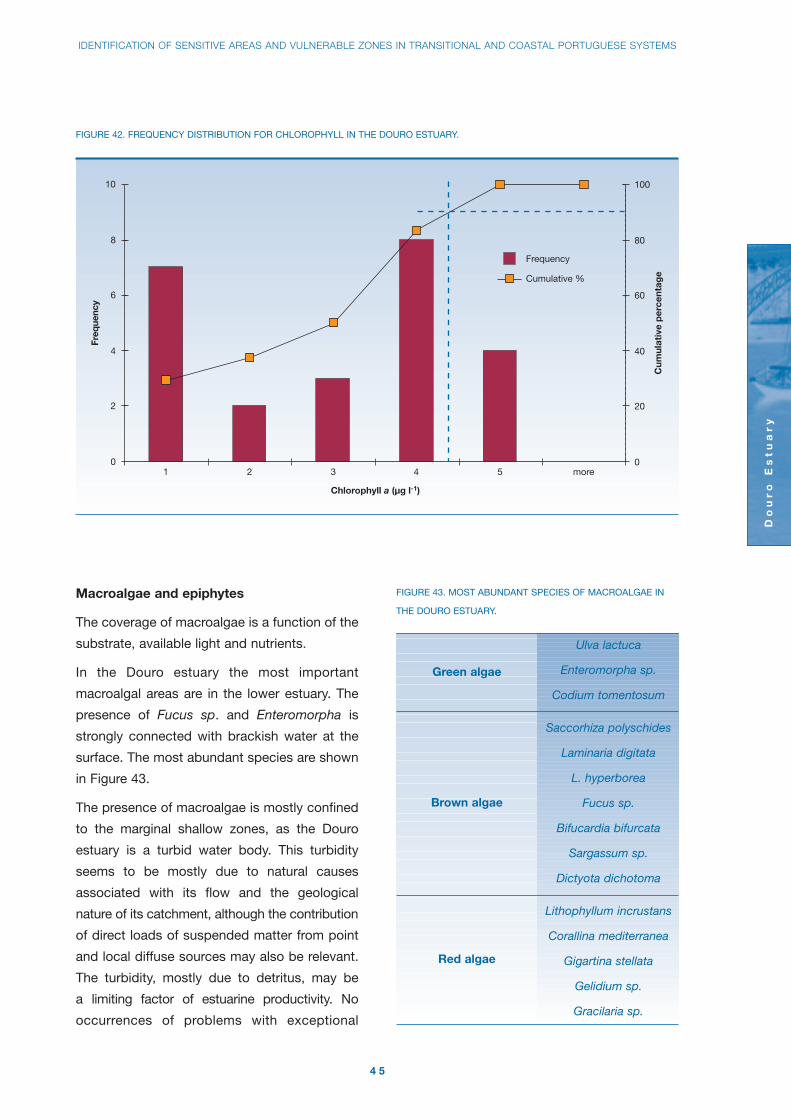
IDENTIFICATION OF SENSITIVE AREAS AND VULNERABLE ZONES IN TRANSITIONAL AND COASTAL PORTUGUESE SYSTEMS
Do
ur
o E
st
ua
ry
4 5
Macroalgae and epiphytes
The coverage of macroalgae is a function of the
substrate, available light and nutrients.
In the Douro estuary the most important
macroalgal areas are in the lower estuary. The
presence of Fucus sp. and Enteromorpha is
strongly connected with brackish water at the
surface. The most abundant species are shown
in Figure 43.
The presence of macroalgae is mostly confined
to the marginal shallow zones, as the Douro
estuary is a turbid water body. This turbidity
seems to be mostly due to natural causes
associated with its flow and the geological
nature of its catchment, although the contribution
of direct loads of suspended matter from point
and local diffuse sources may also be relevant.
The turbidity, mostly due to detritus, may be
a limiting factor of estuarine productivity. No
occurrences of problems with exceptional
FIGURE 42. FREQUENCY DISTRIBUTION FOR CHLOROPHYLL IN THE DOURO ESTUARY.
Freq
uenc
y
Cum
ulat
ive
per
cent
age
0
2
4
6
8
10
1 2 3 4 5 more0
20
40
60
80
100
Frequency
Cumulative %
FIGURE 43. MOST ABUNDANT SPECIES OF MACROALGAE IN
THE DOURO ESTUARY.
Ulva lactuca
Enteromorpha sp.
Codium tomentosum
Saccorhiza polyschides
Laminaria digitata
L. hyperborea
Fucus sp.
Bifucardia bifurcata
Sargassum sp.
Dictyota dichotoma
Lithophyllum incrustans
Corallina mediterranea
Gigartina stellata
Gelidium sp.
Gracilaria sp.
Green algae
Brown algae
Red algae
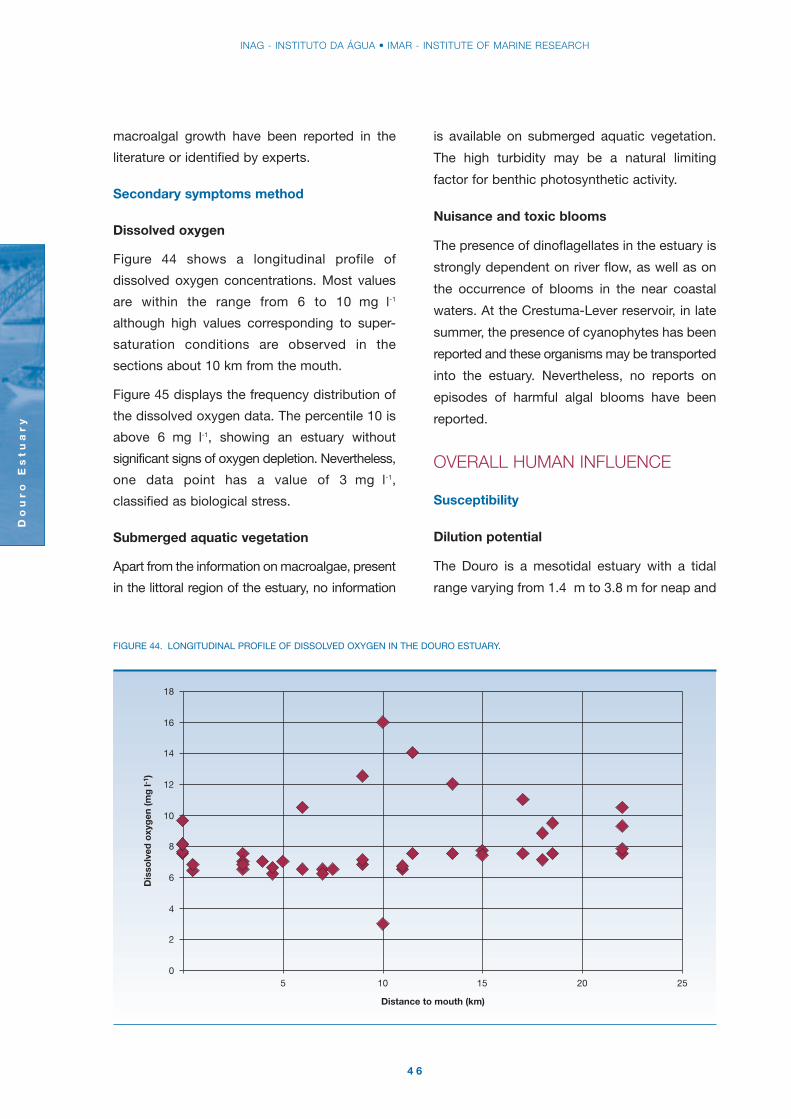
INAG - INSTITUTO DA ÁGUA • IMAR - INSTITUTE OF MARINE RESEARCH
Do
ur
o E
st
ua
ry
4 6
macroalgal growth have been reported in the
literature or identified by experts.
Secondary symptoms method
Dissolved oxygen
Figure 44 shows a longitudinal profile of
dissolved oxygen concentrations. Most values
are within the range from 6 to 10 mg l-1
although high values corresponding to super-
saturation conditions are observed in the
sections about 10 km from the mouth.
Figure 45 displays the frequency distribution of
the dissolved oxygen data. The percentile 10 is
above 6 mg l-1, showing an estuary without
significant signs of oxygen depletion. Nevertheless,
one data point has a value of 3 mg l-1,
classified as biological stress.
Submerged aquatic vegetation
Apart from the information on macroalgae, present
in the littoral region of the estuary, no information
is available on submerged aquatic vegetation.
The high turbidity may be a natural limiting
factor for benthic photosynthetic activity.
Nuisance and toxic blooms
The presence of dinoflagellates in the estuary is
strongly dependent on river flow, as well as on
the occurrence of blooms in the near coastal
waters. At the Crestuma-Lever reservoir, in late
summer, the presence of cyanophytes has been
reported and these organisms may be transported
into the estuary. Nevertheless, no reports on
episodes of harmful algal blooms have been
reported.
OVERALL HUMAN INFLUENCE
Susceptibility
Dilution potential
The Douro is a mesotidal estuary with a tidal
range varying from 1.4 m to 3.8 m for neap and
FIGURE 44. LONGITUDINAL PROFILE OF DISSOLVED OXYGEN IN THE DOURO ESTUARY.
0
2
4
6
8
10
12
14
16
18
5 10 15 20 25
Distance to mouth (km)
Dis
solv
ed o
xyg
en (m
g l-
1 )

IDENTIFICATION OF SENSITIVE AREAS AND VULNERABLE ZONES IN TRANSITIONAL AND COASTAL PORTUGUESE SYSTEMS
Do
ur
o E
st
ua
ry
4 7
spring tides. The average tidal range is about
2.2 m. The river flow is highly variable so a
stratification analysis must consider these two
variables.
The estuary number is above 0.25 (Figure 46) in
all situations and above 1.00 for flows greater
than 850 m3 s-1 at equinoctial spring tide. This
agrees with heuristic knowledge that the Douro
estuary is almost permanently stratified.
The dilution volume is calculated with the fresh
water volume (Vtotal x fresh water fraction).
Considering a salinity of 8 (median of values in
Figure 39) the dilution volume is 2.2 x 10⁻⁸.
According to the NEEA criteria, the dilution
potential is “Low”.
Flushing potential
The flushing potential is also a function of the
relative values of the estuarine and river flows.
The ratio of the modular fresh water inflow to
the estuary volume is 0.8 d-1, which classifies
the estuary within the “High” category for the
flushing potential.
FIGURE 45. FREQUENCY DISTRIBUTION FOR DISSOLVED OXYGEN IN THE DOURO ESTUARY.
0
3
6
9
12
15
18
1 3 5 7 9 11 13 15 more
0%
20%
40%
60%
80%
100%
Frequency
Cumulative %
Freq
uenc
y
Dissolved oxygen (mg l-1)

INAG - INSTITUTO DA ÁGUA • IMAR - INSTITUTE OF MARINE RESEARCH
Do
ur
o E
st
ua
ry
4 8
The overall susceptibility of the Douro estuary
may be classified as “Moderate”.
Nutrient inputs
The main source of nutrients in the Portuguese
part of the catchment is domestic wastewater
entering the Douro estuary from different origins:
• Treated and untreated effluents from
populations in the estuary catchment;
• Wastewater from populations in the
catchments of the Douro and Sousa rivers.
The nutrient inputs from wastewater effluents
were calculated based on the population-
equivalents, daily nutrient inputs per capita (10
g N d-1 and 3 g P d-1) and treatment efficiency.
The loads generated in the drainage basins of
the estuary, Douro and Sousa rivers are
presented in Figure 47.
As a result of the populations resident in the
estuary catchment (Porto and Vila Nova de
Gaia) discharging untreated sewage, the
FIGURE 46. VARIATION OF ESTUARY NUMBER WITH FLOW AND TIDAL RANGE.
0
0.5
1
1.5
2
2.5
3
3.5
200 400 600 800 1000
Salt wedge
Stratified
Well mixed
Neap tide Average tide Spring tide Max tide
River flow (m3 s-1)
RT/P
FIGURE 47. ESTIMATED NUTRIENTS IN WASTEWATER FROM
BASINS DRAINING TO THE DOURO ESTUARY.
Nutrients (ton y-1)Total N Total P
River Douro 2440 737
River Sousa 177 562
Douro estuary 2134 631
Basin
FIGURE 48. WASTEWATER SOLUTIONS IN THE DOURO
ESTUARY CATCHMENT.
Inhabitants %
Served by sewage
network and WWTP
Served by sewage
network
Not served 39
16
45
nutrient loads are similar to those from the
much larger basin of the Douro river (Figure 48).
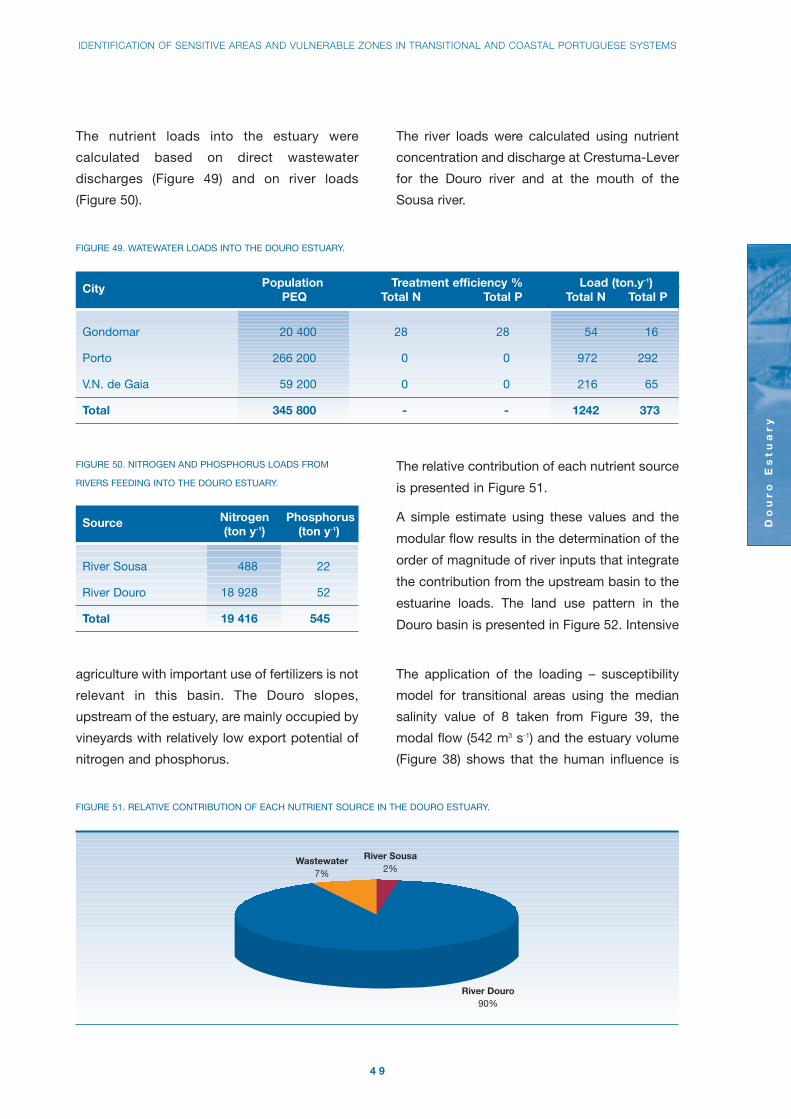
IDENTIFICATION OF SENSITIVE AREAS AND VULNERABLE ZONES IN TRANSITIONAL AND COASTAL PORTUGUESE SYSTEMS
Do
ur
o E
st
ua
ry
4 9
The nutrient loads into the estuary were
calculated based on direct wastewater
discharges (Figure 49) and on river loads
(Figure 50).
The river loads were calculated using nutrient
concentration and discharge at Crestuma-Lever
for the Douro river and at the mouth of the
Sousa river.
FIGURE 51. RELATIVE CONTRIBUTION OF EACH NUTRIENT SOURCE IN THE DOURO ESTUARY.
River Douro90%
River Sousa2%
Wastewater7%
FIGURE 49. WATEWATER LOADS INTO THE DOURO ESTUARY.
Population Treatment efficiency % Load (ton.y-1)PEQ Total N Total P Total N Total P
Gondomar 20 400 28 28 54 16
Porto 266 200 0 0 972 292
V.N. de Gaia 59 200 0 0 216 65
Total 345 800 - - 1242 373
City
FIGURE 50. NITROGEN AND PHOSPHORUS LOADS FROM
RIVERS FEEDING INTO THE DOURO ESTUARY.
Nitrogen Phosphorus(ton y-1) (ton y-1)
River Sousa 488 22
River Douro 18 928 52
Total 19 416 545
Source
The relative contribution of each nutrient source
is presented in Figure 51.
A simple estimate using these values and the
modular flow results in the determination of the
order of magnitude of river inputs that integrate
the contribution from the upstream basin to the
estuarine loads. The land use pattern in the
Douro basin is presented in Figure 52. Intensive
agriculture with important use of fertilizers is not
relevant in this basin. The Douro slopes,
upstream of the estuary, are mainly occupied by
vineyards with relatively low export potential of
nitrogen and phosphorus.
The application of the loading – susceptibility
model for transitional areas using the median
salinity value of 8 taken from Figure 39, the
modal flow (542 m3 s-1) and the estuary volume
(Figure 38) shows that the human influence is

Do
ur
o E
st
ua
ry
5 0
about 98%, which falls into the “High” category.
Combining the moderate susceptibility with the
high nutrient inputs, the overall classification for
the Douro is terms of human influence, is
“Moderate High”.
DETERMINATION OF FUTUREOUTLOOK
It is expected that the loads of nutrients from
urban sources will decrease, as the wastewater
treatment plants of Porto and Gaia, as well as
those in the estuarine catchment, become fully
operational.
SUMMARY OF THE NEEA INDEXAPPLICATION
Figure 53 summarises the results of the
application of the NEEA methodology. It must
be stressed that this exercise was done using a
rather limited dataset and in such circumstances
the conclusions are mostly indicative.
Nevertheless, susceptibility is determined on
Orchards2%
Olivetrees2%
3%
Mixedforest
5%Degraded
forest10%
Artificializedspaces
1%
Conifers7%
Scrub14%
Annual andpermanent crops
10%
Agriculturalland30%
Poor grazingland11%
Vineyards5% Forest
LAND USE (CORINE, 1986)
FIGURE 52. RELATIVE IMPORTANCE OF DIFFERENT LAND USES IN THE DOURO BASIN.

IDENTIFICATION OF SENSITIVE AREAS AND VULNERABLE ZONES IN TRANSITIONAL AND COASTAL PORTUGUESE SYSTEMS
Do
ur
o E
st
ua
ry
5 1
the basis of morphological and hydrographical
data that is accurate enough for this work.
CONCLUSIONS
The following conclusions can be drawn from the
NEEA index application to the Douro estuary:
• There is a clear need for a Surveillance
Monitoring programme to complete its
characterization of water quality under
different hydrographic and hydrological
conditions. This survey should also take into
account the identification of the key
processes involving the main biotic
compartments related to entrophication:
phytoplankton, macroalgae and SAV;
• Although the OEC index value could not be
assessed, the available values for chlorophyll a
and dissolved oxygen indicate no problems
with eutrophication in the system;
• The nutrient input to the system is “High”
and susceptibility (based in the dilution and
flushing potencial) is “Moderate” which
results in an OHI classification of “Moderate
High”;
• The nitrate concentrations are far below the
threshold indicated in the Nitrates Directive
91/676/EEC.
KEY REFERENCES
Abril, G., Nogueira, M., Etcheber, H.,
Cabeçadas, G., Lemaire, E., Brogueira, M. J.,
2002. Behaviour of organic carbon in nine
contrasting European estuaries. Estuarine,
Coastal and Shelf Science, 54, 241–262.
Overall
Human
Influence
(OHI)
Future
Outlook for
future
conditions
(DFO)
-
Moderate
High
PSM
Susceptibility
Nutrient inputs
Future nutrient
pressures
Overall
Eutrophic
Condition
(OEC)
-
-
Moderate
susceptibility
Improve LowReduction in future nutrient pressures
High nutrient input
Indices Methods Parameters/Values/EAR Index category
Chlorophyll a Low
Epiphytes 0
Macroalgae 0
Dissolved oxygen Low
Submerged aquatic -
vegetation
Nuisance and toxic 0
blooms
Dilution potential Low
Flushing potential High
SSM
FIGURE 53. SUMMARY OF THE NEEA INDEX APPLICATION TO THE DOURO ESTUARY. SLE: SYMPTOM LEVEL EXPRESSION; EAR:
ESTUARY AGGREGATION RULES; PSM: PRIMARY SYMPTOMS METHOD; SSM: SECONDARY SYMPTOMS METHOD.

INAG - INSTITUTO DA ÁGUA • IMAR - INSTITUTE OF MARINE RESEARCH
Do
ur
o E
st
ua
ry
5 2
Leal, M.L.F., Vascencelos, M.T., Sousa-Pinto, I.
& Cabral, J.P.S., 1997. Biomonitoring with
benthic macroalgae and direct assay of heavy
metals in seawater of the Oporto coast
(northwest Portugal). Marine Pollution Bulletin,
34, 1006-1015.
Magalhães, C.M., Bordalo, A.A., Wiebe, W.J.,
2002. Temporal and spatial patterns of intertidal
sediment-water nutrient and oxygen fluxes in
the Douro River estuary, Portugal. Marine
Ecology Progress Series, 233, 55-71.
Mucha, A.P., Vasconcelos, M.T.S.D., Bordalo,
A.A., 2003. Macrobenthic community in the
Douro estuary: relations with trace metals and
natural sediment characteristics. Environmental
Pollution, 121(2), 169-180.
Viera, M.E.C., Bordalo, A.A., 2000. The Douro
estuary (Portugal): a mesotidal salt wedge.
Oceanologica Acta, 23, 585-594.
References for grey literature consulted
for this chapter may be found at
http://www.imar.pt/perfect/

RIA DE AVEIRO
Ria
de
Av
eir
o
5 3
GENERAL CHARACTERISTICS
The Ria de Aveiro is a shallow lagoon system
with several prolonged channels. It is separated
from the Atlantic Ocean by a sand spit with an
length of 45 km. About 76% of the system
volume is exchanged over each tidal cycle,
through an artificially fixed inlet.
In terms of hydraulic properties the Ria de
Aveiro can be separated into five channels
(Figure 54): the main channel (river Vouga), the
Ovar channel, the Espinheiro channel, the Ílhavo
channel and the Mira channel. There are several
rivers or streams discharging into the channels,
the main being the river Vouga, which
discharges into the Espinheiro channel.
Freshwater discharges to the system are
seasonal and range from 4.3 m s-1 during
summer to an extreme value of 820 m3 s-1 in the
winter. The freshwater inflow causes a
FIGURE 54. RIA DE AVEIRO: BATHYMETRY, CHANNELS AND SAMPLING STATIONS.
0 4000 m
Land
City limits
Mixing zone limits
Main channels
Sampling stations
Mira channel
Ovar channel
Espinheiro channel
Main channel
Ílhavo channel
Depth (m)
- 3
0
> 5
Aveiro
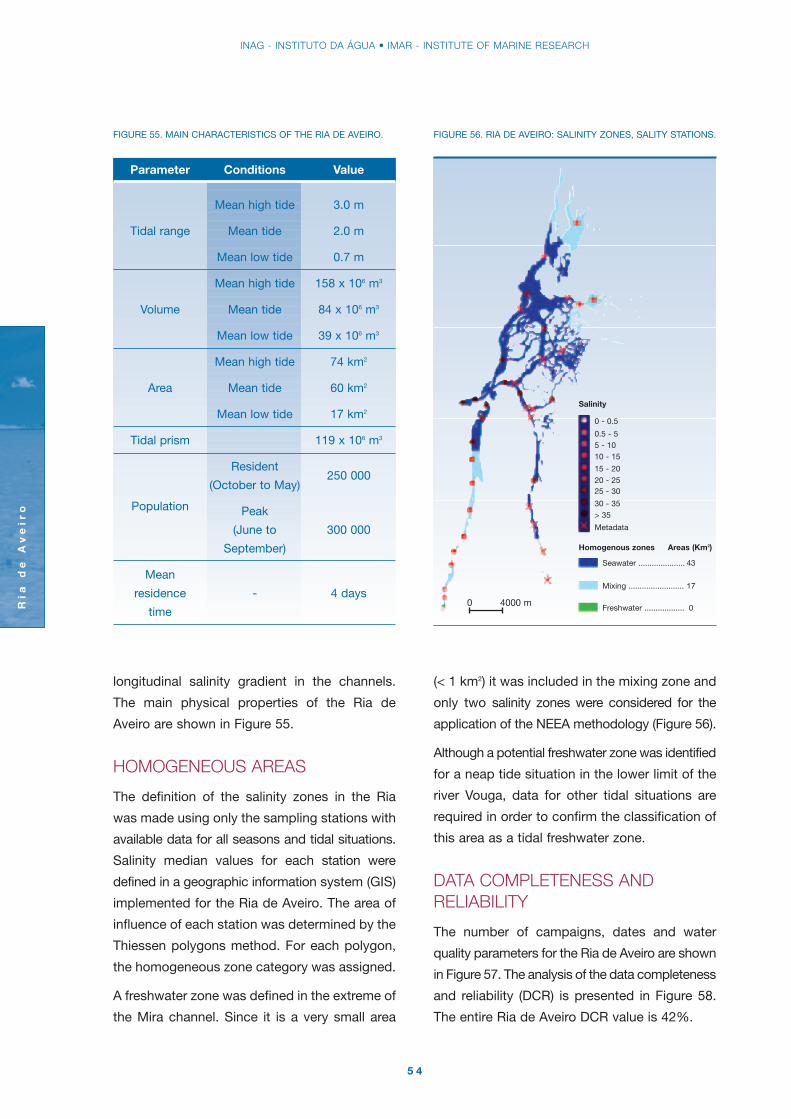
INAG - INSTITUTO DA ÁGUA • IMAR - INSTITUTE OF MARINE RESEARCH
Ria
de
Av
eir
o
5 4
Parameter Conditions Value
Mean high tide 3.0 m
Tidal range Mean tide 2.0 m
Mean low tide 0.7 m
Mean high tide 158 x 106 m3
Volume Mean tide 84 x 106 m3
Mean low tide 39 x 106 m3
Mean high tide 74 km2
Area Mean tide 60 km2
Mean low tide 17 km2
Tidal prism 119 x 106 m3
Resident
(October to May)
Peak
(June to 300 000
September)
Mean
residence - 4 days
time
FIGURE 55. MAIN CHARACTERISTICS OF THE RIA DE AVEIRO.
Population
250 000
longitudinal salinity gradient in the channels.
The main physical properties of the Ria de
Aveiro are shown in Figure 55.
HOMOGENEOUS AREAS
The definition of the salinity zones in the Ria
was made using only the sampling stations with
available data for all seasons and tidal situations.
Salinity median values for each station were
defined in a geographic information system (GIS)
implemented for the Ria de Aveiro. The area of
influence of each station was determined by the
Thiessen polygons method. For each polygon,
the homogeneous zone category was assigned.
A freshwater zone was defined in the extreme of
the Mira channel. Since it is a very small area
(< 1 km2) it was included in the mixing zone and
only two salinity zones were considered for the
application of the NEEA methodology (Figure 56).
Although a potential freshwater zone was identified
for a neap tide situation in the lower limit of the
river Vouga, data for other tidal situations are
required in order to confirm the classification of
this area as a tidal freshwater zone.
DATA COMPLETENESS ANDRELIABILITY
The number of campaigns, dates and water
quality parameters for the Ria de Aveiro are shown
in Figure 57. The analysis of the data completeness
and reliability (DCR) is presented in Figure 58.
The entire Ria de Aveiro DCR value is 42%.
FIGURE 56. RIA DE AVEIRO: SALINITY ZONES, SALITY STATIONS.
0 4000 m
Salinity
Homogenous zones Areas (Km2)
0 - 0.5
0.5 - 55 - 1010 - 15
15 - 2020 - 2525 - 30
30 - 35> 35
Metadata
Seawater ..................... 43
Mixing ......................... 17
Freshwater .................. 0
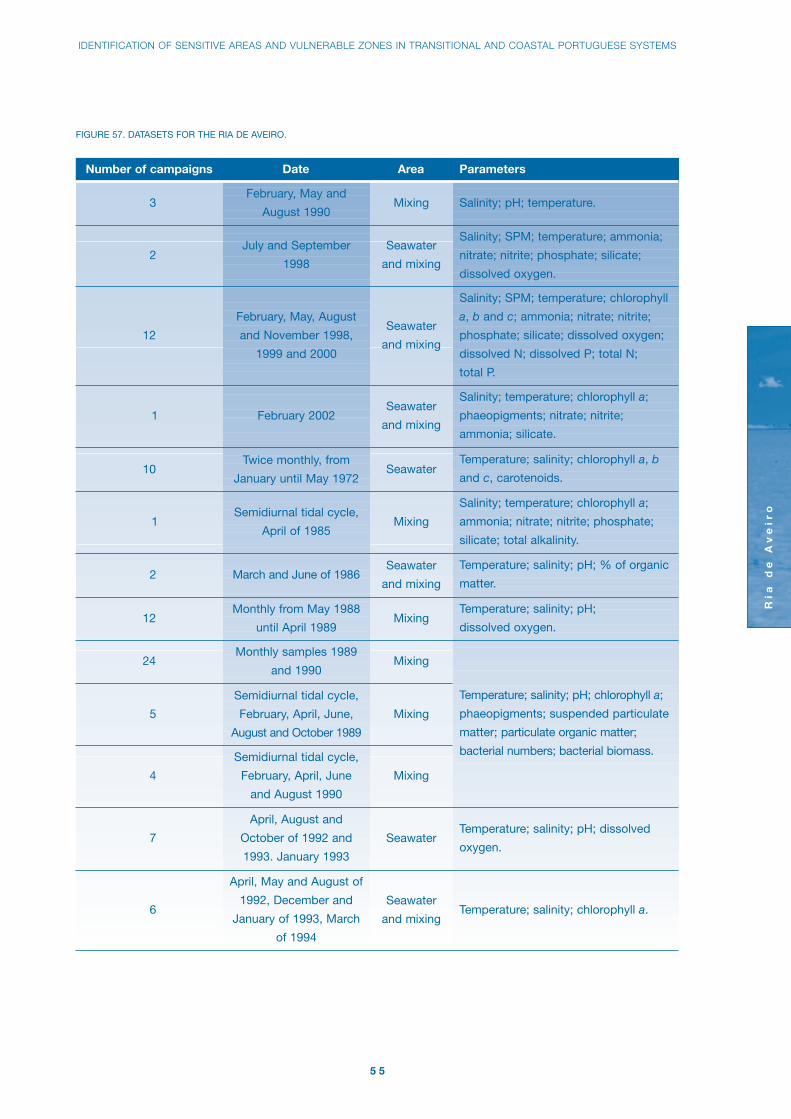
FIGURE 57. DATASETS FOR THE RIA DE AVEIRO.
Number of campaigns Date Area Parameters
2
12
1
February, May and
August 1990
July and September
1998
February, May, August
and November 1998,
1999 and 2000
February 2002
Mixing
Seawater
and mixing
Seawater
and mixing
Seawater
and mixing
Salinity; pH; temperature.
Salinity; SPM; temperature; ammonia;
nitrate; nitrite; phosphate; silicate;
dissolved oxygen.
Salinity; SPM; temperature; chlorophyll
a, b and c; ammonia; nitrate; nitrite;
phosphate; silicate; dissolved oxygen;
dissolved N; dissolved P; total N;
total P.
Salinity; temperature; chlorophyll a;
phaeopigments; nitrate; nitrite;
ammonia; silicate.
1Semidiurnal tidal cycle,
April of 1985Mixing
Salinity; temperature; chlorophyll a;
ammonia; nitrate; nitrite; phosphate;
silicate; total alkalinity.
2 March and June of 1986Seawater
and mixing
Temperature; salinity; pH; % of organic
matter.
10Twice monthly, from
January until May 1972Seawater
Temperature; salinity; chlorophyll a, b
and c, carotenoids.
12Monthly from May 1988
until April 1989Mixing
Temperature; salinity; pH;
dissolved oxygen.
24Monthly samples 1989
and 1990Mixing
Temperature; salinity; pH; chlorophyll a;
phaeopigments; suspended particulate
matter; particulate organic matter;
bacterial numbers; bacterial biomass.
7
April, August and
October of 1992 and
1993. January 1993
SeawaterTemperature; salinity; pH; dissolved
oxygen.
6
April, May and August of
1992, December and
January of 1993, March
of 1994
Seawater
and mixingTemperature; salinity; chlorophyll a.
5
Semidiurnal tidal cycle,
February, April, June,
August and October 1989
Mixing
4
Semidiurnal tidal cycle,
February, April, June
and August 1990
Mixing
3
IDENTIFICATION OF SENSITIVE AREAS AND VULNERABLE ZONES IN TRANSITIONAL AND COASTAL PORTUGUESE SYSTEMS
Ria
de
Av
eir
o
5 5
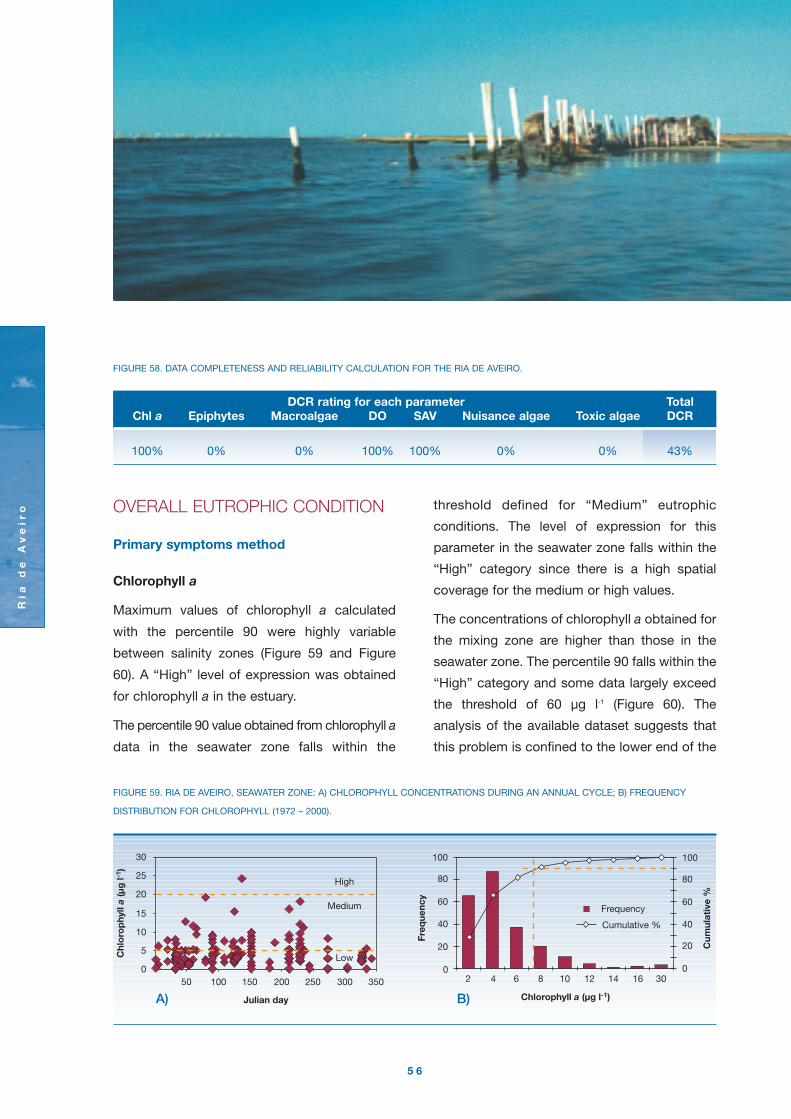
Ria
de
Av
eir
o
5 6
OVERALL EUTROPHIC CONDITION
Primary symptoms method
Chlorophyll a
Maximum values of chlorophyll a calculated
with the percentile 90 were highly variable
between salinity zones (Figure 59 and Figure
60). A “High” level of expression was obtained
for chlorophyll a in the estuary.
The percentile 90 value obtained from chlorophyll a
data in the seawater zone falls within the
threshold defined for “Medium” eutrophic
conditions. The level of expression for this
parameter in the seawater zone falls within the
“High” category since there is a high spatial
coverage for the medium or high values.
The concentrations of chlorophyll a obtained for
the mixing zone are higher than those in the
seawater zone. The percentile 90 falls within the
“High” category and some data largely exceed
the threshold of 60 µg l-1 (Figure 60). The
analysis of the available dataset suggests that
this problem is confined to the lower end of the
FIGURE 58. DATA COMPLETENESS AND RELIABILITY CALCULATION FOR THE RIA DE AVEIRO.
DCR rating for each parameter TotalChl a Epiphytes Macroalgae DO SAV Nuisance algae Toxic algae DCR
100% 0% 0% 100% 100% 0% 0% 43%
B)
0
20
40
60
80
100
2 4 6 8 10 12 14 16 300
20
40
60
80
100
Cumulative %
Frequency
Cum
ulat
ive
%
Freq
uenc
y
A)
0
5
10
15
20
25
30
50 100 150 200 250 300 350
Low
Medium
High
Julian day
FIGURE 59. RIA DE AVEIRO, SEAWATER ZONE: A) CHLOROPHYLL CONCENTRATIONS DURING AN ANNUAL CYCLE; B) FREQUENCY
DISTRIBUTION FOR CHLOROPHYLL (1972 – 2000).

IDENTIFICATION OF SENSITIVE AREAS AND VULNERABLE ZONES IN TRANSITIONAL AND COASTAL PORTUGUESE SYSTEMS
Ria
de
Av
eir
o
5 7
0
20
40
60
80
5 10 15 20 25 30 35 40 45 50 55 60 4450
20
40
60
80
100
Cumulative %
Frequency
Cum
ulat
ive
%
Freq
uenc
y
B)
050
100150200250300350400450
50 100 150 200 250 300 350
Hypereutrophic
High
Julian dayA)
FIGURE 60. RIA DE AVEIRO, MIXING ZONE: A) CHLOROPHYLL CONCENTRATIONS DURING AN ANNUAL CYCLE; B) FREQUENCY
DISTRIBUTION FOR CHLOROPHYLL A (1988 – 2000).
FIGURE 61. RIA DE AVEIRO, MIXING ZONE: CHLOROPHYLL
CONCENTRATIONS DURING AN ANNUAL CYCLE.
0
5
10
15
20
25
30
35
40
50 100 150 200 250 300 350
Medium
Low
High
Julian day
- without the lower end of Mira channel data -
Mixing zone
Mira channel (Figure 61). This is emphasized by
the chlorophyll a percentile 90 value (17 µg l-1)
for the mixing zone excluding the lower Mira
channel data, which falls within the “Medium”
category.
The spatial coverage was determined by
calculating the percentage of affected cells
within each zone (Figure 62). A station is
considered affected if it has concentrations
above the lower limit of the category that was
determined with the chlorophyll a data
percentile 90 values for all the stations in its
salinity zone.
FIGURE 62. SPATIAL COVERAGE OF SAMPLING STATIONS.
Seawater zone
Mixing zone
Sampling stations
Sampling stations affected

INAG - INSTITUTO DA ÁGUA • IMAR - INSTITUTE OF MARINE RESEARCH
Ria
de
Av
eir
o
5 85 8
Figure 63 summarises the results of the NEEA
index application for chlorophyll a.
Epiphytes
In the Ria de Aveiro submerged aquatic vegetation
and macroalgae (locally named moliço) were
important economic resources at least since
1880 as a natural fertiliser. This activity began to
decline in the 1960’s and 1970’s, with crops of
3 000 ton (wet weight) in 1979 compared with
FIGURE 63. RESULTS OF THE NEEA INDEX APPLICATION FOR THE CHLOROPHYLL IN THE RIA DE AVEIRO. SLE MEANS SYMPTOM LEVEL
OF EXPRESSION.
IF AND AND THENZONE Concentration Spatial coverage Frequency Expression Value Area SLE
Seawater Medium High Periodic High 1 43 0.72
Mixing High High Periodic High 1 17 0.28
Total 60 1
Flag A: Not enough data were available. In this case, assumptions were made based on conservative estimates
that unknown spatial coverage is at least 10% of a zone.
FIGURE 64. SPECIES COMPOSITION OF MOLIÇO IN 1936 SORTED BY ABUNDANCE (1 – HIGHER, 8 – LOWER) AND IN 1979/81 WITH
BIOMASS FOR HOMOGENOUS ZONES.
1936Order Species Group
1 Zostera nana Submerged aquatic vegetation
2 Potamogeton pectinatus Submerged aquatic vegetation
3 Ruppia spiralis Submerged aquatic vegetation
4 Ruppia rostellata Submerged aquatic vegetation
5 Zostera marina Submerged aquatic vegetation
6 Chara flexilis, Chara aspera Seaweeds
7 Myriophyllum spicatum Seaweeds
8 B. siphonacea, Ulva, Enteromorpha Seaweeds
1979/81Biomass (ton dw)
Order Species Seawater zone Mixing zone
1 Potamogeton pectinatus SAV 627 53
2 Ruppia cirrhosa SAV 263 357
3 Zostera noltii SAV 0 285
4 Gracillaria verrucosa Seaweeds 130 206
5 Chlorophyceae Seaweeds 188 93

IDENTIFICATION OF SENSITIVE AREAS AND VULNERABLE ZONES IN TRANSITIONAL AND COASTAL PORTUGUESE SYSTEMS
Ria
de
Av
eir
o
5 9
FIGURE 65. PERCENTAGE OF BIOMASS OF MOLIÇO SPECIES IN 1979/81 BY HOMOGENOUS ZONE. MACROALGAE IN BOLD.
Channel distribution Ovar channel (tip) Ovar channel (middle #1) Ovar channel (middle #2)Homogenous zone Mixing Seawater Seawater
Potamogeton pectinatus 52% 10% 1%
Ruppia cirrhosa 22% 62% 13%
Zostera noltii 0% 1% 53%
Gracillaria verrucosa 16% 17% 3%
Chlorophyceae 11% 10% 30%
crops of about 400 000 ton (wet weight) in 1883
and 250 000 ton (wet weight) in 1930. The
decrease of cropped biomass is related to the
economic competitiveness of this type of
fertilizer.
The species composition of moliço in 1936 and
in 1979-81 is presented in Figure 64, sorted by
abundance. For the period of 1979-81 the
biomass data are also available.
The moliço species can occur singly or in
interspecific association. The presence of
epiphytes on submerged aquatic vegetation and
their distribution in the channels is documented
in several studies in 1936, 1970’s and 1979-81.
Epiphytes are dominated by filamentous green
macroalgae. In the study period there was a
reduction in spatial coverage: in 1936 association
of moliço species were observed in four
channels (Ovar, Mira, Ílhavo and Main channels),
this spatial distribution was limited to the Ovar
channel in 1979-81.
Combining the information given in Figure 64
and Figure 65 an equilibrium between submerged
aquatic vegetation and macroalgae can be
suggested. There are also no indications of
problematic epiphytic growth in the literature,
therefore the level of expression for this primary
symptom is zero.
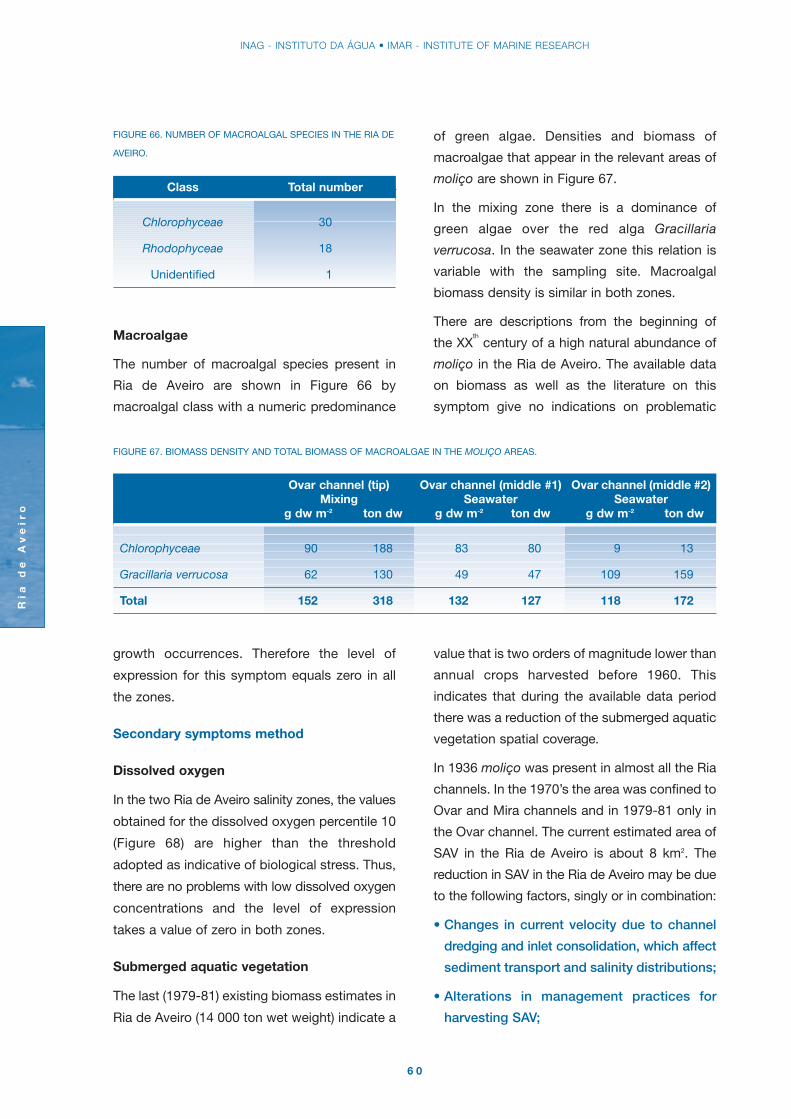
INAG - INSTITUTO DA ÁGUA • IMAR - INSTITUTE OF MARINE RESEARCH
Ria
de
Av
eir
o
6 0
Macroalgae
The number of macroalgal species present in
Ria de Aveiro are shown in Figure 66 by
macroalgal class with a numeric predominance
FIGURE 67. BIOMASS DENSITY AND TOTAL BIOMASS OF MACROALGAE IN THE MOLIÇO AREAS.
Ovar channel (tip) Ovar channel (middle #1) Ovar channel (middle #2)Mixing Seawater Seawater
g dw m-2 ton dw g dw m-2 ton dw g dw m-2 ton dw
Chlorophyceae 90 188 83 80 9 13
Gracillaria verrucosa 62 130 49 47 109 159
Total 152 318 132 127 118 172
FIGURE 66. NUMBER OF MACROALGAL SPECIES IN THE RIA DE
AVEIRO.
Class Total number
Chlorophyceae 30
Rhodophyceae 18
Unidentified 1
of green algae. Densities and biomass of
macroalgae that appear in the relevant areas of
moliço are shown in Figure 67.
In the mixing zone there is a dominance of
green algae over the red alga Gracillaria
verrucosa. In the seawater zone this relation is
variable with the sampling site. Macroalgal
biomass density is similar in both zones.
There are descriptions from the beginning of
the XXth
century of a high natural abundance of
moliço in the Ria de Aveiro. The available data
on biomass as well as the literature on this
symptom give no indications on problematic
growth occurrences. Therefore the level of
expression for this symptom equals zero in all
the zones.
Secondary symptoms method
Dissolved oxygen
In the two Ria de Aveiro salinity zones, the values
obtained for the dissolved oxygen percentile 10
(Figure 68) are higher than the threshold
adopted as indicative of biological stress. Thus,
there are no problems with low dissolved oxygen
concentrations and the level of expression
takes a value of zero in both zones.
Submerged aquatic vegetation
The last (1979-81) existing biomass estimates in
Ria de Aveiro (14 000 ton wet weight) indicate a
value that is two orders of magnitude lower than
annual crops harvested before 1960. This
indicates that during the available data period
there was a reduction of the submerged aquatic
vegetation spatial coverage.
In 1936 moliço was present in almost all the Ria
channels. In the 1970’s the area was confined to
Ovar and Mira channels and in 1979-81 only in
the Ovar channel. The current estimated area of
SAV in the Ria de Aveiro is about 8 km2. The
reduction in SAV in the Ria de Aveiro may be due
to the following factors, singly or in combination:
• Changes in current velocity due to channel
dredging and inlet consolidation, which affect
sediment transport and salinity distributions;
• Alterations in management practices for
harvesting SAV;
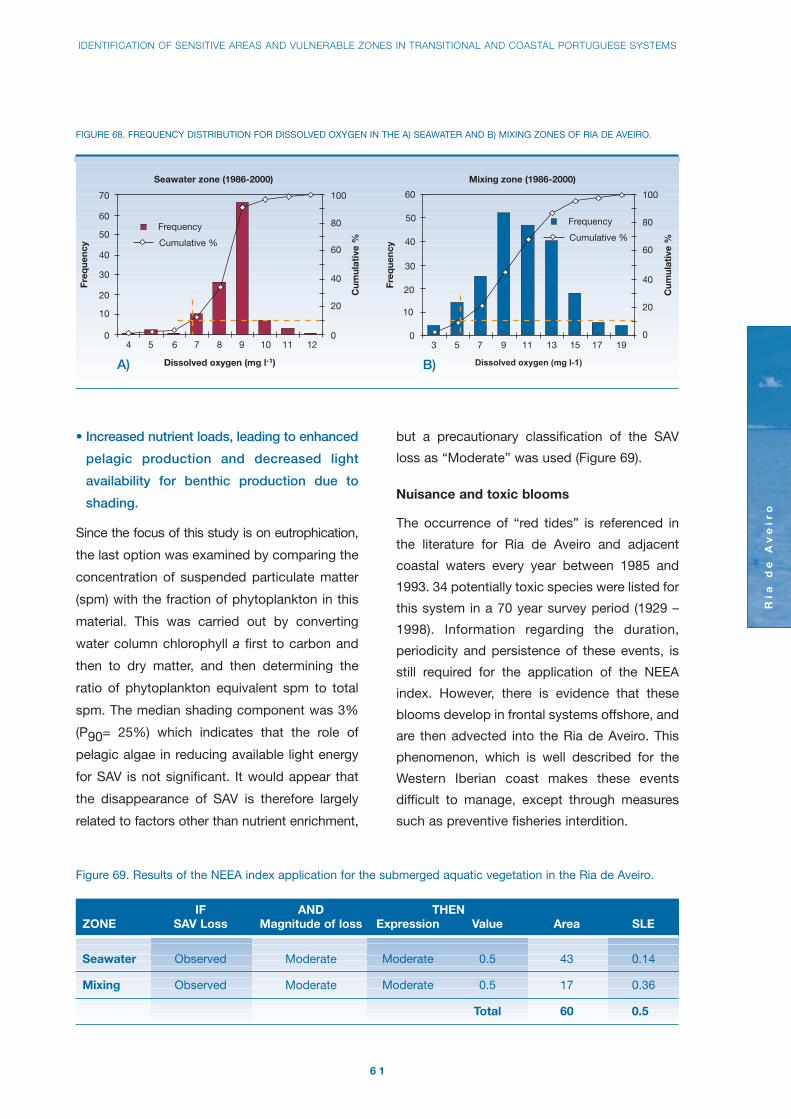
IDENTIFICATION OF SENSITIVE AREAS AND VULNERABLE ZONES IN TRANSITIONAL AND COASTAL PORTUGUESE SYSTEMS
Ria
de
Av
eir
o
6 1
• Increased nutrient loads, leading to enhanced
pelagic production and decreased light
availability for benthic production due to
shading.
Since the focus of this study is on eutrophication,
the last option was examined by comparing the
concentration of suspended particulate matter
(spm) with the fraction of phytoplankton in this
material. This was carried out by converting
water column chlorophyll a first to carbon and
then to dry matter, and then determining the
ratio of phytoplankton equivalent spm to total
spm. The median shading component was 3%
(P90= 25%) which indicates that the role of
pelagic algae in reducing available light energy
for SAV is not significant. It would appear that
the disappearance of SAV is therefore largely
related to factors other than nutrient enrichment,
but a precautionary classification of the SAV
loss as “Moderate” was used (Figure 69).
Nuisance and toxic blooms
The occurrence of “red tides” is referenced in
the literature for Ria de Aveiro and adjacent
coastal waters every year between 1985 and
1993. 34 potentially toxic species were listed for
this system in a 70 year survey period (1929 –
1998). Information regarding the duration,
periodicity and persistence of these events, is
still required for the application of the NEEA
index. However, there is evidence that these
blooms develop in frontal systems offshore, and
are then advected into the Ria de Aveiro. This
phenomenon, which is well described for the
Western Iberian coast makes these events
difficult to manage, except through measures
such as preventive fisheries interdition.
Mixing zone (1986-2000)
0
10
20
30
40
50
60
3 5 7 9 11 13 15 17 19
Dissolved oxygen (mg l-1)
0
20
40
60
80
100
Cum
ulat
ive
%
Freq
uenc
y
Cumulative %
Frequency
B)
Cumulative %
Frequency
Seawater zone (1986-2000)
0
10
20
30
40
50
60
70
4 5 6 7 8 9 10 11 120
20
40
60
80
100
Cum
ulat
ive
%
Freq
uenc
y
Dissolved oxygen (mg l-1)A)
FIGURE 68. FREQUENCY DISTRIBUTION FOR DISSOLVED OXYGEN IN THE A) SEAWATER AND B) MIXING ZONES OF RIA DE AVEIRO.
Figure 69. Results of the NEEA index application for the submerged aquatic vegetation in the Ria de Aveiro.
IF AND THENZONE SAV Loss Magnitude of loss Expression Value Area SLE
Seawater Observed Moderate Moderate 0.5 43 0.14
Mixing Observed Moderate Moderate 0.5 17 0.36
Total 60 0.5
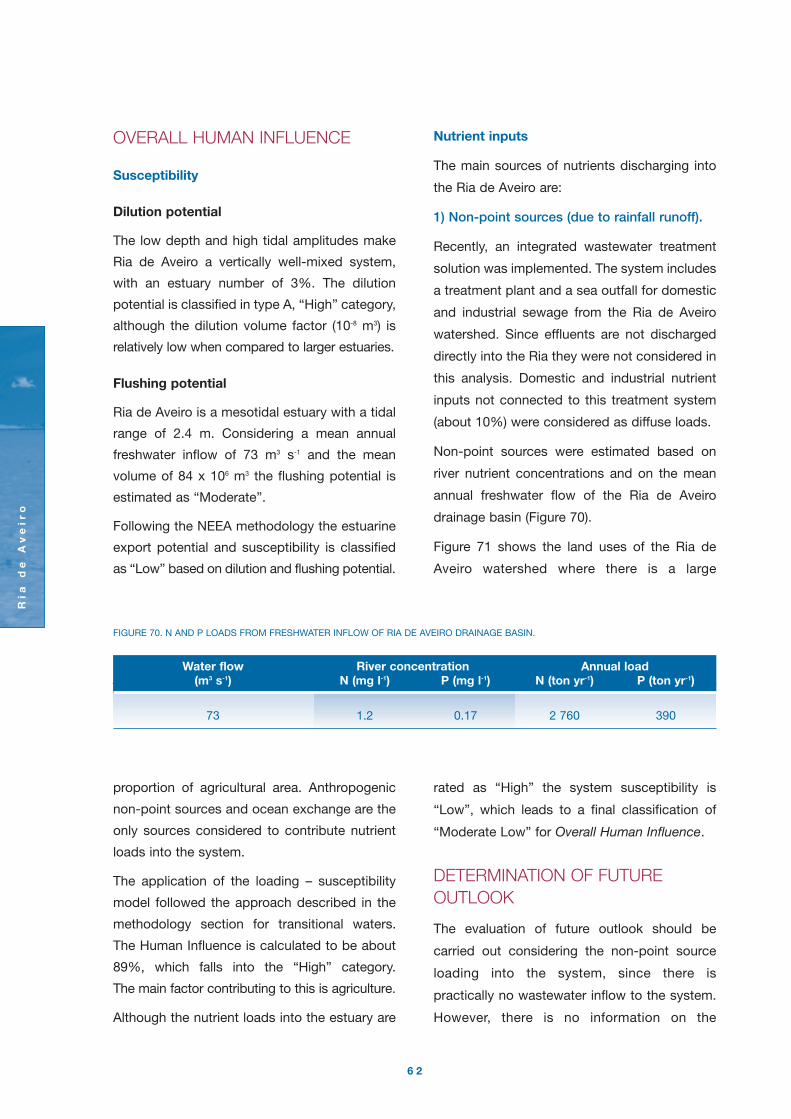
Ria
de
Av
eir
o
6 2
OVERALL HUMAN INFLUENCE
Susceptibility
Dilution potential
The low depth and high tidal amplitudes make
Ria de Aveiro a vertically well-mixed system,
with an estuary number of 3%. The dilution
potential is classified in type A, “High” category,
although the dilution volume factor (10-8 m3) is
relatively low when compared to larger estuaries.
Flushing potential
Ria de Aveiro is a mesotidal estuary with a tidal
range of 2.4 m. Considering a mean annual
freshwater inflow of 73 m3 s-1 and the mean
volume of 84 x 106 m3 the flushing potential is
estimated as “Moderate”.
Following the NEEA methodology the estuarine
export potential and susceptibility is classified
as “Low” based on dilution and flushing potential.
Nutrient inputs
The main sources of nutrients discharging into
the Ria de Aveiro are:
1) Non-point sources (due to rainfall runoff).
Recently, an integrated wastewater treatment
solution was implemented. The system includes
a treatment plant and a sea outfall for domestic
and industrial sewage from the Ria de Aveiro
watershed. Since effluents are not discharged
directly into the Ria they were not considered in
this analysis. Domestic and industrial nutrient
inputs not connected to this treatment system
(about 10%) were considered as diffuse loads.
Non-point sources were estimated based on
river nutrient concentrations and on the mean
annual freshwater flow of the Ria de Aveiro
drainage basin (Figure 70).
Figure 71 shows the land uses of the Ria de
Aveiro watershed where there is a large
proportion of agricultural area. Anthropogenic
non-point sources and ocean exchange are the
only sources considered to contribute nutrient
loads into the system.
The application of the loading – susceptibility
model followed the approach described in the
methodology section for transitional waters.
The Human Influence is calculated to be about
89%, which falls into the “High” category.
The main factor contributing to this is agriculture.
Although the nutrient loads into the estuary are
rated as “High” the system susceptibility is
“Low”, which leads to a final classification of
“Moderate Low” for Overall Human Influence.
DETERMINATION OF FUTUREOUTLOOK
The evaluation of future outlook should be
carried out considering the non-point source
loading into the system, since there is
practically no wastewater inflow to the system.
However, there is no information on the
FIGURE 70. N AND P LOADS FROM FRESHWATER INFLOW OF RIA DE AVEIRO DRAINAGE BASIN.
Water flow River concentration Annual load(m3 s-1) N (mg l-1) P (mg l-1) N (ton yr-1) P (ton yr-1)
73 1.2 0.17 2 760 390

IDENTIFICATION OF SENSITIVE AREAS AND VULNERABLE ZONES IN TRANSITIONAL AND COASTAL PORTUGUESE SYSTEMS
Ria
de
Av
eir
o
6 3
FIGURE 71. SOIL USES IN THE RIA DE AVEIRO HYDROGRAPHIC BASIN.
0 5 10 15 km
Gauss projectionHayford ellipsoid
N
Urban areas
Agriculture: annual cultures
Agriculture: standing cultures
Grassland
Agriculture: diverse cultures
Forest
Shrubby vegetation
Fields with low vegetation
Continental wetlands
Estuarine wetlands
Continental waters
Seawater
evolution of agriculture both as regards culture
practices or area. No change in future nutrient
pressures is assumed.
SUMMARY OF THE NEEA INDEXAPPLICATION
Figure 72 summarizes the results obtained for
the NEEA index application in the Ria de Aveiro.
CONCLUSIONS
The following conclusions can be drawn from
the NEEA index application to the Ria Aveiro:
• Some data gaps were detected concerning
the spatial coverage of chlorophyll a,
macrophyte dynamics including epiphytes
and macroalgae, and the duration and
frequency of nuisance and toxic blooms,
these gaps should be adressed with an
adequate Surveillance Monitoring programme;
• The Ria de Aveiro is a well mixed system
with a “High” flushing potential. The nutrient
inputs to the system are limited to the river
inflow and land runoff. These loads are
evaluated as “High”. The OHI index classifies
the impact of nutrients in the system as
“Moderate Low”, accordingly to the NEEA
classification this means that the symptoms
observed may be natural or that the high
level of nutrient additions may cause
problems despite low susceptibility;
• The OEC classifies the Ria de Aveiro in the
“Moderate” category. This result is mainly
due to:
– the general loss of SAV in the system,
which is not clearly related to nutrient
enrichment. Investigative Monitoring should
be carried out to accurately determine the
causes of SAV loss;

Ria
de
Av
eir
o
6 4
– elevated chlorophyll a concentrations
observed in the lower tip of the Mira
channel (corresponding to an area of 0.3
km2, 0.5 % of the Ria de Aveiro). Since 0.3
available data do not allow a cause-effect
relation to be established, Investigative
Monitoring is required to provide appropriate
scientific insights;
• The nitrate concentrations are far below the
threshold considered in the Nitrates Directive
91/676/EEC;
• The results obtained with the application of
NEEA methodology do not show a direct
relation between human nutrient inputs and
the Ria de Aveiro water quality status.
Furthermore, the indication that nutrient
Overall
Human
Influence
(OHI)
Future
Outlook for
future
conditions
(DFO)
Moderate
Moderate
low
PSM
Susceptibility
Nutrient inputs
Future nutrient
pressures
Overall
Eutrophic
Condition
(OEC)
0.33
Moderate
0.5
Moderate
Low
susceptibility
No changeNo change in future nutrient pressures
High nutrient input
Indices Methods Parameters/Values/EAR Index category
Chlorophyll a 1
Epiphytes 0
Macroalgae 0
Dissolved oxygen 0
Submerged aquatic 0.5
vegetation
Nuisance and toxic -
blooms
Dilution potential High
Flushing potential Moderate
SSM
FIGURE 72. RESULTS OF THE NEEA INDEX APPLICATION TO THE RIA DE AVEIRO. SLE: SYMPTOM LEVEL EXPRESSION; EAR: ESTUARY
AGGREGATION RULES; PSM: PRIMARY SYMPTOMS METHOD; SSM: SECONDARY SYMPTOMS METHOD.
IDENTIFICATION OF SENSITIVE AREAS AND VULNERABLE ZONES IN TRANSITIONAL AND COASTAL PORTUGUESE SYSTEMS
Ria
de
Av
eir
o
6 5
pressures are not expected to increase
(DFO) support the conclusion that neither
the Ria de Aveiro nor parts of the estuary
should be listed as sensitive areas (Directive
91/271/EEC) or vulnerable zones (Directive
91/676/EEC) due to eutrophication concerns.
KEY REFERENCES
Cunha, M. A., Almeida, M. A., Alcântara, F.
1999. Compartments of oxygen consumption in
a tidal mesotrophic estuary. Acta Oecologica,
20(4), 227-235.
Dias, J. M., Lopes, J. F., Dekeyser, I., 2000. Tidal
propagation in Ria de Aveiro lagoon, Portugal.
Physics and chemistry of the earth part
b – hydrology oceans and atmosphere, 25(4),
369-374.
Hoppe, H. G., Gocke, K. & Alcântara, F., 1996.
Shifts between autotrophic and heterotrophic
processes in a tidal lagoon (Ria de Aveiro,
Portugal). Arch. Hydrobiol. Spec. Issues
Advanc. Limnol., Volume XLVIII, 39-52.
Mucha, A.P., Costa, M.H., 1999. Macrozoobenthic
community structure in two Portuguese
estuaries: Relationship with organic enrichment
and nutrient gradients, Acta Oecologica, 20 (4),
363-376.
Silva, J., F., Duck, R. W., 2001. Historical changes
of bottom topography and tidal amplitude in the
Ria de Aveiro, Portugal – trends for future
evolution. Climate research, 18(1-2), 17-24.
References for grey literature consulted
for this chapter may be found at
http://www.imar.pt/perfect/


MONDEGO ESTUARY
Mo
nd
eg
o E
st
ua
ry
6 7
GENERAL CHARACTERISTICS
The Mondego river drains a 6 670 km2 watershed,
and ends in a tidal estuary on the west coast of
Portugal at Figueira da Foz (Figure 73).
The estuary has a surface area of 6.4 km2, and,
about 7 km from the mouth, branches into two
channels (north and south) separated by an
island. Hydrographically, the two channels are
very different: the northern one is deeper (5-10
m during high tide, tidal range 2-3 m), while the
southern one has a maximum depth of 2-4 m
during high tide and is largely silted up in the
upstream areas. The main freshwater discharge
FIGURE 73. MONDEGO ESTUARY: BATHYMETRY, SAMPLING STATIONS AND LIMITS OF THE SAMPLING AREA.
Figueira da Foz
Armazéns channel
#3
#2
#1
River Pranto
Depth (m)
- 5
0
10
20
> 40
No data
Land
Sampling area
City limits
Sampling stations
0 1000 m
from the river therefore flows through the northern
channel, and water circulation in the south channel
is mainly tidally driven, with irregular (small)
fresh water inputs from the Pranto river, which is
regulated by a sluice located 3 km upstream.
The tidal excursion is greater in the northern
channel, which receives the main freshwater
inflow, causing high daily salinity fluctuations.
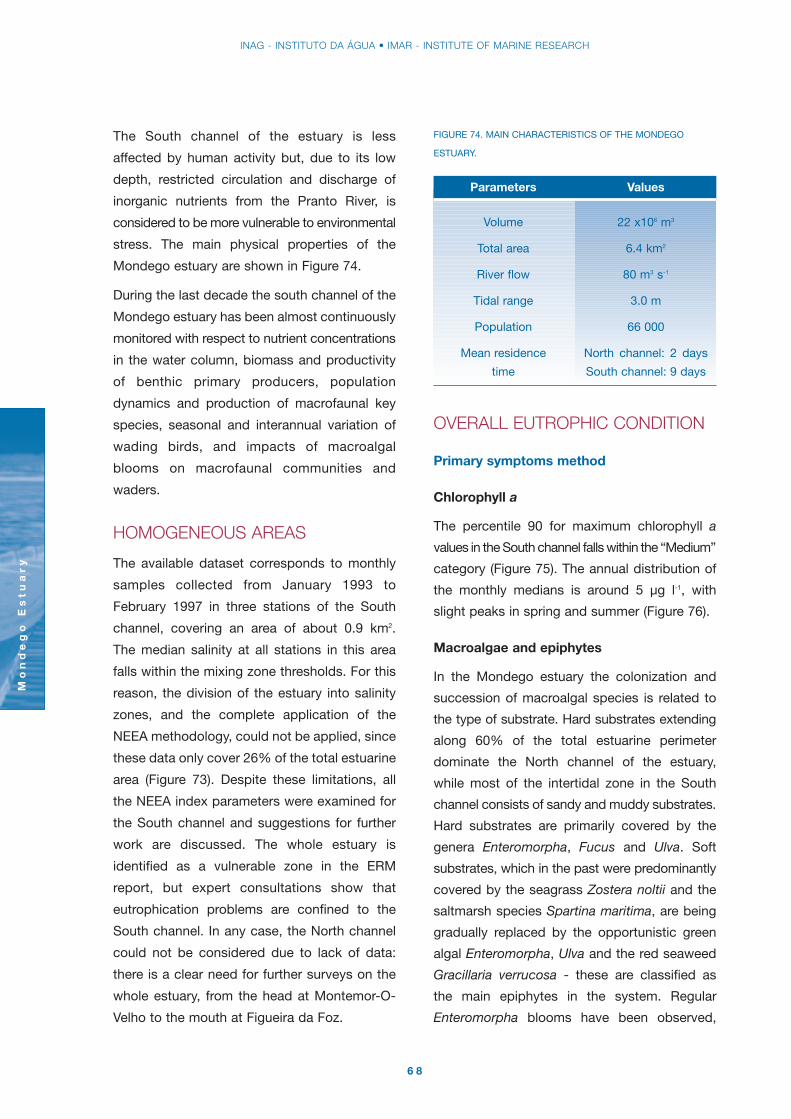
INAG - INSTITUTO DA ÁGUA • IMAR - INSTITUTE OF MARINE RESEARCH
Mo
nd
eg
o E
st
ua
ry
6 8
The South channel of the estuary is less
affected by human activity but, due to its low
depth, restricted circulation and discharge of
inorganic nutrients from the Pranto River, is
considered to be more vulnerable to environmental
stress. The main physical properties of the
Mondego estuary are shown in Figure 74.
During the last decade the south channel of the
Mondego estuary has been almost continuously
monitored with respect to nutrient concentrations
in the water column, biomass and productivity
of benthic primary producers, population
dynamics and production of macrofaunal key
species, seasonal and interannual variation of
wading birds, and impacts of macroalgal
blooms on macrofaunal communities and
waders.
HOMOGENEOUS AREAS
The available dataset corresponds to monthly
samples collected from January 1993 to
February 1997 in three stations of the South
channel, covering an area of about 0.9 km2.
The median salinity at all stations in this area
falls within the mixing zone thresholds. For this
reason, the division of the estuary into salinity
zones, and the complete application of the
NEEA methodology, could not be applied, since
these data only cover 26% of the total estuarine
area (Figure 73). Despite these limitations, all
the NEEA index parameters were examined for
the South channel and suggestions for further
work are discussed. The whole estuary is
identified as a vulnerable zone in the ERM
report, but expert consultations show that
eutrophication problems are confined to the
South channel. In any case, the North channel
could not be considered due to lack of data:
there is a clear need for further surveys on the
whole estuary, from the head at Montemor-O-
Velho to the mouth at Figueira da Foz.
FIGURE 74. MAIN CHARACTERISTICS OF THE MONDEGO
ESTUARY.
OVERALL EUTROPHIC CONDITION
Primary symptoms method
Chlorophyll a
The percentile 90 for maximum chlorophyll a
values in the South channel falls within the “Medium”
category (Figure 75). The annual distribution of
the monthly medians is around 5 µg l-1, with
slight peaks in spring and summer (Figure 76).
Macroalgae and epiphytes
In the Mondego estuary the colonization and
succession of macroalgal species is related to
the type of substrate. Hard substrates extending
along 60% of the total estuarine perimeter
dominate the North channel of the estuary,
while most of the intertidal zone in the South
channel consists of sandy and muddy substrates.
Hard substrates are primarily covered by the
genera Enteromorpha, Fucus and Ulva. Soft
substrates, which in the past were predominantly
covered by the seagrass Zostera noltii and the
saltmarsh species Spartina maritima, are being
gradually replaced by the opportunistic green
algal Enteromorpha, Ulva and the red seaweed
Gracillaria verrucosa - these are classified as
the main epiphytes in the system. Regular
Enteromorpha blooms have been observed,
Parameters Values
Volume 22 x106 m3
Total area 6.4 km2
River flow 80 m3 s-1
Tidal range 3.0 m
Population 66 000
Mean residence North channel: 2 days
time South channel: 9 days

IDENTIFICATION OF SENSITIVE AREAS AND VULNERABLE ZONES IN TRANSITIONAL AND COASTAL PORTUGUESE SYSTEMS
Mo
nd
eg
o E
st
ua
ry
6 9
0
10
20
30
40
50
60
1 2 3 4 5 6 7 8 9 10 11 12 13 14 15 16 17 18 19 20 More0
10
20
30
40
50
60
70
80
90
100
Freq
uenc
y
Cum
ulat
ive
per
cent
age
Frequency
Cumulative %
FIGURE 75. FREQUENCY DISTRIBUTION FOR CHLOROPHYLL IN THE NORTH CHANNEL OF THE MONDEGO ESTUARY.
FIGURE 76. MEDIAN VALUES FOR CHLOROPHYLL IN THE SOUTH CHANNEL OF THE MONDEGO ESTUARY. DATA COLLECTED AT LOW TIDE.
0
5
10
15
20
25
30
Jan Feb Mar Apr May Jun Jul Aug Sep Oct Nov Dec
High
Medium
Low
Median
Raw data
especially in the inner areas of the South
channel. The growth dynamics of the most
abundant green seaweeds (Enteromorpha
intestinalis and Enteromorpha compressa) was
studied in a biomass gradient transect in the
South channel of the estuary. The sampling
stations are shown in Figure 73 and biomasses
decrease downstream. Although plants are
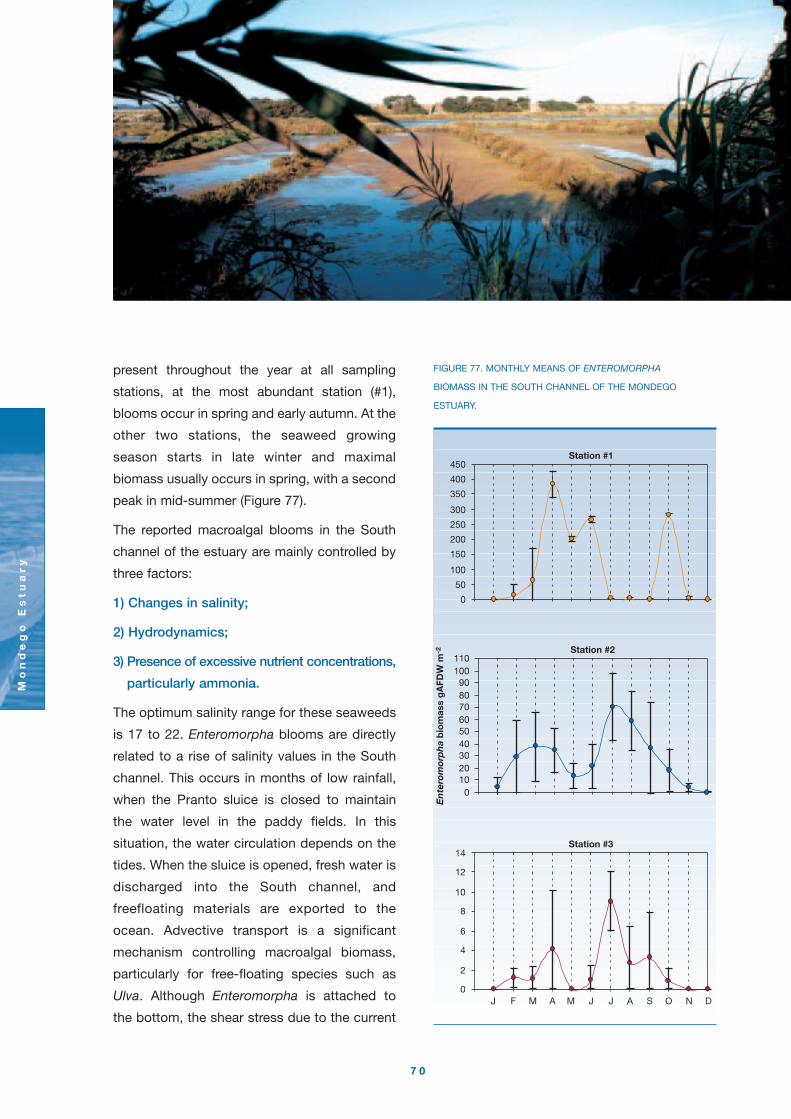
FIGURE 77. MONTHLY MEANS OF ENTEROMORPHA
BIOMASS IN THE SOUTH CHANNEL OF THE MONDEGO
ESTUARY.
Station #2
0102030405060708090
100110
Station #3
0
2
4
6
8
10
12
14
En
tero
mor
ph
a b
iom
ass
gA
FDW
m-2
Station #1
0
50
100
150
200
250
300
350
400
450
J F M A M J J A S O N D
Mo
nd
eg
o E
st
ua
ry
7 0
present throughout the year at all sampling
stations, at the most abundant station (#1),
blooms occur in spring and early autumn. At the
other two stations, the seaweed growing
season starts in late winter and maximal
biomass usually occurs in spring, with a second
peak in mid-summer (Figure 77).
The reported macroalgal blooms in the South
channel of the estuary are mainly controlled by
three factors:
1) Changes in salinity;
2) Hydrodynamics;
3) Presence of excessive nutrient concentrations,
particularly ammonia.
The optimum salinity range for these seaweeds
is 17 to 22. Enteromorpha blooms are directly
related to a rise of salinity values in the South
channel. This occurs in months of low rainfall,
when the Pranto sluice is closed to maintain
the water level in the paddy fields. In this
situation, the water circulation depends on the
tides. When the sluice is opened, fresh water is
discharged into the South channel, and
freefloating materials are exported to the
ocean. Advective transport is a significant
mechanism controlling macroalgal biomass,
particularly for free-floating species such as
Ulva. Although Enteromorpha is attached to
the bottom, the shear stress due to the current

IDENTIFICATION OF SENSITIVE AREAS AND VULNERABLE ZONES IN TRANSITIONAL AND COASTAL PORTUGUESE SYSTEMS
Mo
nd
eg
o E
st
ua
ry
7 1
(1.4 m s-1) is sufficient to cause export to
the ocean. The agricultural practices in the
Pranto watershed, coupled to the freshwater
discharge regime appear to be the main factors
for the dissolved nitrogen and organic matter
enrichment of the South channel of the estuary.
Organic matter accumulates in the sediment
and decomposes, releasing ammonia into the
water, which is a primary driver of seaweed
blooms (Figure 78).
FIGURE 78. VARIATION OF THE MAIN FACTORS CONTROLLING SEAWEED BLOOMS IN THE SOUTH CHANNEL OF THE MONDEGO
ESTUARY. THE VARIATION DEPENDS ON PRECIPITATION AND RIVER MANAGEMENT PRACTICES, DETERMINED BY WATER
REQUIREMENTS FOR RICE CULTURE.
Dry winter and/or spring Rainy winter and spring
Sluice gates Closed Open
Salinity High Low
Dissolved inorganic nitrogen Low High
N:P ratio Near 16 High
Current velocity Low High
Seaweed blooms High Low
FIGURE 79. CUMULATIVE FREQUENCY DISTRIBUTION FOR DISSOLVED OXYGEN IN THE SOUTH CHANNEL OF THE MONDEGO ESTUARY.
0
5
10
15
20
25
30
35
40
45
1 3 5 7 9 11 13 15 17 190
10
20
30
40
50
60
70
80
90
100
More
Frequency
Cumulative %
Freq
uenc
y
Cum
ulat
ive
per
cent
age
Dissolved oxygen (mg l-1)

INAG - INSTITUTO DA ÁGUA • IMAR - INSTITUTE OF MARINE RESEARCH
Mo
nd
eg
o E
st
ua
ry
7 2
Secondary symptoms method
Dissolved oxygen
Most data for dissolved oxygen in the South
channel are above the threshold for the
biological stress. Only 5% of the values fall
within this category (Figure 79). These values
were all obtained in station #3, mainly in winter.
Although most of the oxygen saturation values
are above 100%, all stations present some
values below this threshold, particularly stations
#1 and #3 (Figure 80).
Generally the lowest values are obtained during
the winter and the highest in spring and summer
during the macroalgal bloom period.
Submerged aquatic vegetation
Zostera noltii is the main species of submerged
aquatic vegetation (SAV) in the Mondego estuary.
Although there has been a decrease in the area
occupied by this species since the early 1980’s,
no data on the percentage loss are available.
However, it is known that the Zostera noltii
meadows, which in the past occupied most of
the subtidal estuarine area, are presently restricted
to the downstream section of the South channel.
The overgrowth of green algae is the main cause
of SAV losses due to reduced light availability
and smothering. In the downstream part of the
South channel, the annual peaks of Zostera
noltii biomass can be observed during the growing
season in spring and summer. The lowest
biomass values are in late winter (Figure 81).
Nuisance and toxic blooms
No nuisance or toxic algal blooms have been
reported in the literature, and the experts
consulted for this estuary do not consider this
to be a problem area.
FIGURE 80. OXYGEN SATURATION IN THE SOUTH CHANNEL OF THE MONDEGO ESTUARY.
0
50
100
150
200
250
300
350
Jan Feb Mar Apr May Jun Jul Aug Sep Oct Nov Dec
100%
MedianStation #3Station #2Station #1
Oxy
gen
sat
urat
ion
(%)
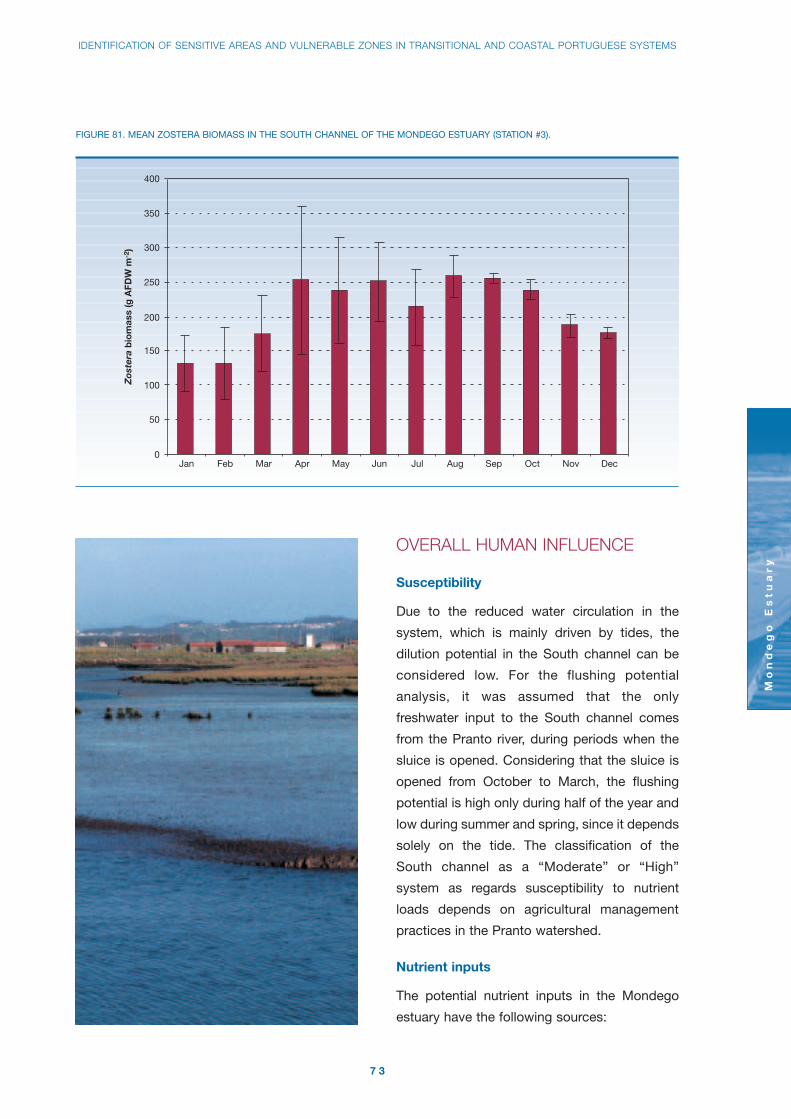
IDENTIFICATION OF SENSITIVE AREAS AND VULNERABLE ZONES IN TRANSITIONAL AND COASTAL PORTUGUESE SYSTEMS
Mo
nd
eg
o E
st
ua
ry
7 3
OVERALL HUMAN INFLUENCE
Susceptibility
Due to the reduced water circulation in the
system, which is mainly driven by tides, the
dilution potential in the South channel can be
considered low. For the flushing potential
analysis, it was assumed that the only
freshwater input to the South channel comes
from the Pranto river, during periods when the
sluice is opened. Considering that the sluice is
opened from October to March, the flushing
potential is high only during half of the year and
low during summer and spring, since it depends
solely on the tide. The classification of the
South channel as a “Moderate” or “High”
system as regards susceptibility to nutrient
loads depends on agricultural management
practices in the Pranto watershed.
Nutrient inputs
The potential nutrient inputs in the Mondego
estuary have the following sources:
FIGURE 81. MEAN ZOSTERA BIOMASS IN THE SOUTH CHANNEL OF THE MONDEGO ESTUARY (STATION #3).
0
50
100
150
200
250
300
350
400
Zos
tera
bio
mas
s (g
AFD
W m
-2)
Jan Feb Mar Apr May Jun Jul Aug Sep Oct Nov Dec

INAG - INSTITUTO DA ÁGUA • IMAR - INSTITUTE OF MARINE RESEARCH
Mo
nd
eg
o E
st
ua
ry
7 4
1) Treated or untreated domestic effluents;
2) Treated or untreated industrial effluents;
3) Agricultural point and diffuse sources;
4) Load from the river Mondego, integrating
the main agricultural, domestic and industrial
sources upstream of the estuary;
5) Load from the Pranto river.
The nutrient load from domestic sources to the
estuary is mainly due to the population of
Figueira da Foz and to the Mondego river
discharge. The sewage of about 90% of the
population is discharged to the system without
treatment. Six wastewater treatment plants
(WWTP) presently serve about 10% of the
population (Figure 82).
FIGURE 83. SOIL USES IN THE WATERSHED OF THE MONDEGO ESTUARY.
100000
100000
4000
0035
0000
150000 200000 250000 300000
150000 200000 250000 300000
400000350000
Urban areasIndustryArtificial green areas
Unirrigated culturesIrrigated culturesRice fields
OrchardsDiverse culturesAgroforestry
Oak treesResinous treesShrubby fields
Unproductive landWithout vegetationWetlands
Atla
ntic
Oce
an
FIGURE 82. WASTEWATER PLANTS AND POPULATION SERVED IN THE WATERSHED OF THE MONDEGO ESTUARY.
Population served Population Totalwith WWTP without WWTP Population
Brenha 750 Secondary
Maiorca 1 500 Secondary
Paião 1 000 Secondary
Praia de Quiaios 500 Tertiary
Quiaios 2 000 Secondary
60 000
(90%)
65 700
(100%)
WWTP Type of treatment
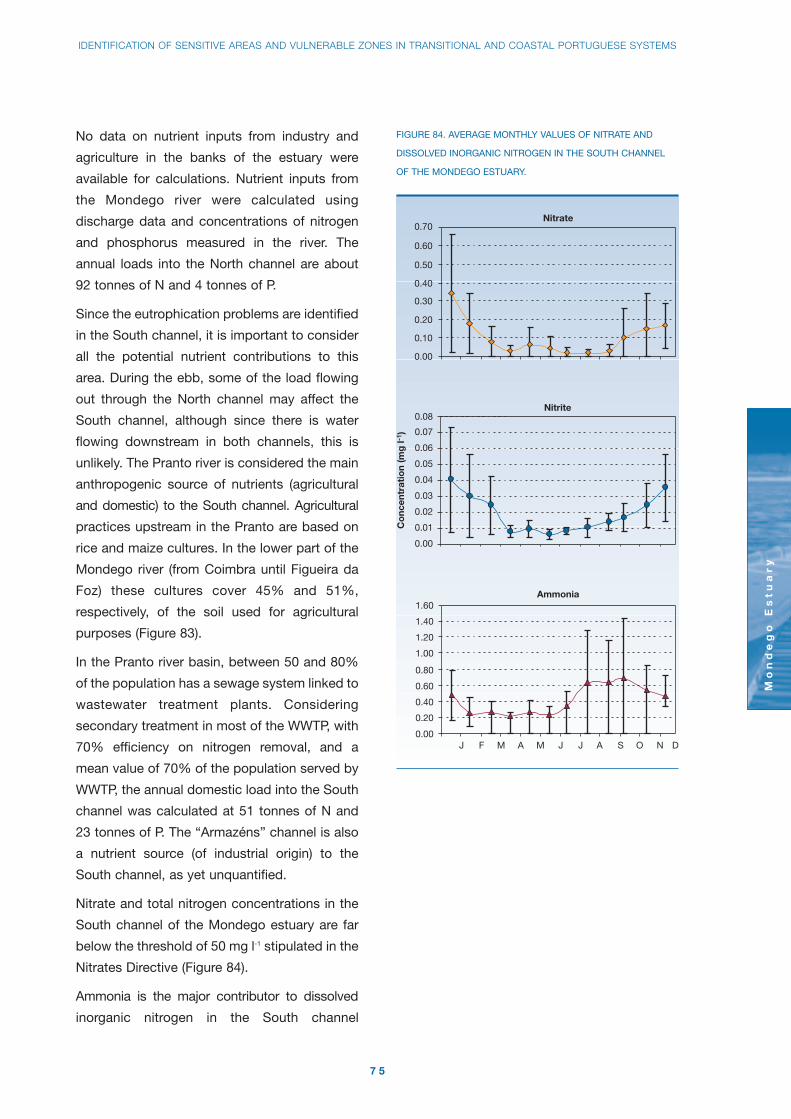
IDENTIFICATION OF SENSITIVE AREAS AND VULNERABLE ZONES IN TRANSITIONAL AND COASTAL PORTUGUESE SYSTEMS
Mo
nd
eg
o E
st
ua
ry
7 5
No data on nutrient inputs from industry and
agriculture in the banks of the estuary were
available for calculations. Nutrient inputs from
the Mondego river were calculated using
discharge data and concentrations of nitrogen
and phosphorus measured in the river. The
annual loads into the North channel are about
92 tonnes of N and 4 tonnes of P.
Since the eutrophication problems are identified
in the South channel, it is important to consider
all the potential nutrient contributions to this
area. During the ebb, some of the load flowing
out through the North channel may affect the
South channel, although since there is water
flowing downstream in both channels, this is
unlikely. The Pranto river is considered the main
anthropogenic source of nutrients (agricultural
and domestic) to the South channel. Agricultural
practices upstream in the Pranto are based on
rice and maize cultures. In the lower part of the
Mondego river (from Coimbra until Figueira da
Foz) these cultures cover 45% and 51%,
respectively, of the soil used for agricultural
purposes (Figure 83).
In the Pranto river basin, between 50 and 80%
of the population has a sewage system linked to
wastewater treatment plants. Considering
secondary treatment in most of the WWTP, with
70% efficiency on nitrogen removal, and a
mean value of 70% of the population served by
WWTP, the annual domestic load into the South
channel was calculated at 51 tonnes of N and
23 tonnes of P. The “Armazéns” channel is also
a nutrient source (of industrial origin) to the
South channel, as yet unquantified.
Nitrate and total nitrogen concentrations in the
South channel of the Mondego estuary are far
below the threshold of 50 mg l-1 stipulated in the
Nitrates Directive (Figure 84).
Ammonia is the major contributor to dissolved
inorganic nitrogen in the South channel
Nitrate
0.00
0.10
0.20
0.30
0.40
0.50
0.60
0.70
Nitrite
0.00
0.01
0.02
0.03
0.04
0.05
0.06
0.07
0.08
Ammonia
0.00
0.20
0.40
0.60
0.80
1.00
1.20
1.40
1.60
J F M A M J J A S O N D
Co
ncen
trat
ion
(mg
l-1 )
FIGURE 84. AVERAGE MONTHLY VALUES OF NITRATE AND
DISSOLVED INORGANIC NITROGEN IN THE SOUTH CHANNEL
OF THE MONDEGO ESTUARY.
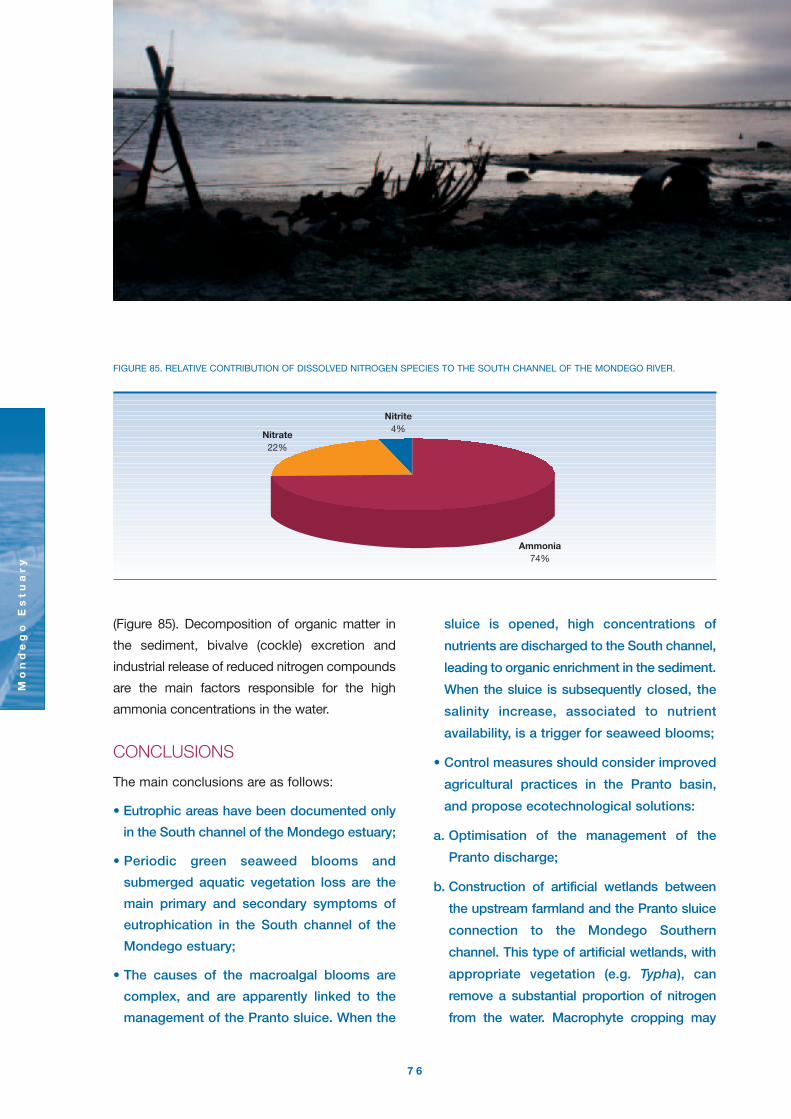
FIGURE 85. RELATIVE CONTRIBUTION OF DISSOLVED NITROGEN SPECIES TO THE SOUTH CHANNEL OF THE MONDEGO RIVER.
Ammonia74%
Nitrite4%
Nitrate22%
Mo
nd
eg
o E
st
ua
ry
7 6
(Figure 85). Decomposition of organic matter in
the sediment, bivalve (cockle) excretion and
industrial release of reduced nitrogen compounds
are the main factors responsible for the high
ammonia concentrations in the water.
CONCLUSIONS
The main conclusions are as follows:
• Eutrophic areas have been documented only
in the South channel of the Mondego estuary;
• Periodic green seaweed blooms and
submerged aquatic vegetation loss are the
main primary and secondary symptoms of
eutrophication in the South channel of the
Mondego estuary;
• The causes of the macroalgal blooms are
complex, and are apparently linked to the
management of the Pranto sluice. When the
sluice is opened, high concentrations of
nutrients are discharged to the South channel,
leading to organic enrichment in the sediment.
When the sluice is subsequently closed, the
salinity increase, associated to nutrient
availability, is a trigger for seaweed blooms;
• Control measures should consider improved
agricultural practices in the Pranto basin,
and propose ecotechnological solutions:
a. Optimisation of the management of the
Pranto discharge;
b. Construction of artificial wetlands between
the upstream farmland and the Pranto sluice
connection to the Mondego Southern
channel. This type of artificial wetlands, with
appropriate vegetation (e.g. Typha), can
remove a substantial proportion of nitrogen
from the water. Macrophyte cropping may
IDENTIFICATION OF SENSITIVE AREAS AND VULNERABLE ZONES IN TRANSITIONAL AND COASTAL PORTUGUESE SYSTEMS
Mo
nd
eg
o E
st
ua
ry
7 7
allow for recycling and solutions must be
defined for periods of flooding. The wetland
area required may be estimated through the
use of models.
• There is a clear need for an Investigative
Monitoring programme for the Mondego
estuary, in order to complete the spatial
description of the estuary, to shed light on
key processes, and to establish the
appropriate classification with regard to the
Nitrate Directive and UWWTD due to
eutrophication concerns.
KEY REFERENCES
Duarte, A.S., Pinho, J.L., Pardal, M.A., Neto,
J.M., Vieira, J.P., Santos, F.S., 2001. Effect of
residence times on River Mondego estuary
eutrophication vulnerability. Water Science &
Technology, 44(2-3), 329–336.
Flindt, M.R., Kamp-Nielsen, Marques, J.C.,
Pardal, M.A., Bocci, M., Bendoricchio, G.,
Salomonsen, J., Nielsen, S.N., Jorgensen, S.E.,
1997. Description of the three shallow estuaries:
Mondego river (Portugal), Roskilde Fjord
(Denmark) and the Lagoon of Venice (Italy).
Ecol. Model., 102, 17-31.
Martins, I., Pardal, M.A., Lillebo, A.I., Flindt,
M.R., Marques, J.C., 2001. Hydrodynamics as a
major factor controlling the occurrence of green
macroalgal blooms in a eutrophic estuary: a
case study on the influence of precipitation and
river management. Est. Coast. Shelf Sci., 52,
165-177.
Martins, I., Marques, J. C., 2002. A Model for
the growth of opportunistic macroalgae
(Enteromorpha sp.) in tidal estuaries. Estuarine,
Coastal and Shelf Science, 55(2), 247-257.
Múrias, T., J. A. Cabral, J. C. Marques & J. D.
Goss-Custard 1996. Short-term effects of
intertidal macroalgae blooms on the macrohabitat
selection and feeding behaviour of Waders in
the Mondego estuary (West Portugal) Estuarine
Coastal and Shelf Science, 43, 677-688.
References for grey literature consulted
for this chapter may be found at
http://www.imar.pt/perfect/

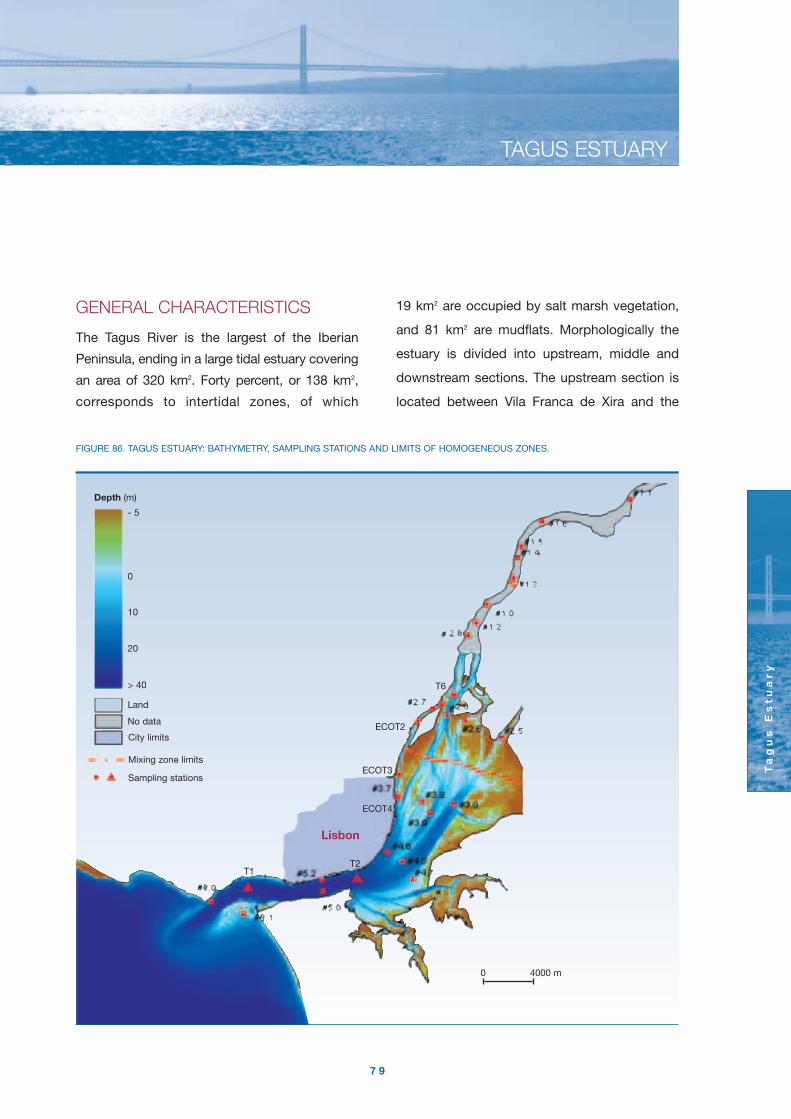
TAGUS ESTUARY
Ta
gu
s E
st
ua
ry
7 9
GENERAL CHARACTERISTICS
The Tagus River is the largest of the Iberian
Peninsula, ending in a large tidal estuary covering
an area of 320 km2. Forty percent, or 138 km2,
corresponds to intertidal zones, of which
19 km2 are occupied by salt marsh vegetation,
and 81 km2 are mudflats. Morphologically the
estuary is divided into upstream, middle and
downstream sections. The upstream section is
located between Vila Franca de Xira and the
FIGURE 86. TAGUS ESTUARY: BATHYMETRY, SAMPLING STATIONS AND LIMITS OF HOMOGENEOUS ZONES.
Lisbon
T1T2
ECOT4
ECOT3
ECOT2
T6
0 4000 m
Depth (m)
- 5
0
10
20
> 40
No data
Land
Mixing zone limits
City limits
Sampling stations
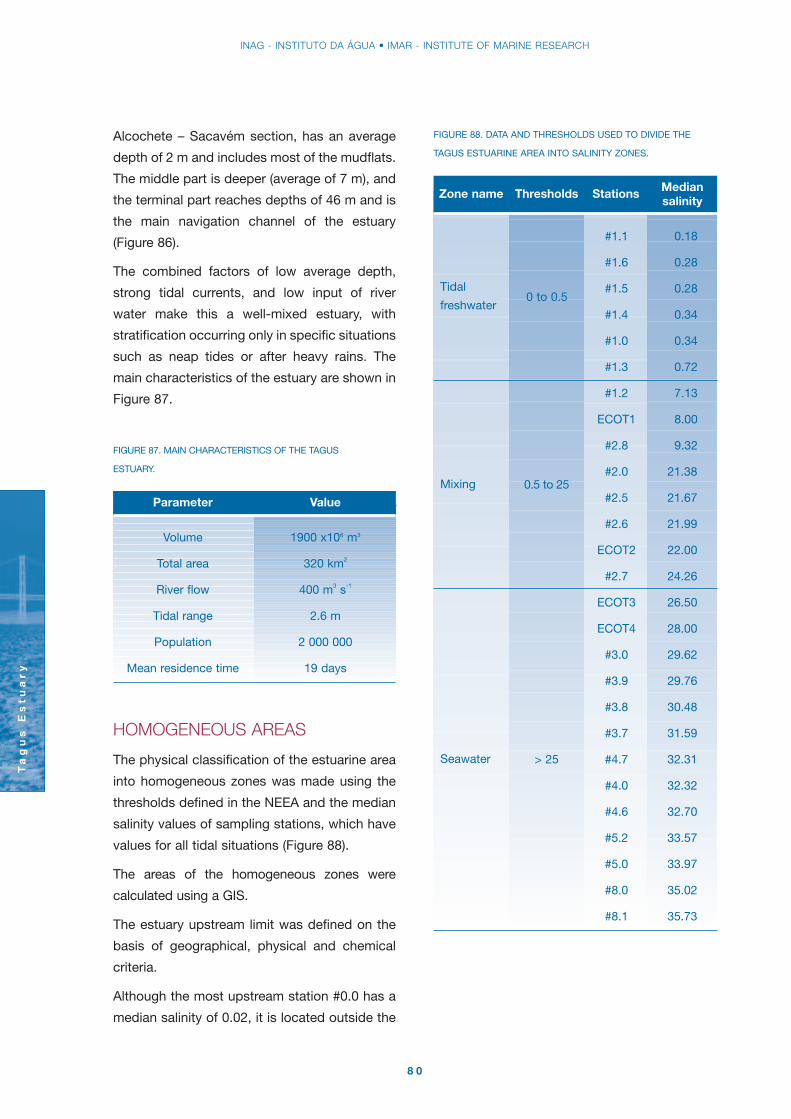
Alcochete – Sacavém section, has an average
depth of 2 m and includes most of the mudflats.
The middle part is deeper (average of 7 m), and
the terminal part reaches depths of 46 m and is
the main navigation channel of the estuary
(Figure 86).
The combined factors of low average depth,
strong tidal currents, and low input of river
water make this a well-mixed estuary, with
stratification occurring only in specific situations
such as neap tides or after heavy rains. The
main characteristics of the estuary are shown in
Figure 87.
FIGURE 87. MAIN CHARACTERISTICS OF THE TAGUS
ESTUARY.
Parameter Value
Volume 1900 x106 m3
Total area 320 km2
River flow 400 m3 s-1
Tidal range 2.6 m
Population 2 000 000
Mean residence time 19 days
Median salinity
#1.1 0.18
#1.6 0.28
#1.5 0.28
#1.4 0.34
#1.0 0.34
#1.3 0.72
#1.2 7.13
ECOT1 8.00
#2.8 9.32
#2.0 21.38
#2.5 21.67
#2.6 21.99
ECOT2 22.00
#2.7 24.26
ECOT3 26.50
ECOT4 28.00
#3.0 29.62
#3.9 29.76
#3.8 30.48
#3.7 31.59
#4.7 32.31
#4.0 32.32
#4.6 32.70
#5.2 33.57
#5.0 33.97
#8.0 35.02
#8.1 35.73
Zone name Thresholds Stations
Tidal
freshwater0 to 0.5
0.5 to 25
> 25
Mixing
Seawater
HOMOGENEOUS AREAS
The physical classification of the estuarine area
into homogeneous zones was made using the
thresholds defined in the NEEA and the median
salinity values of sampling stations, which have
values for all tidal situations (Figure 88).
The areas of the homogeneous zones were
calculated using a GIS.
The estuary upstream limit was defined on the
basis of geographical, physical and chemical
criteria.
Although the most upstream station #0.0 has a
median salinity of 0.02, it is located outside the
FIGURE 88. DATA AND THRESHOLDS USED TO DIVIDE THE
TAGUS ESTUARINE AREA INTO SALINITY ZONES.
INAG - INSTITUTO DA ÁGUA • IMAR - INSTITUTE OF MARINE RESEARCH
Ta
gu
s E
st
ua
ry
8 0
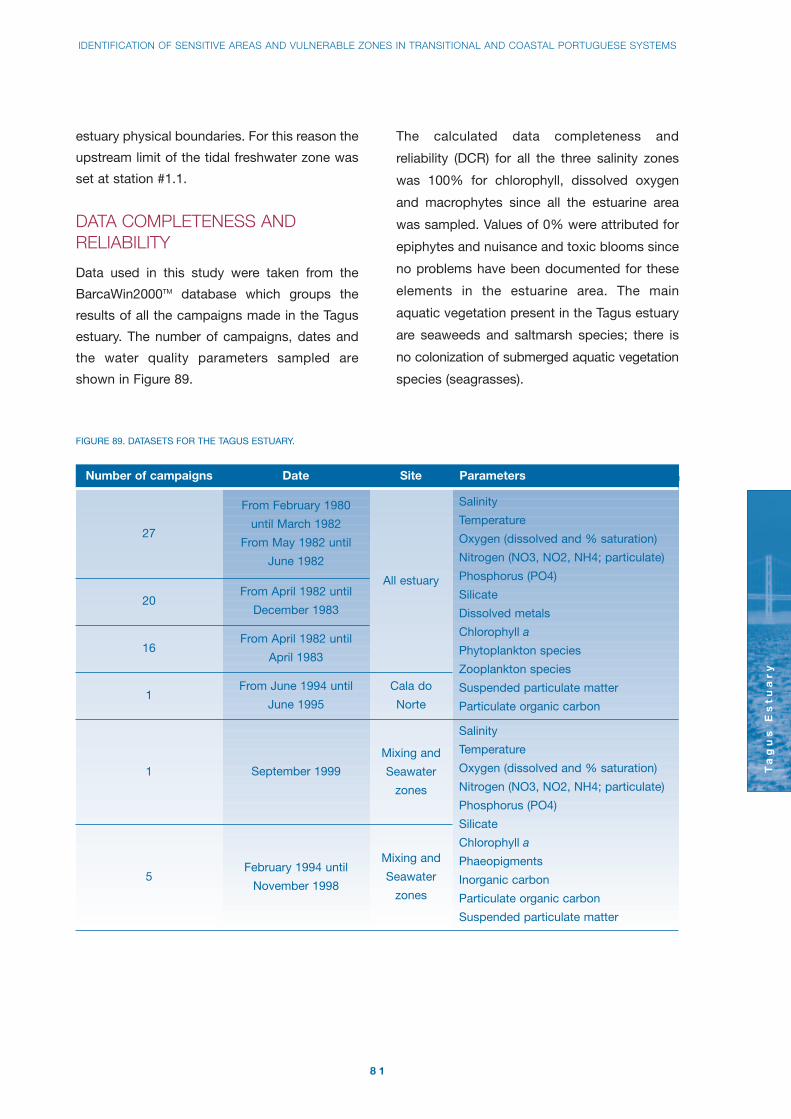
IDENTIFICATION OF SENSITIVE AREAS AND VULNERABLE ZONES IN TRANSITIONAL AND COASTAL PORTUGUESE SYSTEMS
Ta
gu
s E
st
ua
ry
8 1
estuary physical boundaries. For this reason the
upstream limit of the tidal freshwater zone was
set at station #1.1.
DATA COMPLETENESS ANDRELIABILITY
Data used in this study were taken from the
BarcaWin2000TM database which groups the
results of all the campaigns made in the Tagus
estuary. The number of campaigns, dates and
the water quality parameters sampled are
shown in Figure 89.
The calculated data completeness and
reliability (DCR) for all the three salinity zones
was 100% for chlorophyll, dissolved oxygen
and macrophytes since all the estuarine area
was sampled. Values of 0% were attributed for
epiphytes and nuisance and toxic blooms since
no problems have been documented for these
elements in the estuarine area. The main
aquatic vegetation present in the Tagus estuary
are seaweeds and saltmarsh species; there is
no colonization of submerged aquatic vegetation
species (seagrasses).
FIGURE 89. DATASETS FOR THE TAGUS ESTUARY.
Number of campaigns Date Site Parameters
27
20
16
From February 1980
until March 1982
From May 1982 until
June 1982
From April 1982 until
December 1983
From April 1982 until
April 1983
All estuary
Salinity
Temperature
Oxygen (dissolved and % saturation)
Nitrogen (NO3, NO2, NH4; particulate)
Phosphorus (PO4)
Silicate
Dissolved metals
Chlorophyll a
Phytoplankton species
Zooplankton species
Suspended particulate matter
Particulate organic carbon1
From June 1994 until
June 1995
Cala do
Norte
1
5
September 1999
February 1994 until
November 1998
Mixing and
Seawater
zones
Mixing and
Seawater
zones
Salinity
Temperature
Oxygen (dissolved and % saturation)
Nitrogen (NO3, NO2, NH4; particulate)
Phosphorus (PO4)
Silicate
Chlorophyll a
Phaeopigments
Inorganic carbon
Particulate organic carbon
Suspended particulate matter
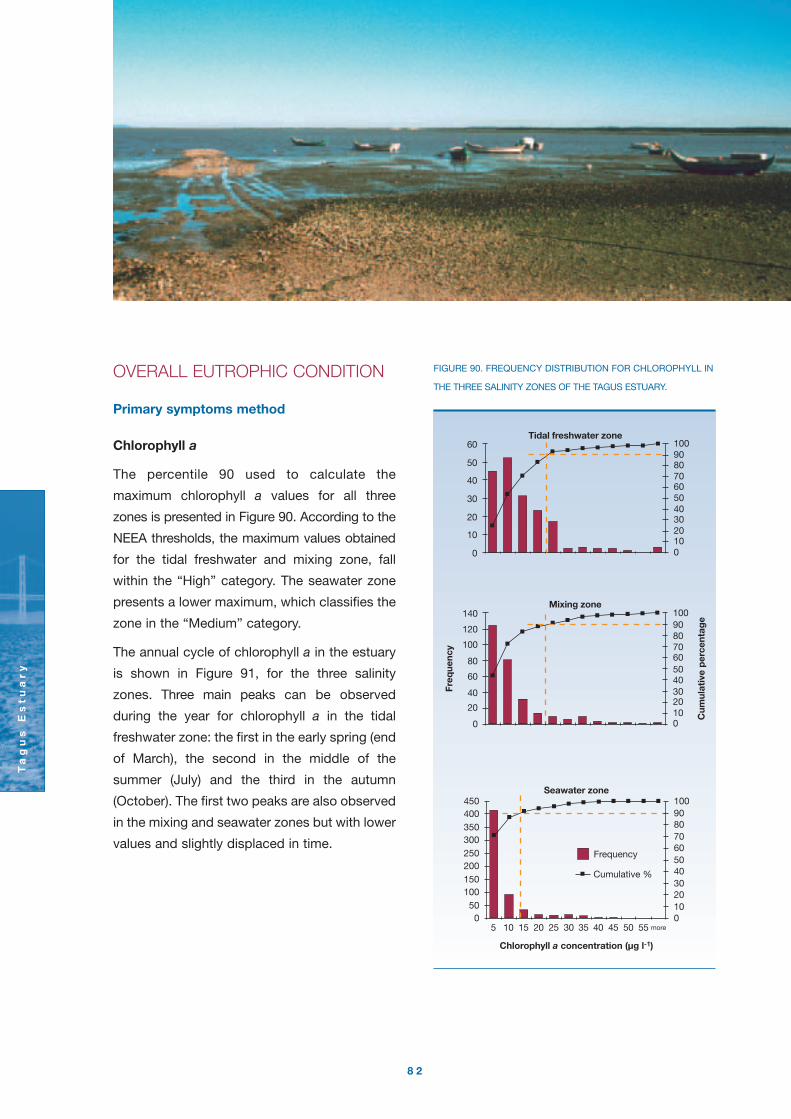
OVERALL EUTROPHIC CONDITION
Primary symptoms method
Chlorophyll a
The percentile 90 used to calculate the
maximum chlorophyll a values for all three
zones is presented in Figure 90. According to the
NEEA thresholds, the maximum values obtained
for the tidal freshwater and mixing zone, fall
within the “High” category. The seawater zone
presents a lower maximum, which classifies the
zone in the “Medium” category.
The annual cycle of chlorophyll a in the estuary
is shown in Figure 91, for the three salinity
zones. Three main peaks can be observed
during the year for chlorophyll a in the tidal
freshwater zone: the first in the early spring (end
of March), the second in the middle of the
summer (July) and the third in the autumn
(October). The first two peaks are also observed
in the mixing and seawater zones but with lower
values and slightly displaced in time.
Tidal freshwater zone
0
10
20
30
40
50
60
0102030405060708090100
Mixing zone
0
20
40
60
80
100
120
140
0102030405060708090100
Seawater zone
050
100150200250300350400450
0102030405060708090100
5 10 15 20 25 30 35 40 45 50 55 more
Frequency
Cumulative %
Freq
uenc
y
Cum
ulat
ive
per
cent
age
FIGURE 90. FREQUENCY DISTRIBUTION FOR CHLOROPHYLL IN
THE THREE SALINITY ZONES OF THE TAGUS ESTUARY.
Ta
gu
s E
st
ua
ry
8 2

IDENTIFICATION OF SENSITIVE AREAS AND VULNERABLE ZONES IN TRANSITIONAL AND COASTAL PORTUGUESE SYSTEMS
Ta
gu
s E
st
ua
ry
8 3
FIGURE 91. ANNUAL CYCLE FOR THE THREE ZONES IN THE TAGUS ESTUARY.
0.0
2.5
5.0
7.5
10.0
12.5
15.0
17.5
20.0
Jan Feb Mar Apr May Jun Jul Aug Sep Oct Nov Dec
Tidal
Mixing
Seawater
Medium
Low
Also, the total dataset available for this
parameter suggests a decrease of maximum
values from hypereutrophic to medium levels in
all zones (Figure 92). This could be due to the
nutrient load decrease, as a consequence of
improvements in the sewage treatment of the
main cities and industrial plants located on the
banks of the estuary. In this way, the
classification of the tidal freshwater and mixing
zones in the high category is influenced by the
values obtained in the early 1980’s when
chlorophyll values reached 80 µg l-1 in these two
salinity zones.
The Thiessen polygon method was used to
calculate the spatial weight of each station
within its salinity zone (Figure 93). The spatial
coverage of percentile 90 values in each salinity
zone was then calculated through the sum of
spatial weights where maximum values were
observed. Information on the sampling date of
the maximum values was used to evaluate the
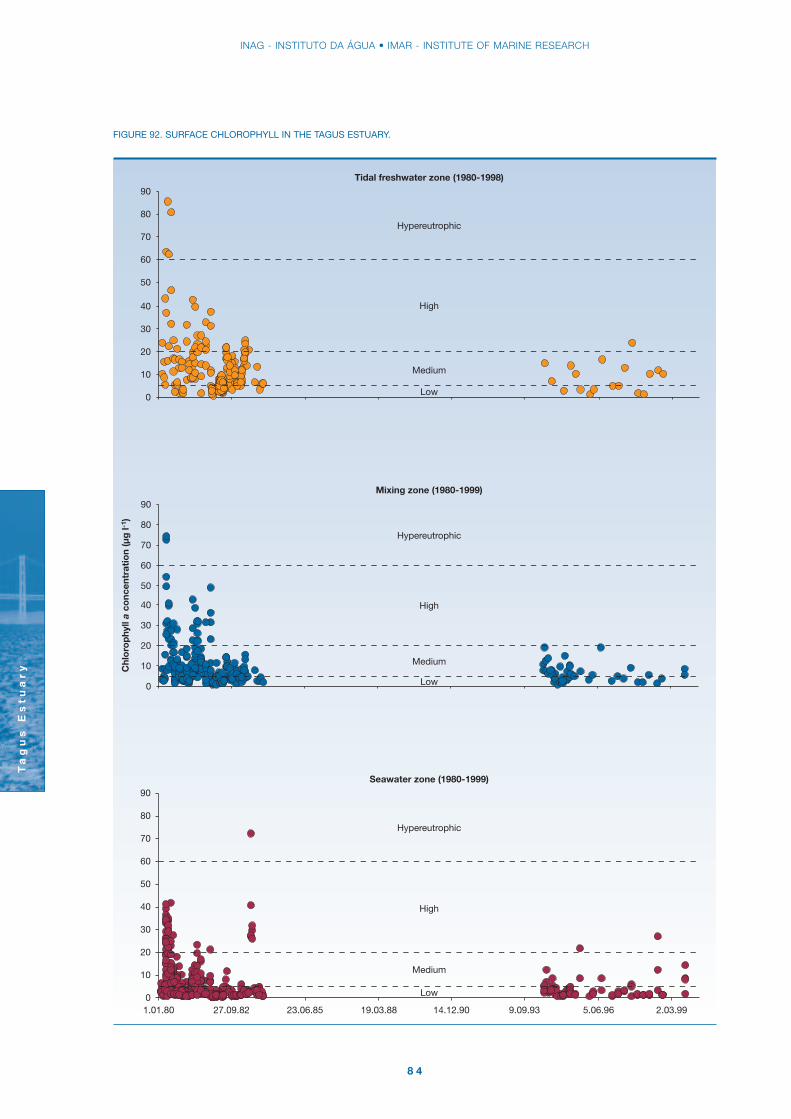
FIGURE 92. SURFACE CHLOROPHYLL IN THE TAGUS ESTUARY.
Tidal freshwater zone (1980-1998)
0
10
20
30
40
50
60
70
80
90
Hypereutrophic
High
Medium
Low
Mixing zone (1980-1999)
0
10
20
30
40
50
60
70
80
90
Hypereutrophic
High
Medium
Low
Seawater zone (1980-1999)
0
10
20
30
40
50
60
70
80
90
1.01.80 27.09.82 23.06.85 19.03.88 14.12.90 9.09.93 5.06.96 2.03.99
Hypereutrophic
High
Medium
Low
INAG - INSTITUTO DA ÁGUA • IMAR - INSTITUTE OF MARINE RESEARCH
Ta
gu
s E
st
ua
ry
8 4

IDENTIFICATION OF SENSITIVE AREAS AND VULNERABLE ZONES IN TRANSITIONAL AND COASTAL PORTUGUESE SYSTEMS
Ta
gu
s E
st
ua
ry
8 5
frequency of occurrence within the salinity
zone. The summary of the results obtained for
the NEEA index application in each salinity zone
is presented in Figure 94.
Epiphytes
Expert consultations on this subject show that no
problems with epiphytes have been observed
within the estuarine area. The value used for
epiphytes in each zone equals zero.
Macroalgae
The study of macrophyte algae in the estuary
was carried out between 1985 and 1987. The
main substrates colonised by algae in the Tagus
FIGURE 93. ZONES OF INFLUENCE CALCULATED WITH THE
THIESSEN POLYGONS METHOD.
estuary were old oyster-beds located in the
intertidal zones within the mixing and seawater
salinity zones. Figure 95 shows the values
obtained for the biomass of the main species in
the estuary. The brown alga Fucus vesiculosus
is the most abundant species, while fast
growing species such as Ulva lactuca reached
maximum values two times lower than the
Fucus maximum. A comparison of maximum
algal biomass for fast growing species in the
Tagus estuary with that obtained in typical
eutrophic systems (Figure 96) shows that the
maximum biomass for Ulva lactuca in the Tagus
estuary (200 g dw m-2; Figure 95) can be
considered low.
Furthermore, expert consultation shows that
macroalgal growth in the Tagus estuary is linked
to intertidal substrates, where seaweeds have a
competitive advantage as regards light
availability, compared to pelagic primary
producers in the channels, due to the natural
turbidity of the water column. No problems with
decreasing light availability or oxygen depletion
in the water column due to the excessive
growth of algae have been observed. For these
reasons, this parameter takes a value of zero in
each zone for the index calculation. Since there
are only 2 years of available data for this
indicator, no discussion can be made about the
trend of algal biomass in the estuary.
FIGURE 94. RESULTS OF THE NEEA INDEX APPLICATION FOR THE CHLOROPHYLL IN THE TAGUS ESTUARY. SLE MEANS SYMPTOM
LEVEL OF EXPRESSION.
IF AND AND THENZONE Concentration Spatial coverage Frequency Expression Value Area SLE
Tidal fresh High Very low Persistent Moderate 0.5 13.9 0.023
Mixing High High Periodic High 1 77.6 0.252
Seawater Medium High Periodic High 1 216.3 0.703
Total 307.8 0.977

FIGURE 95. ANNUAL CYCLE OF MACROPHYTE ALGAL BIOMASS IN THE DIFFERENT INTERTIDAL ZONES OF THE TAGUS ESTUARY.
400
300
200
100
200
Fucus vesiculosus
100
100
Ulva lactuca
75
50
25
0Jan Feb Mar Apr May Jun Jul Aug Sep Oct Nov Dec
Gracilaria verrucosa
Bio
mas
s (g
dw
m-2
)
150
50
INAG - INSTITUTO DA ÁGUA • IMAR - INSTITUTE OF MARINE RESEARCH
Ta
gu
s E
st
ua
ry
8 6

IDENTIFICATION OF SENSITIVE AREAS AND VULNERABLE ZONES IN TRANSITIONAL AND COASTAL PORTUGUESE SYSTEMS
Ta
gu
s E
st
ua
ry
8 7
FIGURE 96. VALUES OF ALGAL BIOMASS IN SOME EUTROPHIC SYSTEMS.
Maximum biomass (g dw m-2)
Ulva rotundata
Ulva curvata
Po estuary (Italy) Ulva rigida 1 000
Venice Lagoon (Italy) Ulva rigida 1 300
Red sea (Egyptian coast) Cystoseira myrica 491
Waquoit Bay (Massachusetts – USA) Cladophora vagabunda >1 000
Site Species
Palmones estuary (Spain) 375
FIGURE 97. NEEA INDEX APPLICATION FOR THE PRIMARY SYMPTOMS IN THE TAGUS ESTUARY.
Area (km2) Value (vij) Az/At x vijZone Salinity (Az) Chlorophyll a Macroalgae Epiphytes Chlorophyll a Macroalgae Epiphytes
Seawater > 25 13.9 0.5 0 0 0.023 0 0
Mixing 0.5 – 25 77.6 1.0 0 0 0.252 0 0
Tidal fresh < 0.5 216.3 1.0 0 0 0.703 0 0
Sum 307.8 - - - 0.977 0 0
Primary symptoms level of expression value for the estuary: 0.33 Moderate
The aggregation of the information for the
primary symptoms method and the determination
of the level of expression for the Tagus estuary
are shown in Figure 97.
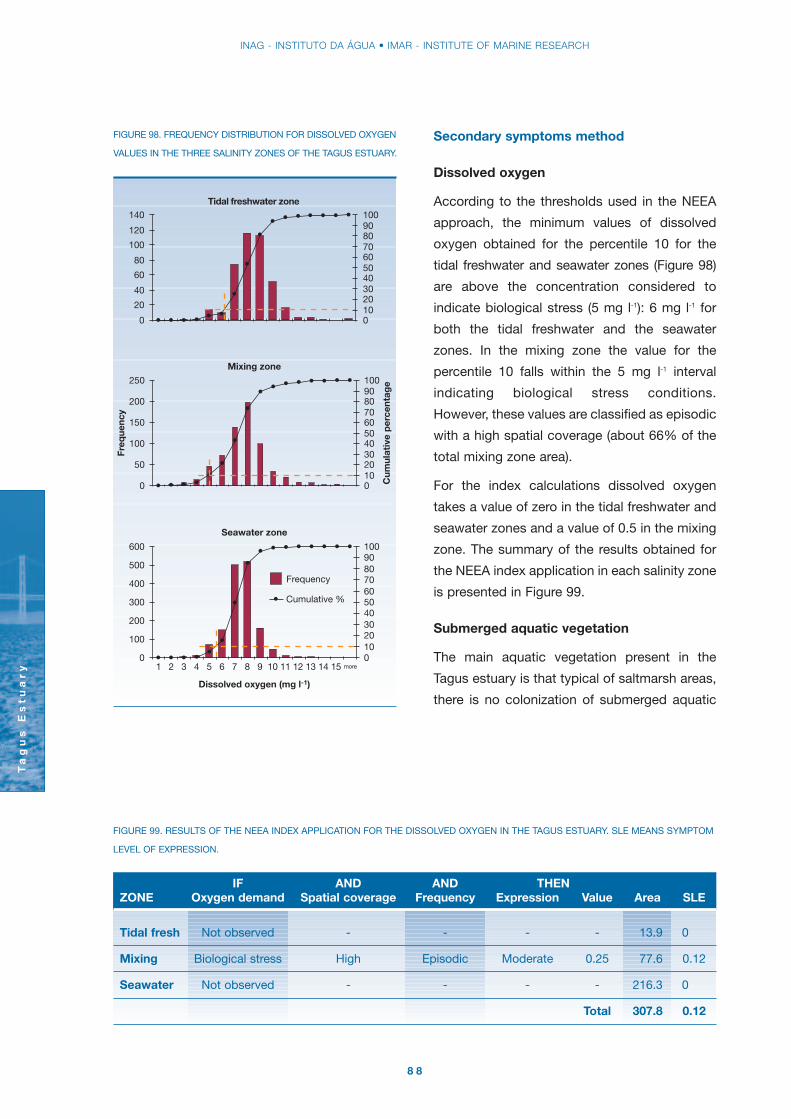
FIGURE 98. FREQUENCY DISTRIBUTION FOR DISSOLVED OXYGEN
VALUES IN THE THREE SALINITY ZONES OF THE TAGUS ESTUARY.
Tidal freshwater zone
0
20
40
60
80
100
120
140
0102030405060708090100
1 2 3 4 5 6 7 8 9 10 11 more
Seawater zone
0
100
200
300
400
500
600
0102030405060708090100
Frequency
Cumulative %
12 13 14 15
Dissolved oxygen (mg l-1)
Mixing zone
0
50
100
150
200
250
0102030405060708090100
Freq
uenc
y
Cum
ulat
ive
per
cent
age
Secondary symptoms method
Dissolved oxygen
According to the thresholds used in the NEEA
approach, the minimum values of dissolved
oxygen obtained for the percentile 10 for the
tidal freshwater and seawater zones (Figure 98)
are above the concentration considered to
indicate biological stress (5 mg l-1): 6 mg l-1 for
both the tidal freshwater and the seawater
zones. In the mixing zone the value for the
percentile 10 falls within the 5 mg l-1 interval
indicating biological stress conditions.
However, these values are classified as episodic
with a high spatial coverage (about 66% of the
total mixing zone area).
For the index calculations dissolved oxygen
takes a value of zero in the tidal freshwater and
seawater zones and a value of 0.5 in the mixing
zone. The summary of the results obtained for
the NEEA index application in each salinity zone
is presented in Figure 99.
Submerged aquatic vegetation
The main aquatic vegetation present in the
Tagus estuary is that typical of saltmarsh areas,
there is no colonization of submerged aquatic
FIGURE 99. RESULTS OF THE NEEA INDEX APPLICATION FOR THE DISSOLVED OXYGEN IN THE TAGUS ESTUARY. SLE MEANS SYMPTOM
LEVEL OF EXPRESSION.
IF AND AND THENZONE Oxygen demand Spatial coverage Frequency Expression Value Area SLE
Tidal fresh Not observed - - - - 13.9 0
Mixing Biological stress High Episodic Moderate 0.25 77.6 0.12
Seawater Not observed - - - - 216.3 0
Total 307.8 0.12
INAG - INSTITUTO DA ÁGUA • IMAR - INSTITUTE OF MARINE RESEARCH
Ta
gu
s E
st
ua
ry
8 8

IDENTIFICATION OF SENSITIVE AREAS AND VULNERABLE ZONES IN TRANSITIONAL AND COASTAL PORTUGUESE SYSTEMS
Ta
gu
s E
st
ua
ry
8 9
vegetation species. This parameter was not
included in the index calculation.
Nuisance and toxic blooms
Expert consultations on this subject as well as
literature data show that no problems with
nuisance and toxic blooms have been observed
in the estuary, over an extended period of time
(20 years). This parameter equals zero for each
salinity zone.
Figure 100 presents the aggregation of the
results for the secondary symptoms method as
well as the value and level of expression for all
the estuarine area.
OVERALL HUMAN INFLUENCE
Susceptibility
Dilution potential
The low average depth, strong tidal currents,
and low input of river water make the Tagus a
well-mixed estuary, with stratification being rare
and occurring in specific situations such as
neap tides or in periods of high river flow.
Considering the NEEA category for estuary
dilution potential, the vertically homogeneous
conditions of the water column, during all year
and throughout all the estuarine area classifies
the Tagus estuary in the Type A, “High” category.
Flushing potential
The Tagus estuary is a mesotidal estuary with a
tidal range of 2.6 m. The results obtained for the
flushing potential (freshwater inflow per day
divided by the estuary volume) fall within the
“Moderate” category.
Considering the categories for the dilution and
flushing potential in the NEEA matrix for the
estuarine export potential and susceptibility, the
Tagus estuary is classified as having a “Low”
susceptibility to dilute and flush nutrients.
Nutrient inputs
The main sources of nutrients discharging into
the estuary are:
1) Effluents from domestic treatment plants;
2) Effluents from industrial treatment plants;
3) Domestic effluents without wastewater
treatment;
4) Load from the river Tagus, which integrates
diffuse and point sources upstream of the
estuary;
5) Load from the tributaries (Sorraia and Trancão).
Information on the demography in the estuarine
watershed, population equivalents for the main
industrial activities and data on the efficiency of
the domestic wastewater treatment plants
FIGURE 100. NEEA INDEX APPLICATION FOR THE SECONDARY SYMPTOMS IN THE TAGUS ESTUARY.
Area (km2) Value (vij) Az/At x vijZone Salinity (Az) Dissolved O2 SAV Blooms Dissolved O2 SAV Blooms
Seawater > 25 13.9 0 0 0 0 0 0
Mixing 0.5 – 25 77.6 0.25 0 0 0.12 0 0
Tidal fresh < 0.5 216.3 0 0 0 0 0 0
Sum 307.8 - - - 0.12 0 0
Secondary symptoms level of expression value for the estuary: 0.12 Low

discharging to the estuary was used to calculate
the nutrient loads. At present, 17 wastewater
treatment plants (WWTP) in the estuary have
secondary treatment, with a mean efficiency of
about 70% removal of nitrogen compounds. On
the North shore, the sewage treatment plants
serve most of the population. On the South
shore, about 70% of the residents are not
served by a WWTP (Figure 101).
No data on the composition and concentrations
of the main industrial effluents to the estuary
was available to calculate the nutrient input
from this source. However, the main industrial
activities in the estuarine area (chemical and
smelting) are not associated with nutrient
pollution. Nutrient inputs from other industrial
activities discharging into the river (paper
manufacturing, textile industry and pig farming)
were accounted for in the calculation of the nutrient
loading from the river Tagus and tributaries.
Considering the daily N (12 g) and P (2.8 g) load
per inhabitant, the data in Figure 101 and
population equivalents for the main industrial
activities, the nutrient load to the estuary introduced
by treated effluents is about 5.78 ton of N and
4.5 ton of P per day. The high phosphorus load
is mainly due to the secondary treatment used
in most of the WWTP, which does not remove
phosphorus compounds from the effluents. The
nutrient load due to untreated sewage (29% of
the population) contributes about 7.78 ton of N
and 1.82 ton of P per day (Figure 102).
Nutrient input from the river Tagus is mainly due
to agricultural activities in the watershed above
the head of the estuary (Figure 103). Since
FIGURE 101. WASTEWATER TREATMENT PLANTS AND POPULATION SERVED BY WASTEWATER TREATMENT IN THE TAGUS ESTUARY
WATERSHED.
Total
Wastewater Population treatment plants served by
(WWTP) the WWTP
Alcântara 556 000
Beirolas 160 000
Chelas 178 000
Frielas 329 900
S. João da Talha 165 000
Fonte da Prata 4 500
Alcochete 8 100
Quinta da Bomba 120 000
Seixalinho 30 000
Aires 2 533
APIC 3 000
Barracheia 764
Lagoinha 20 500
Palmela/Auto-Europa 12 500
Poceirão 360
Salgueirinha 15 000
1 606 157 648 669 2 254 826
(71%) (29%) (100%)
Area Populationwithout WWTP
Total residentpopulation
North shore
(Greater Lisbon)
154 200
(10%)
1 547 600
(100%)
South shore
(Setúbal
Peninsula)
489 967
(69%)
707 224
(100%)
INAG - INSTITUTO DA ÁGUA • IMAR - INSTITUTE OF MARINE RESEARCH
Ta
gu
s E
st
ua
ry
9 0
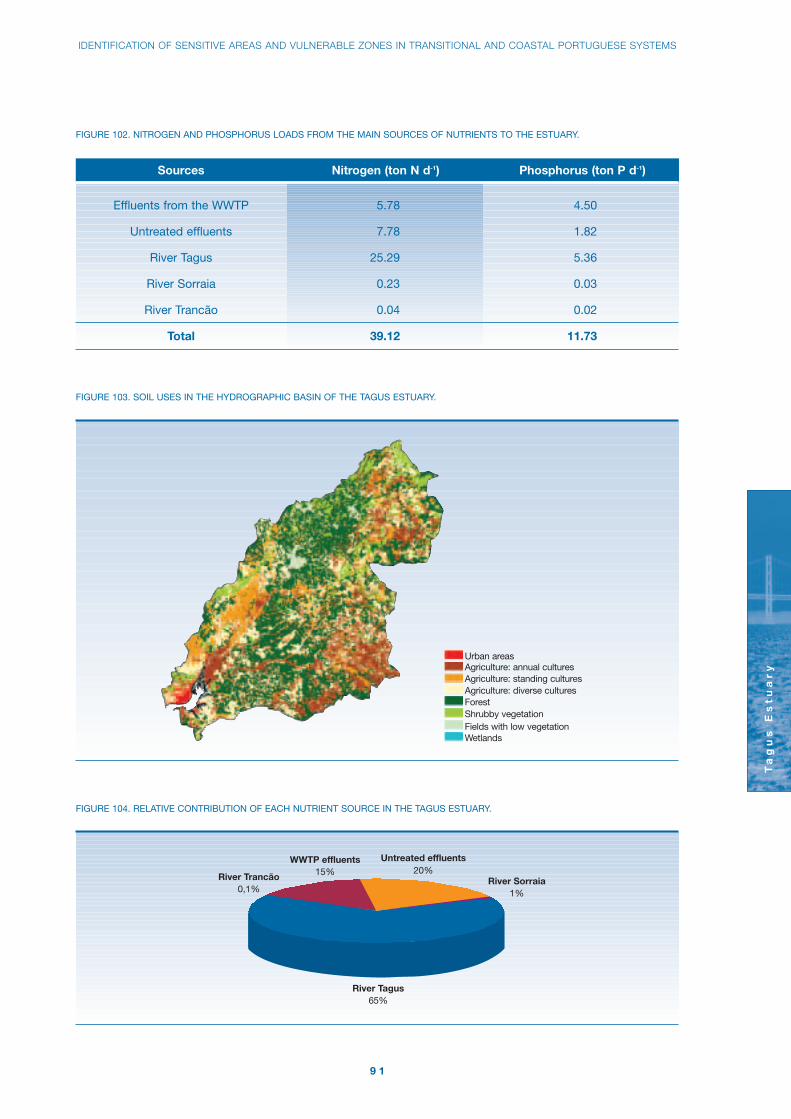
IDENTIFICATION OF SENSITIVE AREAS AND VULNERABLE ZONES IN TRANSITIONAL AND COASTAL PORTUGUESE SYSTEMS
Ta
gu
s E
st
ua
ry
9 1
FIGURE 102. NITROGEN AND PHOSPHORUS LOADS FROM THE MAIN SOURCES OF NUTRIENTS TO THE ESTUARY.
FIGURE 103. SOIL USES IN THE HYDROGRAPHIC BASIN OF THE TAGUS ESTUARY.
Sources Nitrogen (ton N d-1) Phosphorus (ton P d-1)
Effluents from the WWTP 5.78 4.50
Untreated effluents 7.78 1.82
River Tagus 25.29 5.36
River Sorraia 0.23 0.03
River Trancão 0.04 0.02
Total 39.12 11.73
Urban areasAgriculture: annual culturesAgriculture: standing culturesAgriculture: diverse culturesForestShrubby vegetationFields with low vegetationWetlands
FIGURE 104. RELATIVE CONTRIBUTION OF EACH NUTRIENT SOURCE IN THE TAGUS ESTUARY.
0,1%River Trancão 15%
WWTP effluents20%
Untreated effluents
1%River Sorraia
65%River Tagus

FIGURE 105. NITRATE CONCENTRATION IN THE TAGUS ESTUARY.
0.0
0.5
1.0
1.5
2.0
2.5
3.0
3.5
4.0
4.5
5.0
5.5
6.0
6.5
Jan Feb Mar Apr May Jun Jul Aug Sep Oct Nov Dec
Nit
rate
co
ncen
trat
ion
(mg
l-1 )
Ta
gu
s E
st
ua
ry
9 2
no thresholds are considered in the NEEA
methodology, to classify the nutrient inputs
to the Tagus estuary a heuristic set of ranges
was considered, based on the total load
of nutrients into the estuary and the
relative contribution of anthropogenic sources
(Figure 11). In order to determine the relative
contribution of anthropogenic sources and
ocean exchanges to the overall dissolved
nitrogen concentration, the loading-susceptibility
model described previously was applied. The
Human Influence determined by the model
is about 61%, which falls into the Moderate
category. The nutrient inputs in the Tagus
estuary are therefore considered to be
moderate. Figure 104 shows the relative
contribution of each nutrient source into the
estuary.

IDENTIFICATION OF SENSITIVE AREAS AND VULNERABLE ZONES IN TRANSITIONAL AND COASTAL PORTUGUESE SYSTEMS
Ta
gu
s E
st
ua
ry
9 3
FIGURE 106. RESULTS OF THE NEEA INDEX APPLICATION TO THE TAGUS ESTUARY. SLE: SYMPTOM LEVEL EXPRESSION; EAR: ESTUARY
AGGREGATION RULES; PSM: PRIMARY SYMPTOMS METHOD; SSM: SECONDARY SYMPTOMS METHOD.
Overall
Human
Influence
(OHI)
Future
Outlook for
future
conditions
(DFO)
Moderate
Low
Low
PSM
Susceptibility
Nutrient inputs
Future nutrient
pressures
Overall
Eutrophic
Condition
(OEC)
0.33
Moderate
0.12
Low
Low
susceptibility
Improve LowFuture nutrient pressures decrease
Moderate nutrient input
Indices Methods Parameters/Value/EAR Index category
Chlorophyll a 0.997
Epiphytes 0
Macroalgae 0
Dissolved oxygen 0.12 Low
Submerged aquatic -
vegetation
Nuisance and toxic 0
blooms
Dilution potential High
Flushing potential Moderate
SSM
Taking into account the ERM report which
classifies the North part of the Tagus estuary as
a vulnerable zone, Figure 105 shows the values
obtained for the nitrate concentration in the
entire estuary. All values are an order of
magnitude below the threshold (50 mg l-1)
defined in Directive 91/676/EEC.
DETERMINATION OF FUTUREOUTLOOK
Changes in the treatment level (from secondary
to tertiary) are projected for some of the WWTP
in estuary, in order to remove nutrients
(particularly phosphorus) more efficiently. In the
South shore, within the next 15 years the
population will be served with five new WWTP,
which will be able to treat the sewage of about
412 000 population equivalents. Also, existing
WWTP are able to treat more sewage than at
present, since these plants are not working at
maximum capacity. Thus, it is considered that
future nutrient loading to the estuary will be
significantly reduced, particularly from the
South shore.
SUMMARY OF THE NEEA INDEXAPPLICATION
Figure 106 summarises the results obtained for
the NEEA index application in the Tagus
estuary.
CONCLUSIONS
The following conclusions can be drawn from
the NEEA index application to the Tagus
estuary:
INAG - INSTITUTO DA ÁGUA • IMAR - INSTITUTE OF MARINE RESEARCH
Ta
gu
s E
st
ua
ry
9 4
• The Tagus is a well-studied system, which has
been continuously monitored since 1980;
• The OEC index classifies the estuary in the
“Moderate Low” category. This result is
strongly influenced by the "High" level of
expression obtained for chlorophyll a in the
mixing and seawater zones. Despite this
classification, the monthly median values of
chlorophyll a do not exceed the threshold
defined for the OEC "Medium" category.
Furthermore, the high values obtained in the
early 1980’s are not currently detected. The
other primary and secondary symptoms
(dissolved oxygen) are not observed or have
a low level of expression in the estuary;
• The Tagus estuary is a well-mixed estuary
with a “High” dilution potential and a
“Moderate” freshwater inflow. Nutrient inputs
to the estuary are considered “Low” with a
tendency to be even lower in the future. The
OHI index classifies the impact of the
nutrient inputs in the estuary as “Low”;
• The nitrate concentration in the water is far
below the limit considered in the Directive
91/676/EEC;
• The future nutrient pressure decrease (DFO)
and the values obtained for the other indices
used support the conclusion that neither the
Tagus estuary nor parts of the estuary
should be listed as sensitive areas as
regards entrophication (Directive 91/271/EEC)
or vulnerable zones (Directive 91/676/EEC).
KEY REFERENCES
Alvera-Azcarate, A., Ferreira, J.G., Nunes, J.P.,
2003. Modelling eutrophication in mesotidal
and macrotidal estuaries. The role of intertidal
seaweeds. Estuarine, Coastal and Shelf Science,
53, 1-10.
Cabeçadas, L., 1999. Phytoplankton in the
Tagus estuary (Portugal). Oceanologica Acta,
22(2) , 205-214.
Cabeçadas, L., Brogueira, M.J., Cabeçadas, G.,
1999. Phytoplankton spring bloom in the Tagus
coastal waters: hydrological and chemical
conditions. Aquatic Ecology, 33(3), 243-250.
Cabrita, M.T., Catarino, F., Slawyk, G., 1999.
Interactions of light, temperature and inorganic
nitrogen in controlling planktonic nitrogen
utilisation in the Tagus estuary. Aquatic Ecology,
33(3), 251-261.
Cabrita, M.T., Brotas, V., 2000. Seasonal
variation in denitrification and dissolved nitrogen
fluxes in intertidal sediments of the Tagus
estuary, Portugal. Marine Ecology Progress
Series, 202, 51-65.
Simas, T., Nunes, J.P., Ferreira, J.G., 2001.
Effects of global climate change on coastal salt
marshes. Ecological Modelling, 139(1), 1-15.
Serôdio, J., Catarino, F., 2000. Modelling
the primary productivity of intertidal
microphytobenthos: time scales of variability
and effects of migratory rhythms. Marine
Ecology Progress Series, 192, 13–30.
References for grey literature consulted
for this chapter may be found at
http://www.imar.pt/perfect/
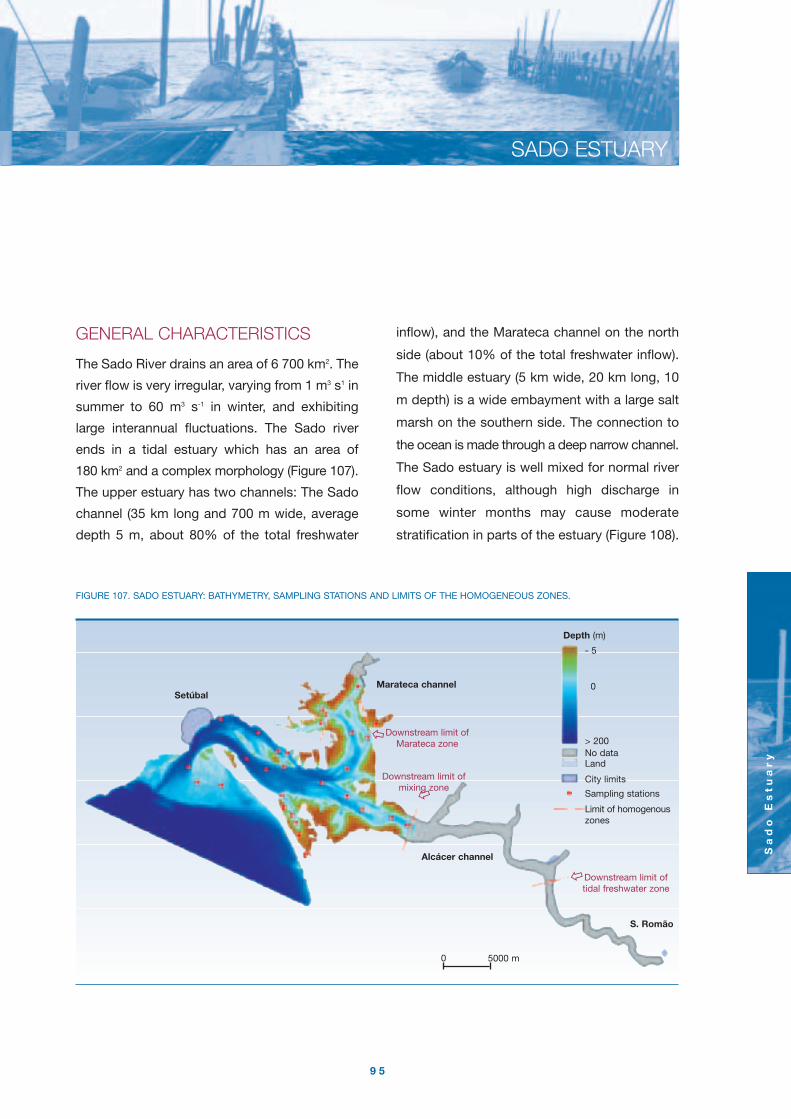
SADO ESTUARY
Sa
do
Es
tu
ar
y
9 5
GENERAL CHARACTERISTICS
The Sado River drains an area of 6 700 km2. The
river flow is very irregular, varying from 1 m3 s1 in
summer to 60 m3 s-1 in winter, and exhibiting
large interannual fluctuations. The Sado river
ends in a tidal estuary which has an area of
180 km2 and a complex morphology (Figure 107).
The upper estuary has two channels: The Sado
channel (35 km long and 700 m wide, average
depth 5 m, about 80% of the total freshwater
inflow), and the Marateca channel on the north
side (about 10% of the total freshwater inflow).
The middle estuary (5 km wide, 20 km long, 10
m depth) is a wide embayment with a large salt
marsh on the southern side. The connection to
the ocean is made through a deep narrow channel.
The Sado estuary is well mixed for normal river
flow conditions, although high discharge in
some winter months may cause moderate
stratification in parts of the estuary (Figure 108).
FIGURE 107. SADO ESTUARY: BATHYMETRY, SAMPLING STATIONS AND LIMITS OF THE HOMOGENEOUS ZONES.
Setúbal
Depth (m)
- 5
0
> 200No dataLand
City limits
Sampling stations
Limit of homogenouszones
Marateca channel
Alcácer channel
S. Romão
�
�
Downstream limit of Marateca zone
Downstream limit of mixing zone
�Downstream limit of tidal freshwater zone
0 5000 m
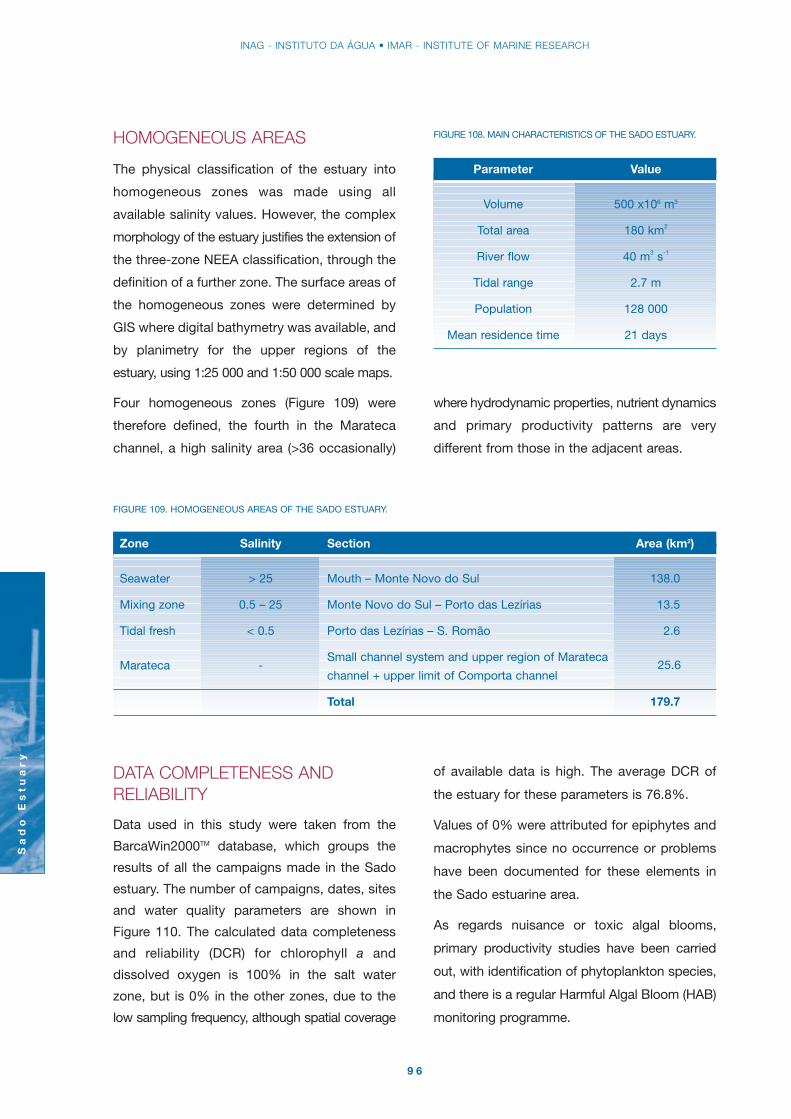
INAG - INSTITUTO DA ÁGUA • IMAR - INSTITUTE OF MARINE RESEARCH
Sa
do
Es
tu
ar
y
9 6
DATA COMPLETENESS ANDRELIABILITY
Data used in this study were taken from the
BarcaWin2000TM database, which groups the
results of all the campaigns made in the Sado
estuary. The number of campaigns, dates, sites
and water quality parameters are shown in
Figure 110. The calculated data completeness
and reliability (DCR) for chlorophyll a and
dissolved oxygen is 100% in the salt water
zone, but is 0% in the other zones, due to the
low sampling frequency, although spatial coverage
of available data is high. The average DCR of
the estuary for these parameters is 76.8%.
Values of 0% were attributed for epiphytes and
macrophytes since no occurrence or problems
have been documented for these elements in
the Sado estuarine area.
As regards nuisance or toxic algal blooms,
primary productivity studies have been carried
out, with identification of phytoplankton species,
and there is a regular Harmful Algal Bloom (HAB)
monitoring programme.
HOMOGENEOUS AREAS
The physical classification of the estuary into
homogeneous zones was made using all
available salinity values. However, the complex
morphology of the estuary justifies the extension of
the three-zone NEEA classification, through the
definition of a further zone. The surface areas of
the homogeneous zones were determined by
GIS where digital bathymetry was available, and
by planimetry for the upper regions of the
estuary, using 1:25 000 and 1:50 000 scale maps.
Four homogeneous zones (Figure 109) were
therefore defined, the fourth in the Marateca
channel, a high salinity area (>36 occasionally)
where hydrodynamic properties, nutrient dynamics
and primary productivity patterns are very
different from those in the adjacent areas.
FIGURE 108. MAIN CHARACTERISTICS OF THE SADO ESTUARY.
Parameter Value
Volume 500 x106 m3
Total area 180 km2
River flow 40 m3 s-1
Tidal range 2.7 m
Population 128 000
Mean residence time 21 days
FIGURE 109. HOMOGENEOUS AREAS OF THE SADO ESTUARY.
Zone Salinity Section Area (km2)
Seawater > 25 Mouth – Monte Novo do Sul 138.0
Mixing zone 0.5 – 25 Monte Novo do Sul – Porto das Lezírias 13.5
Tidal fresh < 0.5 Porto das Lezírias – S. Romão 2.6
Small channel system and upper region of Marateca
channel + upper limit of Comporta channel
Total 179.7
Marateca - 25.6
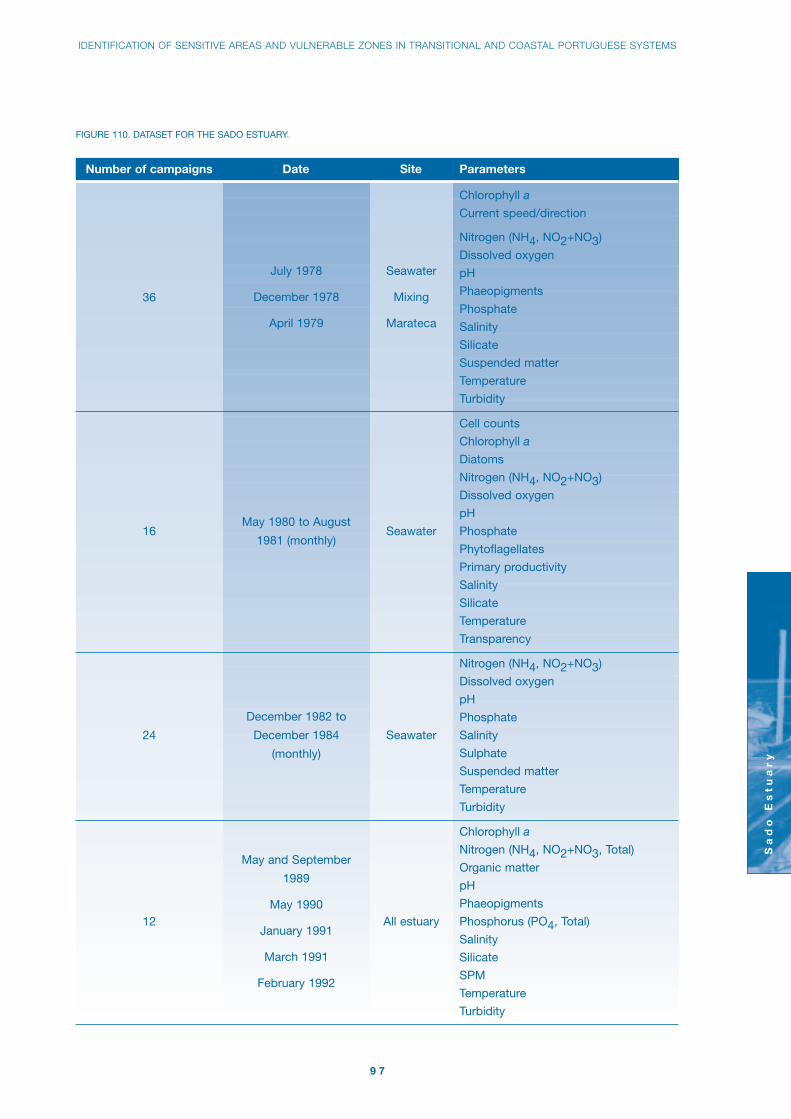
IDENTIFICATION OF SENSITIVE AREAS AND VULNERABLE ZONES IN TRANSITIONAL AND COASTAL PORTUGUESE SYSTEMS
Sa
do
Es
tu
ar
y
9 7
FIGURE 110. DATASET FOR THE SADO ESTUARY.
Number of campaigns Date Site Parameters
16
24
July 1978
December 1978
April 1979
May 1980 to August
1981 (monthly)
December 1982 to
December 1984
(monthly)
Seawater
Mixing
Marateca
Seawater
Seawater
Chlorophyll a
Current speed/direction
Nitrogen (NH4, NO2+NO3)
Dissolved oxygen
pH
Phaeopigments
Phosphate
Salinity
Silicate
Suspended matter
Temperature
Turbidity
Cell counts
Chlorophyll a
Diatoms
Nitrogen (NH4, NO2+NO3)
Dissolved oxygen
pH
Phosphate
Phytoflagellates
Primary productivity
Salinity
Silicate
Temperature
Transparency
Nitrogen (NH4, NO2+NO3)
Dissolved oxygen
pH
Phosphate
Salinity
Sulphate
Suspended matter
Temperature
Turbidity
12
May and September
1989
May 1990
January 1991
March 1991
February 1992
All estuary
Chlorophyll a
Nitrogen (NH4, NO2+NO3, Total)
Organic matter
pH
Phaeopigments
Phosphorus (PO4, Total)
Salinity
Silicate
SPM
Temperature
Turbidity
36
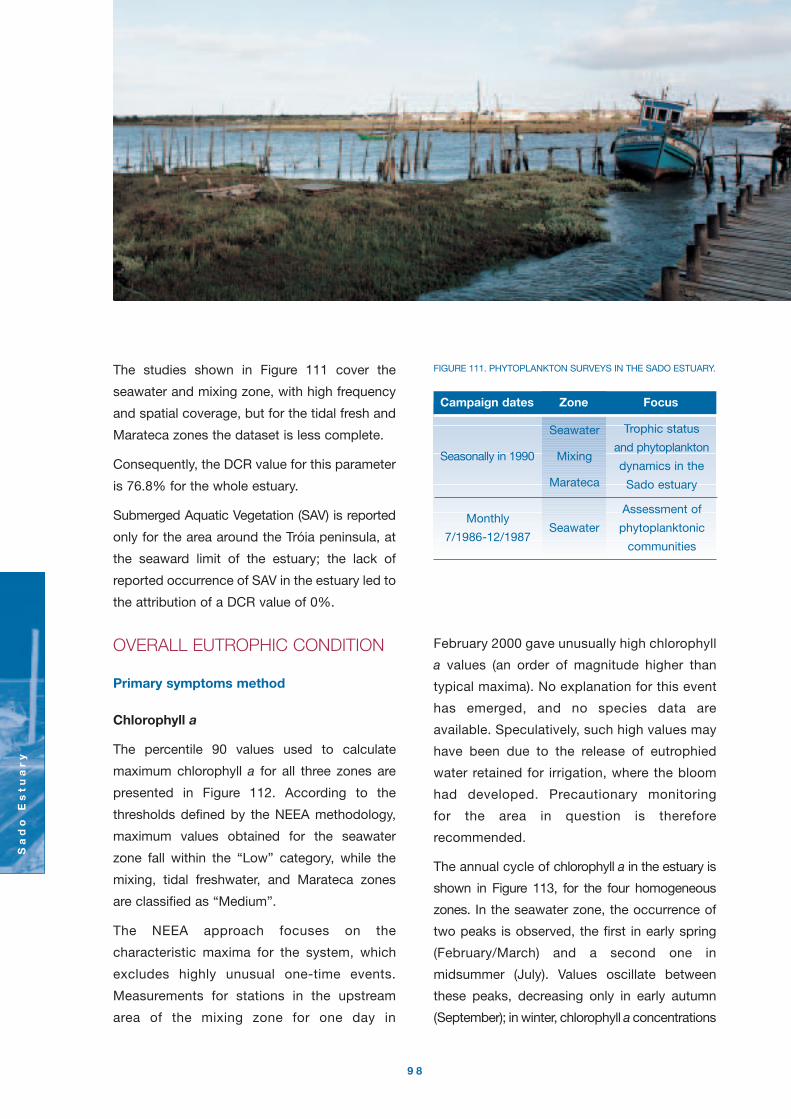
Sa
do
Es
tu
ar
y
9 8
The studies shown in Figure 111 cover the
seawater and mixing zone, with high frequency
and spatial coverage, but for the tidal fresh and
Marateca zones the dataset is less complete.
Consequently, the DCR value for this parameter
is 76.8% for the whole estuary.
Submerged Aquatic Vegetation (SAV) is reported
only for the area around the Tróia peninsula, at
the seaward limit of the estuary; the lack of
reported occurrence of SAV in the estuary led to
the attribution of a DCR value of 0%.
OVERALL EUTROPHIC CONDITION
Primary symptoms method
Chlorophyll a
The percentile 90 values used to calculate
maximum chlorophyll a for all three zones are
presented in Figure 112. According to the
thresholds defined by the NEEA methodology,
maximum values obtained for the seawater
zone fall within the “Low” category, while the
mixing, tidal freshwater, and Marateca zones
are classified as “Medium”.
The NEEA approach focuses on the
characteristic maxima for the system, which
excludes highly unusual one-time events.
Measurements for stations in the upstream
area of the mixing zone for one day in
February 2000 gave unusually high chlorophyll
a values (an order of magnitude higher than
typical maxima). No explanation for this event
has emerged, and no species data are
available. Speculatively, such high values may
have been due to the release of eutrophied
water retained for irrigation, where the bloom
had developed. Precautionary monitoring
for the area in question is therefore
recommended.
The annual cycle of chlorophyll a in the estuary is
shown in Figure 113, for the four homogeneous
zones. In the seawater zone, the occurrence of
two peaks is observed, the first in early spring
(February/March) and a second one in
midsummer (July). Values oscillate between
these peaks, decreasing only in early autumn
(September); in winter, chlorophyll a concentrations
FIGURE 111. PHYTOPLANKTON SURVEYS IN THE SADO ESTUARY.
Campaign dates Zone Focus
Seawater
Mixing
Marateca
Seasonally in 1990
Monthly
7/1986-12/1987Seawater
Trophic status
and phytoplankton
dynamics in the
Sado estuary
Assessment of
phytoplanktonic
communities

IDENTIFICATION OF SENSITIVE AREAS AND VULNERABLE ZONES IN TRANSITIONAL AND COASTAL PORTUGUESE SYSTEMS
Sa
do
Es
tu
ar
y
9 9
FIGURE 112. FREQUENCY DISTRIBUTION FOR CHLOROPHYLL IN THE FOUR ZONES OF THE SADO ESTUARY.
FIGURE 113. ANNUAL CYCLE OF CHLOROPHYLL IN THE SADO ESTUARY.
Seawater zone
0
20
40
60
80
100
120
140
5 10 15 20 250102030405060708090100
Freq
uenc
y
Mixing zone
0
2
4
6
8
10
12
14
5 10 15 20 250102030405060708090100
Cum
ulat
ive
per
cent
age
Tidal fresh zone
0
0.5
1
1.5
2
2.5
5 10 15 20 250102030405060708090100
Freq
uenc
y
Marateca zone
0
1
2
3
4
5
6
7
5 10 15 20 250102030405060708090100
Cum
ulat
ive
per
cent
age
Frequency
Cumulative %
0
20
Jan May Sep
15
10
5low
medium
Mixing zoneSeawater zone
0123456789
Apr Jun Aug Oct Dec
low
medium
Feb
02468
10121416
Feb May
low
medium
Tidal fresh zone
02468
101214
Jan May Sep
lowmedium
Marateca zone
are “Low”. Although the available dataset for
the other zones is limited, the annual cycle
appears to be similar.
To examine the multi-annual changes in
chlorophyll a, a trend analysis was performed
(Figure 114). In the seawater zone, the values

INAG - INSTITUTO DA ÁGUA • IMAR - INSTITUTE OF MARINE RESEARCH
Sa
do
Es
tu
ar
y
1 0 0
The summary of the results obtained for the
NEEA index application in each salinity zone is
presented in Figure 115.
Epiphytes
There is no available literature on epiphytes
in the Sado, and expert consultations indicate
that no problems with epiphytes have been
observed within the estuary. The value used
for epiphytes in each zone was therefore
considered to be zero.
Macroalgae
No occurrence of problems with exceptional
macroalgal growth has been reported in the
literature or identified by experts. The value
used for this symptom in each zone equals
zero.
The aggregation of this information and the
determination of the primary symptom level of
expression value for the Sado estuary are
shown in Figure 116.
from 1978 to 1999 are very similar. Consequently,
despite higher concentrations in the early
1990’s, values remain “Low”. In the mixing
zone, where concentrations are higher, a
decreasing trend between 1989 and 1997 can
be observed. In Marateca, the last of the three
sampling years exhibits lowest concentrations.
However, due to the limited dataset, no trends
can be identified for the Marateca or tidal
freshwater zone.
FIGURE 114. SURFACE CHLOROPHYLL IN THE SADO ESTUARY.
0
5
10
15
20
25
30
35
1978 1980 1983 1986 1988 1991 1994 1997 1999
Low
Medium
MaratecaTidal freshSeawaterMixing
FIGURE 115. NEEA INDEX APPLICATION FOR THE CHLOROPHYLL PARAMETER IN THE SADO ESTUARY.
IF AND AND THENZONE Concentration Spatial coverage Occurrence Expression Value
Seawater Low Any Any Low 0.25
Mixing Medium High Periodic High 1
Tidal fresh Medium High Unknown Flag A 0.5
Marateca Medium Very low Periodic Low 0.25

IDENTIFICATION OF SENSITIVE AREAS AND VULNERABLE ZONES IN TRANSITIONAL AND COASTAL PORTUGUESE SYSTEMS
Sa
do
Es
tu
ar
y
1 0 1
FIGURE 116. NEEA INDEX APPLICATION FOR THE PRIMARY SYMPTOMS IN THE SADO ESTUARY.
Area (km2) Value (vij) Az/At x vijZone Salinity (Az) Chlorophyll a Macroalgae Epiphytes Chlorophyll a Macroalgae Epiphytes
Seawater > 25 138.0 0.25 0 0 0.19 0 0
Mixing 0.5 – 25 13.5 1.00 0 0 0.07 0 0
Tidal fresh < 0.5 2.6 0.50 0 0 0.01 0 0
Marateca - 25.6 0.25 0 0 0.03 0 0
Sum 179.7 - - - 0.31 0 0
Primary symptoms level of expression value for the estuary: 0.10 Low
Secondary symptoms method
Dissolved oxygen
Figure 118 presents the frequency distribution for
dissolved oxygen.
The tenth percentile value obtained for the
seawater zone is higher than the concentration
considered to indicate biological stress (5 mg l-1).
In the mixing zone, minimum values are below 5
mg l-1 (mostly in the upper region). For the tidal
freshwater and Marateca zone, all existing
dissolved oxygen concentration values are
higher than the threshold for biological stress.
The information about the dissolved oxygen
levels in the different zones is shown in Figure
117. These values suggest that, apart from the
mixing zone, no problems with low oxygen
levels occur in the estuary, leading to the
classification shown in Figure 119.
Submerged aquatic vegetation
Submerged aquatic vegetation (SAV) occurs in
the Sado estuary, essentially around the Tróia
peninsula (seawater zone). However, no information
about this element could be found in the
literature. Due to the absence of any reference to
the occurrence of problems with SAV losses, and
considering that the Sado estuary is a well known
system, the expression of this parameter was
considered to be “Unknown” in the seawater zone,
where SAV exists, and zero in the other zones.
FIGURE 117. ANALYSIS OF THE AVAILABLE DATASET FOR DISSOLVED OXYGEN (DO)*.
Zone Minimum DO Maximum DO Median DO
Seawater 4.8 11.6 7.2
Mixing 2.8 18.7** 7.6
Tidal fresh 5.3 10.5 6.6
Marateca 6.3 7.5 6.5
* All values in mg l-1
** Maximum due to a one-time event in February 2000
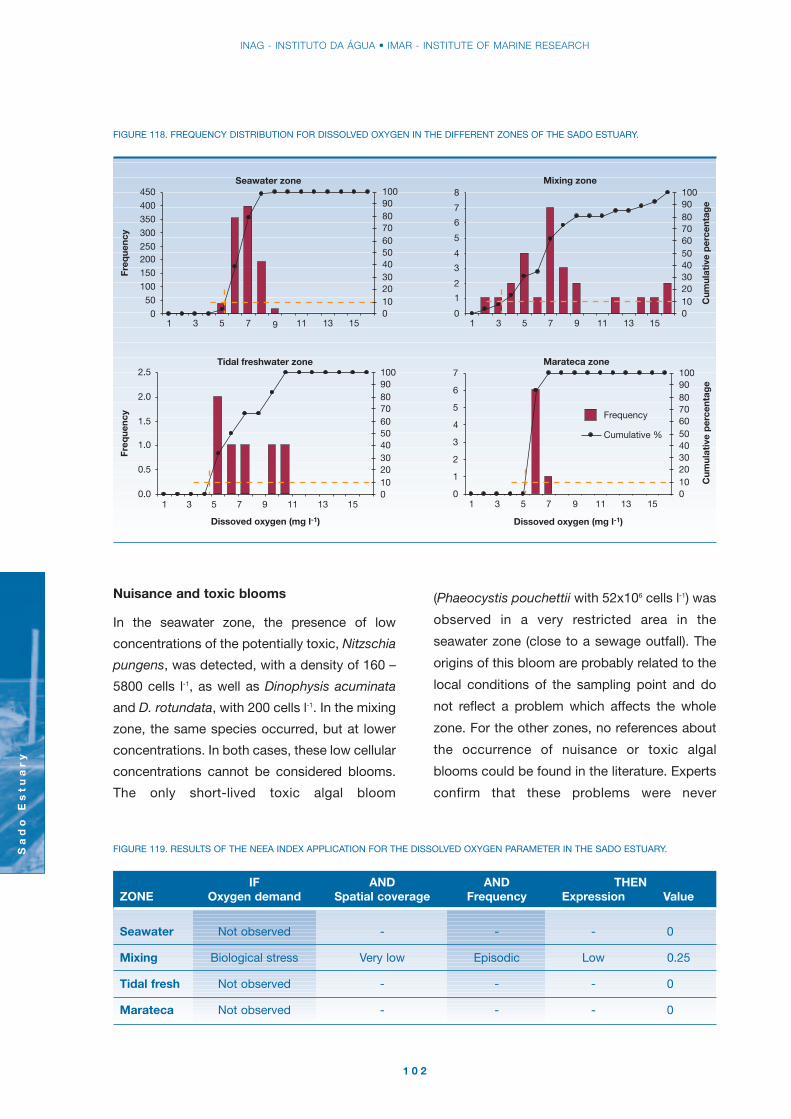
INAG - INSTITUTO DA ÁGUA • IMAR - INSTITUTE OF MARINE RESEARCH
Sa
do
Es
tu
ar
y
1 0 2
FIGURE 119. RESULTS OF THE NEEA INDEX APPLICATION FOR THE DISSOLVED OXYGEN PARAMETER IN THE SADO ESTUARY.
IF AND AND THENZONE Oxygen demand Spatial coverage Frequency Expression Value
Seawater Not observed - - - 0
Mixing Biological stress Very low Episodic Low 0.25
Tidal fresh Not observed - - - 0
Marateca Not observed - - - 0
FIGURE 118. FREQUENCY DISTRIBUTION FOR DISSOLVED OXYGEN IN THE DIFFERENT ZONES OF THE SADO ESTUARY.
Seawater zone
0
50
100
150
200250
300
350
400
450
1 3 5 7 9 11 13 150102030405060708090100
Freq
uenc
y
Mixing zone
0
1
2
3
4
5
6
7
8
1 3 5 7 9 11 13 150102030405060708090100
Cum
ulat
ive
per
cent
age
Dissoved oxygen (mg l-1)
Tidal freshwater zone
0.0
0.5
1.0
1.5
2.0
2.5
1 3 5 7 9 11 13 150102030405060708090100
Freq
uenc
y
Marateca zone
Dissoved oxygen (mg l-1)
0
1
2
3
4
5
6
7
1 3 5 7 9 11 13 150102030405060708090100
Cum
ulat
ive
per
cent
age
Frequency
Cumulative %
Nuisance and toxic blooms
In the seawater zone, the presence of low
concentrations of the potentially toxic, Nitzschia
pungens, was detected, with a density of 160 –
5800 cells l-1, as well as Dinophysis acuminata
and D. rotundata, with 200 cells l-1. In the mixing
zone, the same species occurred, but at lower
concentrations. In both cases, these low cellular
concentrations cannot be considered blooms.
The only short-lived toxic algal bloom
(Phaeocystis pouchettii with 52x106 cells l-1) was
observed in a very restricted area in the
seawater zone (close to a sewage outfall). The
origins of this bloom are probably related to the
local conditions of the sampling point and do
not reflect a problem which affects the whole
zone. For the other zones, no references about
the occurrence of nuisance or toxic algal
blooms could be found in the literature. Experts
confirm that these problems were never
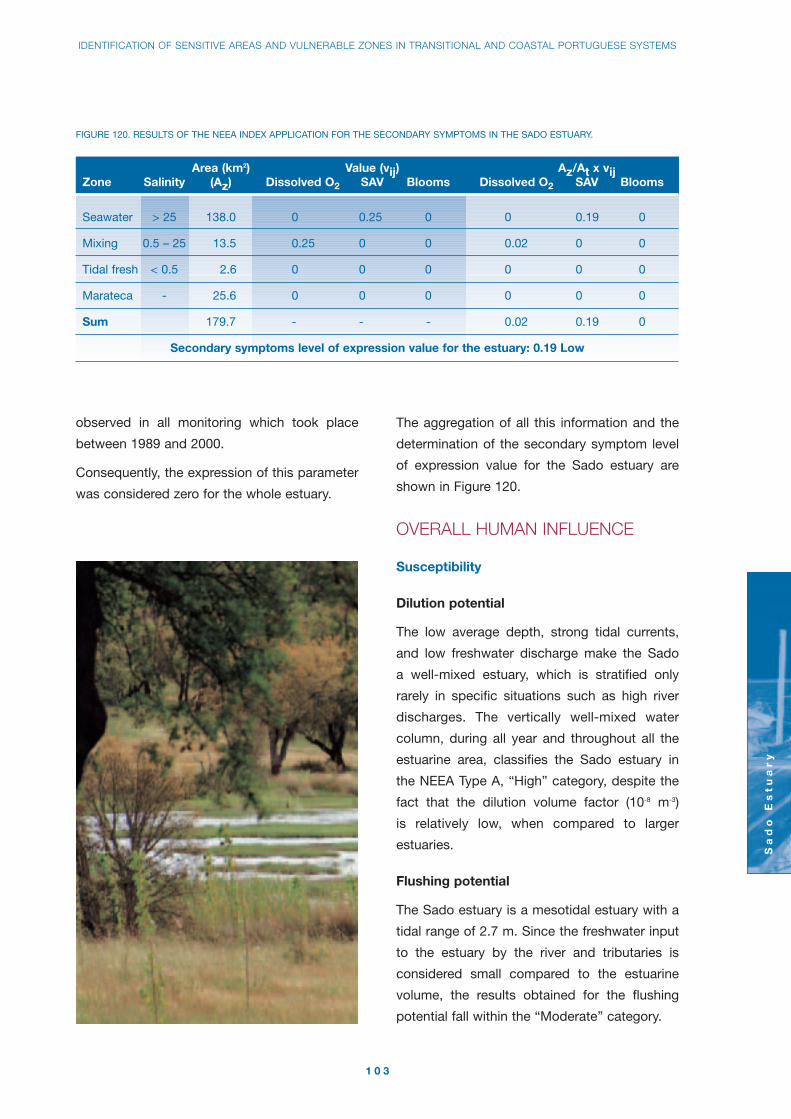
IDENTIFICATION OF SENSITIVE AREAS AND VULNERABLE ZONES IN TRANSITIONAL AND COASTAL PORTUGUESE SYSTEMS
Sa
do
Es
tu
ar
y
1 0 3
observed in all monitoring which took place
between 1989 and 2000.
Consequently, the expression of this parameter
was considered zero for the whole estuary.
The aggregation of all this information and the
determination of the secondary symptom level
of expression value for the Sado estuary are
shown in Figure 120.
OVERALL HUMAN INFLUENCE
Susceptibility
Dilution potential
The low average depth, strong tidal currents,
and low freshwater discharge make the Sado
a well-mixed estuary, which is stratified only
rarely in specific situations such as high river
discharges. The vertically well-mixed water
column, during all year and throughout all the
estuarine area, classifies the Sado estuary in
the NEEA Type A, “High” category, despite the
fact that the dilution volume factor (10-8 m-3)
is relatively low, when compared to larger
estuaries.
Flushing potential
The Sado estuary is a mesotidal estuary with a
tidal range of 2.7 m. Since the freshwater input
to the estuary by the river and tributaries is
considered small compared to the estuarine
volume, the results obtained for the flushing
potential fall within the “Moderate” category.
FIGURE 120. RESULTS OF THE NEEA INDEX APPLICATION FOR THE SECONDARY SYMPTOMS IN THE SADO ESTUARY.
Area (km2) Value (vij) Az/At x vijZone Salinity (Az) Dissolved O2 SAV Blooms Dissolved O2 SAV Blooms
Seawater > 25 138.0 0 0.25 0 0 0.19 0
Mixing 0.5 – 25 13.5 0.25 0 0 0.02 0 0
Tidal fresh < 0.5 2.6 0 0 0 0 0 0
Marateca - 25.6 0 0 0 0 0 0
Sum 179.7 - - - 0.02 0.19 0
Secondary symptoms level of expression value for the estuary: 0.19 Low

INAG - INSTITUTO DA ÁGUA • IMAR - INSTITUTE OF MARINE RESEARCH
Sa
do
Es
tu
ar
y
1 0 4
Nutrient inputs
The main nutrient sources to the estuary are:
1) Domestic effluents (from sewage treatment
plants or direct discharges);
2) Industrial effluents (from industrial treatment
plants or direct discharges);
3) Load from the Sado River, which aggregates
the main agricultural, domestic and industrial
sources from the river basin;
4) Load from the tributaries (Marateca and
Comporta channels).
The nutrient inputs into the Sado estuary
correspond to the sum of the loads generated in
the sub-watersheds that drain directly into the
estuary, and to the inputs by the Sado River.
Figure 122 shows the soil uses in the Sado
watershed.
To estimate the direct loads into the estuary,
urban and industrial point pollution sources were
quantified. Urban pollution sources also included
industrial sources, which discharge wastewater
FIGURE 122. SOIL USES IN THE SADO WATERSHED.
Urban areasAgriculture: annual culturesAgriculture: standing culturesAgriculture: diverse culturesForestShrubby vegetationFields with low vegetationWaterWetlands
FIGURE 121. NUTRIENT INPUTS FROM POINT SOURCES
(DOMESTIC AND INDUSTRIAL). ALL VALUES IN TON Y-1.
Source N input P input
Domestic effluents 191 41
Industrial effluents 1 262 355
into the urban sewage network. Domestic inputs
were estimated based on population-equivalents
weighted by the treatment level of the discharge.
For the industrial inputs included in this group,
the specific daily or annual load of the activity
and its working period were considered.
Setúbal, with about 114 000 inhabitants, and
Alcácer do Sal, with 14 000 inhabitants, are
responsible for 65% of the total domestic input.
Direct industrial sources are located mainly in
the seawater zone, around Setúbal (Mitrena
peninsula). The main industrial activities which
discharge nutrients located around the estuary
are:
0 10 20 30 km
N

IDENTIFICATION OF SENSITIVE AREAS AND VULNERABLE ZONES IN TRANSITIONAL AND COASTAL PORTUGUESE SYSTEMS
Sa
do
Es
tu
ar
y
1 0 5
Sado River Marateca channelWinter Summer Winter Summer
P input (ton month-1) 70 8 7 0
N input (ton month-1) 300 – 500 5 60 0
Nutrient
FIGURE 123. NUTRIENT INPUTS FROM THE MAIN FRESHWATER SOURCES.
• Paper and paper pulp;
• Fertilizers;
• Food industry (tomato paste and olive oil
production);
• Pig farms.
The results obtained for domestic and industrial
inputs for the direct sources described above
are shown in Figure 121.
Diffuse sources, such as agricultural activities,
contribute to the total estuarine nutrient input.
These sources are difficult to quantify, however,
their contribution is probably reduced,
compared to direct inputs. The most important
contributors to this type of pollution are located
either above the head of the estuary or in the
upper reaches, so the bulk of the load from
non-point sources is included in the estimation
of inputs from the Sado River. Tomato and rice
are the largest crops, with the greatest impact
probably associated to paddy fields, which cover
an area of approximately 10 000 ha in the Sado
watershed, and produce 5 000 to 6 500 kg ha-1.
The input from the Sado River and Marateca
channel (the most important tributary) was
calculated by multiplying the mean nutrient
concentrations by the freshwater flow, using
mean monthly values for winter and summer
months. The values are shown in Figure 123.
Considering that freshwater flow is high from
October to February and low from March to
September, an annual input of 2 335 ton of
nitrogen and 441 ton of phosphorus is obtained.
Since no thresholds are considered in the NEEA
methodology, to classify the nutrient inputs to
the Sado estuary a heuristic set of ranges was
considered, based on the total load of nutrients
into the estuary and the relative contribution
of anthropogenic sources (Figure 11). In order
to determine the relative contribution of
anthropogenic sources and ocean exchanges
to the overall dissolved nitrogen concentration, the
FIGURE 124. RELATIVE CONTRIBUTION OF EACH NITROGEN SOURCE TO THE SADO ESTUARY.
58%River input9%
Domestic effluents
33%Industrial effluents

Sa
do
Es
tu
ar
y
1 0 6
FIGURE 125. RESULTS OF THE NEEA INDEX APPLICATION TO THE SADO ESTUARY. SLE: SYMPTOM LEVEL EXPRESSION; EAR: ESTUARY
AGGREGATION RULES; PSM: PRIMARY SYMPTOMS METHOD; SSM: SECONDARY SYMPTOMS METHOD.
Overall
Human
Influence
(OHI)
Future
Outlook for
future
conditions
(DFO)
Low
Low
PSM
Susceptibility
Nutrient inputs
Future nutrient
pressures
Overall
Eutrophic
Condition
(OEC)
0.10
Low
0.19
Low
Low
susceptibility
Improve HighFuture nutrient pressures marked decrease
Moderate nutrient input
Indices Methods Parameters/Value/EAR Index value
Chlorophyll a 0.31
Epiphytes 0
Macroalgae 0
Dissolved oxygen 0.02
Submerged aquatic 0.19
vegetation
Nuisance and toxic 0
blooms
Dilution potential High
Flushing potential Moderate
SSM
loading-susceptibility model described previously
was applied. The Human Influence determined
by the model is about 45%, which falls into the
“Moderate” category. The nutrient inputs to the
Sado estuary are therefore considered moderate.
The contribution of each nitrogen source into
the estuary is shown in Figure 124.
DETERMINATION OF FUTUREOUTLOOK
The increase of percentage of treated wastewater
in the estuarine area, mainly in Setúbal, will
decrease nutrient inputs from these sources.
Since no significant population and industrial
IDENTIFICATION OF SENSITIVE AREAS AND VULNERABLE ZONES IN TRANSITIONAL AND COASTAL PORTUGUESE SYSTEMS
Sa
do
Es
tu
ar
y
1 0 7
development is expected, nutrient inputs will be
reduced significantly. Consequently, due
to decreased future nutrient pressures, an
improvement in eutrophic conditions and
nutrient related symptoms in the Sado estuary
is expected.
SUMMARY OF THE NEEA INDEXAPPLICATION
Figure 125 shows the results obtained for the
NEEA application.
CONCLUSIONS
The following conclusions can be drawn from
the NEEA index application to the Sado estuary:
• The Sado is a well-studied system, which
has been continuously monitored since
1978, but the research effort has not been
balanced throughout the system. A Surveillance
Monitoring programme is required on the
upper reaches and in the Marateca channel;
• The OEC index classifies the estuary in the
“Low” category;
• The Sado estuary is a well-mixed estuary with
a “High” dilution potential and a “Moderate”
flushing potential, behaving at low flows
almost like a coastal lagoon. Nutrient inputs
to the estuary are considered “Moderate”, with
a tendency to be lower in the future. The OHI
index classifies the impact of the nutrient
inputs in the estuary as “Moderate”;
• The nitrate concentration in the water is far
below the limit considered in the Directive
91/676/EEC;
• The future nutrient pressure decrease (DFO)
and the values obtained for the other indices
used support the conclusion that neither the
Sado estuary nor parts of the estuary should
be listed as sensitive areas as regards
eutrophication (Directive 91/271/EEC) or
vulnerable zones (Directive 91/676/EEC).
KEY REFERENCES
Cabeçadas, G., Nogueira, M., Brogueira, M. J.,
1999. Nutrient dynamics and productivity in
three European estuaries. Marine Pollution
Bulletin, 38(12) 1092-1096.
Cabeçadas, G., Brogueira, M. J., 1993. The
behaviour of phosphorus in the Sado estuary,
Portugal. Environmental Pollution, ICEP.2 345-352.
Cabeçadas, G., Brogueira, M. J., 1997.
Sediments in a Portuguese coastal area – pool
sizes of mobile and immobile forms of nitrogen
and phosphorus. Marine freshwater research,
48, 559.
Martins, F., Leitão, P. C., Silva, A. & Neves, R.,
2001. 3D modelling in the Sado estuary using a
new generic vertical discretization approach.
Oceanologica Acta, 24, 51-62.
Vale, C., Cortesão, C., Castro, O., Ferreira,
A.M., 1993. Suspended-sediment response to
pulses in river flow and semidiurnal and
fornightly tidal variations in a mesotidal estuary.
Marine Chemistry, 43, 21-31.
References for grey literature consulted
for this chapter may be found at
http://www.imar.pt/perfect/


MIRA ESTUARY
Mir
a E
st
ua
ry
1 0 9
GENERAL CHARACTERISTICS
The Mira river is 145 km long, drains an area of
1 576 km2, and is the largest river on the
Portuguese southwest coast. It ends in a narrow
entrenched estuary (Figure 126) about 30 km
long, 150 m wide in the lower part and 100 m in
the upper part. The mean depth is about 6 m,
reaching a maximum of 13 m (Figure 127). The
bottom geometry is similar to the bed of the
Mira river itself, with deeper areas often
associated with local curvature.
FIGURE 126. MIRA ESTUARY: BATHYMETRY, SAMPLING STATIONS AND LIMITS OF HOMOGENEOUS ZONES.
V. N. de Milfontes
Odemira
Depth (m)
- 5
0
> 200
0 1000 m
No data
Land
City limits
Sampling stations
Downstream limit of mixing zone
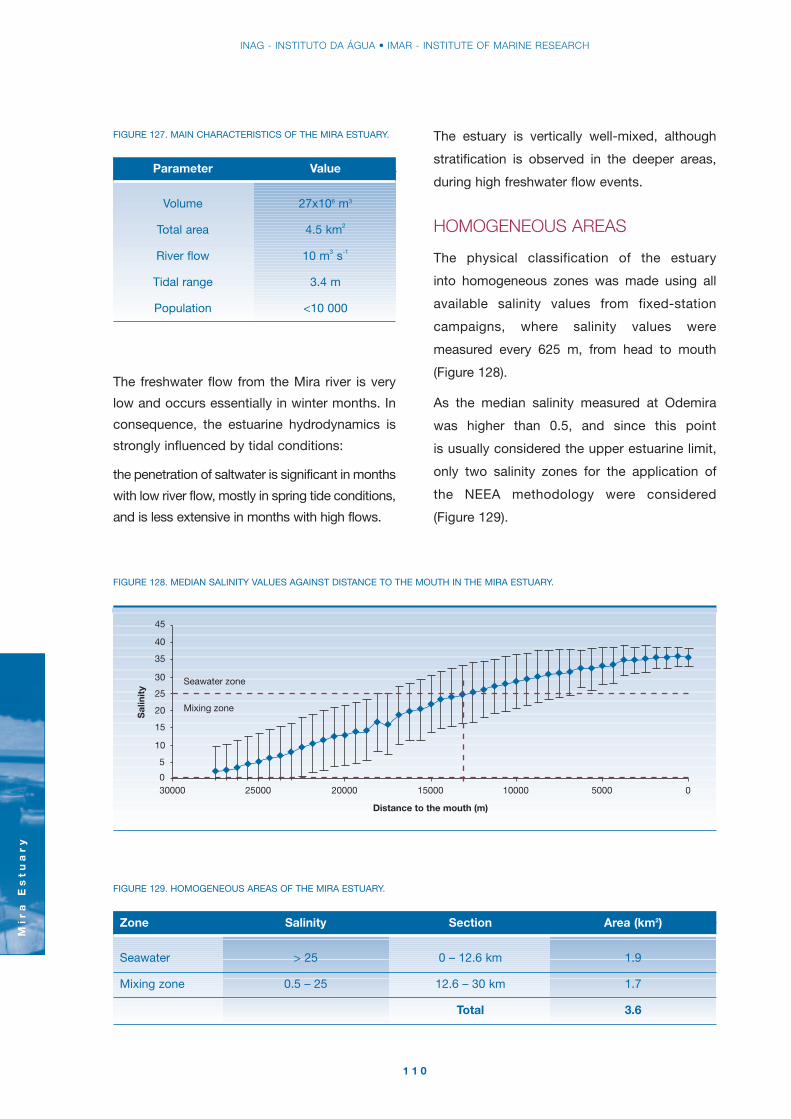
INAG - INSTITUTO DA ÁGUA • IMAR - INSTITUTE OF MARINE RESEARCH
Mir
a E
st
ua
ry
1 1 0
The freshwater flow from the Mira river is very
low and occurs essentially in winter months. In
consequence, the estuarine hydrodynamics is
strongly influenced by tidal conditions:
the penetration of saltwater is significant in months
with low river flow, mostly in spring tide conditions,
and is less extensive in months with high flows.
FIGURE 127. MAIN CHARACTERISTICS OF THE MIRA ESTUARY.
Parameter Value
Volume 27x106 m3
Total area 4.5 km2
River flow 10 m3 s-1
Tidal range 3.4 m
Population <10 000
0
5
10
15
20
25
30
35
40
45
0500010000150002000030000
Distance to the mouth (m)
Seawater zone
Mixing zone
25000
Sal
init
y
FIGURE 129. HOMOGENEOUS AREAS OF THE MIRA ESTUARY.
Zone Salinity Section Area (km2)
Seawater > 25 0 – 12.6 km 1.9
Mixing zone 0.5 – 25 12.6 – 30 km 1.7
Total 3.6
FIGURE 128. MEDIAN SALINITY VALUES AGAINST DISTANCE TO THE MOUTH IN THE MIRA ESTUARY.
The estuary is vertically well-mixed, although
stratification is observed in the deeper areas,
during high freshwater flow events.
HOMOGENEOUS AREAS
The physical classification of the estuary
into homogeneous zones was made using all
available salinity values from fixed-station
campaigns, where salinity values were
measured every 625 m, from head to mouth
(Figure 128).
As the median salinity measured at Odemira
was higher than 0.5, and since this point
is usually considered the upper estuarine limit,
only two salinity zones for the application of
the NEEA methodology were considered
(Figure 129).

IDENTIFICATION OF SENSITIVE AREAS AND VULNERABLE ZONES IN TRANSITIONAL AND COASTAL PORTUGUESE SYSTEMS
Mir
a E
st
ua
ry
1 1 1
DATA COMPLETENESS ANDRELIABILITY
The number of campaigns, dates and water
quality parameters are shown in Figure 130.
Chlorophyll a data exist for the entire estuary
over an annual cycle, but the calculated DCR
for chlorophyll a is 0%, because numerical
listings were unavailable, and no statistical
analysis could be performed.
The DCR for dissolved oxygen is 100% in the
two zones, due to the high spatial data cove-
rage and reasonable sampling frequency.
The DCR value for macrophytes and epiphytes
is 100% in the seawater zone, since a
representative area was sampled over an
annual cycle, but 0% for macrophytes in the
mixing zone, because this area was not sampled
(no epiphytic algae occur in the mixing zone, so
this parameter was not considered in this case).
The average DCR of the estuary for these
parameters is 50%. Values of 0% were obtained
for nuisance and toxic algal blooms and SAV
loss, since no problems have been identified in
the literature or by expert consultation.
* Only graphical data available
FIGURE 130. DATASETS FOR THE MIRA ESTUARY.
Number of campaigns Date Site Parameters
20 (Eulerian campaigns,
covering spring and
neap tides, in ebb
and flood conditions)
1
April, May and October
1983, January, February,
April, July, August,
October and
November 1984
April and May 1985,
October 1986,
January 1986
December 1990 to
October 1992
(monthly sampling)
Seawater
and mixing
zones
Seawater
and mixing
zones
Seawater
zone (0.05
km2 salt
marsh area)
Salinity
Temperature
Current velocity
Turbidity
Salinity
Temperature
Turbidity
Dissolved oxygen
Nitrite
Nitrate
Ammonium
DIP
DIN
Dissolved organic nitrogen
Particulate organic nitrogen
Dissolved Kjeldahl nitrogen
Total Kjeldahl nitrogen
1*February to October
1989
Whole
estuary
Temperature
Salinity
Chlorophyll a
Zooplankton
1* 1990Seawater
zoneSalt marsh vegetation
37 (Lagrangian
campaigns, covering
spring and neap tides,
in ebb and flood
conditions)

Mir
a E
st
ua
ry
1 1 2
OVERALL EUTROPHIC CONDITION
Primary symptoms method
Chlorophyll a
For the classification of the estuary in terms of
chlorophyll a concentrations, average monthly
values for seven stations in the mixing and
seawater zones, in low and high tide conditions
were available (Figure 131). These values show
an annual productivity cycle with the
occurrence of two peaks, one in spring
(April/May) and another in midsummer (July).
Chlorophyll a values observed in the mixing
zone are higher than in the seawater zone, and
the average monthly values are always lower
than the NEEA threshold of 5 µg l-1. In fact, the
average annual chlorophyll a concentration
observed in the entire estuary never exceeds
3 µg l-1. Despite the fact that only graphical
information is available, the data for the whole
estuary are unquestionably in the “Low”
category.
Epiphytes
Epiphytic algal mats (mainly Enteromorpha sp.
and Bostrichia sp.) growing on salt marsh
vascular plants, mainly Spartina maritima, are
documented for the Mira estuary. These
epiphytes form a complex matrix capable of
retaining fine sediments in suspension in the
water column. The distribution of epiphytes
according to sea-level elevation was analysed
in four categories (Sector I: 0.95m, Sector II:
1.25m, Sector III: 1.10m and Sector IV: 1.00m).
Seasonal variation of epiphyte dry weight on
Spartina maritima is shown in Figure 132.
High tide
0
1
2
3
Mar Apr May Jun Jul Aug Sep Oct
Low
Oct
Low tide
0
2
4
6
8
10
Mar Apr May Jun Jul Aug Sep
Low
Medium
FIGURE 131. ANNUAL CHLOROPHYLL CYCLE IN THE MIRA ESTUARY.

IDENTIFICATION OF SENSITIVE AREAS AND VULNERABLE ZONES IN TRANSITIONAL AND COASTAL PORTUGUESE SYSTEMS
Mir
a E
st
ua
ry
1 1 3
Epiphytes are an important element of salt
marshes in the Mira estuary, which are in
ecological equilibrium with other primary
producers, and do not show excessive growth
or adverse effects. Therefore the value used for
epiphytes equals zero at all zones.
Macroalgae
No occurrence of problems with exceptional
macroalgal growth has been reported in the
literature or identified by experts.
There is no evidence for a progressive increase in
filamentous seaweeds (Enteromorpha) associated
to a reduction of Zostera beds.
A comparative study carried out in the early
1990’s at Dutch, English, French and Portuguese
salt marsh sites concluded that algal mats were
a significant productivity factor in the Mira
estuary, as in English salt marshes (Tollesbury,
Essex). Observed productivity patterns were
similar, with low seasonal differences, due to
the different climatic conditions. In the Mira, no
excessive algal growth was identified. This is
explained by the reduced nutrient load, which is
reflected in low concentrations in the estuary.
The value used for this symptom in each zone
equals zero.
The aggregation of this information and the
determination of the primary symptom level of
expression value for the Mira estuary are shown
in Figure 133.
FIGURE 132. ANNUAL BIOMASS CYCLE OF SALTMARSH EPIPHYTES IN THE MIRA ESTUARY.
0
100
200
300
400
500
600
08/90 10/90 11/90 01/91 03/91 04/91 06/91 07/91 09/91
sector IV
sector III
sector II
sector I
Ep
iphy
tes
(g d
w m
-2)
FIGURE 133. NEEA INDEX APPLICATION FOR THE PRIMARY SYMPTOMS IN THE MIRA ESTUARY.
Area (km2) Value (vij) Az/At x vijZone Salinity (Az) Chlorophyll a Macroalgae Epiphytes Chlorophyll a Macroalgae Epiphytes
Seawater > 25 1.9 0 0 0 0 0 0
Mixing 0.5 – 25 1.7 0 0 0 0 0 0
Sum 3.6 - - - 0 0 0
Primary symptoms level of expression value for the estuary: 0 Low
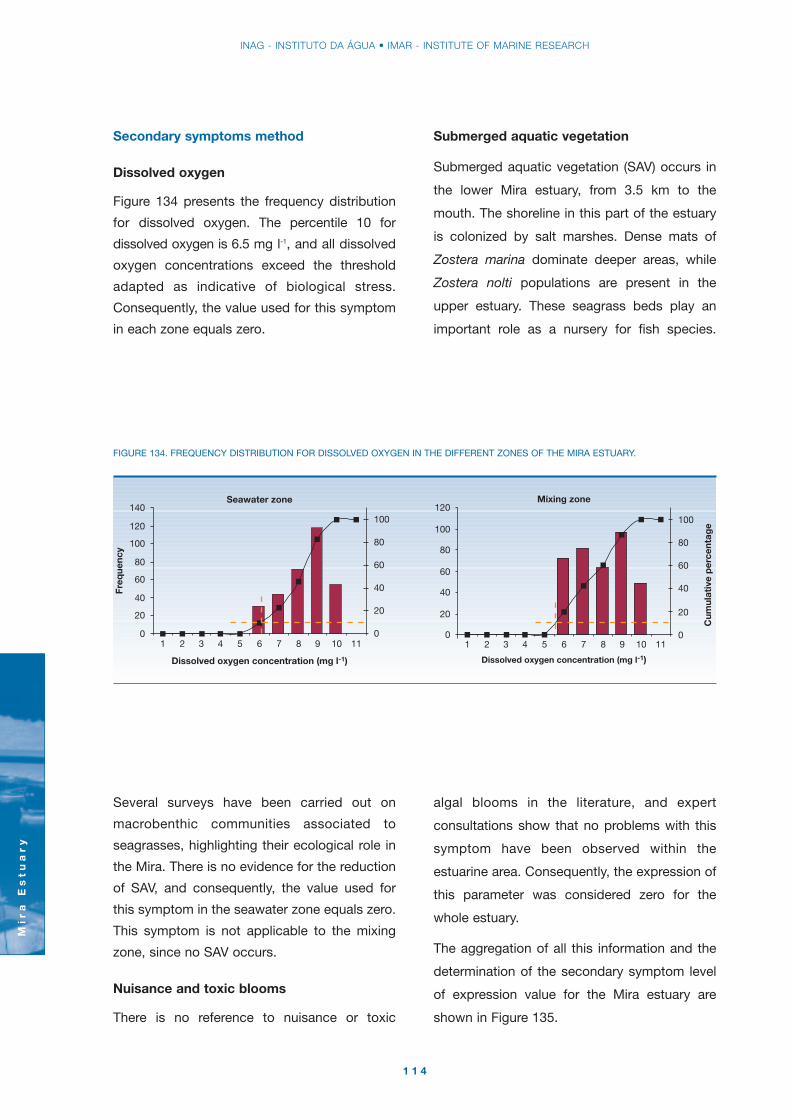
INAG - INSTITUTO DA ÁGUA • IMAR - INSTITUTE OF MARINE RESEARCH
Mir
a E
st
ua
ry
1 1 4
Several surveys have been carried out on
macrobenthic communities associated to
seagrasses, highlighting their ecological role in
the Mira. There is no evidence for the reduction
of SAV, and consequently, the value used for
this symptom in the seawater zone equals zero.
This symptom is not applicable to the mixing
zone, since no SAV occurs.
Nuisance and toxic blooms
There is no reference to nuisance or toxic
algal blooms in the literature, and expert
consultations show that no problems with this
symptom have been observed within the
estuarine area. Consequently, the expression of
this parameter was considered zero for the
whole estuary.
The aggregation of all this information and the
determination of the secondary symptom level
of expression value for the Mira estuary are
shown in Figure 135.
Secondary symptoms method
Dissolved oxygen
Figure 134 presents the frequency distribution
for dissolved oxygen. The percentile 10 for
dissolved oxygen is 6.5 mg l-1, and all dissolved
oxygen concentrations exceed the threshold
adapted as indicative of biological stress.
Consequently, the value used for this symptom
in each zone equals zero.
Submerged aquatic vegetation
Submerged aquatic vegetation (SAV) occurs in
the lower Mira estuary, from 3.5 km to the
mouth. The shoreline in this part of the estuary
is colonized by salt marshes. Dense mats of
Zostera marina dominate deeper areas, while
Zostera nolti populations are present in the
upper estuary. These seagrass beds play an
important role as a nursery for fish species.
FIGURE 134. FREQUENCY DISTRIBUTION FOR DISSOLVED OXYGEN IN THE DIFFERENT ZONES OF THE MIRA ESTUARY.
Seawater zone
0
20
40
60
80
100
120
140
1 2 3 4 5 6 7 8 9 10 11
Dissolved oxygen concentration (mg l-1)
0
20
40
60
80
100
Freq
uenc
y
Mixing zone
0
20
40
60
80
100
120
1 2 3 4 5 6 7 8 9 10 11
Dissolved oxygen concentration (mg l-1)
0
20
40
60
80
100
Cum
ulat
ive
per
cent
age

IDENTIFICATION OF SENSITIVE AREAS AND VULNERABLE ZONES IN TRANSITIONAL AND COASTAL PORTUGUESE SYSTEMS
Mir
a E
st
ua
ry
1 1 5
OVERALL HUMAN INFLUENCE
Susceptibility
Dilution potential
The NEEA dilution potential depends on the
vertical stratification of the estuary and its
dilution volume. The existence of stratification
can be calculated by determining the estuary
number, i.e. the percentage ratio of freshwater
inflow (Q) to tidal prism (Tp). If Q/Tp > 100%,
the estuary is stratified, if Q/Tp < 10%, the
estuary is well mixed, and intermediate values
correspond to partially mixed systems. The Mira
estuary is classified as well mixed, considering
an average annual freshwater flow of 5 m3 s-1
and a tidal prism of 8.8 x 10⁶ m3. Considering
that due to the reduced estuarine volume the
dilution volume is low, a “Moderate” dilution
potential is obtained.
Flushing potential
The Mira estuary is a mesotidal estuary with a
tidal range of 3.4 m. Since the freshwater input
to the estuary by the Mira (5 m3 s-1) is moderate
compared to the estuarine volume (27x106 m3),
the results obtained for the flushing potential fall
within the “High” category.
Nutrient inputs
The land cover in the Mira watershed is mainly
rural, reflecting the very low population density
in the Alentejo region. Towns are small and very
little industrial activity exists. Consequently, the
most important nutrient loads to the estuary are
the diffuse sources from agricultural activities
and small urban areas.
The main estuarine area is adjacent to Odemira,
where the population density is 14 inhabitants
km-2. The only sizeable towns located in the
banks of the estuary are Vila Nova de Milfontes
FIGURE 135. NEEA INDEX APPLICATION FOR THE SECONDARY SYMPTOMS IN THE MIRA ESTUARY.
Area (km2) Value (vij) Az/At x vijZone Salinity (Az) Dissolved O2 SAV Blooms Dissolved O2 SAV Blooms
Seawater > 25 1.9 0 0 0 0 0 0
Mixing 0.5 – 25 1.7 0 0 0 0 0 0
Sum 3.6 - - - 0 0 0
Secondary symptoms level of expression value for the estuary: 0 Low

INAG - INSTITUTO DA ÁGUA • IMAR - INSTITUTE OF MARINE RESEARCH
Mir
a E
st
ua
ry
1 1 6
and Odemira (2 000 inhabitants). Vila Nova de
Milfontes shows high population fluctuations
due to tourism, reaching a summer population
of 35 000. A wastewater treatment plant
(WWTP) treats wastewater since 1988, and
effluents are discharged directly into the Atlantic
Ocean.
To cover the total input from domestic effluents,
the whole population (26 000) from Odemira
council was considered. Of these, 12 000 are
served by a sewage network, 8 000 of which
with a WWTP. Nutrient loads were calculated
based on population equivalents (Figure 136).
The main sources of diffuse pollution are
agricultural activities and pig farming. Inputs
from these sources are difficult to estimate, but
considering the land cover in the watershed
(Figure 137) they are expected to be low. Only
12% of the area is occupied by tilled land, the
rest is forested or traditional cultures, which are
not irrigated or fertilized, such as cork oak.
The nutrient load from the Mira river is also
difficult to estimate, since water quality data
only exists for the Santa Clara reservoir
upstream of the estuarine limit. The load was
calculated by multiplying the average nitrogen
and phosphorus concentrations by the average
river flow. The values obtained (Figure 138) are
only indicative, since the water quality and river
flow dataset is very limited.
Since no water quality data for the ocean
adjacent to the estuary are available, the human
FIGURE 137. LAND COVER IN THE MIRA WATERSHED.
31%Oak
12%Tilled area
18%Others
26%Arable land
13%Forest
FIGURE 136. DOMESTIC NUTRIENT LOADS TO THE MIRA ESTUARY.
Nutrient export coefficient Nutrient load(kg pop eq-1y-1) (ton y-1)
N P N P
Linked to the sewage
network
Linked to network with
WWTP
Not linked to the sewage
network
Total 23 400 - - 28.7 4.0
PopulationTreatment
8 000 3.3 0.4 26.4 3.2
4 000 1.7 0.2 2.3 0.8
1 400 - - 0.0 0.0

IDENTIFICATION OF SENSITIVE AREAS AND VULNERABLE ZONES IN TRANSITIONAL AND COASTAL PORTUGUESE SYSTEMS
Mir
a E
st
ua
ry
1 1 7
contribution to total nutrient supply to the
estuary could not be calculated.
However, comparing the total nutrient loads
from urban sources and the Mira river (155.4
ton of N per year and 9.8 ton of P per year) to
the values obtained for other estuaries, and
considering that industrial loads are non-
existent and diffuse pollution is insignificant, the
nutrient input falls within the “Low” category.
DETERMINATION OF FUTUREOUTLOOK
Tourism had shown an increase in the past years
and this trend is likely to continue. However, the
pressure associated to this development appears
to be stabilized, since wastewater treatment will
be increased (for example, a submarine outfall is
planned for wastewater discharged from the WWTP
FIGURE 138. NUTRIENT LOADING FROM THE MIRA RIVER.
Average nutrient Nutrientconcentrations load
(mg l-1) (ton year-1)
N P N P
180 0.71 0.03 126.7 5.8
Averageannual
river flow(hm3)
at Vila Nova de Milfontes). Agricultural activity in
the region had decreased, and this trend is
expected to continue, causing a reduction in diffuse
loading. Consequently, no negative changes of
trophic conditions in the Mira estuary appear likely.
SUMMARY OF THE NEEA INDEXAPPLICATION
Figure 139 shows the results obtained for the
NEEA application.
Overall
Human
Influence
(OHI)
Future
Outlook for
future
conditions
(DFO)
Low
Low
PSM
Susceptibility
Nutrient inputs
Future nutrient
pressures
Overall
Eutrophic
Condition
(OEC)
Low
Low
Low
susceptibility
No ChangeFuture nutrient pressures no change
Low nutrient input
Indices Methods Parameters/Value/EAR Index value
Chlorophyll a 0.25
Epiphytes 0
Macroalgae 0
Dissolved oxygen 0
Submerged aquatic 0
vegetation
Nuisance and toxic 0
blooms
Dilution potential Moderate
Flushing potential High
SSM
FIGURE 139. RESULTS OF THE NEEA INDEX APPLICATION TO THE MIRA ESTUARY. SLE: SYMPTOM LEVEL EXPRESSION; EAR: ESTUARY
AGGREGATION RULES; PSM: PRIMARY SYMPTOMS METHOD; SSM: SECONDARY SYMPTOMS METHOD.
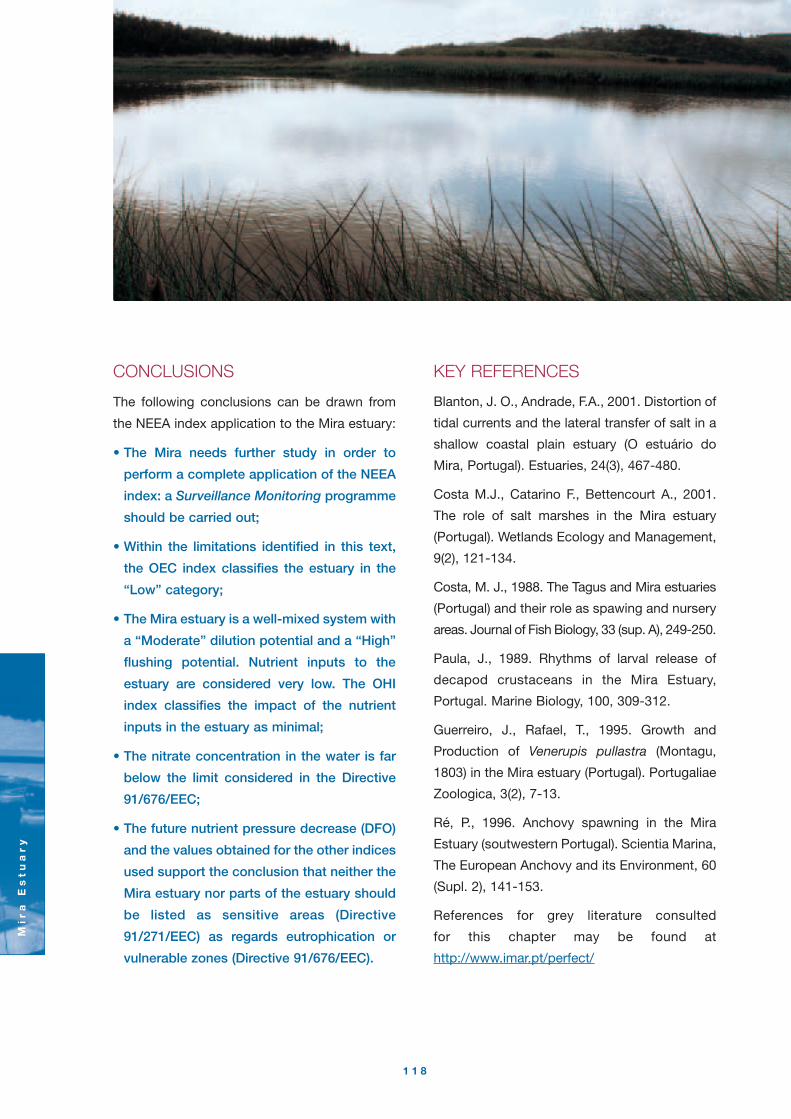
Mir
a E
st
ua
ry
1 1 8
CONCLUSIONS
The following conclusions can be drawn from
the NEEA index application to the Mira estuary:
• The Mira needs further study in order to
perform a complete application of the NEEA
index: a Surveillance Monitoring programme
should be carried out;
• Within the limitations identified in this text,
the OEC index classifies the estuary in the
“Low” category;
• The Mira estuary is a well-mixed system with
a “Moderate” dilution potential and a “High”
flushing potential. Nutrient inputs to the
estuary are considered very low. The OHI
index classifies the impact of the nutrient
inputs in the estuary as minimal;
• The nitrate concentration in the water is far
below the limit considered in the Directive
91/676/EEC;
• The future nutrient pressure decrease (DFO)
and the values obtained for the other indices
used support the conclusion that neither the
Mira estuary nor parts of the estuary should
be listed as sensitive areas (Directive
91/271/EEC) as regards eutrophication or
vulnerable zones (Directive 91/676/EEC).
KEY REFERENCES
Blanton, J. O., Andrade, F.A., 2001. Distortion of
tidal currents and the lateral transfer of salt in a
shallow coastal plain estuary (O estuário do
Mira, Portugal). Estuaries, 24(3), 467-480.
Costa M.J., Catarino F., Bettencourt A., 2001.
The role of salt marshes in the Mira estuary
(Portugal). Wetlands Ecology and Management,
9(2), 121-134.
Costa, M. J., 1988. The Tagus and Mira estuaries
(Portugal) and their role as spawing and nursery
areas. Journal of Fish Biology, 33 (sup. A), 249-250.
Paula, J., 1989. Rhythms of larval release of
decapod crustaceans in the Mira Estuary,
Portugal. Marine Biology, 100, 309-312.
Guerreiro, J., Rafael, T., 1995. Growth and
Production of Venerupis pullastra (Montagu,
1803) in the Mira estuary (Portugal). Portugaliae
Zoologica, 3(2), 7-13.
Ré, P., 1996. Anchovy spawning in the Mira
Estuary (soutwestern Portugal). Scientia Marina,
The European Anchovy and its Environment, 60
(Supl. 2), 141-153.
References for grey literature consulted
for this chapter may be found at
http://www.imar.pt/perfect/
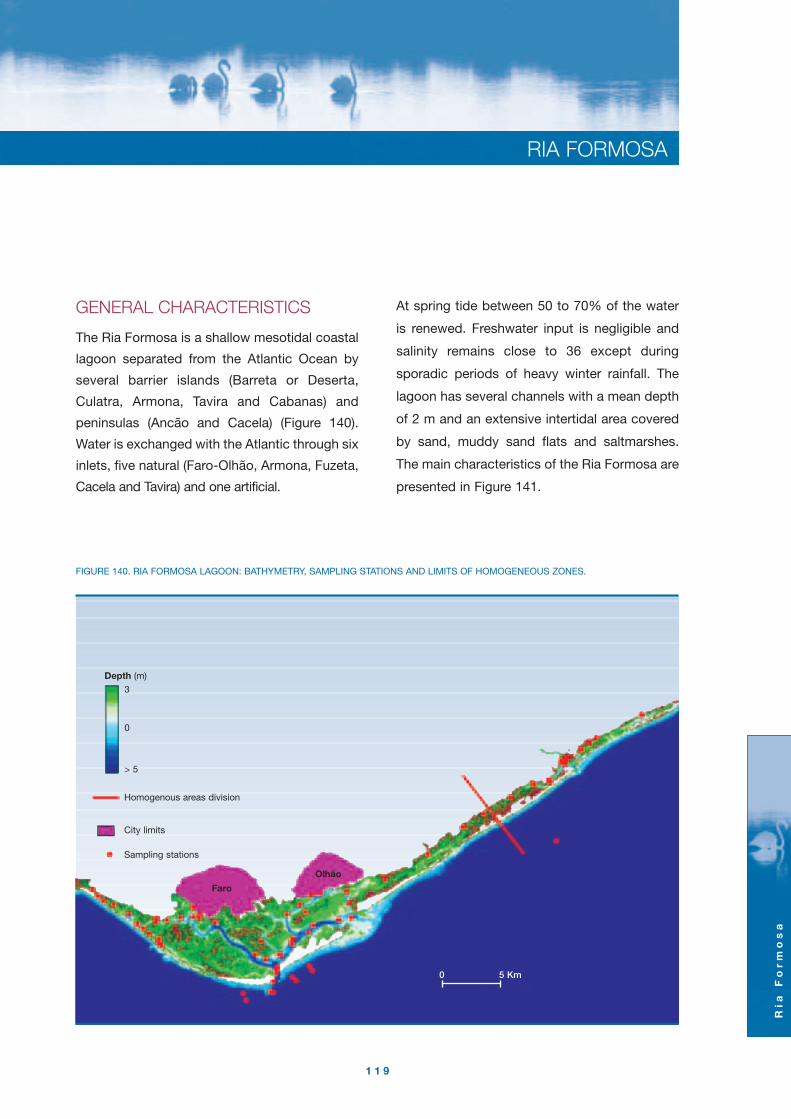
RIA FORMOSA
Ria
Fo
rm
os
a
1 1 9
GENERAL CHARACTERISTICS
The Ria Formosa is a shallow mesotidal coastal
lagoon separated from the Atlantic Ocean by
several barrier islands (Barreta or Deserta,
Culatra, Armona, Tavira and Cabanas) and
peninsulas (Ancão and Cacela) (Figure 140).
Water is exchanged with the Atlantic through six
inlets, five natural (Faro-Olhão, Armona, Fuzeta,
Cacela and Tavira) and one artificial.
At spring tide between 50 to 70% of the water
is renewed. Freshwater input is negligible and
salinity remains close to 36 except during
sporadic periods of heavy winter rainfall. The
lagoon has several channels with a mean depth
of 2 m and an extensive intertidal area covered
by sand, muddy sand flats and saltmarshes.
The main characteristics of the Ria Formosa are
presented in Figure 141.
FIGURE 140. RIA FORMOSA LAGOON: BATHYMETRY, SAMPLING STATIONS AND LIMITS OF HOMOGENEOUS ZONES.
Faro
Olhão
Depth (m)
3
0
> 5
0 5 Km
Homogenous areas division
City limits
Sampling stations

INAG - INSTITUTO DA ÁGUA • IMAR - INSTITUTE OF MARINE RESEARCH
Ria
Fo
rm
os
a
1 2 0
HOMOGENEOUS AREAS
In all the sampling stations where salinity values
were available, medians are never below 35
(Figure 142), thus all system should be classified
as a seawater zone. However, considering the
water circulation patterns in the system two
main zones can be distinguished: Faro-Olhão
zone and Tavira zone, linked to each other
by a narrow channel near the Fuzeta inlet
(Figure 140). These two areas were considered
independent homogeneous zones with areas of
45.3 and 4.2 km2 for the Faro – Olhão and
Tavira, respectively.
DATA COMPLETENESS ANDRELIABILITY
This study was made using the BarcaWin2000TM
Parameter Conditions Value
Extreme high tide 210 x 106 m3
Volume Mean tide 92 x 106 m3
Extreme low tide 45 x 106 m3
Extreme high tide 91 km2
Area Mean tide 49 km2
Extreme low tide 18 km2
Spring tide 150 x 106 m3
Tidal prism Mean tide 115 x 106 m3
Neap tide 80 x 106 m3
Mean high tide 3.0 m
Tidal range Mean 2.0 m
Mean low tide 0.9 m
Residents 124 000
Low season
(October to May)
High season
(June to 211 000
September)
Mean residence Spring tide
time Neap tide
FIGURE 141. MAIN CHARACTERISTICS OF RIA FORMOSA.
Population
167 000
0.5 – 2 days
FIGURE 142. MEDIAN SALINITIES FOR EACH STATION IN THE
TWO HOMOGENEOUS AREAS.
Faro-OlhãoStations Median salinity
0 36.6
1 35.6
2 35.3
3 35.8
4 35.3
5 35.3
6 35.4
7 35.3
9 35.6
10 35.5
12 35.3
14 35.3
16 35.8
18 34.6
A3 36.4
B3 36.4
Artificial 36.0
Ramalhete 36.2
IH2 36.1
IH3 36.0
IH17 36.1
IH24 36.1
TaviraStations Median salinity
Oyster 36.1
20 33.7
22 35.8
C3 36.2
Tavira inlet 35.9
E3 35.5
D3 36.2
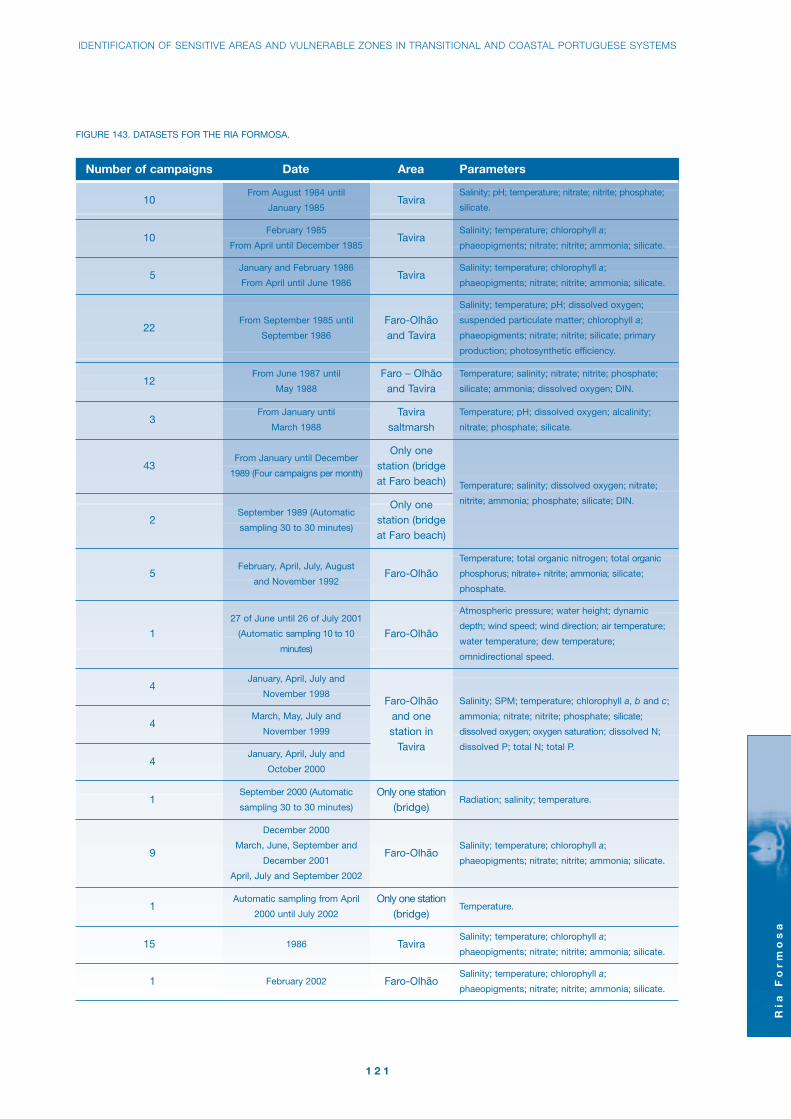
IDENTIFICATION OF SENSITIVE AREAS AND VULNERABLE ZONES IN TRANSITIONAL AND COASTAL PORTUGUESE SYSTEMS
Ria
Fo
rm
os
a
1 2 1
FIGURE 143. DATASETS FOR THE RIA FORMOSA.
Number of campaigns Date Area Parameters
10
5
22
From August 1984 until
January 1985
February 1985
From April until December 1985
January and February 1986
From April until June 1986
From September 1985 until
September 1986
Tavira
Tavira
Tavira
Faro-Olhãoand Tavira
Salinity; pH; temperature; nitrate; nitrite; phosphate;
silicate.
Salinity; temperature; chlorophyll a;
phaeopigments; nitrate; nitrite; ammonia; silicate.
Salinity; temperature; chlorophyll a;
phaeopigments; nitrate; nitrite; ammonia; silicate.
Salinity; temperature; pH; dissolved oxygen;
suspended particulate matter; chlorophyll a;
phaeopigments; nitrate; nitrite; silicate; primary
production; photosynthetic efficiency.
3From January until
March 1988
Tavira saltmarsh
Temperature; pH; dissolved oxygen; alcalinity;
nitrate; phosphate; silicate.
43From January until December
1989 (Four campaigns per month)
Only one station (bridgeat Faro beach) Temperature; salinity; dissolved oxygen; nitrate;
nitrite; ammonia; phosphate; silicate; DIN.
12From June 1987 until
May 1988
Faro – Olhãoand Tavira
Temperature; salinity; nitrate; nitrite; phosphate;
silicate; ammonia; dissolved oxygen; DIN.
2September 1989 (Automatic
sampling 30 to 30 minutes)
Only one station (bridgeat Faro beach)
5February, April, July, August
and November 1992Faro-Olhão
Temperature; total organic nitrogen; total organic
phosphorus; nitrate+ nitrite; ammonia; silicate;
phosphate.
1September 2000 (Automatic
sampling 30 to 30 minutes)
Only one station(bridge)
Radiation; salinity; temperature.
9
December 2000
March, June, September and
December 2001
April, July and September 2002
Faro-OlhãoSalinity; temperature; chlorophyll a;
phaeopigments; nitrate; nitrite; ammonia; silicate.
1Automatic sampling from April
2000 until July 2002
Only one station(bridge)
Temperature.
15 1986 TaviraSalinity; temperature; chlorophyll a;
phaeopigments; nitrate; nitrite; ammonia; silicate.
1 February 2002 Faro-OlhãoSalinity; temperature; chlorophyll a;
phaeopigments; nitrate; nitrite; ammonia; silicate.
Atmospheric pressure; water height; dynamic
depth; wind speed; wind direction; air temperature;
water temperature; dew temperature;
omnidirectional speed.
Salinity; SPM; temperature; chlorophyll a, b and c;
ammonia; nitrate; nitrite; phosphate; silicate;
dissolved oxygen; oxygen saturation; dissolved N;
dissolved P; total N; total P.
4March, May, July and
November 1999
4January, April, July and
October 2000
1
27 of June until 26 of July 2001
(Automatic sampling 10 to 10
minutes)
Faro-Olhão
4January, April, July and
November 1998Faro-Olhão
and one station in
Tavira
10

Ria
Fo
rm
os
a
1 2 2
database which groups the data of most of the
campaigns made in the Ria Formosa to study
water quality. This database has about 120 000
records, loaded for 50 stations covering all the
system. Figure 143 summarises the number of
campaigns, dates and water quality parameters
studied.
The calculated data completeness and
reliability (DCR) for the two zones in the Ria
Formosa was 100% for chlorophyll a and
dissolved oxygen since all zones were sampled,
92% for epiphytes and macroalgae and 0% for
nuisance and toxic blooms since no problems
have been documented. For submerged aquatic
vegetation, studies on the direction of change
have been made. Since no information about
the magnitude of loss is available, this symptom
takes a value of 0%.
OVERALL EUTROPHIC CONDITION
Primary symptoms method
Chlorophyll a
In the area of Faro-Olhão, the maximum values
of chlorophyll a concentrations occurred in
summer reaching values in the “Medium”
eutrophic class (> 5 to ≤ 20 µg l-1). However, the
value obtained for the percentile 90 is 2.5 µg l-1
(Figure 144).
In the Tavira area, the maximum values obtained
for chlorophyll a also occurred in summer but
0
20
40
60
80
100
120
0.5 1 1.5 2 2.5 3 3.5 4 4.5 5 more0102030405060708090100
Frequency
Cumulative %
Cum
ulat
ive
%
Freq
uenc
y
0
1
2
3
4
5
6
7
50 100 150 200 250 300 350
Julian day
Low
Medium
B)A)
FIGURE 144. RIA FORMOSA, FARO-OLHÃO AREA: A) CHLOROPHYLL CONCENTRATIONS DURING AN ANNUAL CYCLE; B) FREQUENCY
DISTRIBUTION FOR CHLOROPHYLL.

IDENTIFICATION OF SENSITIVE AREAS AND VULNERABLE ZONES IN TRANSITIONAL AND COASTAL PORTUGUESE SYSTEMS
Ria
Fo
rm
os
a
1 2 3
FIGURE 146. RESULTS OF THE NEEA INDEX APPLICATION FOR CHLOROPHYLL IN THE RIA FORMOSA. SLE MEANS SYMPTOM LEVEL OF
EXPRESSION.
IF AND AND THENZONE Concentration Spatial coverage Frequency Expression Value Area SLE
Faro-Olhão Low Any Any Low 0.25 45.3 0.23
Tavira Low Any Any Low 0.25 4.2 0.02
Total 49.5 0.25
0
5
10
15
20
25
50 100 150 200 250 300 350
Low
Medium
High
Julian day
Cum
ulat
ive
%
Freq
uenc
y
0
10
20
30
40
50
60
0.5 1 1.5 2 2.5 3 3.5 4 4.5 5 5.5 6 6.5 7 7.5 more
0102030405060708090100
Frequency
Cumulative %
B)A)
FIGURE 145. RIA FORMOSA, TAVIRA AREA: A) CHLOROPHYLL CONCENTRATIONS DURING AN ANNUAL CYCLE; B) FREQUENCY
DISTRIBUTION FOR CHLOROPHYLL.
were higher than in the Faro-Olhão area,
reaching values between “Medium” and “High”.
The percentile 90 value is 4.5 µg l-1 (Figure 145).
According to the NEEA thresholds, both areas
are classified in the “Low” category for eutrophic
conditions.
The “Low” chlorophyll a concentrations over the
whole Ria may be due to the intensive water
exchange over each tide cycle (from 50% to
70%). In these conditions phytoplankton
blooms are not observed in the Ria and this
symptom gets an expression level of “Low” for
whole system (Figure 146).
Macroalgae
The main macroalgal species present in both
NEEA zones are shown in Figure 147. Species
diversity is lower in the Faro-Olhão area where
green algae are dominated by the genera
Enteromorpha sp. and Ulva sp. Periodic blooms
of these green algae have been observed during
winter. The blooms start in early autumn, after the
first rainfalls, and disappear gradually during the
following spring. Biomass minima are registered
in the summer, when high temperatures promote
plant desiccation.
The species Enteromorpha compressa,
Enteromorpha ramulosa and Ulva lactuca are
considered ubiquitous throughout this area and
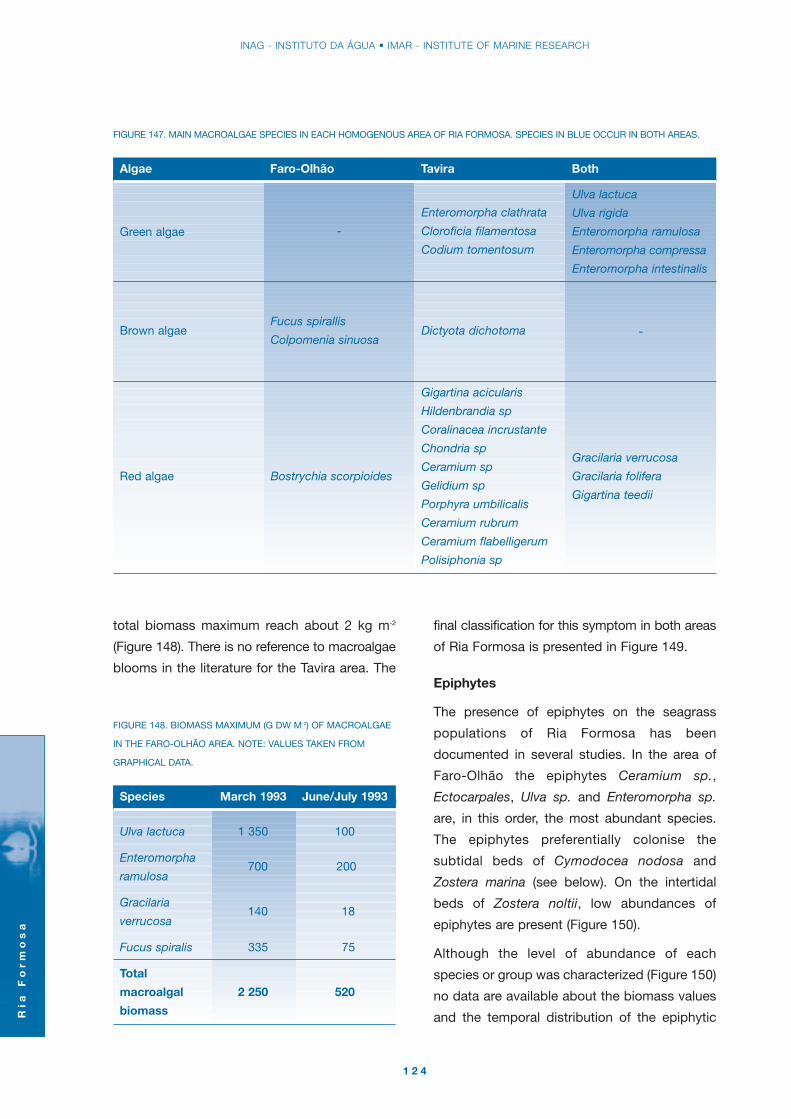
final classification for this symptom in both areas
of Ria Formosa is presented in Figure 149.
Epiphytes
The presence of epiphytes on the seagrass
populations of Ria Formosa has been
documented in several studies. In the area of
Faro-Olhão the epiphytes Ceramium sp.,
Ectocarpales, Ulva sp. and Enteromorpha sp.
are, in this order, the most abundant species.
The epiphytes preferentially colonise the
subtidal beds of Cymodocea nodosa and
Zostera marina (see below). On the intertidal
beds of Zostera noltii, low abundances of
epiphytes are present (Figure 150).
Although the level of abundance of each
species or group was characterized (Figure 150)
no data are available about the biomass values
and the temporal distribution of the epiphytic
INAG - INSTITUTO DA ÁGUA • IMAR - INSTITUTE OF MARINE RESEARCH
Ria
Fo
rm
os
a
1 2 4
FIGURE 148. BIOMASS MAXIMUM (G DW M-2) OF MACROALGAE
IN THE FARO-OLHÃO AREA. NOTE: VALUES TAKEN FROM
GRAPHICAL DATA.
Species March 1993 June/July 1993
Ulva lactuca 1 350 100
Enteromorpha
ramulosa
Gracilaria
verrucosa
Fucus spiralis 335 75
Total
macroalgal 2 250 520
biomass
140
700 200
18
FIGURE 147. MAIN MACROALGAE SPECIES IN EACH HOMOGENOUS AREA OF RIA FORMOSA. SPECIES IN BLUE OCCUR IN BOTH AREAS.
Algae Faro-Olhão Tavira Both
Green algae
Enteromorpha clathrata
Cloroficia filamentosa
Codium tomentosum
-
-
Ulva lactuca
Ulva rigida
Enteromorpha ramulosa
Enteromorpha compressa
Enteromorpha intestinalis
Brown algae Dictyota dichotomaFucus spirallis
Colpomenia sinuosa
Red algae
Gigartina acicularis
Hildenbrandia sp
Coralinacea incrustante
Chondria sp
Ceramium sp
Gelidium sp
Porphyra umbilicalis
Ceramium rubrum
Ceramium flabelligerum
Polisiphonia sp
Gracilaria verrucosa
Gracilaria folifera
Gigartina teedii
Bostrychia scorpioides
total biomass maximum reach about 2 kg m-2
(Figure 148). There is no reference to macroalgae
blooms in the literature for the Tavira area. The
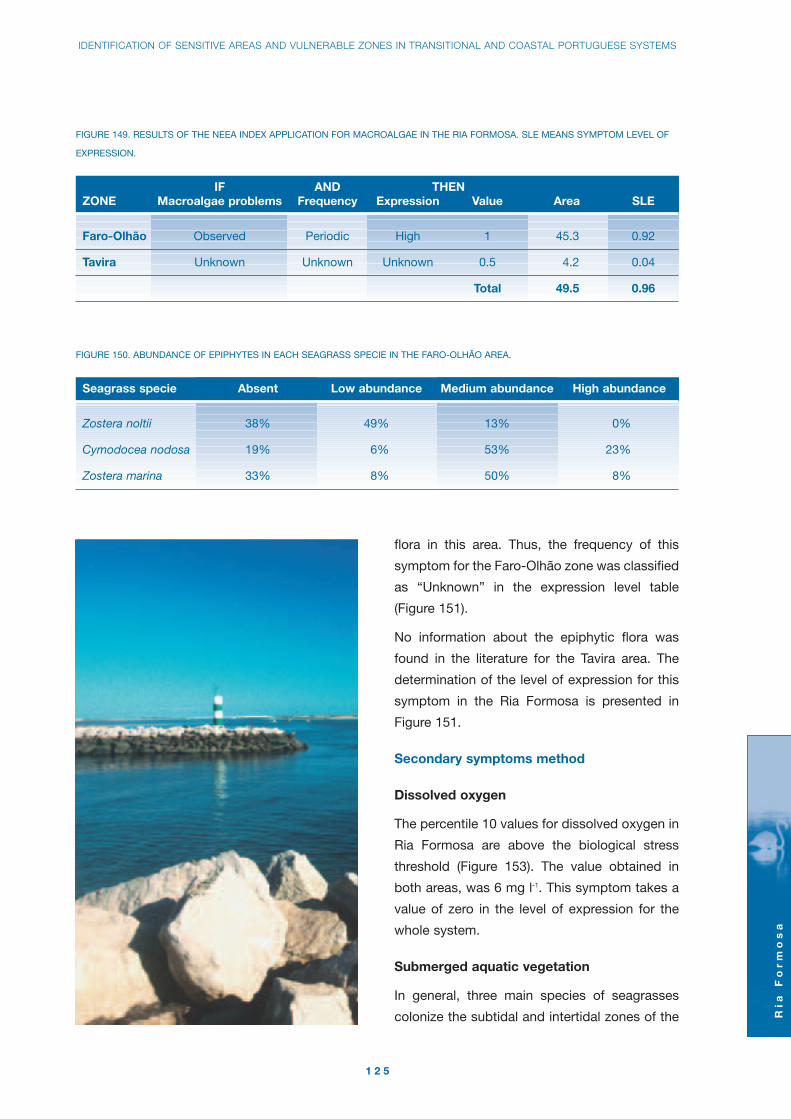
IDENTIFICATION OF SENSITIVE AREAS AND VULNERABLE ZONES IN TRANSITIONAL AND COASTAL PORTUGUESE SYSTEMS
Ria
Fo
rm
os
a
1 2 5
FIGURE 149. RESULTS OF THE NEEA INDEX APPLICATION FOR MACROALGAE IN THE RIA FORMOSA. SLE MEANS SYMPTOM LEVEL OF
EXPRESSION.
IF AND THENZONE Macroalgae problems Frequency Expression Value Area SLE
Faro-Olhão Observed Periodic High 1 45.3 0.92
Tavira Unknown Unknown Unknown 0.5 4.2 0.04
Total 49.5 0.96
flora in this area. Thus, the frequency of this
symptom for the Faro-Olhão zone was classified
as “Unknown” in the expression level table
(Figure 151).
No information about the epiphytic flora was
found in the literature for the Tavira area. The
determination of the level of expression for this
symptom in the Ria Formosa is presented in
Figure 151.
Secondary symptoms method
Dissolved oxygen
The percentile 10 values for dissolved oxygen in
Ria Formosa are above the biological stress
threshold (Figure 153). The value obtained in
both areas, was 6 mg l-1. This symptom takes a
value of zero in the level of expression for the
whole system.
Submerged aquatic vegetation
In general, three main species of seagrasses
colonize the subtidal and intertidal zones of the
FIGURE 150. ABUNDANCE OF EPIPHYTES IN EACH SEAGRASS SPECIE IN THE FARO-OLHÃO AREA.
Seagrass specie Absent Low abundance Medium abundance High abundance
Zostera noltii 38% 49% 13% 0%
Cymodocea nodosa 19% 6% 53% 23%
Zostera marina 33% 8% 50% 8%

INAG - INSTITUTO DA ÁGUA • IMAR - INSTITUTE OF MARINE RESEARCH
Ria
Fo
rm
os
a
1 2 6
Ria Formosa channels. Cymodocea nodosa and
zoystera marina colonise the subtidal areas,
according to sediment type, while Zostera noltii
is typical of the intertidal areas. Studies made in
the western part of the Faro-Olhão zone
indicate the decline of a considerable area
occupied by these populations. The high
mortality rates measured for Cymodocea
nodosa and Zostera marina are due to changes
in the sediment dynamics, probably because of
the recent inlet artificially opened in the Ancão
peninsula. Although the area of seagrass loss
has not been quantified it is probably a short
term effect.
There is no clear indication that, in this areas
the seagrass losses are linked to eutrophic
FIGURE 152. NEEA INDEX APPLICATION FOR THE PRIMARY SYMPTOMS IN THE RIA FORMOSA LAGOON.
Area (km2) Value (vij) Az/At x vijZone Salinity (Az) Chlorophyll a Macroalgae Epiphytes Chlorophyll a Macroalgae Epiphytes
Faro-Olhão 35 45.3 0.25 1 0.5 0.23 0.92 0.46
Tavira 35 4.20 0.25 0.5 0.5 0.02 0.04 0.04
Sum 49.5 - - - 0.25 0.96 0.50
Primary symptoms level of expression value for the estuary: 0.57 Moderate
FIGURE 151. RESULTS OF THE NEEA INDEX APPLICATION FOR THE EPIPHYTES IN THE RIA FORMOSA. SLE MEANS SYMPTOM LEVEL OF
EXPRESSION.
IF AND THENZONE Epiphytes problems Frequency Expression Value Area SLE
Faro-Olhão Observed Unknown Flag b 0.5 45.3 0.46
Tavira Unknown Unknown Flag b 0.5 4.2 0.04
Total 49.5 0.50
Cum
ulat
ive
%
Freq
uenc
y
Dissolved oxygen (mg l-1)
0
50
100
150
200
250
300
2 3 4 5 6 7 8 9 10 more0102030405060708090100
Cumulative %
Frequency
Faro-Olhão
0102030405060708090
100
3 4 5 6 7 8 9 10 11 12 13 14 15 more0102030405060708090100
Cumulative %
Frequency
Tavira
Cum
ulat
ive
%
Freq
uenc
y
Dissolved oxygen (mg l-1)
FIGURE 153. FREQUENCY DISTRIBUTION FOR DISSOLVED OXYGEN IN THE TWO AREAS OF RIA FORMOSA.
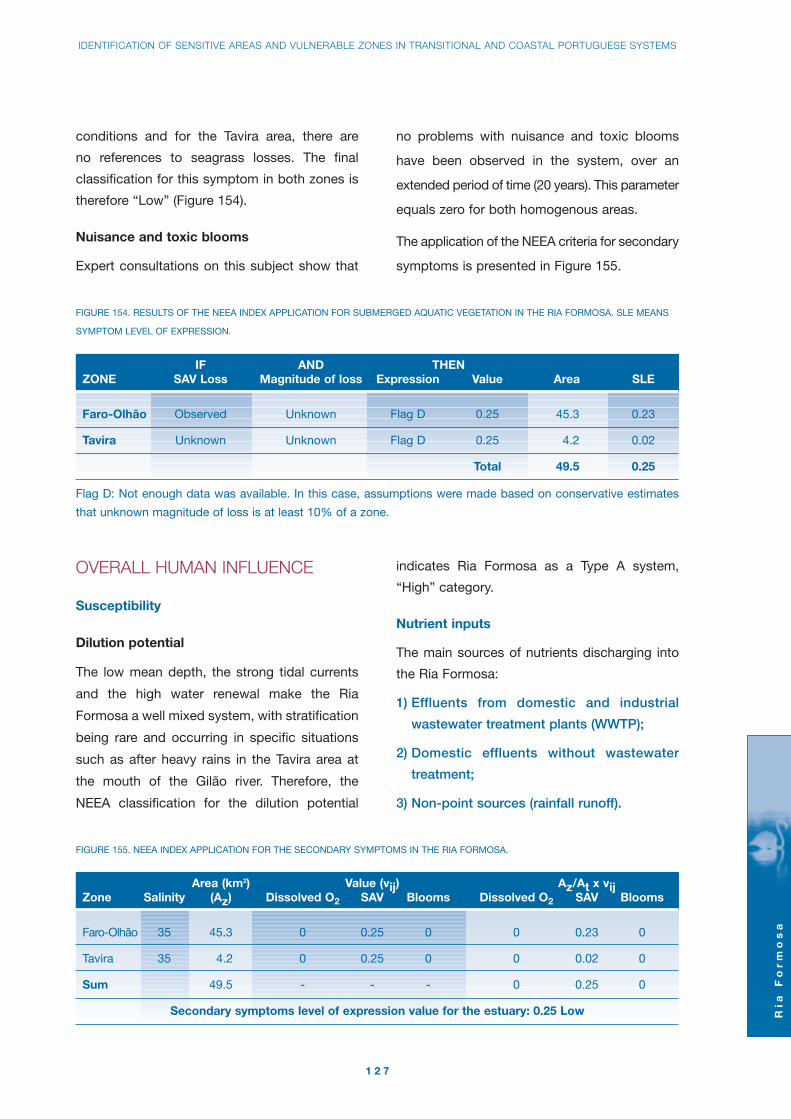
IDENTIFICATION OF SENSITIVE AREAS AND VULNERABLE ZONES IN TRANSITIONAL AND COASTAL PORTUGUESE SYSTEMS
Ria
Fo
rm
os
a
1 2 7
FIGURE 154. RESULTS OF THE NEEA INDEX APPLICATION FOR SUBMERGED AQUATIC VEGETATION IN THE RIA FORMOSA. SLE MEANS
SYMPTOM LEVEL OF EXPRESSION.
IF AND THENZONE SAV Loss Magnitude of loss Expression Value Area SLE
Faro-Olhão Observed Unknown Flag D 0.25 45.3 0.23
Tavira Unknown Unknown Flag D 0.25 4.2 0.02
Total 49.5 0.25
Flag D: Not enough data was available. In this case, assumptions were made based on conservative estimates
that unknown magnitude of loss is at least 10% of a zone.
conditions and for the Tavira area, there are
no references to seagrass losses. The final
classification for this symptom in both zones is
therefore “Low” (Figure 154).
Nuisance and toxic blooms
Expert consultations on this subject show that
no problems with nuisance and toxic blooms
have been observed in the system, over an
extended period of time (20 years). This parameter
equals zero for both homogenous areas.
The application of the NEEA criteria for secondary
symptoms is presented in Figure 155.
OVERALL HUMAN INFLUENCE
Susceptibility
Dilution potential
The low mean depth, the strong tidal currents
and the high water renewal make the Ria
Formosa a well mixed system, with stratification
being rare and occurring in specific situations
such as after heavy rains in the Tavira area at
the mouth of the Gilão river. Therefore, the
NEEA classification for the dilution potential
indicates Ria Formosa as a Type A system,
“High” category.
Nutrient inputs
The main sources of nutrients discharging into
the Ria Formosa:
1) Effluents from domestic and industrial
wastewater treatment plants (WWTP);
2) Domestic effluents without wastewater
treatment;
3) Non-point sources (rainfall runoff).
FIGURE 155. NEEA INDEX APPLICATION FOR THE SECONDARY SYMPTOMS IN THE RIA FORMOSA.
Area (km2) Value (vij) Az/At x vijZone Salinity (Az) Dissolved O2 SAV Blooms Dissolved O2 SAV Blooms
Faro-Olhão 35 45.3 0 0.25 0 0 0.23 0
Tavira 35 4.2 0 0.25 0 0 0.02 0
Sum 49.5 - - - 0 0.25 0
Secondary symptoms level of expression value for the estuary: 0.25 Low

INAG - INSTITUTO DA ÁGUA • IMAR - INSTITUTE OF MARINE RESEARCH
Ria
Fo
rm
os
a
1 2 8
FIGURE 156. LOADS OF N AND P FROM TREATED AND UNTREATED EFFLUENTS INTO THE RIA FORMOSA. LOW SEASON (LS): (FROM
JANUARY TO MAY AND FROM OCTOBER UNTIL DECEMBER). HIGH SEASON (HS): (JUNE, JULY, AUGUST AND SEPTEMBER).
Nutrient loads from WWTPDistricts Total N (ton N y-1) Total P (ton P y-1)
LS HS Total LS HS Total
Faro 103.5 62.4 165.9 9.4 5.7 15.1
Olhão 30.5 23.6 54.1 10.3 7.7 18.0
Tavira 36.1 25.6 61.7 7.4 5.4 12.8
Loulé 34 25.9 59.9 9.3 7.1 16.4
S. Brás de Alportel 10.1 5.3 15.4 0.9 0.5 1.4
Total (ton y –1) 214.2 142.8 357 37.3 26.4 63.7
Domestic effluents without wastewater treatmentDistricts Total N (ton N y-1) Total P (ton P y-1)
LS HS Total LS HS Total
Faro 7.43 4.11 11.54 2.23 1.23 3.46
Olhão 1.90 5.03 6.93 0.57 1.51 2.08
Tavira 6.85 17.10 23.95 2.05 5.13 7.18
Loulé 10.01 7.55 17.56 3.00 2.26 5.27
Vila Real de Sto. António 2.87 1.51 4.38 0.86 0.45 1.31
Total (ton y –1) 29.06 35.30 64.36 8.72 10.59 19.31
Total nutrient inputs 421 ton y-1 83 ton y-1
FIGURE 157. NITROGEN AND PHOSPHORUS LOADS FROM THE
MAIN SOURCES OF NUTRIENTS TO THE ESTUARY.
Relative Nitrogen Phosphoruscontribution (ton N y-1) (ton P y-1)
Treated
and
untreated
sources
Non-point
sources
(rainfall
runoff)
Total 100% 1 028 164
Source
The total nutrient inputs to Ria Formosa are
presented in Figure 156. Information on the
demography of the catchement, population
equivalents for the main industrial activities
and data on the efficiency of the domestic
wastewater treatment from WWTP discharging
into the Ria were used to calculate the nutrient
loads.
At present, 28 WWTP serve the population and
industries in the watershed, with removal
efficiencies averaging 36 and 53% for total
nitrogen and phosphorus, respectively. Since the
main economic activity is tourism, population
42% 421 83
58% 607 81
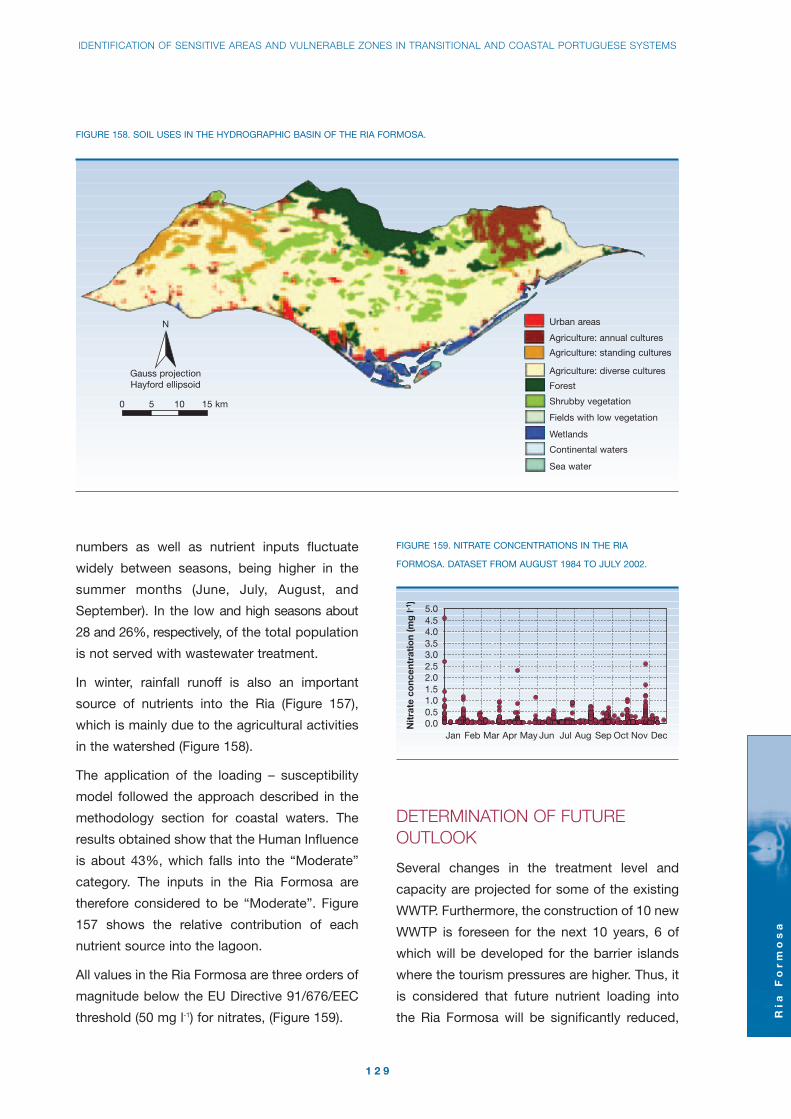
IDENTIFICATION OF SENSITIVE AREAS AND VULNERABLE ZONES IN TRANSITIONAL AND COASTAL PORTUGUESE SYSTEMS
Ria
Fo
rm
os
a
1 2 9
numbers as well as nutrient inputs fluctuate
widely between seasons, being higher in the
summer months (June, July, August, and
September). In the low and high seasons about
28 and 26%, respectively, of the total population
is not served with wastewater treatment.
In winter, rainfall runoff is also an important
source of nutrients into the Ria (Figure 157),
which is mainly due to the agricultural activities
in the watershed (Figure 158).
The application of the loading – susceptibility
model followed the approach described in the
methodology section for coastal waters. The
results obtained show that the Human Influence
is about 43%, which falls into the “Moderate”
category. The inputs in the Ria Formosa are
therefore considered to be “Moderate”. Figure
157 shows the relative contribution of each
nutrient source into the lagoon.
All values in the Ria Formosa are three orders of
magnitude below the EU Directive 91/676/EEC
threshold (50 mg l-1) for nitrates, (Figure 159).
FIGURE 158. SOIL USES IN THE HYDROGRAPHIC BASIN OF THE RIA FORMOSA.
0 5 10 15 km
Gauss projectionHayford ellipsoid
N Urban areas
Agriculture: annual cultures
Agriculture: standing cultures
Agriculture: diverse cultures
Forest
Shrubby vegetation
Fields with low vegetation
Wetlands
Continental waters
Sea water
0.00.51.01.52.02.53.03.54.04.55.0
Jan Feb Mar Apr May Jun Jul Aug Sep Oct Nov Dec
Nit
rate
co
ncen
trat
ion
(mg
l-1 )
FIGURE 159. NITRATE CONCENTRATIONS IN THE RIA
FORMOSA. DATASET FROM AUGUST 1984 TO JULY 2002.
DETERMINATION OF FUTUREOUTLOOK
Several changes in the treatment level and
capacity are projected for some of the existing
WWTP. Furthermore, the construction of 10 new
WWTP is foreseen for the next 10 years, 6 of
which will be developed for the barrier islands
where the tourism pressures are higher. Thus, it
is considered that future nutrient loading into
the Ria Formosa will be significantly reduced,
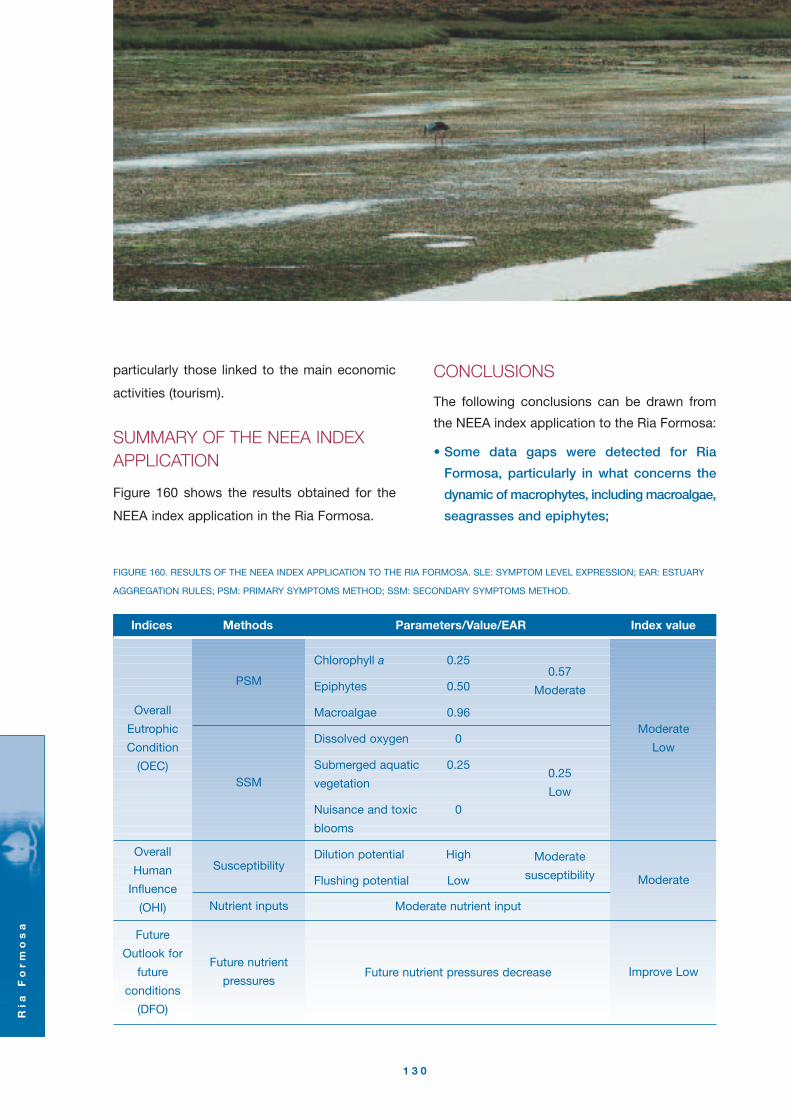
Ria
Fo
rm
os
a
1 3 0
Overall
Human
Influence
(OHI)
Future
Outlook for
future
conditions
(DFO)
Moderate
Low
Moderate
PSM
Susceptibility
Nutrient inputs
Future nutrient
pressures
Overall
Eutrophic
Condition
(OEC)
0.57
Moderate
0.25
Low
Moderate
susceptibility
Improve LowFuture nutrient pressures decrease
Moderate nutrient input
Indices Methods Parameters/Value/EAR Index value
Chlorophyll a 0.25
Epiphytes 0.50
Macroalgae 0.96
Dissolved oxygen 0
Submerged aquatic 0.25
vegetation
Nuisance and toxic 0
blooms
Dilution potential High
Flushing potential Low
SSM
FIGURE 160. RESULTS OF THE NEEA INDEX APPLICATION TO THE RIA FORMOSA. SLE: SYMPTOM LEVEL EXPRESSION; EAR: ESTUARY
AGGREGATION RULES; PSM: PRIMARY SYMPTOMS METHOD; SSM: SECONDARY SYMPTOMS METHOD.
particularly those linked to the main economic
activities (tourism).
SUMMARY OF THE NEEA INDEXAPPLICATION
Figure 160 shows the results obtained for the
NEEA index application in the Ria Formosa.
CONCLUSIONS
The following conclusions can be drawn from
the NEEA index application to the Ria Formosa:
• Some data gaps were detected for Ria
Formosa, particularly in what concerns the
dynamic of macrophytes, including macroalgae,
seagrasses and epiphytes;

IDENTIFICATION OF SENSITIVE AREAS AND VULNERABLE ZONES IN TRANSITIONAL AND COASTAL PORTUGUESE SYSTEMS
Ria
Fo
rm
os
a
1 3 1
• The OEC index classifies the system in the
“Moderate Low” category. This result is
strongly influenced by the periodic blooms
of macroalgae detected in the Faro-Olhão
channels. However there is a clear need for
an Investigative Monitoring programme to
determine the origin, spatial coverage and
frequency of these blooms;
• The Ria Formosa is a well mixed system with
a “High” dilution potential and a “Low”
freshwater inflow with a “Moderate” input of
nutrients into the system. The OHI index
classifies the impact of the nutrient in the
system as “Moderate”, which means that
the symptoms observed in the system are
moderately related to nutrient inputs.
• The nitrate concentration in the water is far
below the limit considered in the Directive
91/676/EEC;
• The future nutrient pressure decrease (DFO)
and the values obtained for the other indices
used support the conclusion that neither the
Ria Formosa nor parts of it should be listed
as sensitive areas (Directive 91/271/EEC) or
vulnerable zones (Directive 91/676/EEC) due
to eutrophication concerns.
KEY REFERENCES
Falcão, M., Vale, C., 1998. Sediment-water
exchanges of ammonium and phosphate in
intertidal and subtidal areas of a mesotidal
coastal lagoon (Ria Formosa). Hydrobiologia,
374, 193-201.
Newton, A., Icely, J.D., Falcão, M., Nobre, A.,
Nunes, J.P., Ferreira, J.G., Vale, C., 2003.
Evaluation of Eutrophication in the Ria Formosa
coastal lagoon, Portugal. Coastal and
Nearshore Oceanography (In Press).
Padinha, C., Santos, R., Brown, M.T., 2000.
Evaluating environmental contamination in Ria
Formosa (Portugal) using stress indexes of
Spartina maritima. Mar. Environ, Res., 49(1), 67-78.
Sprung, M., 1994. Macrobenthic secondary
production in the intertidal zone of the Ria
Formosa - a lagoon in southern Portugal.
Estuarine Coastal Shelf Science, 38, 539-558.
Brotas, V., Amorim Ferreira, A., Vale, C., 1990.
Oxygen profiles in intertidal sediments of Ria
Formosa (S. Portugal). Hydrobiologia, 207, 123-129.
References for grey literature consulted
for this chapter may be found at
http://www.imar.pt/perfect/


GUADIANA ESTUARY
Gu
ad
ian
a E
st
ua
ry
1 3 3
GENERAL CHARACTERISTICS
The Guadiana River has it source at the Lagos
Ruidera in Spain, at an altitude of 1 700 m, and
enters Portugal after a stretch of 550 km. The
Portuguese reach is about 150 km long, has a
general North-South orientation, and flows into
the Atlantic Ocean at the south-eastern coast of
Algarve, forming a border between Portugal and
Spain. The Guadiana basin has a total area of
66 960 km2, 11 700 km2 of which in Portugal.
There are a number of dams on the Spanish
side, and the new Alqueva - Pedrógão system
in Portugal. These dams significantly affect the
total river discharge and freshwater supply to
the estuary. The mean annual discharge
estimated for the situation prior to Alqueva is
2 586 hm3 (corresponding to a modular flow of
82 m3 s-1). This flow regime will be changed
when the new dam is fully operational, with a
flow reduction under average conditions but an
increase in drought situations. The estuary is
FIGURE 161. GUADIANA ESTUARY: BATHYMETRY, SAMPLING STATIONS AND LIMITS OF HOMOGENEOUS ZONES.
0 4000 m
Depth (m)
< - 5
> 5
3
0
Land
Homogenous zone limits
City limits
Sampling stations
V. R. St. António
�
�Downstream limit of mixing zone
Downstream limit of frehwater zone
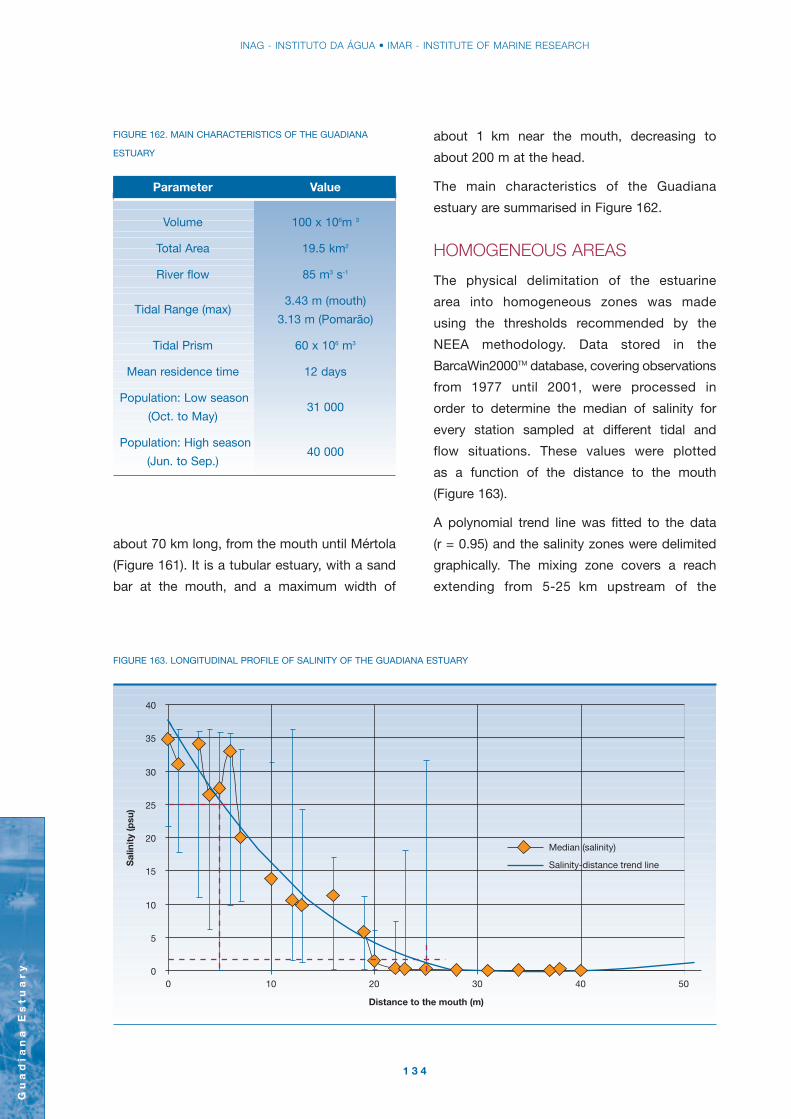
INAG - INSTITUTO DA ÁGUA • IMAR - INSTITUTE OF MARINE RESEARCH
Gu
ad
ian
a E
st
ua
ry
1 3 4
FIGURE 162. MAIN CHARACTERISTICS OF THE GUADIANA
ESTUARY
Parameter Value
Volume 100 x 106m 3
Total Area 19.5 km2
River flow 85 m3 s-1
3.43 m (mouth)
3.13 m (Pomarão)
Tidal Prism 60 x 106 m3
Mean residence time 12 days
Population: Low season
(Oct. to May)
Population: High season
(Jun. to Sep.)
Tidal Range (max)
about 70 km long, from the mouth until Mértola
(Figure 161). It is a tubular estuary, with a sand
bar at the mouth, and a maximum width of
FIGURE 163. LONGITUDINAL PROFILE OF SALINITY OF THE GUADIANA ESTUARY
0
5
10
15
20
25
30
35
40
0 10 20 30 40 50
Sal
init
y (p
su)
Distance to the mouth (m)
Median (salinity)
Salinity-distance trend line
31 000
40 000
about 1 km near the mouth, decreasing to
about 200 m at the head.
The main characteristics of the Guadiana
estuary are summarised in Figure 162.
HOMOGENEOUS AREAS
The physical delimitation of the estuarine
area into homogeneous zones was made
using the thresholds recommended by the
NEEA methodology. Data stored in the
BarcaWin2000TM database, covering observations
from 1977 until 2001, were processed in
order to determine the median of salinity for
every station sampled at different tidal and
flow situations. These values were plotted
as a function of the distance to the mouth
(Figure 163).
A polynomial trend line was fitted to the data
(r = 0.95) and the salinity zones were delimited
graphically. The mixing zone covers a reach
extending from 5-25 km upstream of the

IDENTIFICATION OF SENSITIVE AREAS AND VULNERABLE ZONES IN TRANSITIONAL AND COASTAL PORTUGUESE SYSTEMS
Gu
ad
ian
a E
st
ua
ry
1 3 5
Distance tomouth (km)
Seawater (> 25) 0-5 4.4
Mixing (0.5 to 25) 5-25 7.6
Freshwater (< 0.5) 25-70 7.5
Total - 19.5
FIGURE 164. AREAS OF HOMOGENEOUS SALINITY ZONES OF
THE GUADIANA ESTUARY
Zone Area (km2)
The salinity distribution in the Guadiana estuary
varies strongly with hydrographic conditions:
under persistent conditions of low flow, brackish
water is observed at the zone of Alcoutim, about
30 km from the mouth. Conversely, observations
suggest that the estuary may be stratified when
the river flow exceeds 100 m3 s-1.
DATA COMPLETENESS ANDRELIABILITY
The BarcaWin2000TM database, used to store
the data from the Guadiana estuary, has about
60 000 records, loaded for 114 stations covering
FIGURE 165. DATASETS FOR THE GUADIANA ESTUARY.
Number of campaigns Date Area Parameters
4 April, 1977
Stations in
all estuary
until
Alcoutim
Salinity
Temperature
Suspended particulate matter
Dissolved oxygen
9 April, 1979
Stations at
the estuary
mouth and
near coast
Salinity
Temperature
Dissolved oxygen
Nitrate, nitrite, ammonia
Phosphate
Silicate
Particulate carbon
1 July, 1990
3 stations at
the estuary
mouth
2September and October
1998
58 stations
from the
mouth until
Pomarão
9
February, May,
September, October,
2001
8 stations
from the
mouth until
Mértola
1 February 2002
Five stations
from the
mouth until
Pomarão
Salinity
Temperature
pH
Suspended particulate matter
Dissolved oxygen
Chlorophyll a
Nitrate, nitrite, ammonia
Phosphate
Silicate
Heavy metals
mouth. The areas of the three homogeneous
zones are shown in Figure 164.
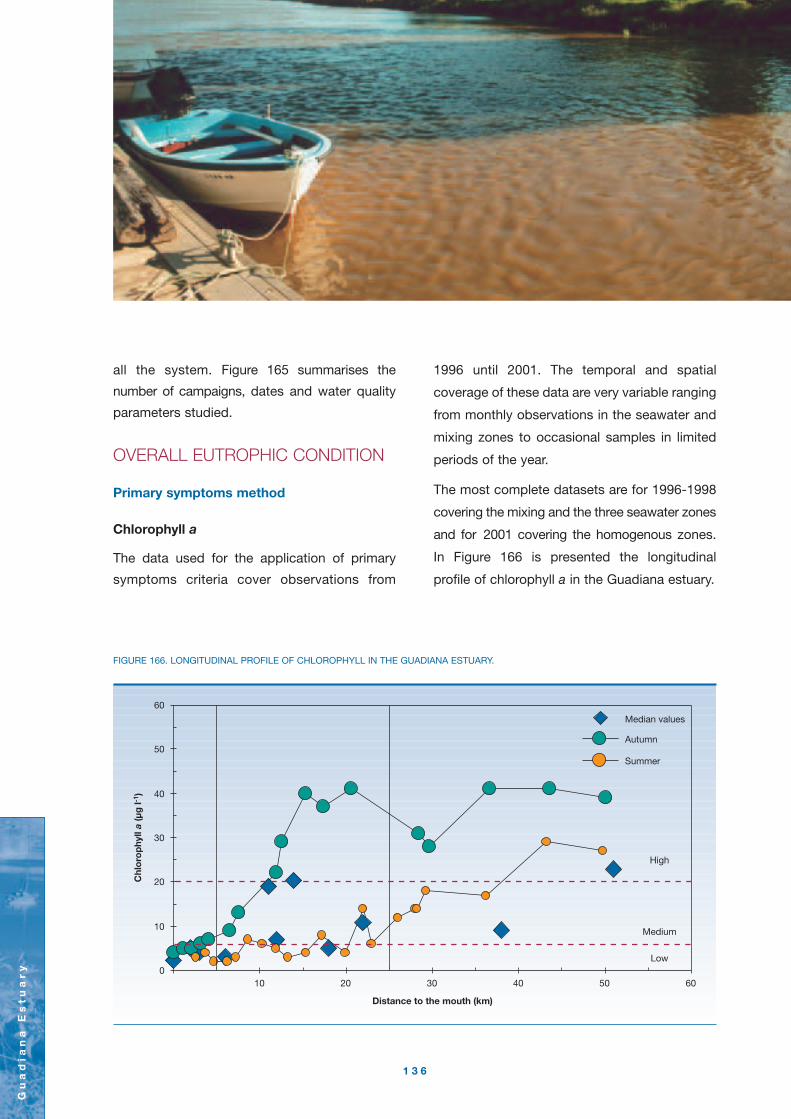
Gu
ad
ian
a E
st
ua
ry
1 3 6
all the system. Figure 165 summarises the
number of campaigns, dates and water quality
parameters studied.
OVERALL EUTROPHIC CONDITION
Primary symptoms method
Chlorophyll a
The data used for the application of primary
symptoms criteria cover observations from
1996 until 2001. The temporal and spatial
coverage of these data are very variable ranging
from monthly observations in the seawater and
mixing zones to occasional samples in limited
periods of the year.
The most complete datasets are for 1996-1998
covering the mixing and the three seawater zones
and for 2001 covering the homogenous zones.
In Figure 166 is presented the longitudinal
profile of chlorophyll a in the Guadiana estuary.
FIGURE 166. LONGITUDINAL PROFILE OF CHLOROPHYLL IN THE GUADIANA ESTUARY.
0
10
20
30
40
50
60
10 20 30 40 50 60
Distance to the mouth (km)
Medium
High
Low
Median values
Autumn
Summer
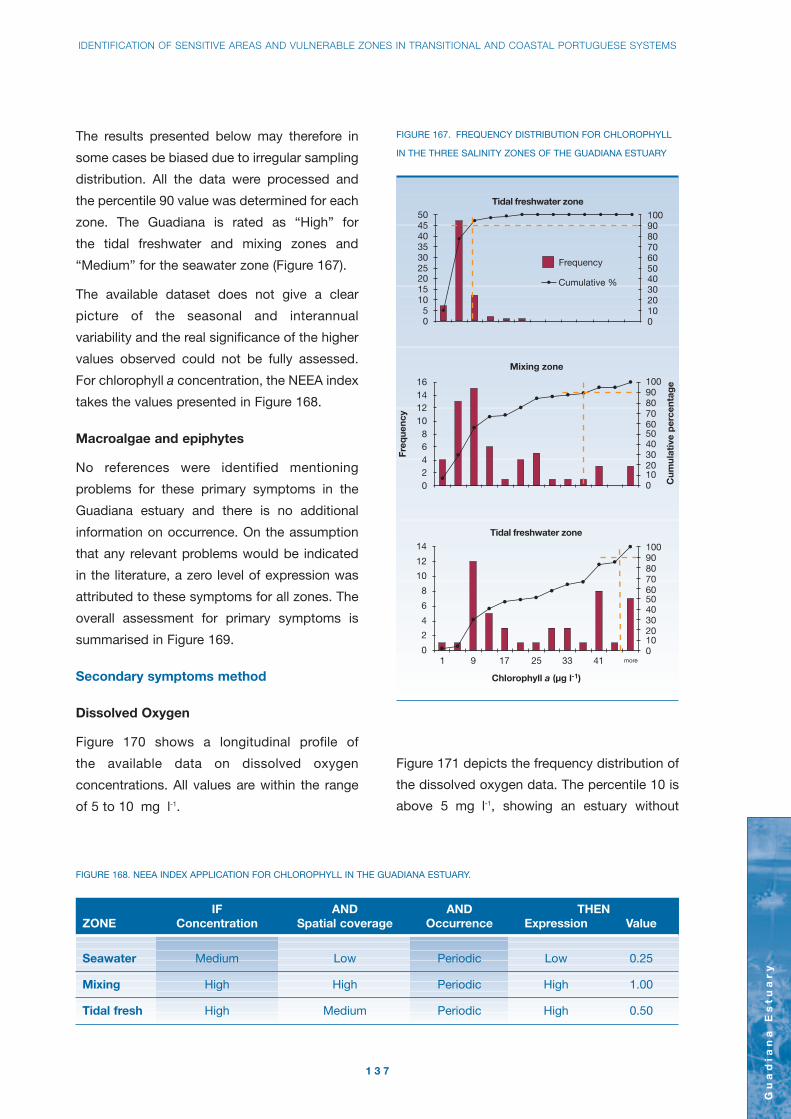
IDENTIFICATION OF SENSITIVE AREAS AND VULNERABLE ZONES IN TRANSITIONAL AND COASTAL PORTUGUESE SYSTEMS
Gu
ad
ian
a E
st
ua
ry
1 3 7
The results presented below may therefore in
some cases be biased due to irregular sampling
distribution. All the data were processed and
the percentile 90 value was determined for each
zone. The Guadiana is rated as “High” for
the tidal freshwater and mixing zones and
“Medium” for the seawater zone (Figure 167).
The available dataset does not give a clear
picture of the seasonal and interannual
variability and the real significance of the higher
values observed could not be fully assessed.
For chlorophyll a concentration, the NEEA index
takes the values presented in Figure 168.
Macroalgae and epiphytes
No references were identified mentioning
problems for these primary symptoms in the
Guadiana estuary and there is no additional
information on occurrence. On the assumption
that any relevant problems would be indicated
in the literature, a zero level of expression was
attributed to these symptoms for all zones. The
overall assessment for primary symptoms is
summarised in Figure 169.
Secondary symptoms method
Dissolved Oxygen
Figure 170 shows a longitudinal profile of
the available data on dissolved oxygen
concentrations. All values are within the range
of 5 to 10 mg l-1.
FIGURE 167. FREQUENCY DISTRIBUTION FOR CHLOROPHYLL
IN THE THREE SALINITY ZONES OF THE GUADIANA ESTUARY
02468
10121416
0102030405060708090100
Mixing zone
05
101520253035404550
0102030405060708090100
Tidal freshwater zone
Freq
uenc
y
Cum
ulat
ive
per
cent
age
1 9 17 25 33 41 more
0
2
4
6
8
10
12
14
0102030405060708090100
Tidal freshwater zone
Frequency
Cumulative %
FIGURE 168. NEEA INDEX APPLICATION FOR CHLOROPHYLL IN THE GUADIANA ESTUARY.
IF AND AND THENZONE Concentration Spatial coverage Occurrence Expression Value
Seawater Medium Low Periodic Low 0.25
Mixing High High Periodic High 1.00
Tidal fresh High Medium Periodic High 0.50
Figure 171 depicts the frequency distribution of
the dissolved oxygen data. The percentile 10 is
above 5 mg l-1, showing an estuary without
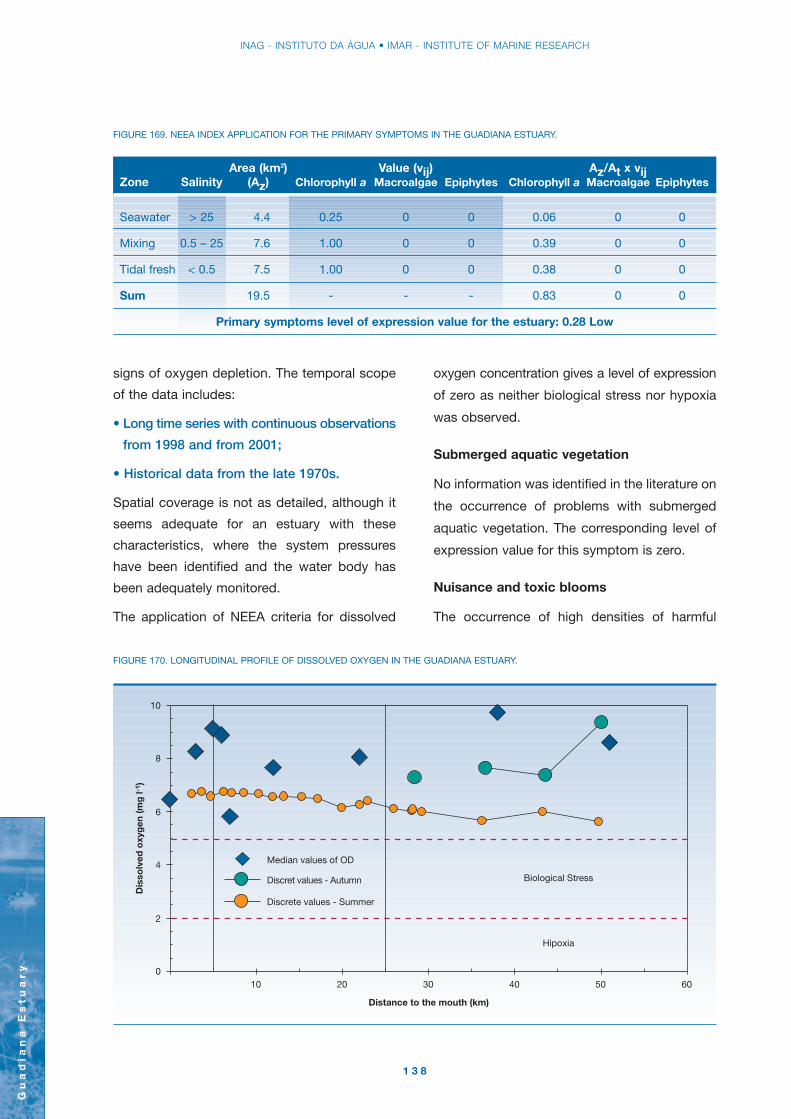
INAG - INSTITUTO DA ÁGUA • IMAR - INSTITUTE OF MARINE RESEARCH
Gu
ad
ian
a E
st
ua
ry
1 3 8
signs of oxygen depletion. The temporal scope
of the data includes:
• Long time series with continuous observations
from 1998 and from 2001;
• Historical data from the late 1970s.
Spatial coverage is not as detailed, although it
seems adequate for an estuary with these
characteristics, where the system pressures
have been identified and the water body has
been adequately monitored.
The application of NEEA criteria for dissolved
oxygen concentration gives a level of expression
of zero as neither biological stress nor hypoxia
was observed.
Submerged aquatic vegetation
No information was identified in the literature on
the occurrence of problems with submerged
aquatic vegetation. The corresponding level of
expression value for this symptom is zero.
Nuisance and toxic blooms
The occurrence of high densities of harmful
FIGURE 169. NEEA INDEX APPLICATION FOR THE PRIMARY SYMPTOMS IN THE GUADIANA ESTUARY.
Area (km2) Value (vij) Az/At x vijZone Salinity (Az) Chlorophyll a Macroalgae Epiphytes Chlorophyll a Macroalgae Epiphytes
Seawater > 25 4.4 0.25 0 0 0.06 0 0
Mixing 0.5 – 25 7.6 1.00 0 0 0.39 0 0
Tidal fresh < 0.5 7.5 1.00 0 0 0.38 0 0
Sum 19.5 - - - 0.83 0 0
Primary symptoms level of expression value for the estuary: 0.28 Low
FIGURE 170. LONGITUDINAL PROFILE OF DISSOLVED OXYGEN IN THE GUADIANA ESTUARY.
Median values of OD
Discret values - Autumn
Discrete values - Summer
Biological Stress
Hipoxia
0
2
4
6
8
10
10 20 30 40 50 60
Distance to the mouth (km)
Dis
solv
ed o
xyg
en (m
g l-
1 )
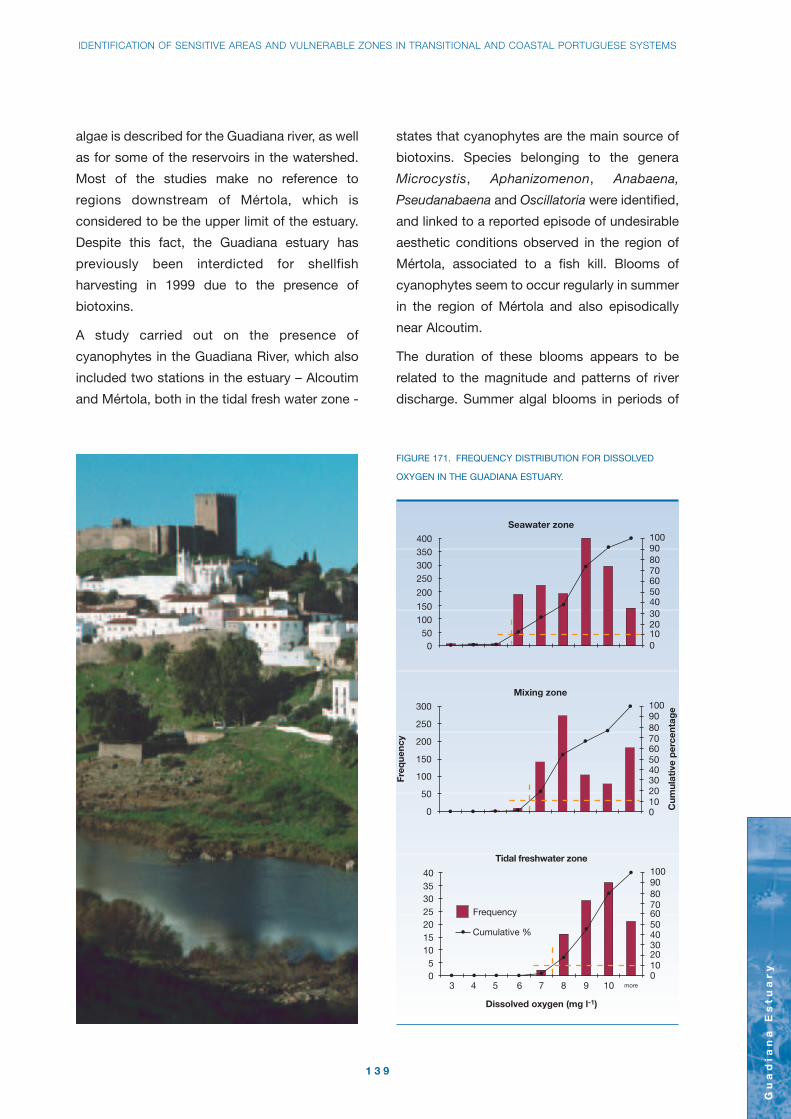
IDENTIFICATION OF SENSITIVE AREAS AND VULNERABLE ZONES IN TRANSITIONAL AND COASTAL PORTUGUESE SYSTEMS
Gu
ad
ian
a E
st
ua
ry
1 3 9
algae is described for the Guadiana river, as well
as for some of the reservoirs in the watershed.
Most of the studies make no reference to
regions downstream of Mértola, which is
considered to be the upper limit of the estuary.
Despite this fact, the Guadiana estuary has
previously been interdicted for shellfish
harvesting in 1999 due to the presence of
biotoxins.
A study carried out on the presence of
cyanophytes in the Guadiana River, which also
included two stations in the estuary – Alcoutim
and Mértola, both in the tidal fresh water zone -
states that cyanophytes are the main source of
biotoxins. Species belonging to the genera
Microcystis, Aphanizomenon, Anabaena,
Pseudanabaena and Oscillatoria were identified,
and linked to a reported episode of undesirable
aesthetic conditions observed in the region of
Mértola, associated to a fish kill. Blooms of
cyanophytes seem to occur regularly in summer
in the region of Mértola and also episodically
near Alcoutim.
The duration of these blooms appears to be
related to the magnitude and patterns of river
discharge. Summer algal blooms in periods of
FIGURE 171. FREQUENCY DISTRIBUTION FOR DISSOLVED
OXYGEN IN THE GUADIANA ESTUARY.
05
10152025303540
3 4 5 6 7 8 more9 100102030405060708090100
Tidal freshwater zone
Dissolved oxygen (mg l-1)
0
50
100
150
200
250
300
0102030405060708090100
Mixing zone
Freq
uenc
y
Cum
ulat
ive
per
cent
age
Frequency
Cumulative %
0
200
400
0102030405060708090100
Seawater zone
350300250
15010050

INAG - INSTITUTO DA ÁGUA • IMAR - INSTITUTE OF MARINE RESEARCH
Gu
ad
ian
a E
st
ua
ry
1 4 0
reduced river flows are confined to the tidal
fresh water zone of the estuary. The application
of the NEEA criteria for this secondary symptom
is shown in Figure 172.
OVERALL HUMAN INFLUENCE
Susceptibility
Dilution potential
The Guadiana is a mesotidal estuary with a tidal
range of 3.4 m for equinoctial spring tides and
a mean tidal range of about 2.2 m. The
Guadiana river is the only relevant fresh water
input, and exhibits a strong seasonal and
interannual variability. The operation of the new
Alqueva-Pedrógão dam will cause a reduction
of total inflow but also a decrease in variability.
The flux ratio between the river flow Rt and the
tidal prism P was calculated for the Guadiana
estuary. On the basis of its variation with tidal
situation and river flow, changes in vertical
salinity structure may be observed.
Some observations suggest that stratification
may be more important than this simplified
analysis suggests. Nevertheless, as most of the
hydrological conditions are at present and will
be in the future characterized by flows below
100 m3 s-1, for the purpose of the present study
the estuary as a whole is considered as at least
partly mixed. On this basis, the Guadiana
dilution potential is classified in type B,
“Moderate” category, despite that the dilution
volume factor (10-8 m3) is relatively low when
compared to larger estuaries.
Flushing potential
The flushing potential is also a function of the
relative values of estuarine morphological
FIGURE 172. NEEA INDEX FOR NUISANCE AND TOXIC BLOOMS.
IF AND AND THENZONE Blooms Duration Frequency Expression Value
Seawater None None None - 0
Mixing None None None - 0
Tidal fresh Problem Monthly to seasonal Periodic High 1
FIGURE 173. NEEA INDEX APPLICATION FOR THE SECONDARY SYMPTOMS IN THE GUADIANA ESTUARY.
Area (km2) Value (vij) Az/At x vijZone Salinity (Az) Dissolved O2 SAV Blooms Dissolved O2 SAV Blooms
Seawater > 25 4.4 0 0 0 0 0 0.00
Mixing 0.5 – 25 7.6 0 0 0 0 0 0.00
Tidal fresh < 0.5 7.5 0 0 1 0 0 0.38
Sum 19.5 - - - 0 0 0.38
Secondary symptoms level of expression value for the estuary: 0.38 Moderate

IDENTIFICATION OF SENSITIVE AREAS AND VULNERABLE ZONES IN TRANSITIONAL AND COASTAL PORTUGUESE SYSTEMS
Gu
ad
ian
a E
st
ua
ry
1 4 1
characteristics and river flow. The ratio of the
modular fresh water inflow to the total estuarine
volume is of the order of 7 x 10⁻², leading to a
classification of “Moderate” flushing potential.
In Figure 174 the determination of the overall
susceptibility of the Guadiana estuary is
presented, leading to a final classification of
“Moderate”.
Nutrient inputs
The main sources of nutrients from human
activities discharging into the estuary are:
1) Nutrients from urban and industrial waste
waters, treated and untreated;
2) River inputs from the Guadiana basin,
integrating point and diffuse sources upstream
the section considered as reference;
3) Nutrient inputs from diffuse sources draining
directly to the estuary.
The estimation of diffuse loads used export
coefficients for different classes of land use.
A simplified classification was adopted, using
three rural classes permanent cultures and fruit
trees; annual crops, irrigated and non-irrigated;
forest areas and scrub, urban, industrial and
other non classified areas. Figure 175 presents
the relative importance of these classes in the
basin draining directly to the Guadiana estuary.
Point sources were estimated considering the
loads transported by the Guadiana River and
from urban and industrial wastewaters. The
river inputs were estimated based on a
reference river section near the upstream limit
of the estuary. A positive relation between
nitrogen loading and river flow was observed.
The calculation of loads from domestic wastewater
used per capita coefficients (3.3 kg PEQ-1 y-1
for N and 0.4 kg PEQ-1 y-1 for P). Industrial
Vertical stratification
• Well mixed for Q 170 m3 s-1;
• Partly mixed with Rt/P 0.2-0.45 for Q 400 m3 s-1;
• Stratified except for spring tides, for Q ≥ 1000 m3 s-1.
FIGURE 174. DETERMINATION OF OVERALL SUSCEPTIBILITY.
IF THEN THENType Vertical stratification Dilution volume Dilution potential
B Partly mixed 1/Vt 10-8 Moderate
Tidal prism Freshwater flow/estuary volume None
Mesotidal Moderate 7 x 10⁻² Moderate
Overall susceptibility for the estuary: Moderate

Sources River Diffuse Industrial Domestic
Total nitrogen
(ton y-1)
Total phosphorus
(ton y-1)
Gu
ad
ian
a E
st
ua
ry
1 4 2
wastewater discharges are of reduced relevance,
but an estimate using available information was
nevertheless carried out. Figure 176 presents a
summary of the total estimates of the land-
based inputs.
The application of the loading-susceptibility
model to the Guadiana estuary followed the
approach described in the methodology section
for transitional waters. To run the model a
salinity median of 26.8, a modular river flow of
85 m3 s-1, the estuary volume (Figure 162) and
the nitrogen loads presented in Figure 176 were
used. A value of 83.8% was determined which
falls in the “High” category.
FIGURE 176. NITROGEN AND PHOSPHATE LOADS TO THE GUADIANA ESTUARY.
FIGURE 175. DISTRIBUTION BY LAND USE CLASSES.
Others6%
Urban1% Permanent cultures
25%and fruit trees
Annual crops, irrigated
4%and non-irrigated
64%Forest areas and scrub
3 400 259 8 70
600 29 3 8

IDENTIFICATION OF SENSITIVE AREAS AND VULNERABLE ZONES IN TRANSITIONAL AND COASTAL PORTUGUESE SYSTEMS
Gu
ad
ian
a E
st
ua
ry
1 4 3
Combining susceptibility with nutrient inputs, the
overall classification for the Guadiana estuary in
terms of human influence is “Moderate High”,
which means that the symptoms observed in the
estuary are moderately to highly related to
nutrient additions, particularly in the tidal
freshwater and mixing zones.
DETERMINATION OF FUTUREOUTLOOK
Although the future outlook in the estuary is
classified as unchanged, it is dependent on the
potential changes in land use promoted by the
Alqueva reservoir. The effective implementation
of good agricultural practices according to the
agro environmental EU rules is essential to
prevent environmental quality degradation as
regards eutrophication;
SUMMARY OF THE NEEA INDEXAPPLICATION
The expression of primary and secondary
symptoms to the Guadiana estuary was estimated
as “Low” and “Moderate”, respectively. According
to the NEEA aggregation rules this leads to an
overall classification of “Moderate Low”.
Figure 177 summarises the overall results of the
application of the NEEA methodology, which
indicate that the estuary is considered “Moderate”
as regards overall eutrophic conditions and
“Moderate Low” for overall human influence.
The future nutrient pressures are conditionally
classified as unchanged.
CONCLUSIONS
The following conclusions can be drawn from the
Overall
Human
Influence
(OHI)
Future
Outlook for
future
conditions
(DFO)
Moderate
Low
Moderate
High
PSM
Susceptibility
Nutrient inputs
Future nutrient
pressures
Overall
Eutrophic
Condition
(OEC)
0.28
Low
0.38
Moderate
Moderate
susceptibility
No changeFuture nutrient pressures no significant change
High nutrient inputs
Indices Methods Parameters/Value/EAR Index value
Chlorophyll a 0.84
Epiphytes 0
Macroalgae 0
Dissolved oxygen 0
Submerged aquatic 0
vegetation
Nuisance and toxic 0.38
blooms
Dilution potential Moderate
Flushing potential Moderate
SSM
FIGURE 177. RESULTS OF THE NEEA INDEX APPLICATION TO THE GUADIANA ESTUARY.
Gu
ad
ian
a E
st
ua
ry
1 4 4
NEEA index application to the Guadiana
estuary:
• Although an extensive database for salinity
and dissolved oxygen is available for the
Guadiana estuary, the information on other
biogeochemical parameters is much more
limited. The analysis for chlorophyll a is the
most obvious case, where an uneven
distribution of observations in space and
time may bias the data. A comprehensive
and carefully designed Surveillance Monitoring
programme (sensu WFD) is recommended,
to help to fill the gaps in the dataset. This is
in any case required for monitoring the early
stages of the operation of the Alqueva-
Pedrógão dam, in Portugal, and the Andévalo-
Chanza dam, in Spain;
• The OEC index classifies the estuary in the
“Moderate Low” category. This results is mainly
due to the “Medium” to “High” concentrations of
chlorophyll a as well as the occurrence of
toxic blooms in the tidal freshwater and
mixing zones;
• The OHI index falls into the “Moderate High”
category. This value is strongly influenced by
the nutrient inputs introduced by the river,
due to agricultural practices upstream and
along the estuary banks;
• Although the future outlook in the estuary
is classified as unchanged, it is dependent on
the potential changes in land use promoted
by the Alqueva reservoir. The effective
implementation of good agricultural practices
according to the agro environmental EU rules
is essential to prevent environmental quality
degradation as regards eutrophication;
• On the basis of the application of the NEEA
index, there is no justification for designating
sensitive areas in the estuary, as regards
eutrophication, under the terms of the
UWWTD Directive (91/271/EEC);
• The designation of vulnerable zones in the
estuary under the terms of the Nitrate
Directive (91/676/EEC) is dependent on the
changes in agricultural practices promoted
by the future availability of water for irrigation
from the Alqueva reservoir.
KEY REFERENCES
Chícharo, M.A., Chícharo, L.M., Galvão, H.,
Barbosa, A., Marques, M.H., Andrade, J.P.,
Esteves, E., Miguel, C., Gouveia, I., 2001.
Status of the Guadiana Estuary (south Portugal)
during 1996-1998: An ecohydrological approach.
Aquatic Ecosystem Health & Management, 4(1),
73-89.
Chícharo, L., Chícharo, M.A., Esteves, E.,
Andrade, P., Morais, P., 2001. Effects of
alterations in freshwater supply on the abundance
and distribution of Engraulis encrasicholus in
the Guadiana estuary and adjacent coastal
areas of south Portugal. Ecohydrology &
Hydrobiology, 1(3), 195-200.
Esteves, E., Pina, T., Chicharo, M.A., Andrade,
J.P., 2000. The distribution of estuarine fish
larvae: Nutritional condition and co-occurrence
with predators and prey. Acta Oecologica, 21(3),
161-173.
Gonzalez, R., Dias, J.A., Ferreira, Ó., 2001.
Recent rapid evolution of the Guadiana Estuary
(Southen Portugal/Spain). Journal of Coastal
Research (ICS 2000 Proceedings), 516-527.
Rocha, C., Galvão, H., Barbosa, A., 2002. Role
of transient silicon limitation in the development
of cyanobacteria blooms in the Guadiana
estuary, south-western Iberia. Marine Ecology
Progress Series, 228, 35-45.
References for grey literature consulted
for this chapter may be found at
http://www.imar.pt/perfect/


GENERAL CONCLUSIONS
Ge
ne
ra
l C
on
clu
sio
ns
1 4 7
This study was carried out to address the
potential classification of sensitive areas and/or
vulnerable zones in ten Portuguese systems, the
Minho, Lima, Douro, Ria de Aveiro, Mondego,
Tagus and Sado, Mira and Guadiana estuaries,
and the Ria Formosa coastal lagoon. The
evaluation presented in this document applies
the U.S. National Estuarine Eutrophication
Assessment, developed by the National Oceanic
and Atmospheric Administration of the United
States.
This work examines the ecological quality of
the ten systems, and asks six fundamental
questions:
SIX KEY QUESTIONS
1. What is the eutrophication status of each of
the ten systems, as a whole and in sections;
how does it compare with other estuaries and
coastal waters in Portugal and elsewhere?
2. Which systems or parts of systems should
be classified as sensitive areas and/or
vulnerable zones?
3. What are the potential management solutions,
for example through effluent treatment or
improvement of agricultural practices?
4. What will be the trends in nutrient loading to
these systems, from urban and agricultural
sources, over the next few decades?
5. Where are the main data gaps, and what are
the recommendations for monitoring and
research for the ten systems studied?
6. How can this assessment be used as the
basis for a national strategy?
The results obtained for the ten systems are
presented below.
EUTROPHICATION STATUS
Figure 178 shows the results of the NEEA
assessment of the ten systems. No eutrophication
problems are identified in the Minho, Lima,
Douro, Ria de Aveiro, Tagus, Sado and Mira
estuaries. In the Mondego, existing data for the
South channel suggest the occurrence of
• Sensitive areasDirective on urban wastewater treatment UWWTD (91/271/EEC)
• Vulnerable zonesNitrates directive ND (91/676/EEC)

INAG - INSTITUTO DA ÁGUA • IMAR - INSTITUTE OF MARINE RESEARCH
Ge
ne
ra
l C
on
clu
sio
ns
1 4 8
eutrophication symptoms associated with
macroalgal (seaweed) growth. In the Ria Formosa,
periodic blooms of macroalgae have been
detected in the Faro-Olhão channels. In the tidal
freshwater and mixing zones of the Guadiana
estuary, the eutrophic symptoms are associated
with medium to high chlorophyll a values.
The study carried out by NOAA on 138 estuaries
in the United States, identified 34% with high
expression of eutrophication conditions, 37%
with moderate conditions and 29% with low
conditions – 17 of the 138 estuaries did not have
enough information available to apply the NEEA
methodology. Given the level of development of
the European Union, we would expect the
application of NEEA to European estuaries
to give similar results or perhaps even to identify
a greater proportion of systems with high
eutrophication conditions. Comparatively, the
Portuguese systems for which adequate data
exist have low eutrophic conditions when
considered on an EU-wide scale.
CLASSIFICATION OF VULNERABLEZONES AND/OR SENSITIVE AREAS
Designation of vulnerable zones
On the basis of the application of the NEEA
index to the ten systems, there is no justification
for designating vulnerable zones in the Minho,
Lima, Douro, Ria de Aveiro, Tagus, Sado, Mira
and Ria Formosa. In the Mondego estuary,
available data suggest that the South channel is
a problem area, and the measures required to
reduce macroalgal blooms and restore the
ecosystem balance should be urgently examined.
The designation of vulnerable zones in the
Guadiana estuary is dependent on the changes
in agricultural practices promoted by the future
availability of water for irrigation from the Alqueva
reservoir.
FIGURE 178. EUTROPHICATION STATUS OF THE PORTUGUESE SYSTEMS.
Overall Eutrophic Overall Human Definition of Future Condition (OEC) Influence (OHI) Outlook (DFO)
Minho There is insufficient information to fully apply the NEEA index in this estuary, but the analysis
of available data shows that there are no problems with eutrophication symptoms
Lima There is insufficient information to fully apply the NEEA index in this estuary, but the analysis
of available data shows that there are no problems with eutrophication symptoms
Douro There is insufficient information to fully apply the NEEA index in this estuary, but the analysis
of available data shows that there are no problems with eutrophication symptoms
Ria de Aveiro Moderate low � Low � No change �
Mondego There is insufficient information to apply the NEEA index in this estuary, but a partial analysis
shows that there are problems in the south arm of the system
Tagus Moderate low � Low � Slight improvement �
Sado Low � Low � Substantial improvement �
Mira Low � Low � No change �
Ria Formosa Moderate Low � Moderate � Substantial improvement �
Guadiana Moderate � Moderate low � No change �

IDENTIFICATION OF SENSITIVE AREAS AND VULNERABLE ZONES IN TRANSITIONAL AND COASTAL PORTUGUESE SYSTEMS
Ge
ne
ra
l C
on
clu
sio
ns
1 4 9
Designation of sensitive areas
On the basis of the application of the NEEA
index to the ten systems, there is no justification
for designating sensitive areas in any of them,
under the terms of the UWWTD Directive
(91/271/EEC), as regards eutrophication.
MANAGEMENTRECOMMENDATIONS
Minho, Lima and Douro estuaries
Due to the lack of information for these estuaries
no conclusions could be drawn on management
recommendations.
Mondego estuary
Improve the agricultural practices in the Pranto
river basin, and propose the application of
ecotechnology solutions. A comprehensive list
would include:
(i) Optimisation of the management of the
Pranto discharge;
(ii) Construction of artificial wetlands between
the upstream farmland and the Pranto sluice
connection to the Mondego Southern channel.
Guadiana estuary
The effective implementation of good agricultural
practices according to the EU agro-environmental
rules is essential to prevent environmental
quality degradation as regards eutrophication.
Other estuaries
The management measures currently being
applied in the estuaries of the Ria de Aveiro,
Tagus, Sado, Mira and Ria Formosa, with
respect to effluent treatment and discharge to
the receiving body, agricultural practices and
soil protection, appear to be adequate for
preserving and improving environmental quality
as regards eutrophication.
FUTURE OUTLOOK
The future trends are positive in the case of the
Douro, Tagus, Sado and Ria Formosa and
neutral in the case of the Lima, Ria de Aveiro
and Mira. No conclusions were drawn on
possible trends for the Mondego and Minho due
to lack of information. Negative future trends
should be considered in the case of the
Guadiana estuary if appropriate management
recommendations are not implemented.
DATA GAPS ANDRECOMMENDATIONS
All the systems except the Tagus exhibit data
gaps, which should be filled by means of
an adequate monitoring programme. These
programmes should be implemented following
the recommendations of the Water Framework
Directive (WFD, Directive 2000/60/CE).
Minho estuary
The information on water quality parameters for
the Minho estuary is very limited. Some of the
parameters are only available as metadata and
the spatial and temporal coverage is not
sufficient to carry out an analysis of the system
as a whole. A Surveillance Monitoring programme
is recommended, following the definition set out
in the Water Framework Directive.
Lima estuary
The areas near the banks of the Lima estuary,
particularly the saltmarshes and saltpans, have
been studied, but there is a requirement for an
integrated approach to the whole system from
the head of the estuary to the mouth. Due to the
lack of information for this estuary, particularly
in what concerns hydrology, macroalgae,
epiphytes and submerged aquatic vegetation
dynamics, a Surveillance Monitoring programme
should be developed.

INAG - INSTITUTO DA ÁGUA • IMAR - INSTITUTE OF MARINE RESEARCH
Ge
ne
ra
l C
on
clu
sio
ns
1 5 0
Douro estuary
The information for the Douro estuary is also
scarce concerning water quality, macrophytes
and nuisance and toxic blooms. For this estuary
a Surveillance Monitoring programme is necessary.
Ria de Aveiro
Some data gaps were detected for Ria de Aveiro
concerning spatial coverage for chlorophyll a,
macrophyte dynamics and nuisance and toxic
blooms. An adequate Surveillance Monitoring
programme should be developed to rectify
these gaps. Aditionally two investigative
monitoring programs should be carried out to
determine the reasons for general SAV loss and
high chlorophyll concentrations in the extreme
of Mira channel.
Mondego estuary
The South channel of the Mondego estuary is
well studied, but there is a requirement for an
integrated approach to the whole system, from the
head of the estuary to the mouth, considering
both the North and South channels. For this
estuary, apart from the Surveillance Monitoring
indicated in the WFD, an Investigative Monitoring
programme has now been implemented, in order
to respond to the outstanding issues.
Tagus estuary
The Tagus estuary is well characterized, and the
fulfilment of national obligations with regard to
WFD Surveillance Monitoring is sufficient.
Sado estuary
Some areas of the Sado estuary are not very
well known, particularly the upper part. These
knowledge gaps may be filled by an adequately
designed Surveillance Monitoring programme.
Elevated chlorophyll a peaks were identified on
one sampling date in February 2000, which are
clearly inconsistent with the overall dataset. As
a precaution, Investigative Monitoring is suggested
for the area in question.
Mira estuary
Sections of the Mira are poorly known,
particularly the upstream part. There is also a
need to improve the description of temporal
and spatial variation of chlorophyll a. The
monitoring programme falls clearly into the
Surveillance Monitoring area of the WFD.
Ria Formosa
The data gaps detected for the Ria Formosa
concern macrophyte dynamics, particularly
seaweeds and seagrasses. Efforts should
be made to obtain the necessary information
by means of an Investigative Monitoring
programme.
Guadiana estuary
Although an extensive database for salinity and
dissolved oxygen is available for the Guadiana
estuary, the information on other biogeochemical
parameters is much more limited. The analysis
for chlorophyll a is the most obvious case, where
an uneven distribution of observations in space
and time may bias the data. A comprehensive
and carefully designed Surveillance Monitoring
programme (sensu WFD) is recommended, to
help to fill the gaps in the database.
DEFINITION OF A NATIONALSTRATEGY
This study brings together valuable information
on the state of eutrophication of nine estuarine
systems and one coastal lagoon in Portugal,
and is a useful support for decision-making and
management of these systems. The existence
of a comparative methodology and results at an
international level reinforces the utility of this
IDENTIFICATION OF SENSITIVE AREAS AND VULNERABLE ZONES IN TRANSITIONAL AND COASTAL PORTUGUESE SYSTEMS
Ge
ne
ra
l C
on
clu
sio
ns
1 5 1
approach. The general application of the NEEA
index to a large number of Portuguese estuaries
and coastal lagoons was shown to have the
following advantages:
• Contribution to the definition of priorities and decision-support at a national level
• In estuaries with serious problems, application of management measures. In systems
considered to be at risk, promotion of monitoring and preventive measures
• In estuaries where serious knowledge gaps exist, identification of the monitoring requirements
for quality assessment
IDENTIFICATION OF SENSITIVE AREAS AND VULNERABLE ZONES IN TRANSITIONAL AND COASTAL PORTUGUESE SYSTEMS
Application of the United States National Estuarine Eutrophication Assessment to the Minho,
Lima, Douro, Ria de Aveiro, Mondego, Tagus, Sado, Mira, Ria Formosa and Guadiana systems
EDITORINAG • Instituto da Água • www.inag.pt
IMAR • Institute of Marine Research • www.imar.pt
DESIGN AND PRODUCTIONIdeias Virtuais
PHOTOSJoana Dilão
ISBN972-9412-66-9
LEGAL DEPOSIT200060/03
N. OF COPIES1000
JULY 2003
© INAG - Instituto da Água • IMAR - Institute of Marine Research


