Final Report: Identification of the Vulnerability of the Major and Minor Aquifers of Texas to Subsidence with Regard to Groundwater Pumping TWDB Contract Number 1648302062 Prepared By Jordan Furnans, Ph.D., P.E., P.G. Michael Keester, P.G. Dave Colvin, P.G., PMP Jacob Bauer, P.G. (WY) Joel Barber, P.E. (CO) Gary Gin, P.G. LRE Water, LLC Velma Danielson Lori Erickson Robert Ryan Blanton & Associates, Inc. Kaveh Khorzad, P.G. Andrew Worsley Wet Rock Groundwater Services, LLC Grant Snyder, P.G. GLS Solutions, Inc. March 21, 2017
Transcript
Final Report: Identification of the Vulnerability of the Major and Minor Aquifers of Texas to Subsidence with Regard to Groundwater Pumping
TWDB Contract Number 1648302062
Prepared By
Jordan Furnans, Ph.D., P.E., P.G. Michael Keester, P.G. Dave Colvin, P.G., PMP Jacob Bauer, P.G. (WY) Joel Barber, P.E. (CO) Gary Gin, P.G. LRE Water, LLC
Velma Danielson Lori Erickson Robert Ryan Blanton & Associates, Inc.
Kaveh Khorzad, P.G. Andrew Worsley Wet Rock Groundwater Services, LLC
Grant Snyder, P.G. GLS Solutions, Inc.
March 21, 2017
Final Report: Identification of the Vulnerability of the Major and Minor Aquifers of Texas to Subsidence with Regard to Groundwater Pumping – TWDB Contract Number 1648302062
ii
This page is intentionally blank.
Final Report: Identification of the Vulnerability of the Major and Minor Aquifers of Texas to Subsidence with Regard to Groundwater Pumping- TWDB Contract Number 1648302062
Geoscientist and Engineer Seals
The Texas Water Development Board contracted with LRE Water, LLC, a licensed professional geoscientist firm (Texas License No. 50516) and licensed professional engineering firm (Texas License No. 14368). This report documents the work of the following licensed professional geoscientists and licensed professional engineers in the State of Texas:
Jordan Furnans, Ph.D., P.E., P.G. --'"'''"" ---~OFT \\ -..c .... '\ •.•••••.. f j, \\
, ':> •• •• •• •• 0' •• "" • • r
Dr. Furnans was the Project Manager for this work and was responsible for oversight of the project. His work also involved final report review and acceptance.
9£ c::_-=-- 3~/;< f JORDAN E. FURNANS I ,, ................................ ~ . . ; ,,~ ... 97316 ,:,.__, ~· ·~;
ft O~··.~!CENS'i:.~.··~«;:
Signature Date
Michael Keester, P.G.
Mr. Keester was responsible for developing the methodology for assessing the aquifer subsidence risk for each of the major and minor aquifers, performing the subsidence risk assessment, developing the subsidence prediction tool, and for reviewing, editing, and compiling contributions from other report authors. He also assisted with subsidence investigations recommendations for high risk aquifers.
Signature
Dave Colvin, P.G.
Mr. Colvin was responsible for the summary discussion of subsidence risk, developing the subsidence monitoring and investigation recommendations and assessing the limitation: and recommendations for the project results.
Date
iii
'' ~ss ......... ~~"-\\ IONAL€ --,,,,, .... --
Final Report: Identification of the Vulnerability of the Major and Minor Aquifers of Texas to Subsidence with Regard to Groundwater Pumping – TWDB Contract Number 1648302062
iv
Gary Gin, P.G.
Mr. Gin was responsible for the hydrostratigraphy, hydraulic properties, hydraulic heads, and groundwater pumping for the Bone Spring-Victorio Peak, Trinity, and Woodbine aquifers.
_______________________________________________ ________________________ Signature Date
Kaveh Khorzad, P.G.
Mr. Khorzad was responsible for the hydrostratigraphy, hydraulic properties, hydraulic heads, and groundwater pumping for the Blossom, Brazos River Alluvium, Edward (Balcones Fault Zone), Ellenburger-San Saba, Gulf Coast, Hickory, Lipan, Marathon, Marble Falls, Nacatoch, Seymour, and Yegua-Jackson aquifers.
_______________________________________________ ________________________ Signature Date
Grant Snyder, P.G.
Mr. Snyder was responsible for the hydrostratigraphy, hydraulic properties, hydraulic heads, and groundwater pumping for the Blaine, Carrizo-Wilcox, Queen City, and Sparta aquifers.
_______________________________________________ ________________________ Signature Date
3/21/18
3/21/2018
Final Report: Identification of the Vulnerability of the Major and Minor Aquifers of Texas to Subsidence with Regard to Groundwater Pumping – TWDB Contract Number 1648302062
v
Other Contributors
Jacob Bauer, P.G. (WY)
Mr. Bauer assisted with developing the subsidence prediction tool, summary discussion of subsidence risk, and the hydrostratigraphy, hydraulic properties, hydraulic heads, and groundwater pumping for the Igneous Aquifer.
Joel Barber, P.E. (CO)
Mr. Barber assisted with the hydrostratigraphy, hydraulic properties, hydraulic heads, and groundwater pumping for the Capitan Reef Complex, Edwards-Trinity (Plateau), Hueco-Mesilla Bolson, Pecos Valley, Rustler, and West Texas Bolsons aquifers.
Velma Danielson
Ms. Danielson was responsible for stakeholder outreach and stakeholder data compilation.
Lori Erickson
Ms. Erickson was responsible for GIS efforts associated with the project including figure preparation and geodatabase development and organization.
Andrew Worsley
Mr. Worsley assisted with the hydrostratigraphy, hydraulic properties, hydraulic heads, and groundwater pumping for the Blossom, Brazos River Alluvium, Edward (Balcones Fault Zone), Ellenburger-San Saba, Gulf Coast, Hickory, Lipan, Marathon, Marble Falls, Nacatoch, Seymour, and Yegua-Jackson aquifers.
Final Report: Identification of the Vulnerability of the Major and Minor Aquifers of Texas to Subsidence with Regard to Groundwater Pumping – TWDB Contract Number 1648302062
vi
Table of Contents 1 Executive Summary .................................................................................................................................... 1-1
1.1 Materials and Methods (Data Compilation and Stakeholder Outreach) .................. 1-1
4.2 Major Aquifers ................................................................................................................................. 4-4
Final Report: Identification of the Vulnerability of the Major and Minor Aquifers of Texas to Subsidence with Regard to Groundwater Pumping – TWDB Contract Number 1648302062
6.3.3 Pecos Valley ............................................................................................................................. 6-24
Final Report: Identification of the Vulnerability of the Major and Minor Aquifers of Texas to Subsidence with Regard to Groundwater Pumping – TWDB Contract Number 1648302062
7.3.3 Pecos Valley ................................................................................................................................ 7-9
Final Report: Identification of the Vulnerability of the Major and Minor Aquifers of Texas to Subsidence with Regard to Groundwater Pumping – TWDB Contract Number 1648302062
ix
List of Figures
Figure 1.1. Major aquifer subsidence risk. ........................................................................................ 1-7
Figure 1.2. Minor aquifer subsidence risk ......................................................................................... 1-8
Figure 3.1. Confirmed Groundwater Conservation Districts in Texas per TCEQ (2015). ..................................................................................................... 3-4
Figure 3.2. All confirmed Groundwater Conservation Districts contacted and those providing additional data. ..................................................................................... 3-5
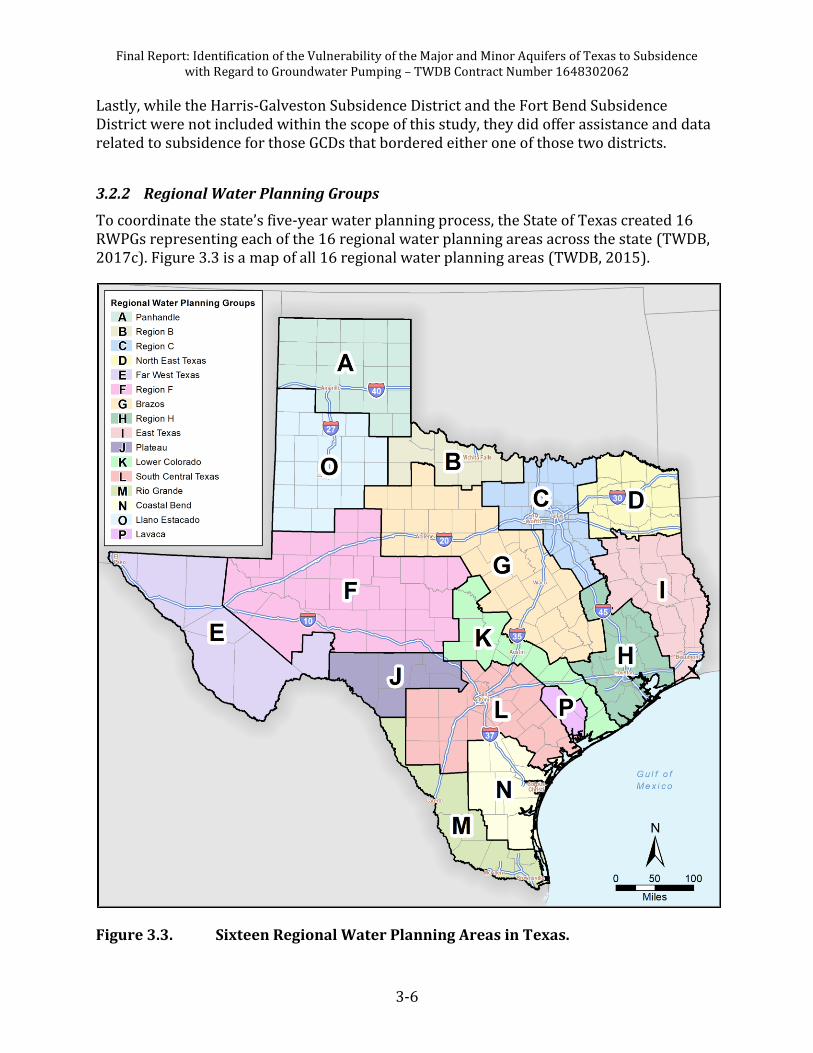
Figure 3.3. Sixteen Regional Water Planning Areas in Texas. ................................................... 3-6
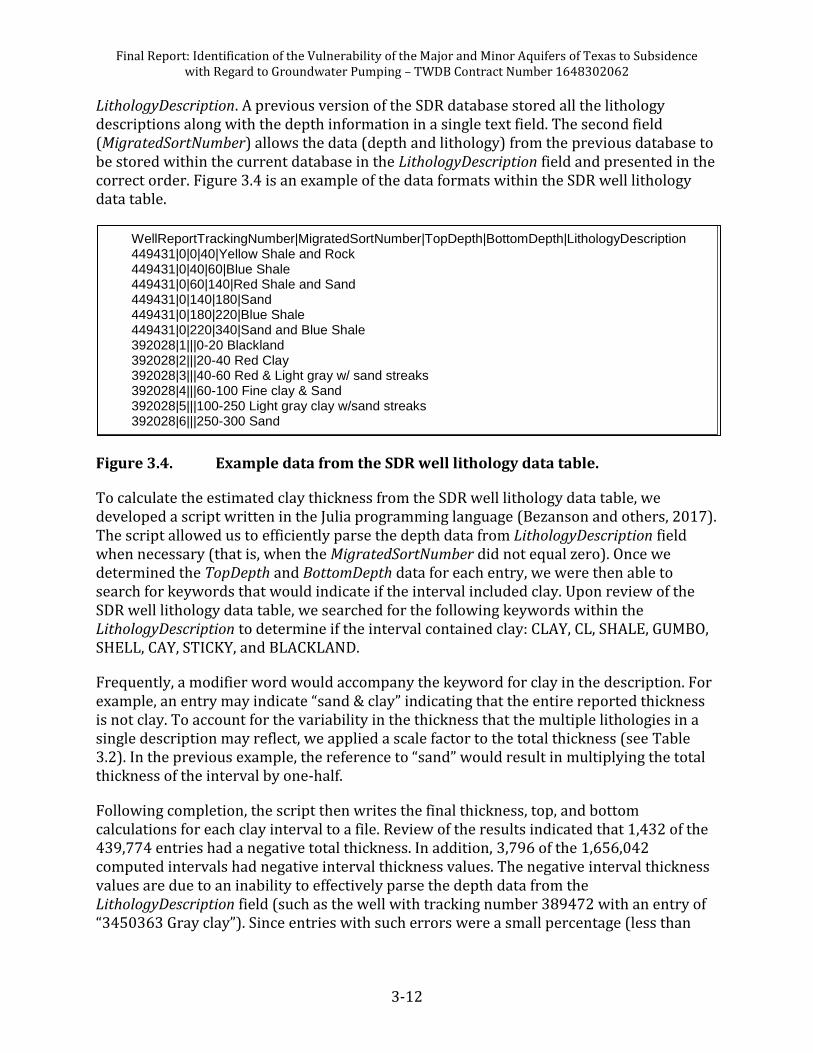
Figure 3.4. Example data from the SDR well lithology data table. ........................................ 3-12
Figure 4.1. Major aquifers in Texas. ..................................................................................................... 4-4
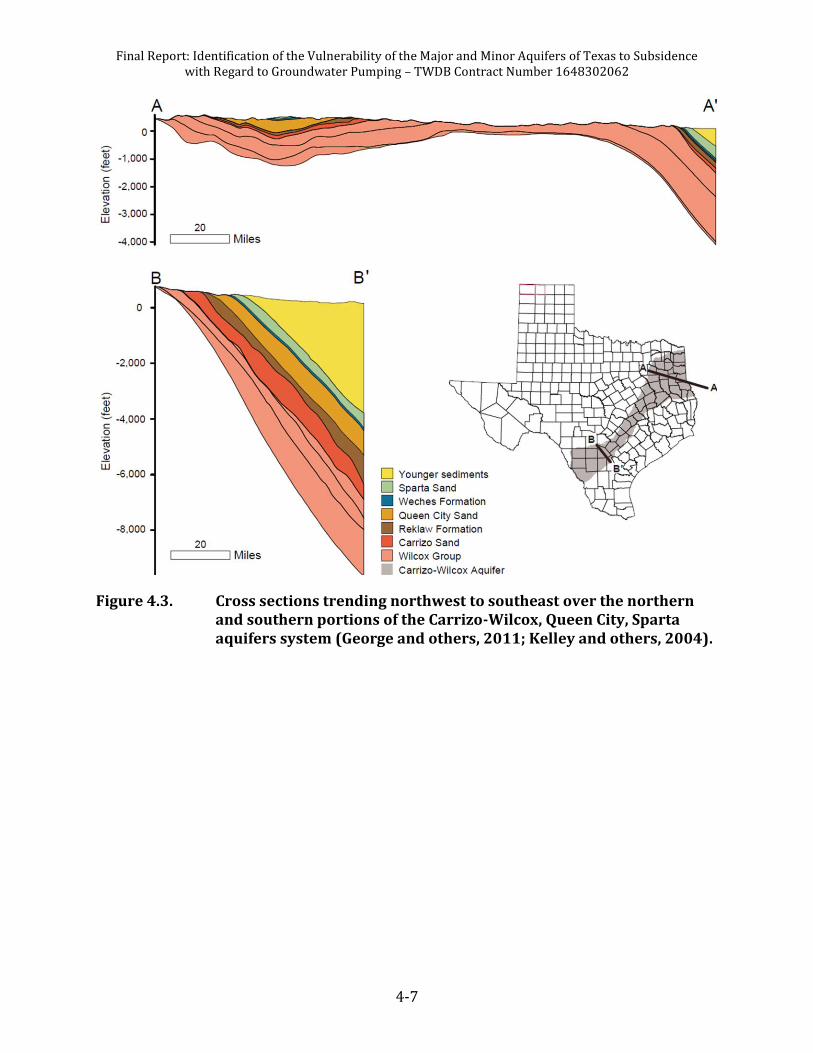
Figure 4.3. Cross sections trending northwest to southeast over the northern and southern portions of the Carrizo-Wilcox, Queen City, Sparta aquifers system (George and others, 2011; Kelley and others, 2004). ........... 4-7
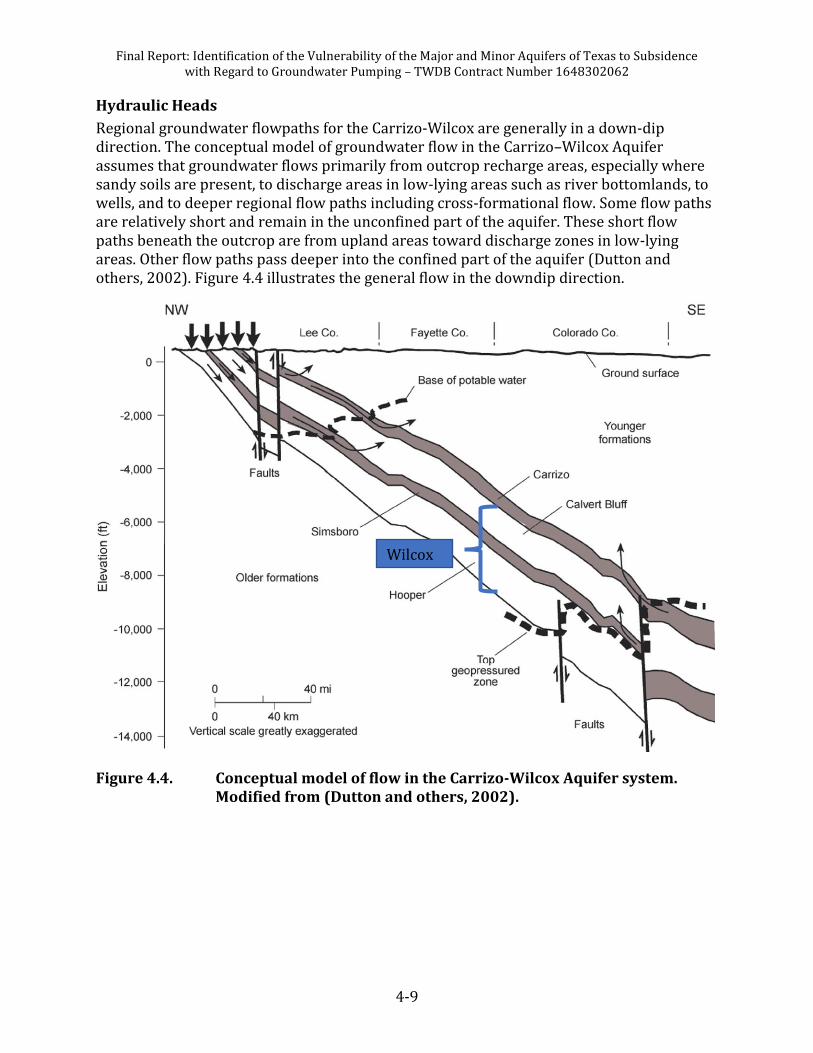
Figure 4.4. Conceptual model of flow in the Carrizo-Wilcox Aquifer system. Modified from (Dutton and others, 2002). ................................................................. 4-9
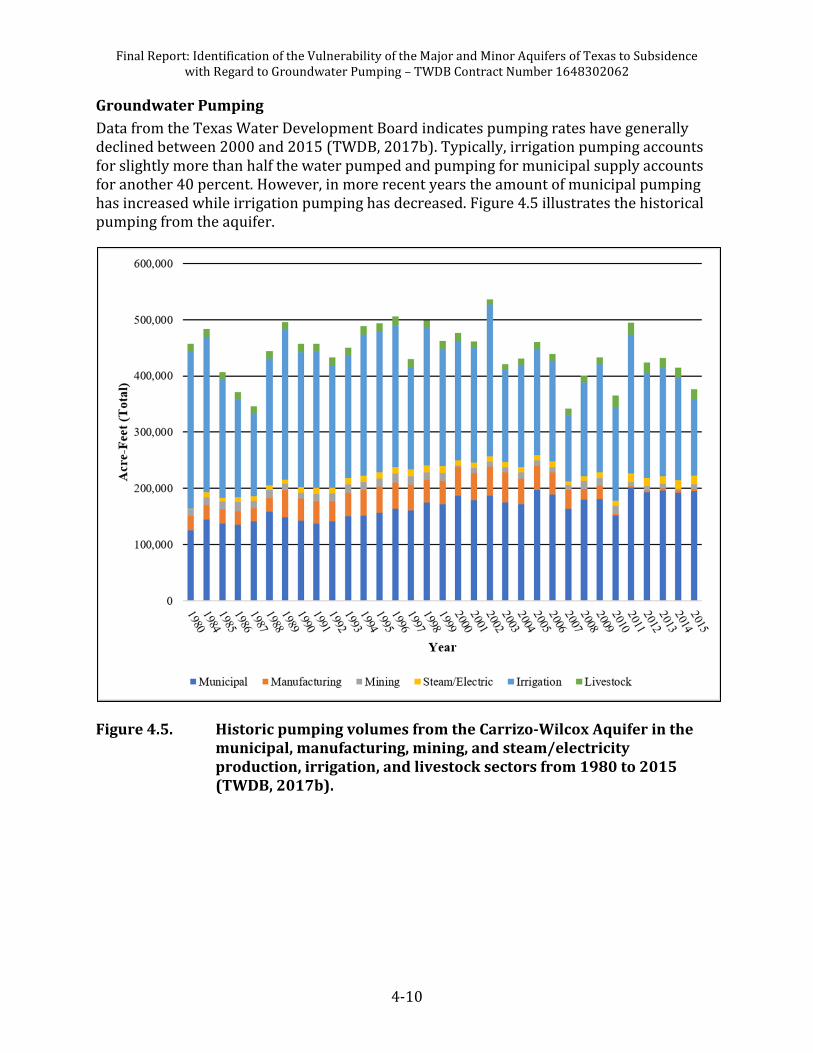
Figure 4.5. Historic pumping volumes from the Carrizo-Wilcox Aquifer in the municipal, manufacturing, mining, and steam/electricity production, irrigation, and livestock sectors from 1980 to 2015 (TWDB, 2017b). ......... 4-10
Figure 4.6. Calculated Carrizo-Wilcox Aquifer clay thickness at well locations. ............. 4-11
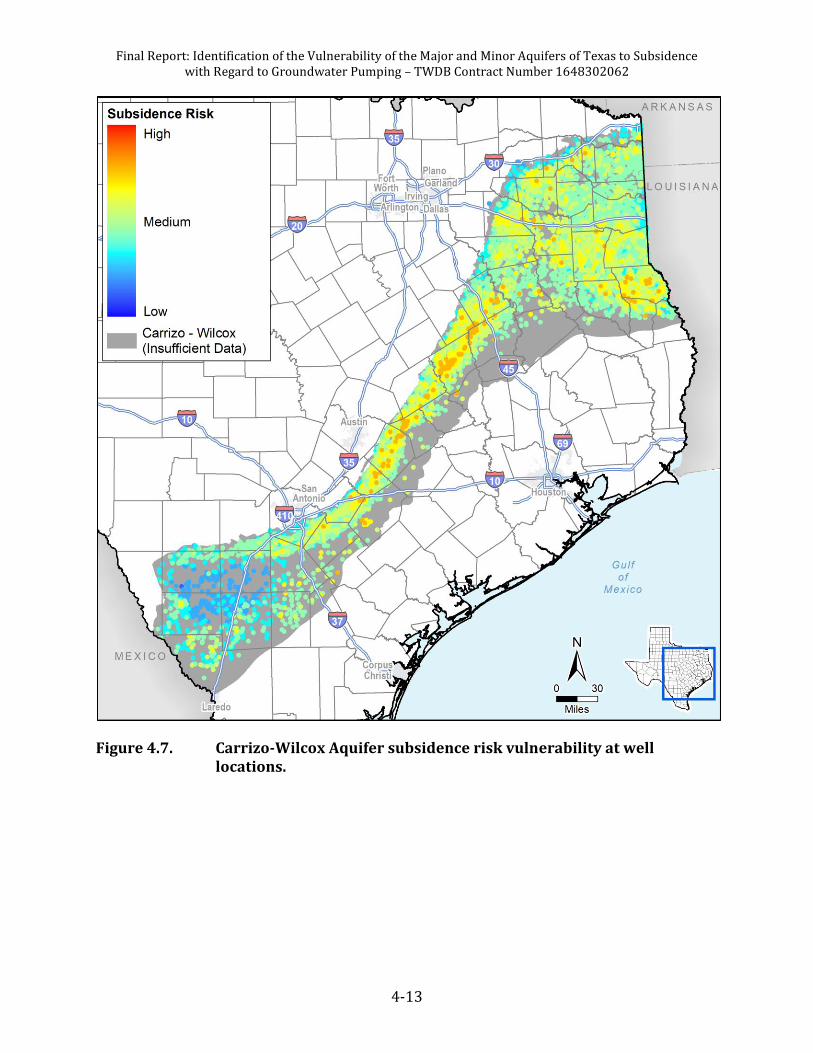
Figure 4.7. Carrizo-Wilcox Aquifer subsidence risk vulnerability at well locations. ..... 4-13
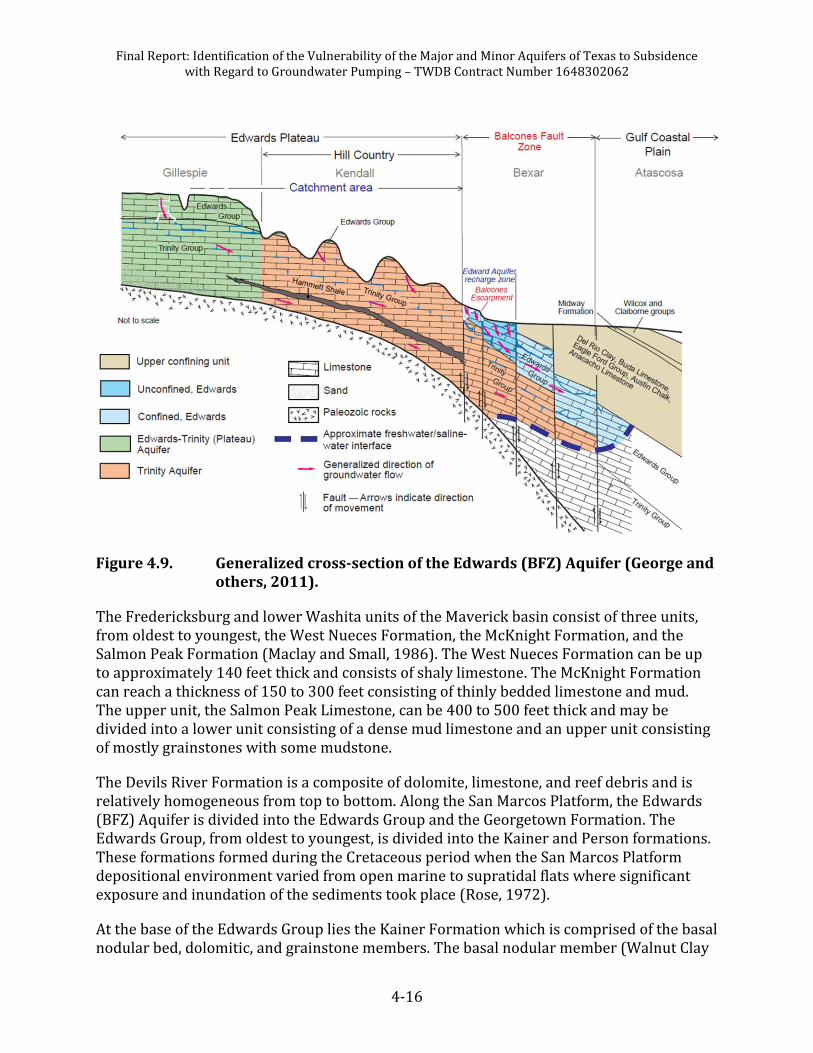
Figure 4.9. Generalized cross-section of the Edwards (BFZ) Aquifer (George and others, 2011). ............................................................................................................. 4-16
Figure 4.10. Historic pumping volumes from the Edwards (BFZ) Aquifer in the municipal, manufacturing, mining, and steam/electricity production, irrigation, and livestock sectors from 1980 to 2015 (TWDB, 2017b). ......... 4-20
Figure 4.11. Calculated Edwards BFZ Aquifer clay thickness at well locations. ................ 4-21
Figure 4.12. Edwards BFZ Aquifer subsidence risk vulnerability at well locations. ........ 4-23
Figure 4.14. Stratigraphic column and geologic and hydrogeologic units within the Edwards-Trinity (Plateau) Aquifer (Anaya and Jones, 2009). ......................... 4-26
Figure 4.15. Cross Section of the Edwards-Trinity (Plateau) Aquifer (George and others, 2011). ............................................................................................................. 4-27
Figure 4.16. Historic pumping volumes from the Edwards-Trinity (Plateau) Aquifer in the municipal, manufacturing, mining, and steam/ electricity production, irrigation, and livestock sectors from 1980 to 2015 (TWDB, 2017b). ..................................................................................... 4-29
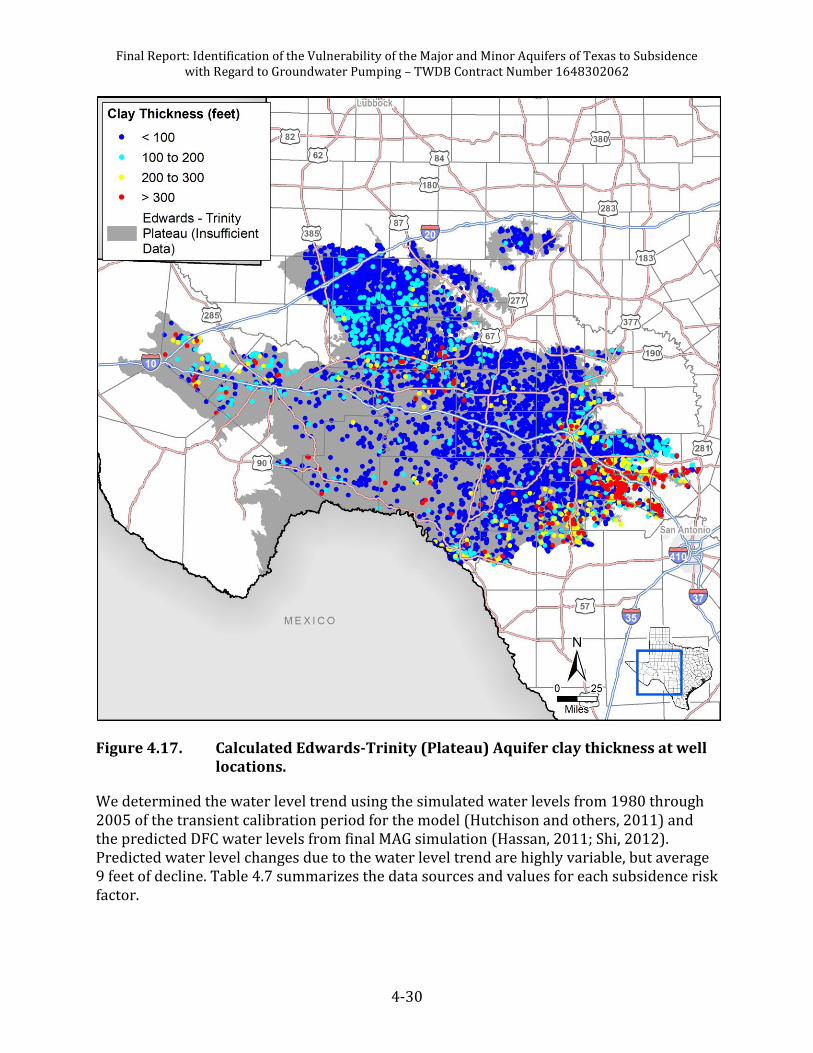
Figure 4.17. Calculated Edwards-Trinity (Plateau) Aquifer clay thickness at well locations. ................................................................................................................ 4-30
Final Report: Identification of the Vulnerability of the Major and Minor Aquifers of Texas to Subsidence with Regard to Groundwater Pumping – TWDB Contract Number 1648302062
x
Figure 4.18. Edwards-Trinity (Plateau) Aquifer subsidence risk vulnerability at well locations. ................................................................................................................ 4-32
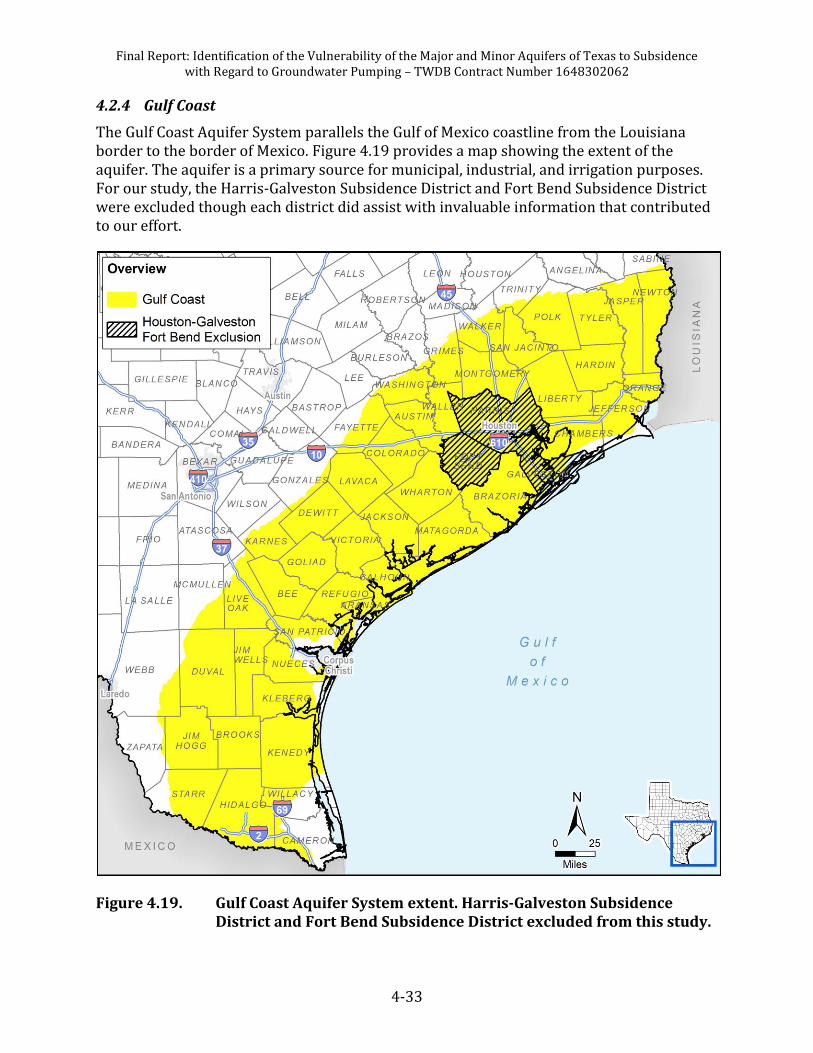
Figure 4.19. Gulf Coast Aquifer System extent. Harris-Galveston Subsidence District and Fort Bend Subsidence District excluded from this study. ......... 4-33
Figure 4.20. Cross-sections of the Gulf Coast Aquifer System (George and others, 2011). Modified from Baker, Jr. (1979), Baker, Jr. and others (1986), Chowdhury and Mace (2003), and Kasmarek and Robinson (2004). ...................................................................................................... 4-36
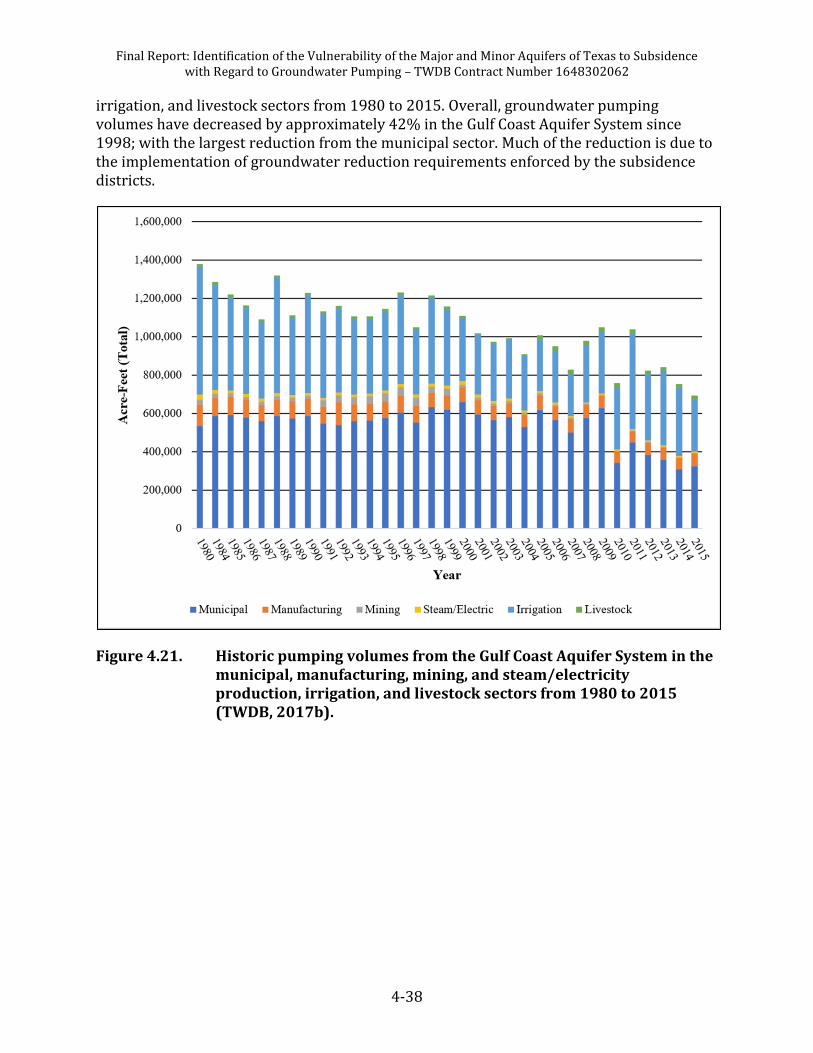
Figure 4.21. Historic pumping volumes from the Gulf Coast Aquifer System in the municipal, manufacturing, mining, and steam/electricity production, irrigation, and livestock sectors from 1980 to 2015 (TWDB, 2017b). ......... 4-38
Figure 4.22. Calculated Gulf Coast Aquifer System clay thickness at well locations. ....... 4-39
Figure 4.23. Gulf Coast Aquifer System subsidence risk vulnerability at well locations. ................................................................................................................ 4-42
Figure 4.25. Geologic cross-section of the Hueco-Mesilla Bolsons Aquifer and associated geologic units. Modified from George and others (2011). .......... 4-45
Figure 4.26. Historic pumping volumes from the Hueco-Mesilla Bolson Aquifer in the municipal, manufacturing, mining, and steam/electricity production, irrigation, and livestock sectors from 1980 to 2015 (TWDB, 2017b). ......... 4-46
Figure 4.27. Calculated Hueco-Mesilla Bolsons Aquifer clay thickness at well locations. ................................................................................................................ 4-47
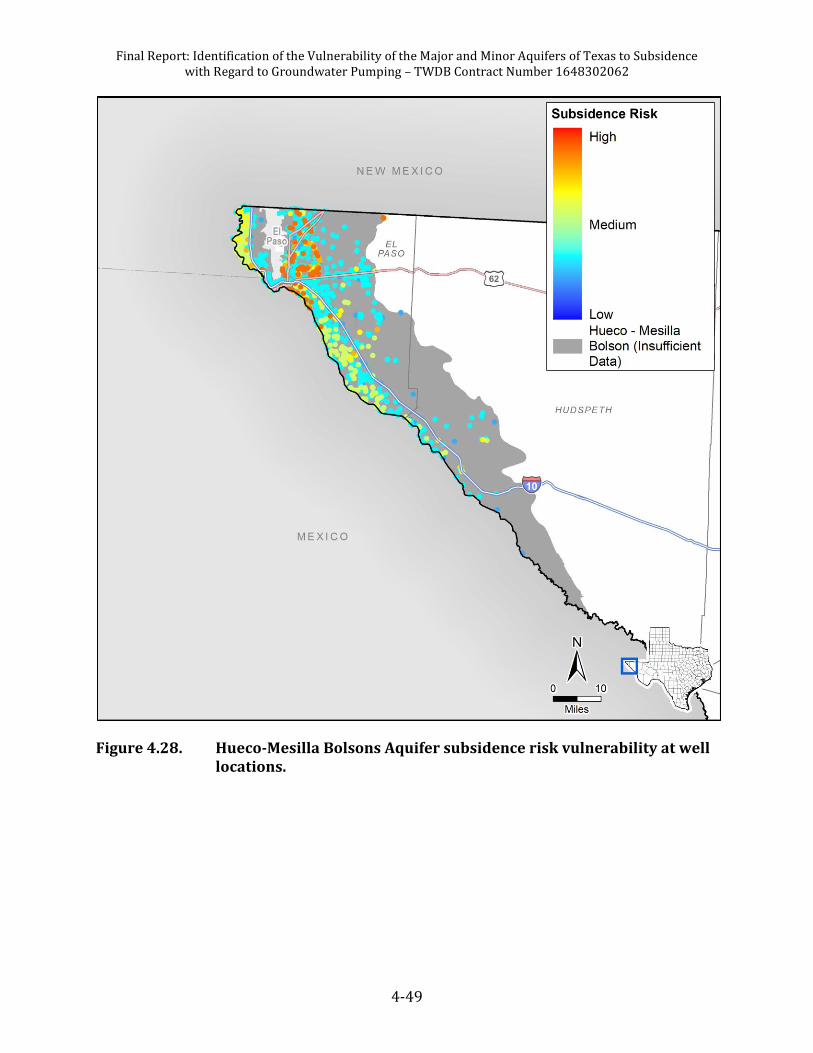
Figure 4.28. Hueco-Mesilla Bolsons Aquifer subsidence risk vulnerability at well locations. ................................................................................................................ 4-49
Figure 4.30. Cross-section illustrating the configuration of aquifers associated with the Ogallala (Deeds and others, 2015). ........................................................... 4-51
Figure 4.31. Historic pumping volumes from the Ogallala Aquifer in the municipal, manufacturing, mining, and steam/electricity production, irrigation, and livestock sectors from 1980 to 2015 (TWDB, 2017b). .............................. 4-52
Figure 4.32. Calculated Ogallala Aquifer clay thickness at well locations. ........................... 4-53
Figure 4.33. Ogallala Aquifer subsidence risk vulnerability at well locations. ................... 4-55
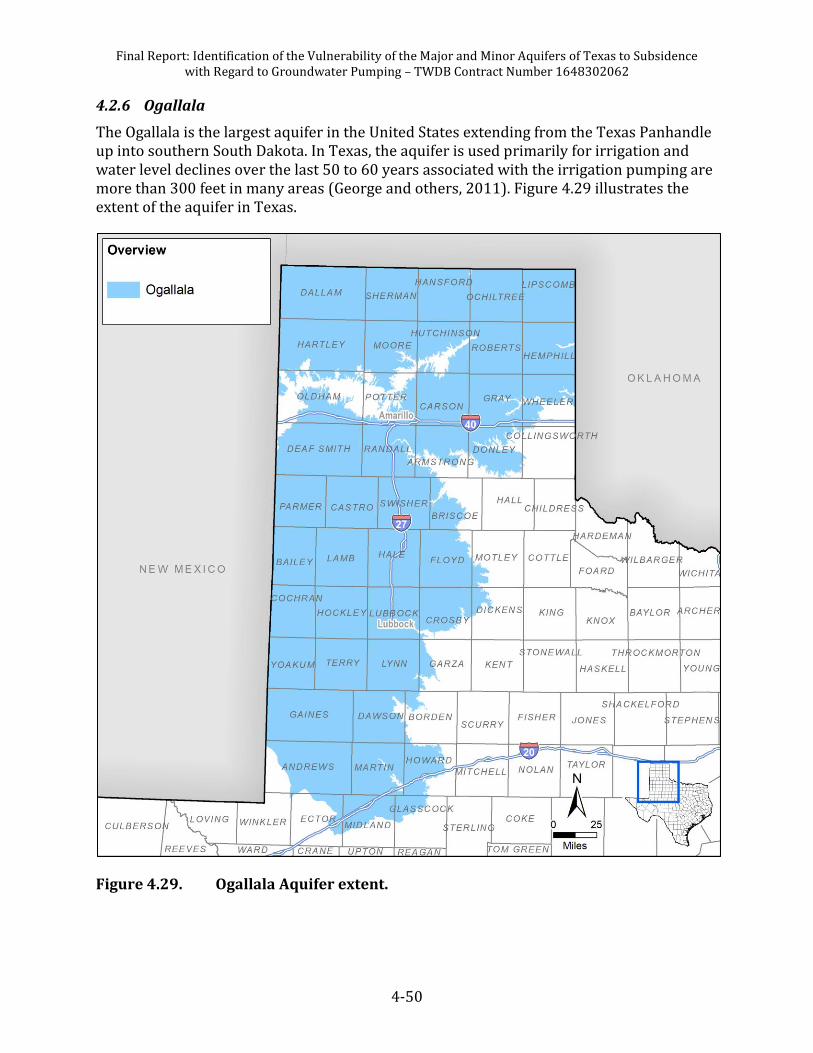
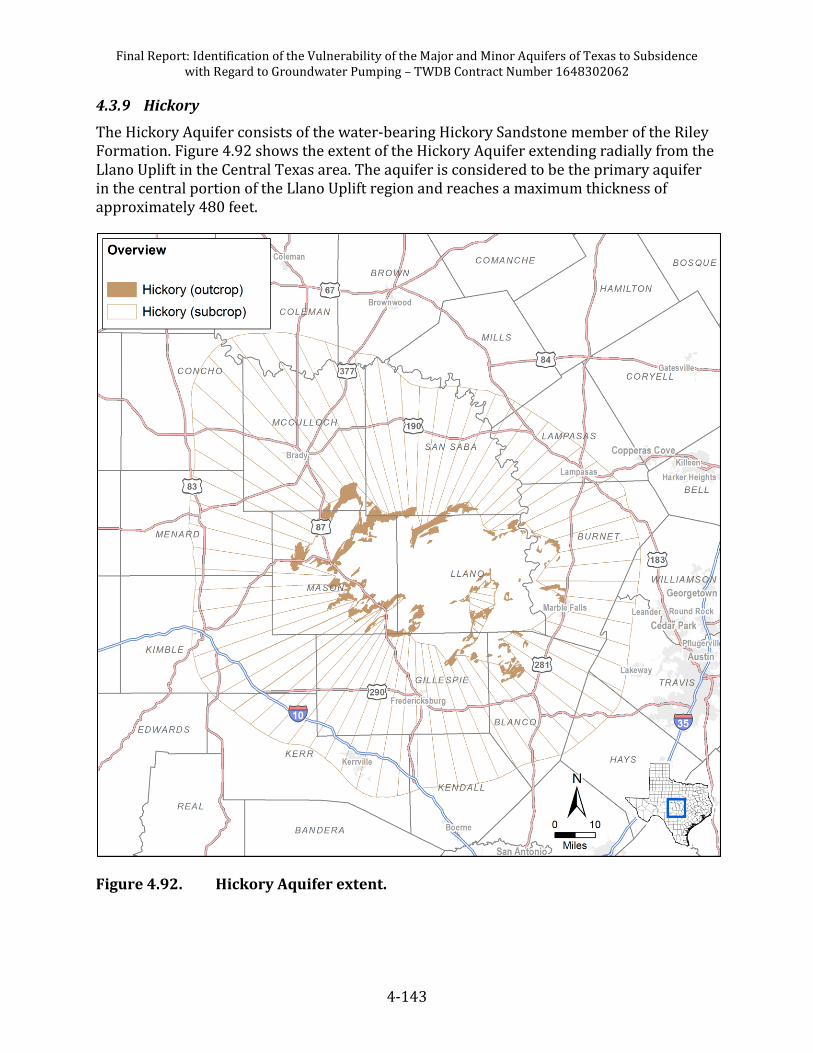
Figure 4.34. Pecos Valley Aquifer extent. .......................................................................................... 4-56
Figure 4.35. Cross section of the Pecos Valley Aquifer highlights the two solution collapse troughs that form the thick deposits of water bearing strata (George and others, 2011). .............................................................. 4-58
Figure 4.36. Historic pumping volumes from the Pecos Valley Aquifer in the municipal, manufacturing, mining, and steam/electricity production, irrigation, and livestock sectors from 2000 to 2015 (TWDB, 2017b). ......... 4-59
Figure 4.37. Calculated Pecos Valley Aquifer clay thickness at well locations. .................. 4-60
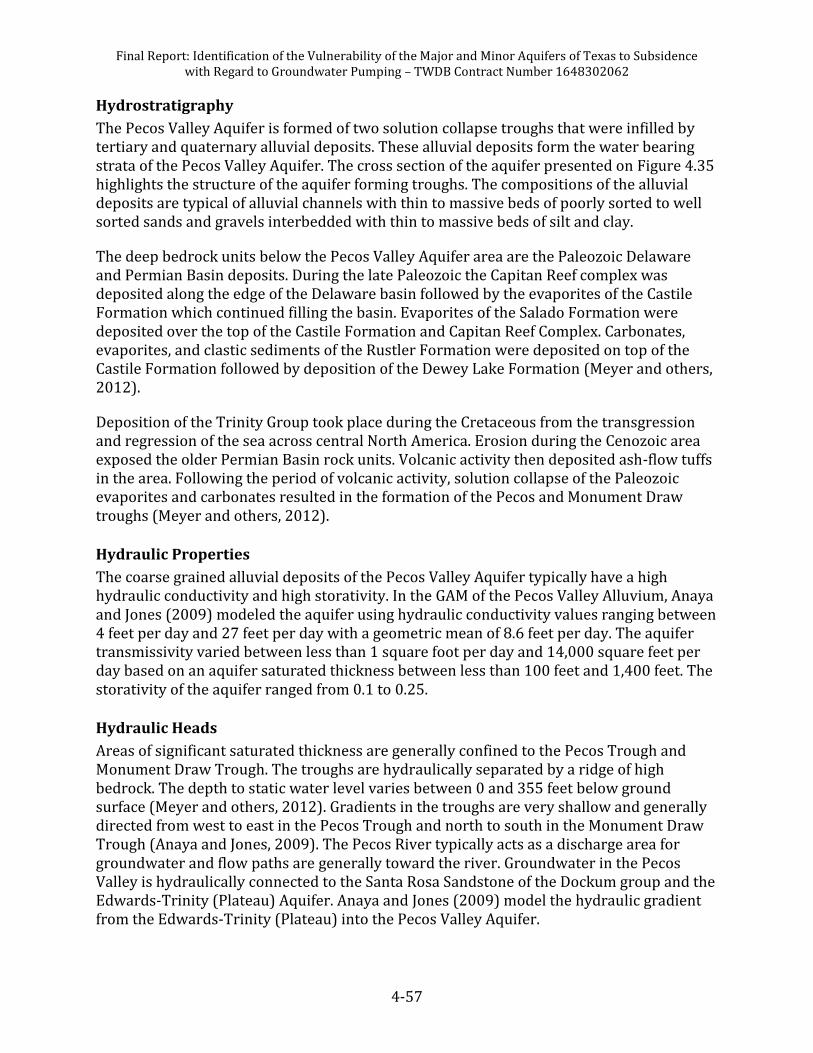
Figure 4.38. Pecos Valley Aquifer subsidence risk vulnerability at well locations. .......... 4-62
Final Report: Identification of the Vulnerability of the Major and Minor Aquifers of Texas to Subsidence with Regard to Groundwater Pumping – TWDB Contract Number 1648302062
Figure 4.40. Conceptualized cross-section of the geologic sequence of the Seymour Aquifer and underlying Permian units. Modified from Ewing and others (2004). ............................................................................................... 4-65
Figure 4.41. Historic pumping volumes from the Seymour Aquifer in the municipal, manufacturing, mining, and steam/electricity production, irrigation, and livestock sectors from 1980 to 2015 (TWDB, 2017b). ......... 4-67
Figure 4.42. Calculated Seymour Aquifer clay thickness at well locations. ......................... 4-68
Figure 4.43. Seymour Aquifer subsidence risk vulnerability at well locations. ................. 4-70
Figure 4.45. Conceptualized cross-section of the geologic sequence of the northern portion of the Trinity Aquifer (Kelley and others, 2014). .............. 4-73
Figure 4.46. Conceptualized cross-section of the geologic sequence of the Hill Country portion of the Trinity Aquifer (Jones and others, 2011). ................. 4-74
Figure 4.47. Historic pumping volumes from the Trinity Aquifer in the municipal, manufacturing, mining, and steam/electricity production, irrigation, and livestock sectors from 1980 to 2015 (TWDB, 2017b). .............................. 4-76
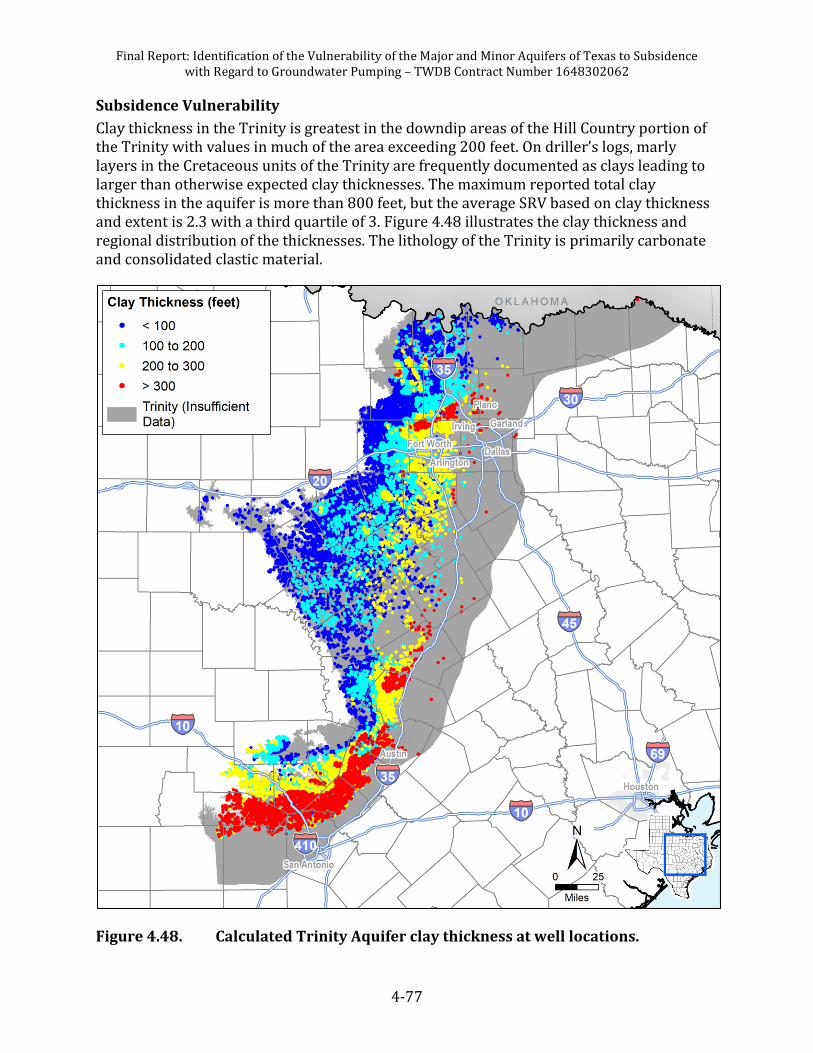
Figure 4.48. Calculated Trinity Aquifer clay thickness at well locations. ............................. 4-77
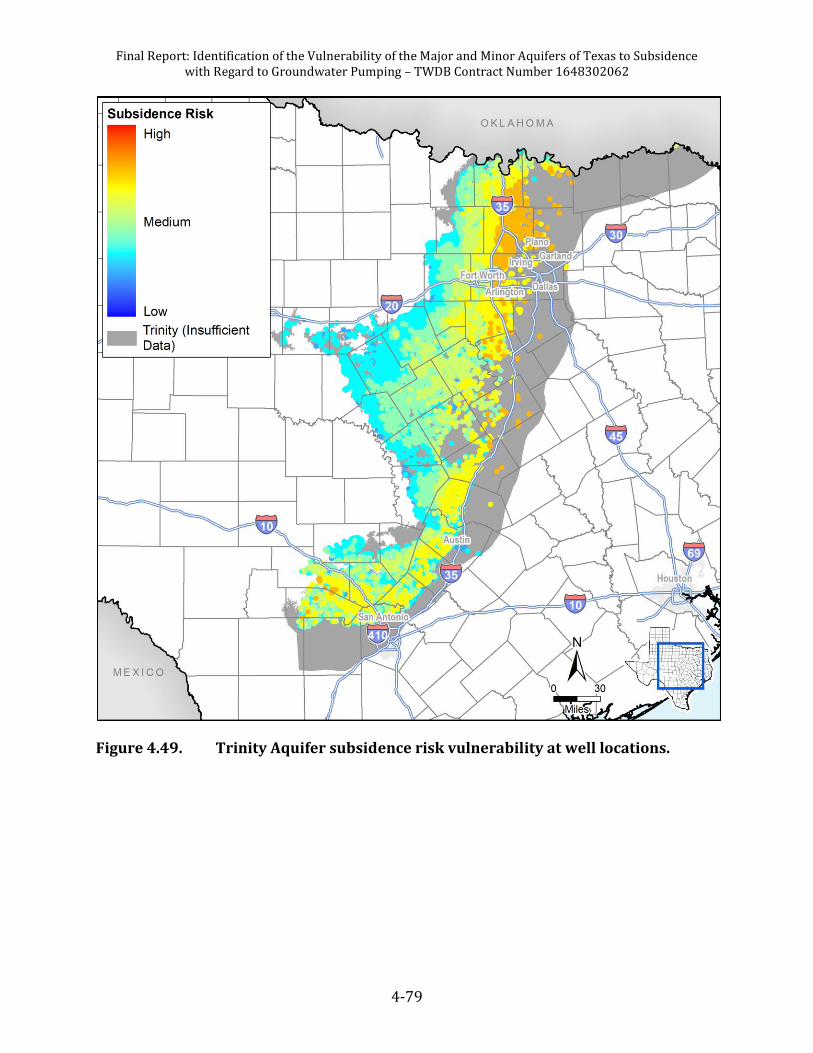
Figure 4.49. Trinity Aquifer subsidence risk vulnerability at well locations. ..................... 4-79
Figure 4.50. Minor aquifers in Texas. ................................................................................................. 4-80
Figure 4.52. Historic pumping volumes from the Blaine Aquifer in the municipal, manufacturing, mining, and steam/electricity production, irrigation, and livestock sectors from 1980 to 2015 (TWDB, 2017b). .............................. 4-84
Figure 4.53. Calculated Blaine Aquifer clay thickness at well locations. .............................. 4-85
Figure 4.54. Blaine Aquifer subsidence risk vulnerability at well locations. ...................... 4-87
Figure 4.56. West-east geologic cross-section along the Blossom Aquifer (McLaurin, 1988; TWDB, 2018). .................................................................................. 4-91
Figure 4.57. Historic pumping volumes from the Blossom Aquifer in the municipal, manufacturing, mining, and steam/electricity production, irrigation, and livestock sectors from 1980 to 2015 (TWDB, 2017b). .............................. 4-93
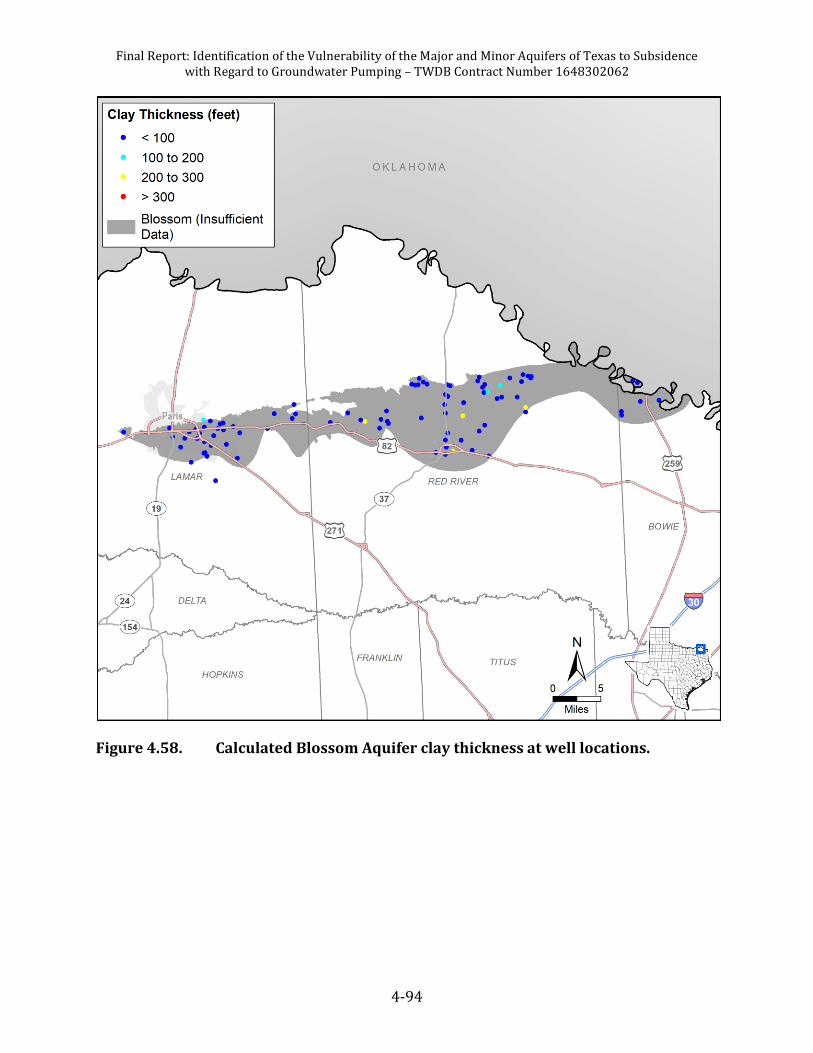
Figure 4.58. Calculated Blossom Aquifer clay thickness at well locations. .......................... 4-94
Figure 4.59. Blossom Aquifer subsidence risk vulnerability at well locations. .................. 4-96
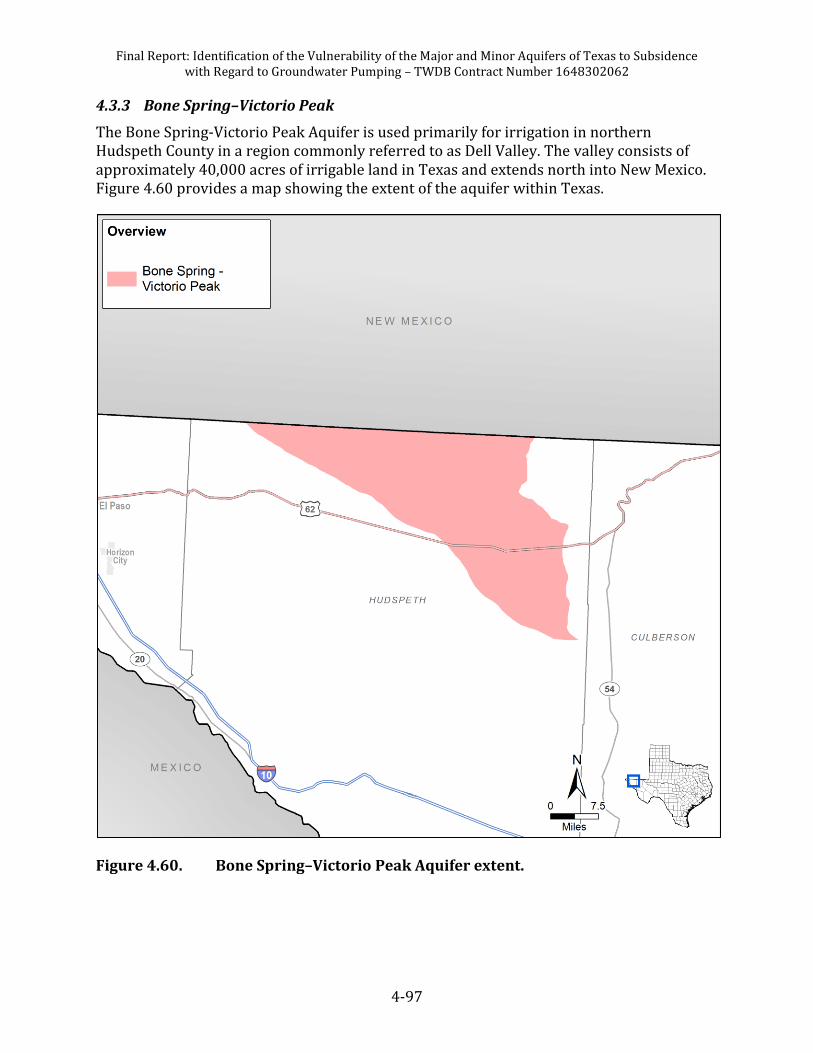
Figure 4.60. Bone Spring–Victorio Peak Aquifer extent. ............................................................. 4-97
Figure 4.61. Generalized cross-section from west to east illustrating the Bone Spring–Victorio Peak Aquifer and associated features (George and others, 2011). ............................................................................................ 4-98
Final Report: Identification of the Vulnerability of the Major and Minor Aquifers of Texas to Subsidence with Regard to Groundwater Pumping – TWDB Contract Number 1648302062
xii
Figure 4.62. Historic pumping volumes from the Bone Spring–Victorio Peak Aquifer in the municipal, manufacturing, mining, and steam/electricity production, irrigation, and livestock sectors from 1980 to 2015 (TWDB, 2017b). .............................................................................................................. 4-100
Figure 4.63. Calculated Bone Spring–Victorio Peak Aquifer clay thickness at well locations. ............................................................................................................. 4-101
Figure 4.64. Bone Spring–Victorio Peak Aquifer subsidence risk vulnerability at well locations. ............................................................................................................. 4-103
Figure 4.65. Brazos River Alluvium Aquifer extent. ................................................................... 4-104
Figure 4.66. Historic pumping volumes from the Brazos River Alluvium Aquifer in the municipal, manufacturing, mining, and steam/electricity production, irrigation, and livestock sectors from 1980 to 2015 (TWDB, 2017b). .............................................................................................................. 4-107
Figure 4.67. Calculated Brazos River Alluvium Aquifer clay thickness at well locations. ............................................................................................................. 4-108
Figure 4.68. Brazos River Alluvium Aquifer subsidence risk vulnerability at well locations. ............................................................................................................. 4-110
Figure 4.70. Geologic section of the Capital Reef Complex Aquifer. Modified from Standen and others (2009). ............................................................................. 4-113
Figure 4.71. Structural features associated with the Capital Reef Complex Aquifer (Standen and others, 2009). ...................................................................... 4-114
Figure 4.72. Historic pumping volumes from the Capitan Reef Complex Aquifer in the municipal, manufacturing, mining, and steam/electricity production, irrigation, and livestock sectors from 1980 to 2015 (TWDB, 2017b). .............................................................................................................. 4-116
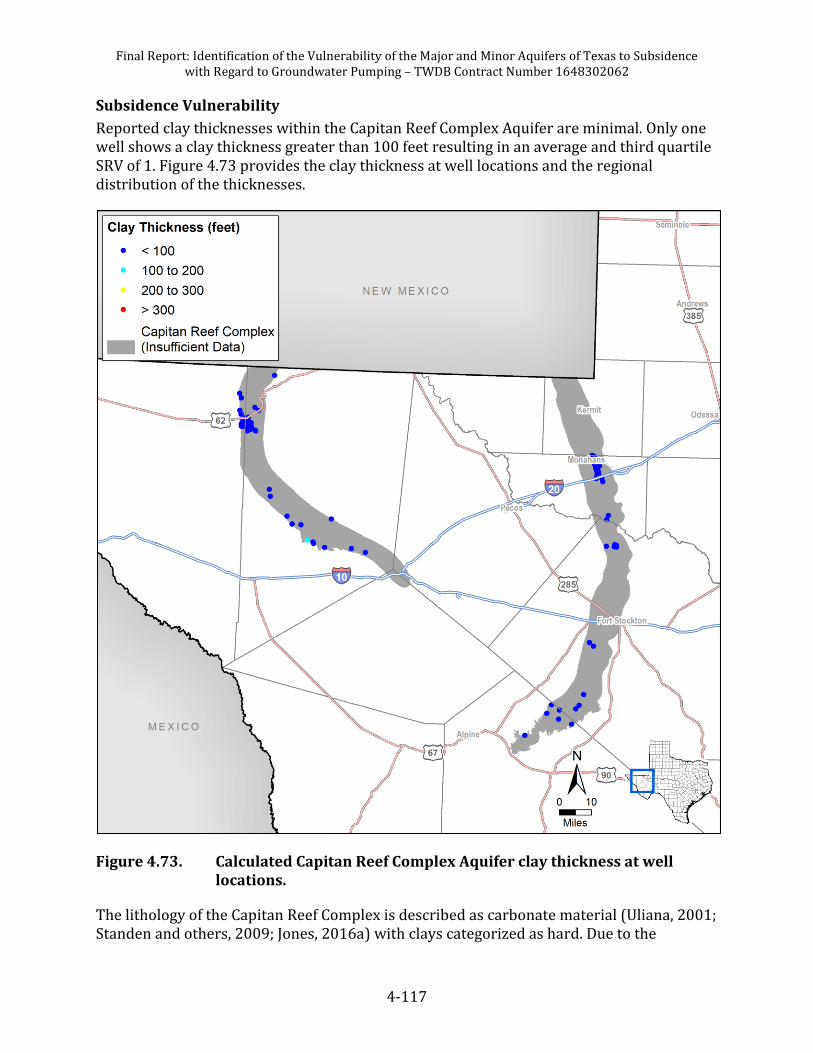
Figure 4.73. Calculated Capitan Reef Complex Aquifer clay thickness at well locations. ............................................................................................................. 4-117
Figure 4.74. Capitan Reef Complex Aquifer subsidence risk vulnerability at well locations. ............................................................................................................. 4-119
Figure 4.76. Cross-section illustrating the configuration of aquifers associated with the Dockum (Deeds and others, 2015). ....................................................... 4-121
Figure 4.77. Historic pumping volumes from the Dockum Aquifer in the municipal, manufacturing, mining, and steam/electricity production, irrigation, and livestock sectors from 1980 to 2015 (TWDB, 2017b). ........................... 4-122
Figure 4.78. Estimated pumping from the Dockum Aquifer in Texas (Deeds and others, 2015). ........................................................................................... 4-123
Figure 4.79. Calculated Dockum Aquifer clay thickness at well locations. ....................... 4-124
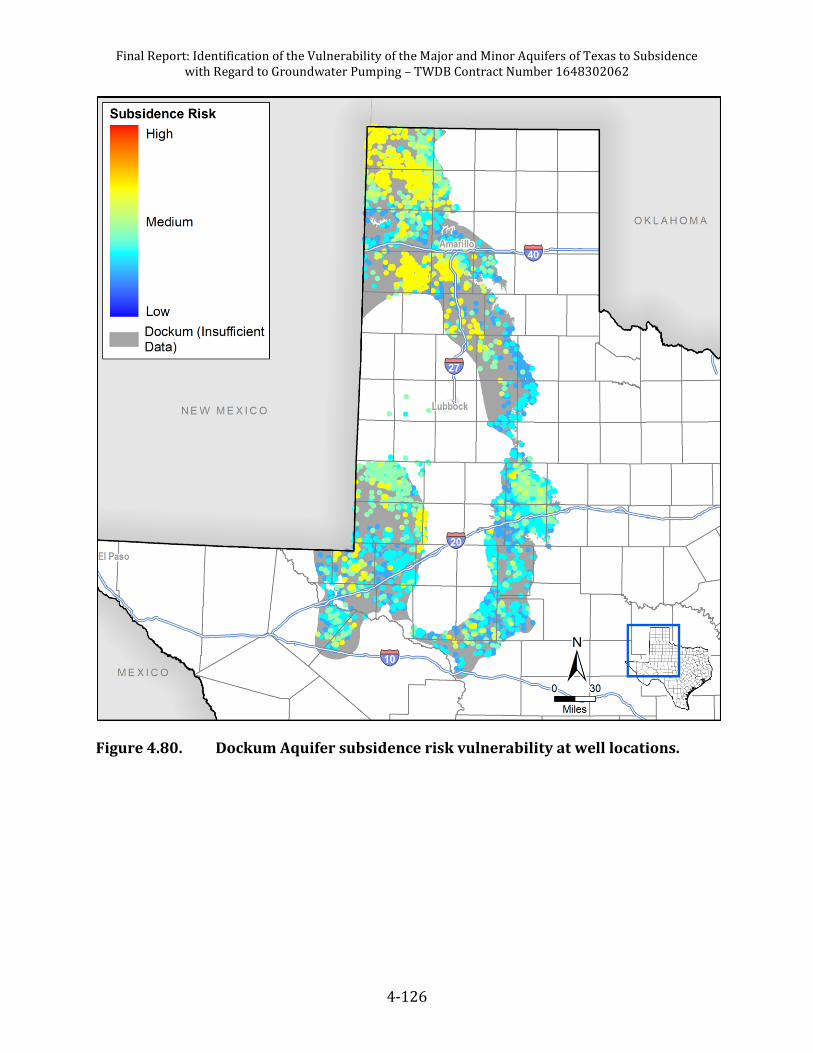
Figure 4.80. Dockum Aquifer subsidence risk vulnerability at well locations. ............... 4-126
Final Report: Identification of the Vulnerability of the Major and Minor Aquifers of Texas to Subsidence with Regard to Groundwater Pumping – TWDB Contract Number 1648302062
xiii
Figure 4.82. Cross-section illustrating the configuration of aquifers associated with the Edwards-Trinity (High Plains) Aquifer (Deeds and others, 2015). ........................................................................................... 4-128
Figure 4.83. Historic pumping volumes from the Edwards–Trinity (High Plains) Aquifer in the municipal, manufacturing, mining, and steam/electricity production, irrigation, and livestock sectors from 1980 to 2015 (TWDB, 2017b). .............................................................................................................. 4-129
Figure 4.84. Estimated pumping from the Edwards–Trinity (High Plains) Aquifer (Deeds and others, 2015). ........................................................................... 4-130
Figure 4.85. Calculated Edwards–Trinity (High Plains) Aquifer clay thickness at well locations. ............................................................................................................. 4-131
Figure 4.86. Edwards–Trinity (High Plains) Aquifer subsidence risk vulnerability at well locations. ............................................................................................................. 4-133
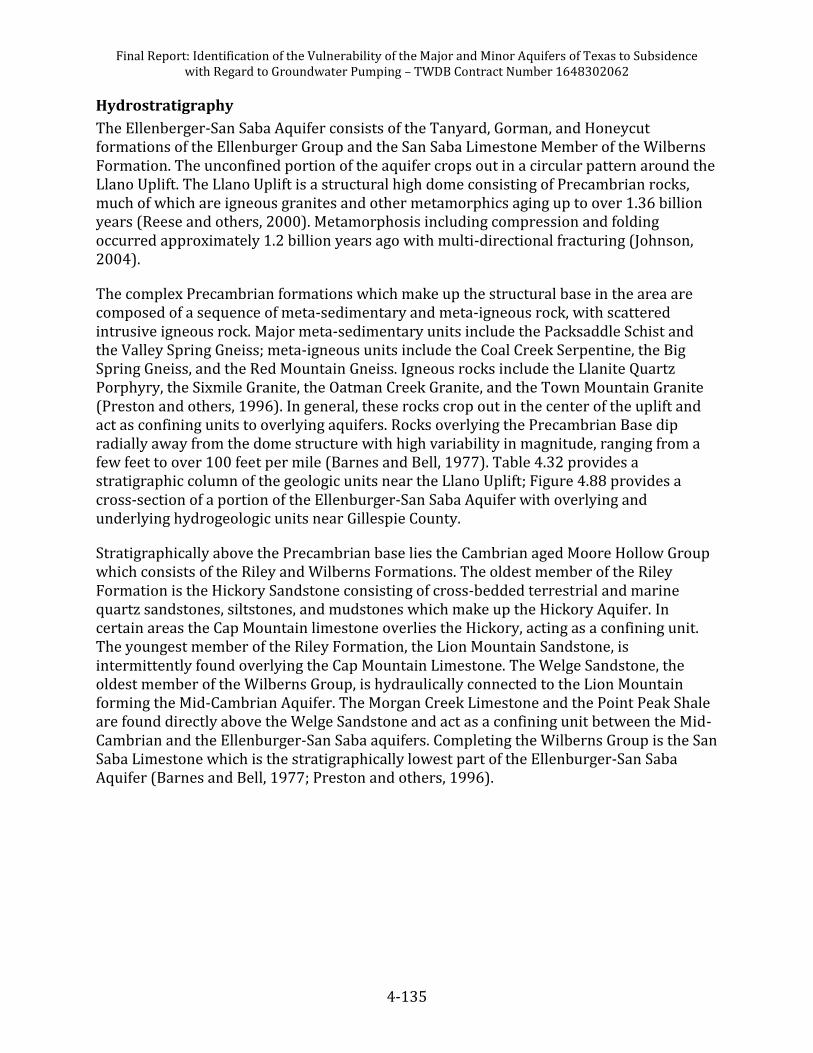
Figure 4.87. Ellenburger-San Saba Aquifer extent. .................................................................... 4-134
Figure 4.88. Cross-section of the Ellenburger-San Saba Aquifer along with overlying and underlying hydrogeologic units (George and others, 2011). ......................................................................................... 4-137
Figure 4.89. Historic pumping volumes from the Ellenburger-San Saba Aquifer in the municipal, manufacturing, mining, and steam/electricity production, irrigation, and livestock sectors from 1980 to 2015 (TWDB, 2017b). .............................................................................................................. 4-139
Figure 4.90. Calculated Ellenburger-San Saba Aquifer clay thickness at well locations. ............................................................................................................. 4-140
Figure 4.91. Ellenburger-San Saba Aquifer subsidence risk vulnerability at well locations. ............................................................................................................. 4-142
Figure 4.93. Cross-section of the Hickory Aquifer along with overlying and underlying hydrogeologic units (George and others, 2011). ........................ 4-146
Figure 4.94. Historic pumping volumes from the Hickory Aquifer in the municipal, manufacturing, mining, and steam/electricity production, irrigation, and livestock sectors from 1980 to 2015 (TWDB, 2017b). ........................... 4-147
Figure 4.95. Calculated Hickory Aquifer clay thickness at well locations. ........................ 4-148
Figure 4.96. Hickory Aquifer subsidence risk vulnerability at well locations. ................ 4-150
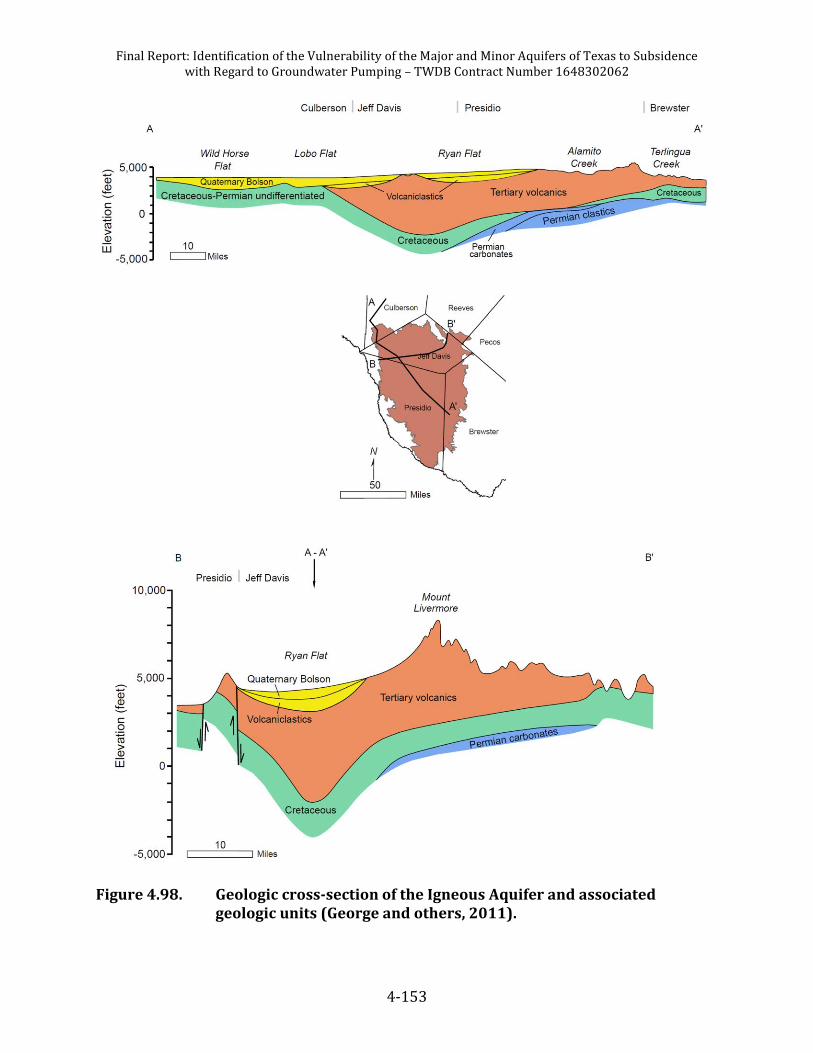
Figure 4.98. Geologic cross-section of the Igneous Aquifer and associated geologic units (George and others, 2011). ............................................................ 4-153
Figure 4.99. Historic pumping volumes from the Igneous Aquifer in the municipal, manufacturing, mining, and steam/electricity production, irrigation, and livestock sectors from 1980 to 2015 (TWDB, 2017b). ...... 4-154
Figure 4.100. Calculated Igneous Aquifer clay thickness at well locations. ........................ 4-155
Figure 4.101. Igneous Aquifer subsidence risk vulnerability at well locations. ................ 4-157
Final Report: Identification of the Vulnerability of the Major and Minor Aquifers of Texas to Subsidence with Regard to Groundwater Pumping – TWDB Contract Number 1648302062
Figure 4.103. Cross-sections of the Lipan Aquifer in Tom Green County (Beach and others, 2004b). ........................................................................................ 4-160
Figure 4.104. Historic pumping volumes from the Lipan Aquifer in the municipal, manufacturing, mining, and steam/electricity production, irrigation, and livestock sectors from 1980 to 2015 (TWDB, 2017b). ........................... 4-161
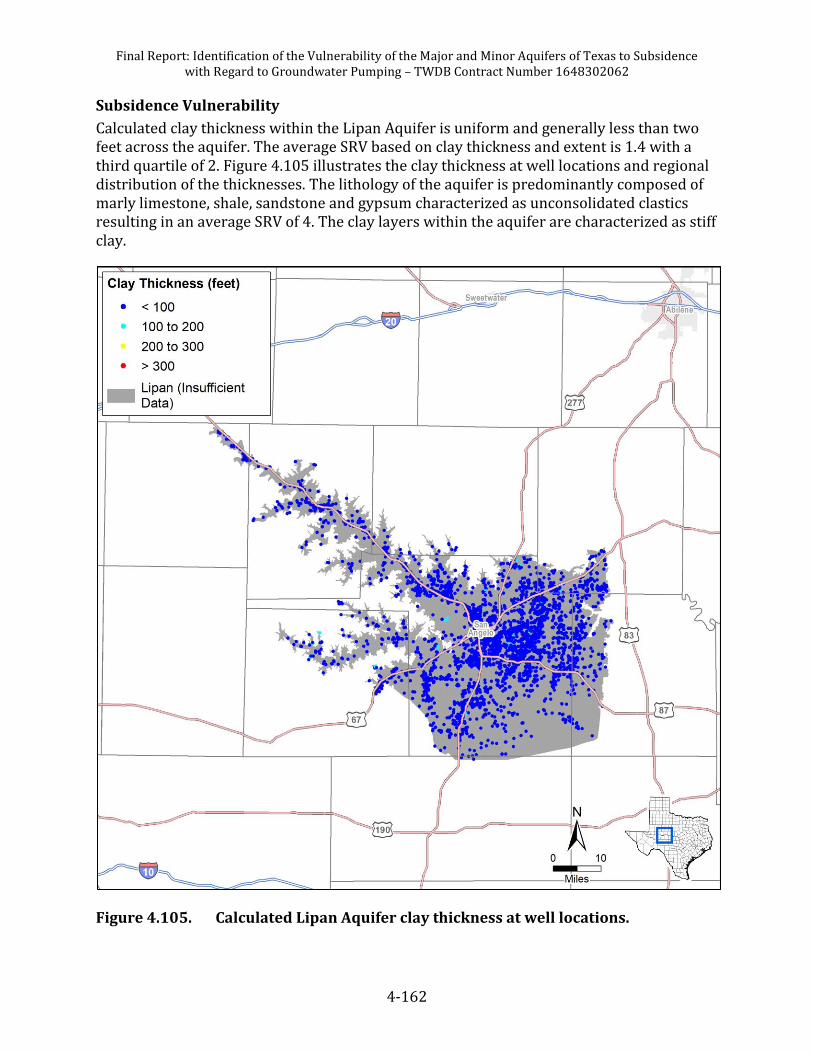
Figure 4.105. Calculated Lipan Aquifer clay thickness at well locations. ............................. 4-162
Figure 4.106. Lipan Aquifer subsidence risk vulnerability at well locations. ..................... 4-164
Figure 4.108. Historic pumping volumes from the Marathon Aquifer in the municipal, manufacturing, mining, and steam/electricity production, irrigation, and livestock sectors from 1980 to 2015 (TWDB, 2017b). ........................... 4-168
Figure 4.109. Calculated Marathon Aquifer clay thickness at well locations. .................... 4-169
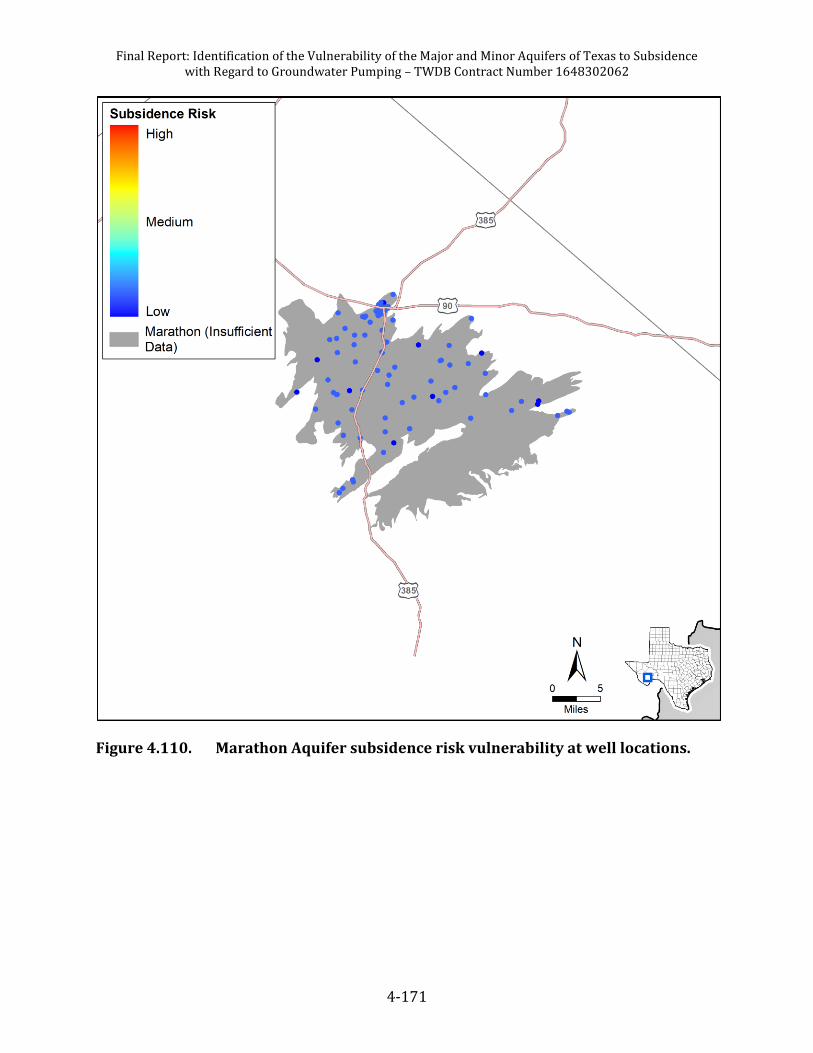
Figure 4.110. Marathon Aquifer subsidence risk vulnerability at well locations. ............ 4-171
Figure 4.112. Historic pumping volumes from the Marble Falls Aquifer in the municipal, manufacturing, mining, and steam/electricity production, irrigation, and livestock sectors from 1980 to 2015 (TWDB, 2017b). ...... 4-176
Figure 4.113. Calculated Marble Falls Aquifer clay thickness at well locations. ............... 4-177
Figure 4.114. Marble Falls Aquifer subsidence risk vulnerability at well locations. ....... 4-179
Figure 4.116. Historic pumping volumes from the Nacatoch Aquifer in the municipal, manufacturing, mining, and steam/electricity production, irrigation, and livestock sectors from 1980 to 2015 (TWDB, 2017b). ...... 4-183
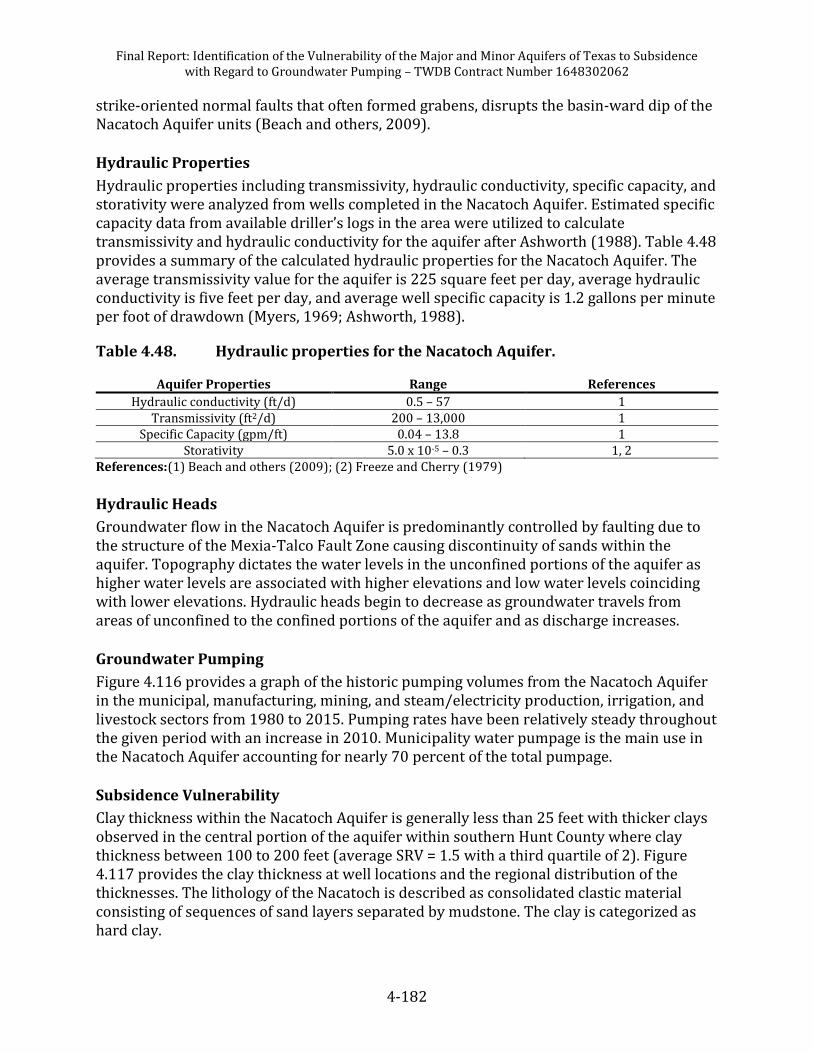
Figure 4.117. Calculated Nacatoch Aquifer clay thickness at well locations. ..................... 4-184
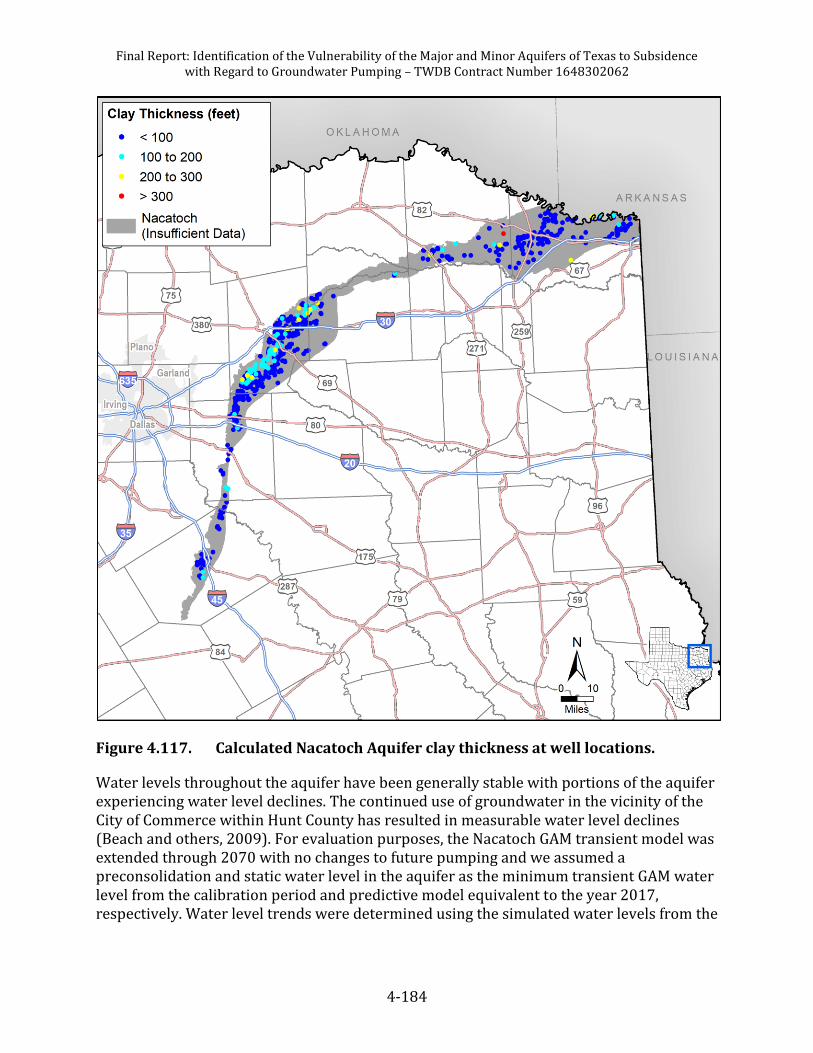
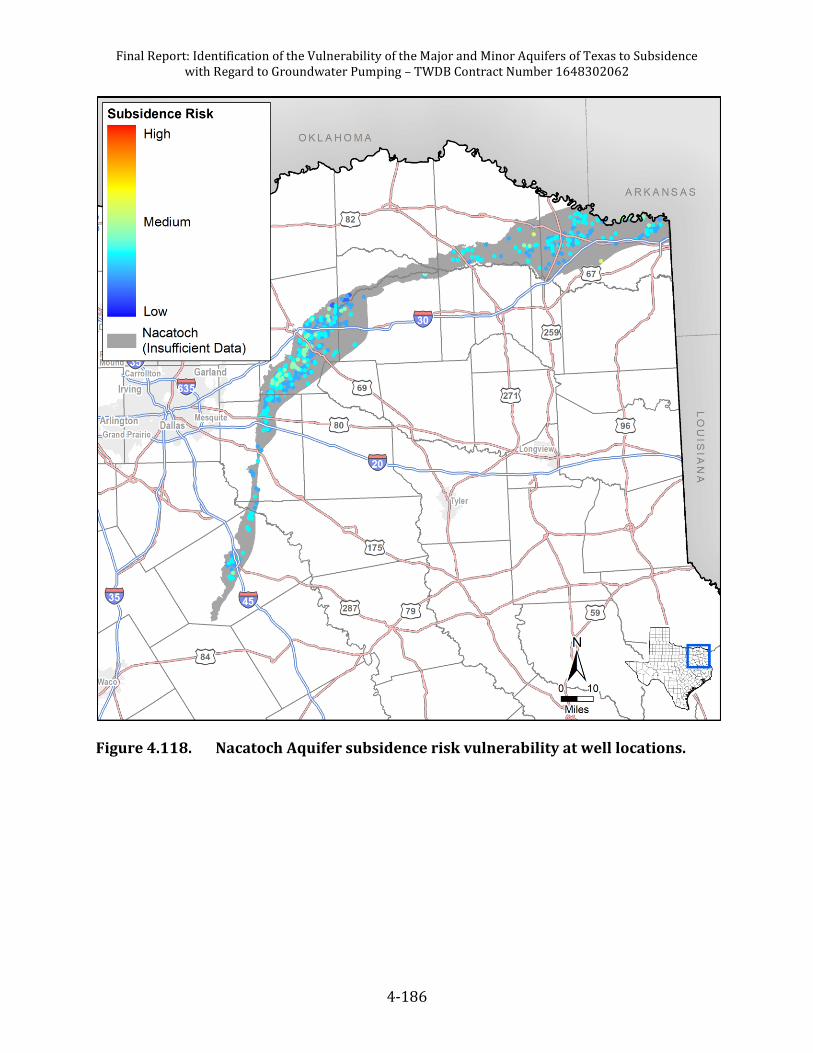
Figure 4.118. Nacatoch Aquifer subsidence risk vulnerability at well locations. ............. 4-186
Figure 4.119. Queen City Aquifer extent. .......................................................................................... 4-187
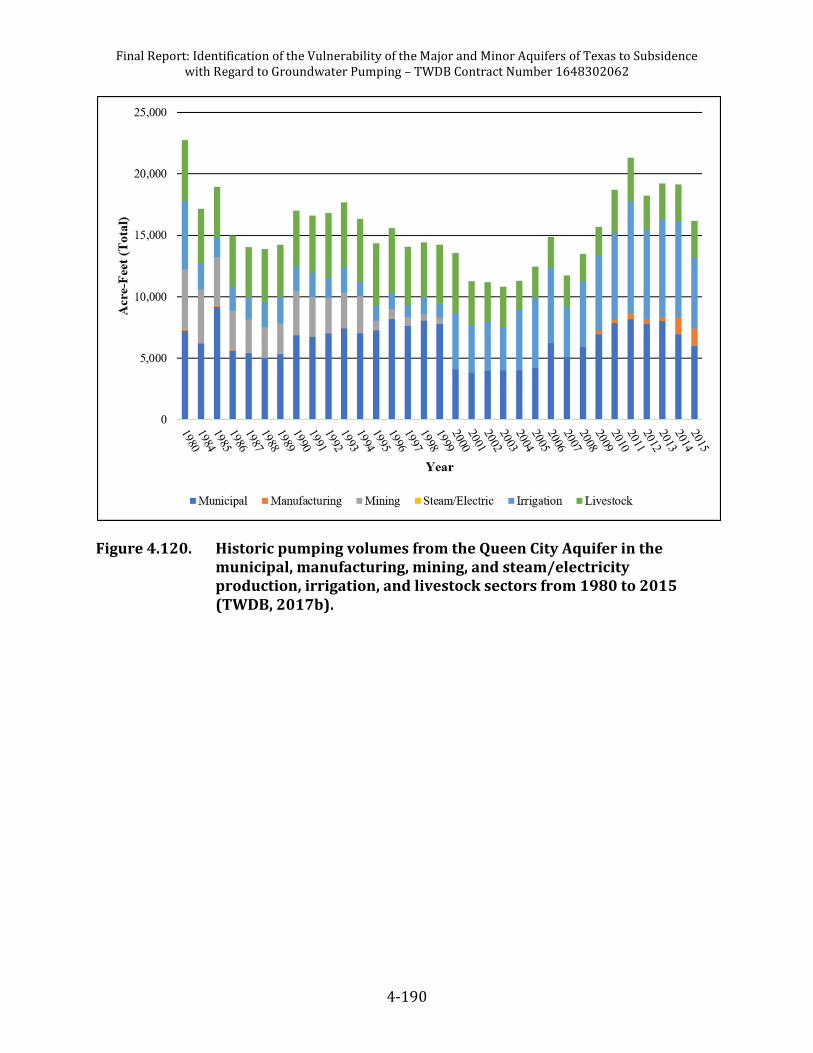
Figure 4.120. Historic pumping volumes from the Queen City Aquifer in the municipal, manufacturing, mining, and steam/electricity production, irrigation, and livestock sectors from 1980 to 2015 (TWDB, 2017b). ...... 4-190
Figure 4.121. Calculated Queen City Aquifer clay thickness at well locations. Results shown beyond aquifer boundary reflect extent of the groundwater availability model. .............................................................................. 4-191
Figure 4.122. Queen City Aquifer subsidence risk vulnerability at well locations. Results shown beyond aquifer boundary reflect extent of the groundwater availability model. .............................................................................. 4-193
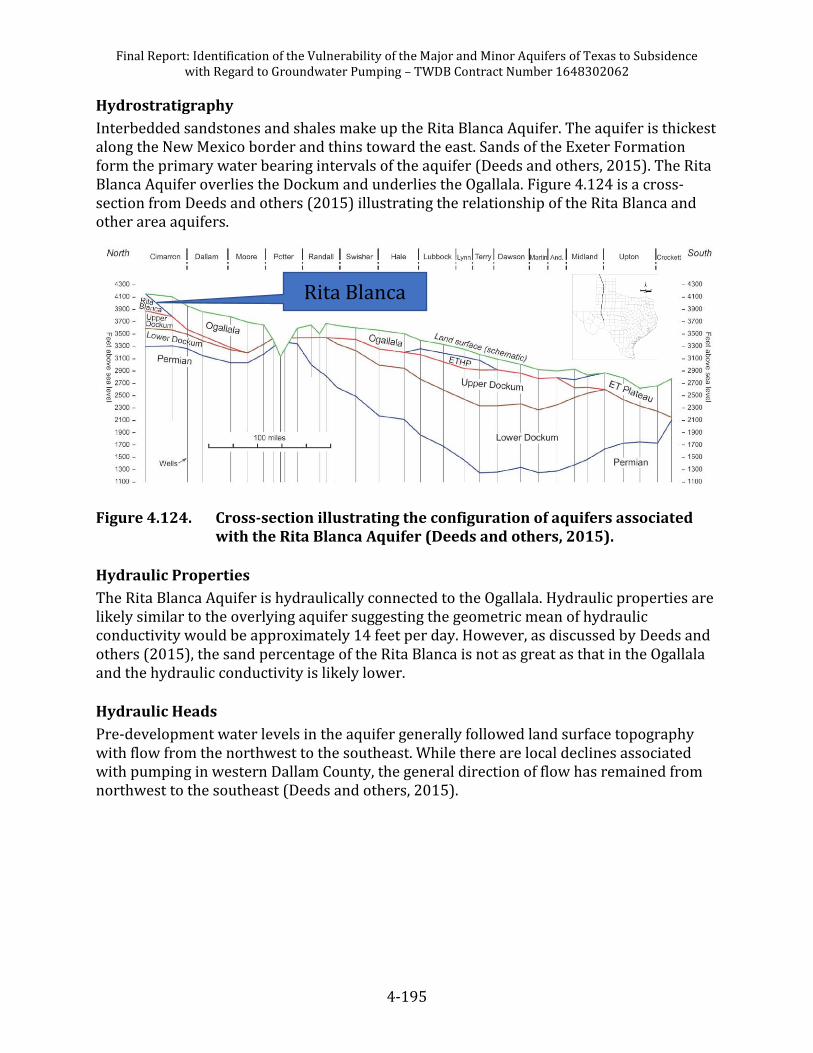
Figure 4.124. Cross-section illustrating the configuration of aquifers associated with the Rita Blanca Aquifer (Deeds and others, 2015). ................................. 4-195
Final Report: Identification of the Vulnerability of the Major and Minor Aquifers of Texas to Subsidence with Regard to Groundwater Pumping – TWDB Contract Number 1648302062
xv
Figure 4.125. Historic pumping volumes from the Rita Blanca Aquifer in the municipal, manufacturing, mining, and steam/electricity production, irrigation, and livestock sectors from 1980 to 2015 (TWDB, 2017b). ...... 4-196
Figure 4.126. Calculated Rita Blanca Aquifer clay thickness at well locations. ................. 4-197
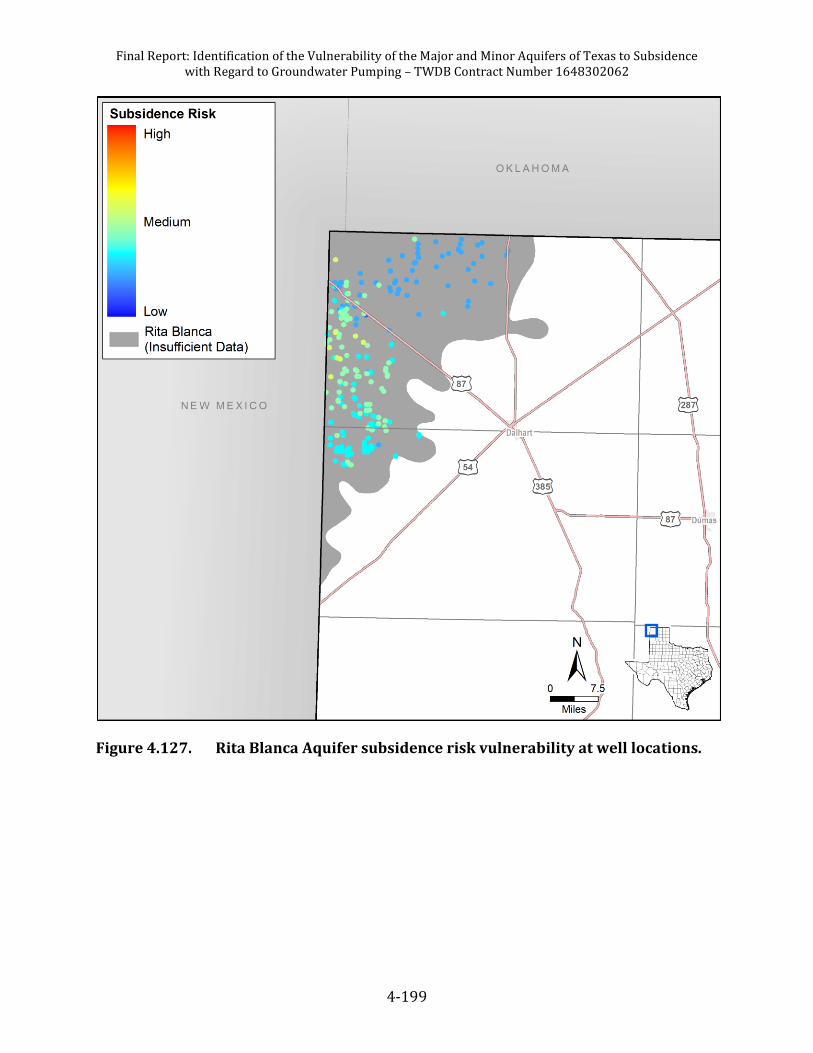
Figure 4.127. Rita Blanca Aquifer subsidence risk vulnerability at well locations. ......... 4-199
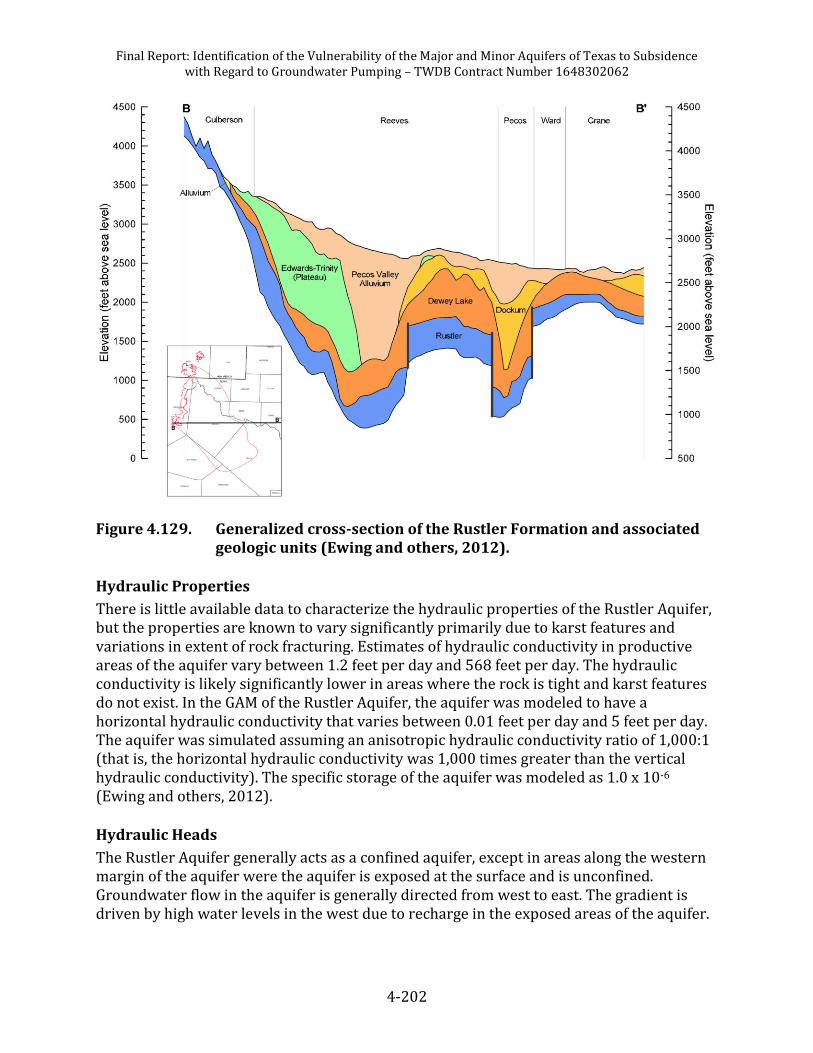
Figure 4.129. Generalized cross-section of the Rustler Formation and associated geologic units (Ewing and others, 2012). ............................................................. 4-202
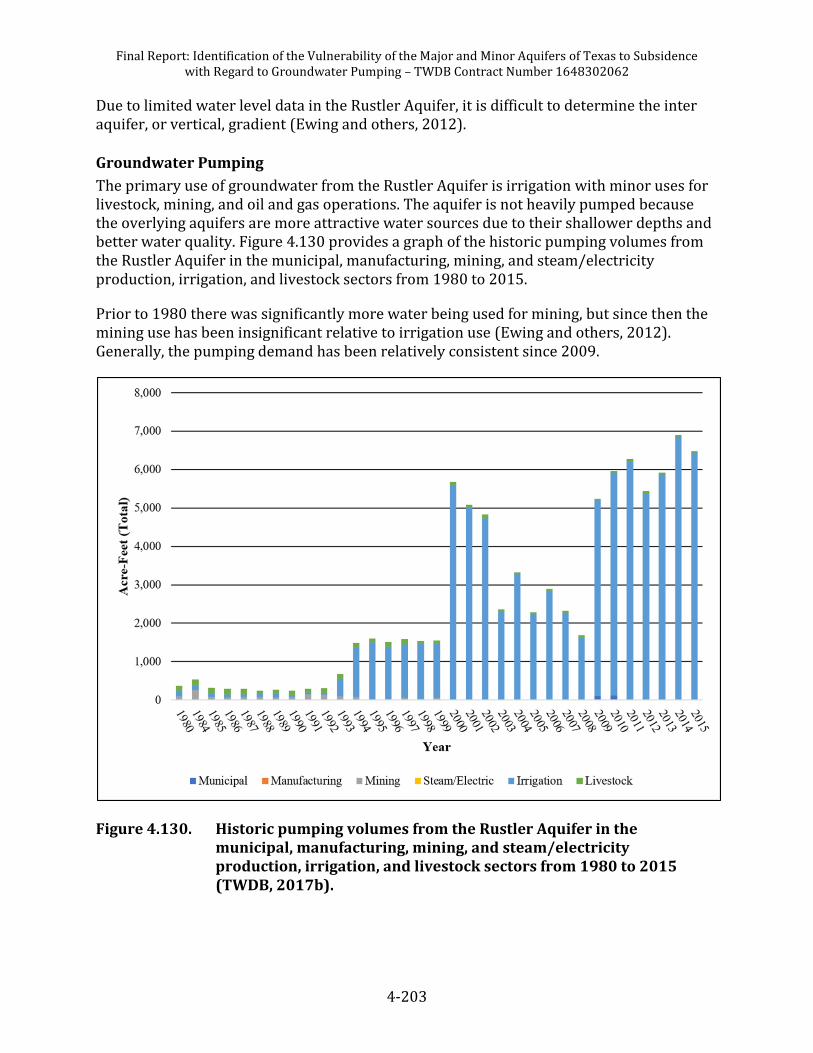
Figure 4.130. Historic pumping volumes from the Rustler Aquifer in the municipal, manufacturing, mining, and steam/electricity production, irrigation, and livestock sectors from 1980 to 2015 (TWDB, 2017b). ...... 4-203
Figure 4.131. Calculated Rustler Aquifer clay thickness at well locations. ......................... 4-204
Figure 4.132. Rustler Aquifer subsidence risk vulnerability at well locations. ................. 4-206
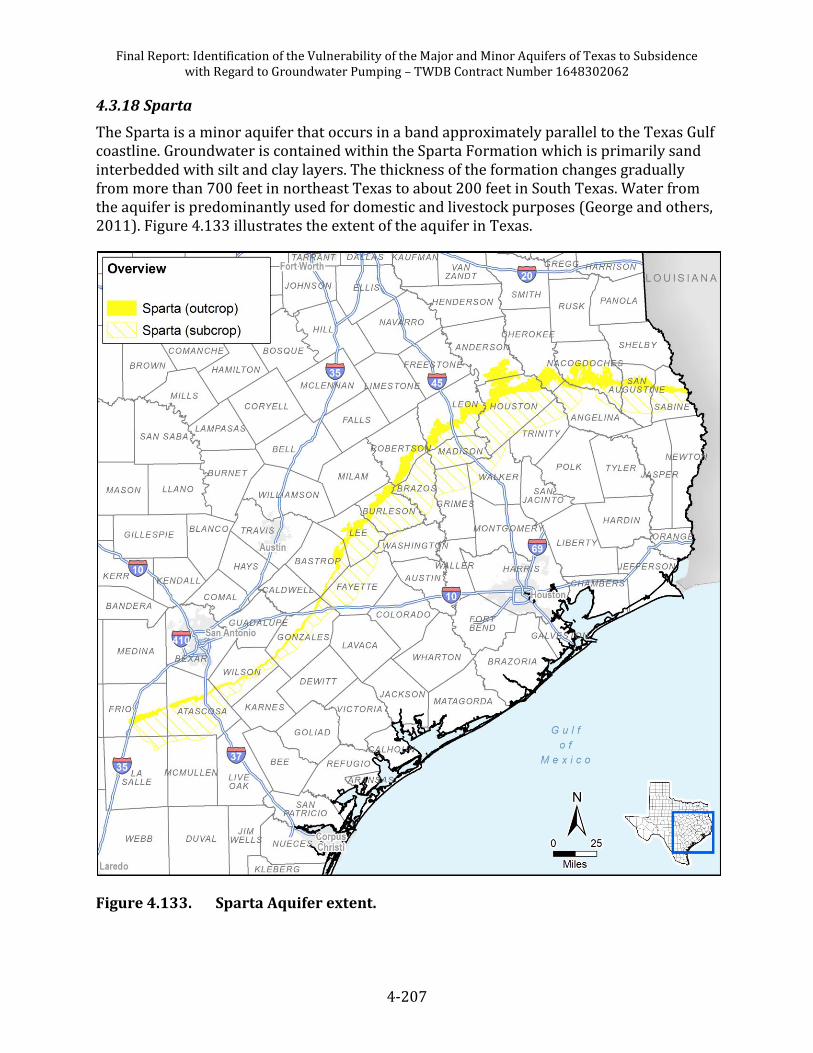
Figure 4.134. Historic pumping volumes from the Sparta Aquifer in the municipal, manufacturing, mining, and steam/electricity production, irrigation, and livestock sectors from 1980 to 2015 (TWDB, 2017b). ...... 4-210
Figure 4.135. Calculated Sparta Aquifer clay thickness at well locations. Results shown beyond aquifer boundary reflect extent of the groundwater availability model. .......................................................................................................... 4-211
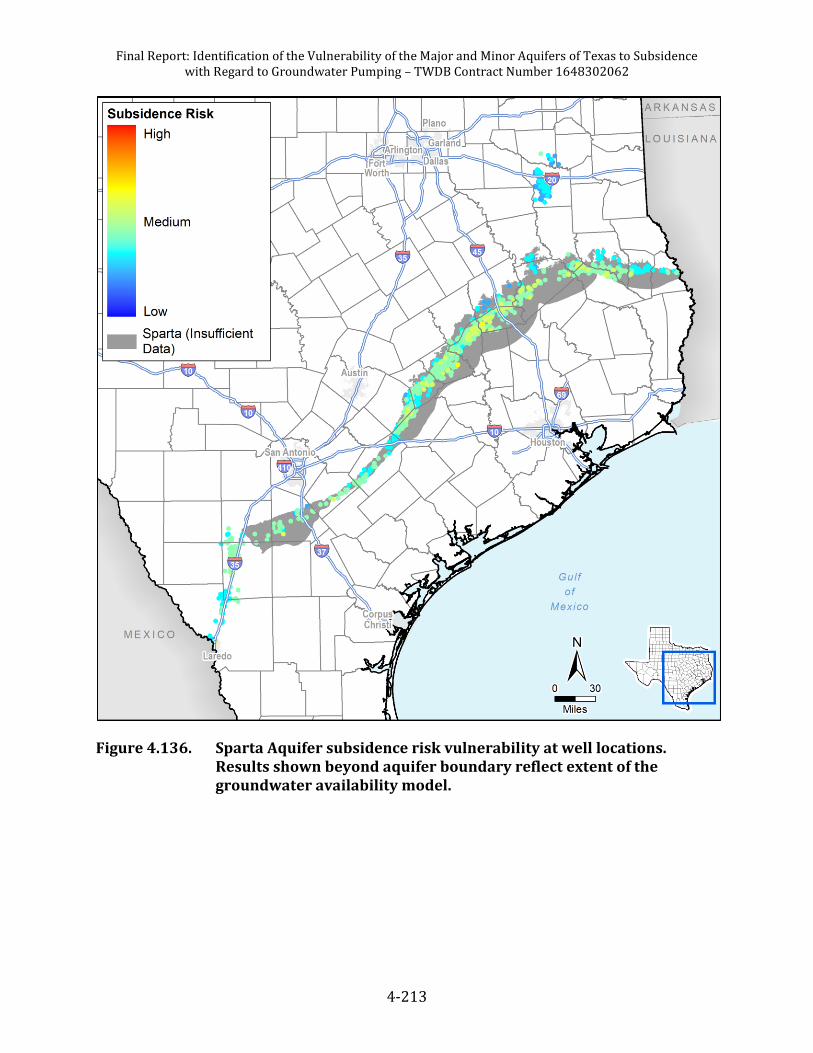
Figure 4.136. Sparta Aquifer subsidence risk vulnerability at well locations. Results shown beyond aquifer boundary reflect extent of the groundwater availability model. .......................................................................................................... 4-213
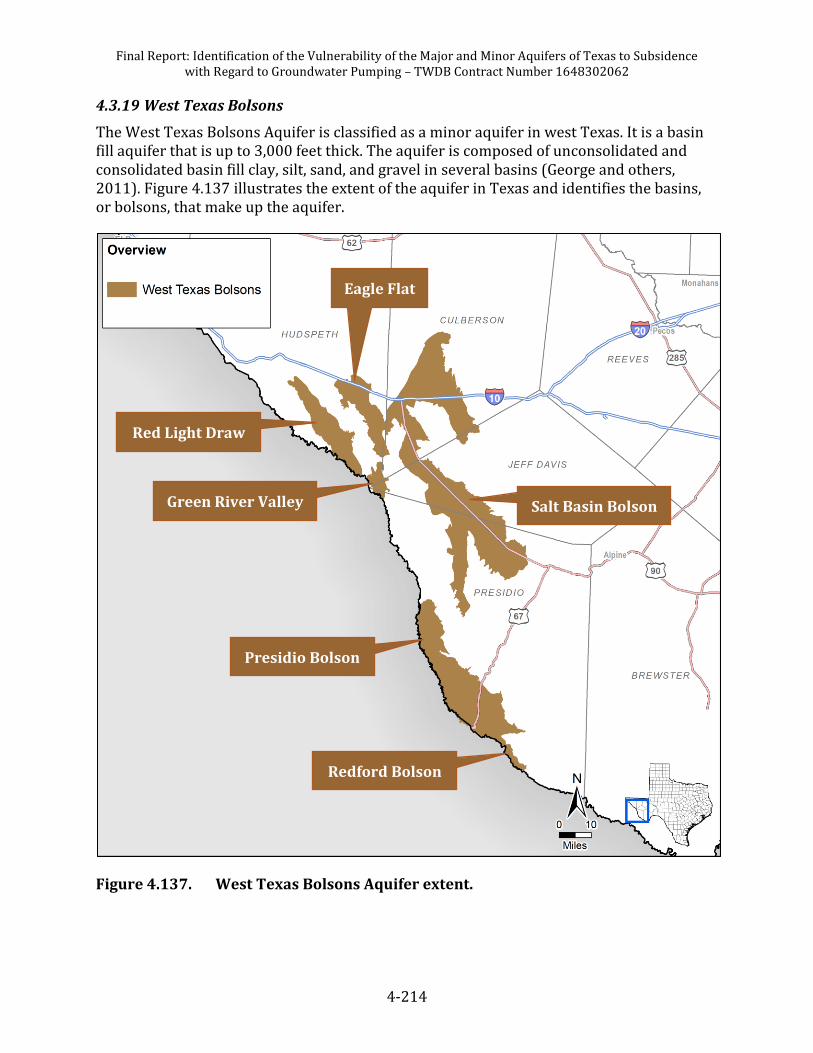
Figure 4.137. West Texas Bolsons Aquifer extent. ........................................................................ 4-214
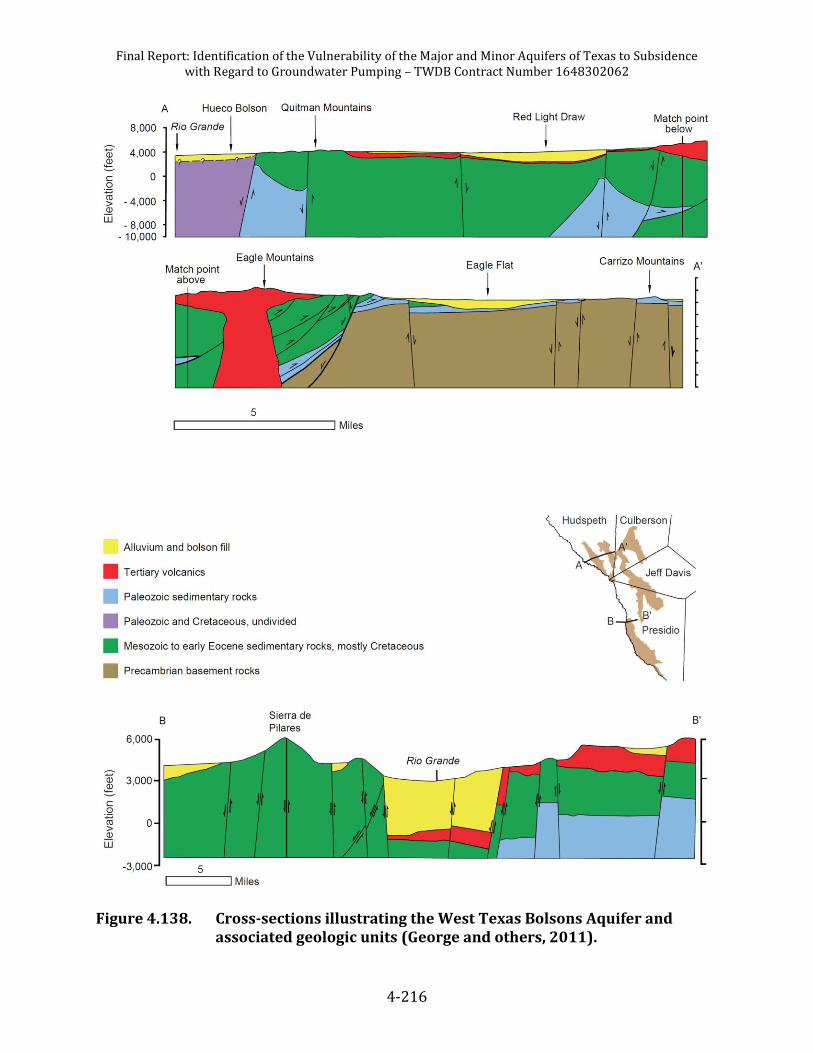
Figure 4.138. Cross-sections illustrating the West Texas Bolsons Aquifer and associated geologic units (George and others, 2011). ..................................... 4-216
Figure 4.139. Historic pumping volumes from the West Texas Bolsons Aquifer in the municipal, manufacturing, mining, and steam/electricity production, irrigation, and livestock sectors from 1980 to 2015 (TWDB, 2017b). Pumping in 1980 is an estimated rather than measured quantity. ............ 4-218
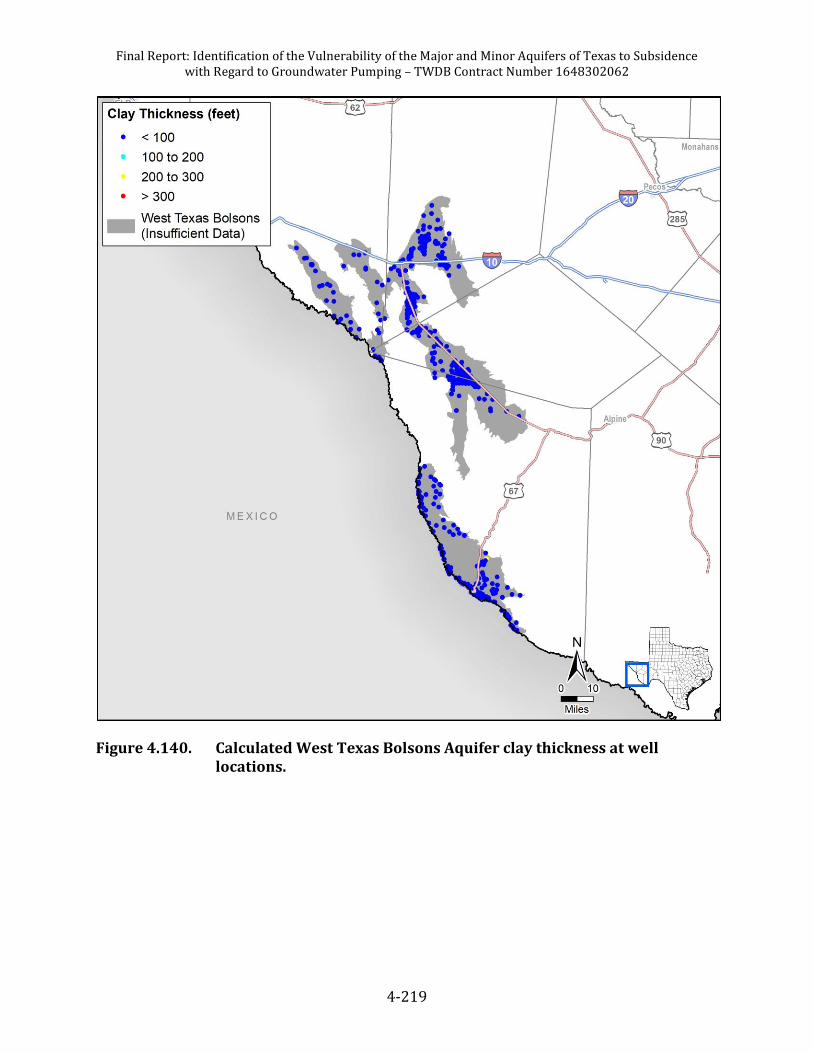
Figure 4.140. Calculated West Texas Bolsons Aquifer clay thickness at well locations. .................................................................................................................. 4-219
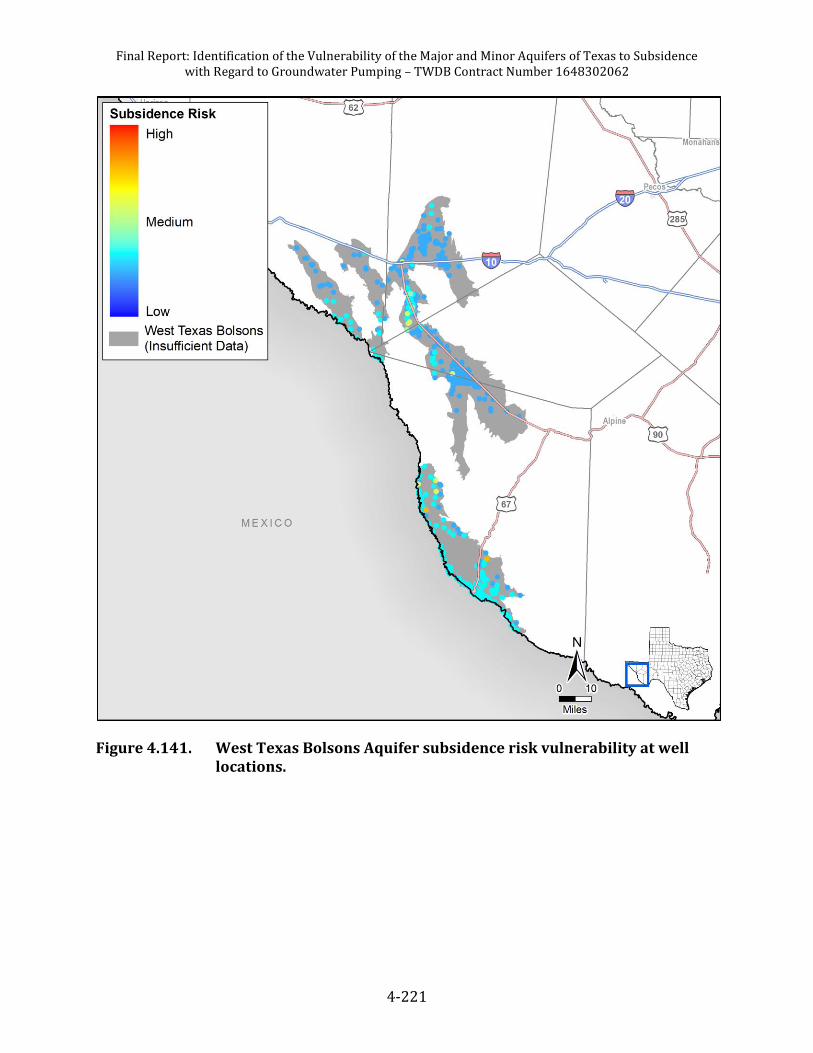
Figure 4.141. West Texas Bolsons Aquifer subsidence risk vulnerability at well locations. ............................................................................................................. 4-221
Figure 4.143. Conceptualized cross-section of the geologic sequence of the northern portion of the Woodbine Aquifer (Kelley and others, 2014). .... 4-224
Figure 4.144. Historic pumping volumes from the Woodbine Aquifer in the municipal, manufacturing, mining, and steam/electricity production, irrigation, and livestock sectors from 1980 to 2015 (TWDB, 2017b). ...... 4-225
Figure 4.145. Calculated Woodbine Aquifer clay thickness at well locations. ................... 4-226
Final Report: Identification of the Vulnerability of the Major and Minor Aquifers of Texas to Subsidence with Regard to Groundwater Pumping – TWDB Contract Number 1648302062
xvi
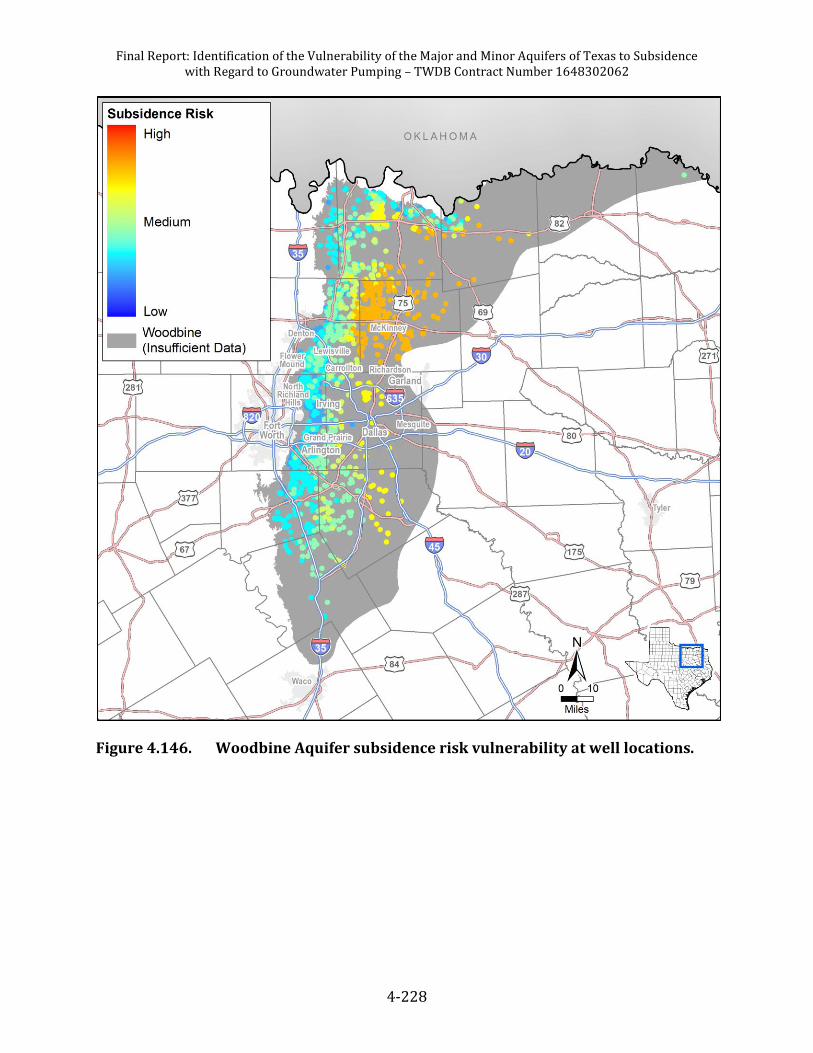
Figure 4.146. Woodbine Aquifer subsidence risk vulnerability at well locations. ........... 4-228
Figure 4.148. Cross-sections of the Yegua-Jackson Aquifer (Knox and others, 2007). ... 4-231
Figure 4.149. Historic pumping volumes from the Yegua-Jackson Aquifer in the municipal, manufacturing, mining, and steam/electricity production, irrigation, and livestock sectors from 2000 to 2015 (TWDB, 2017b). ...... 4-233
Figure 4.150. Calculated Yegua-Jackson Aquifer clay thickness at well locations. ........... 4-234
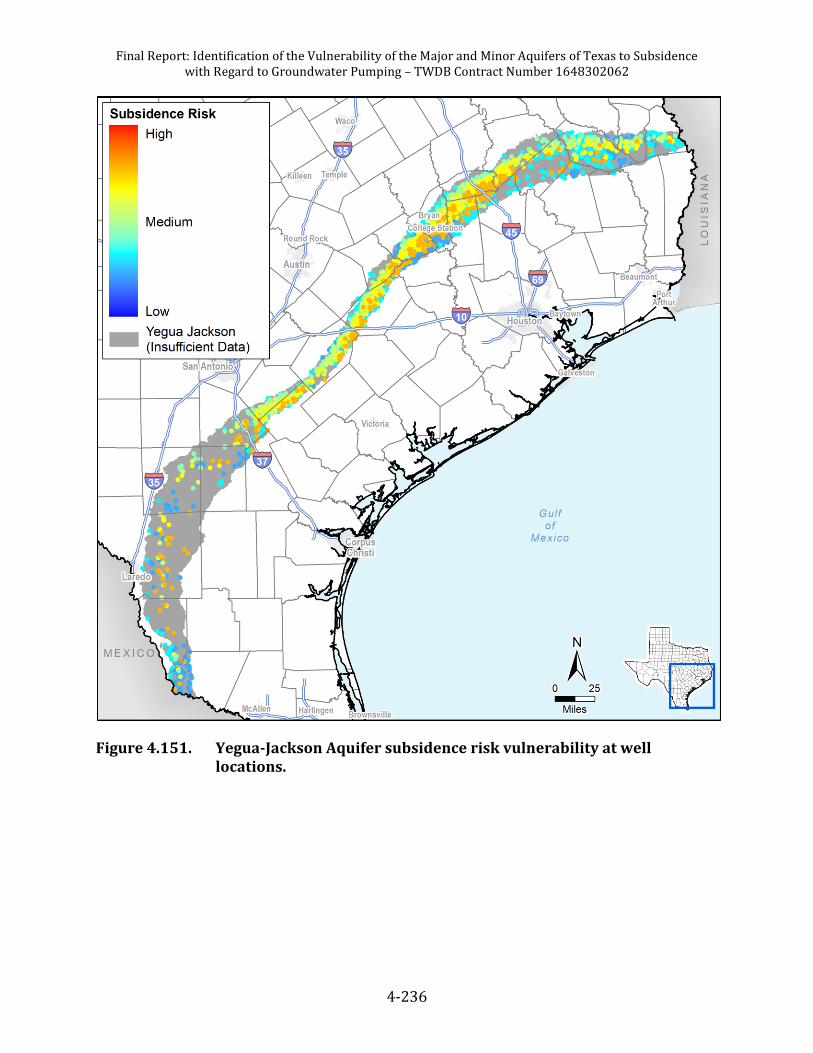
Figure 4.151. Yegua-Jackson Aquifer subsidence risk vulnerability at well locations. ... 4-236
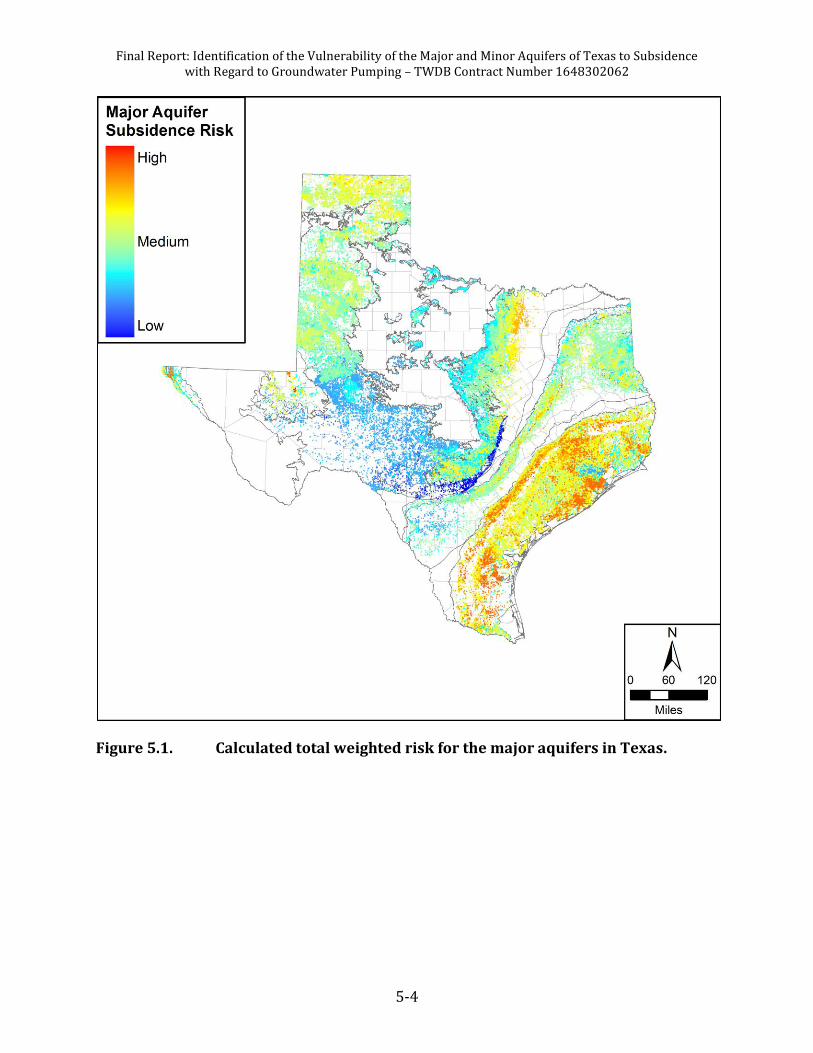
Figure 5.1. Calculated total weighted risk for the major aquifers in Texas. ......................... 5-4
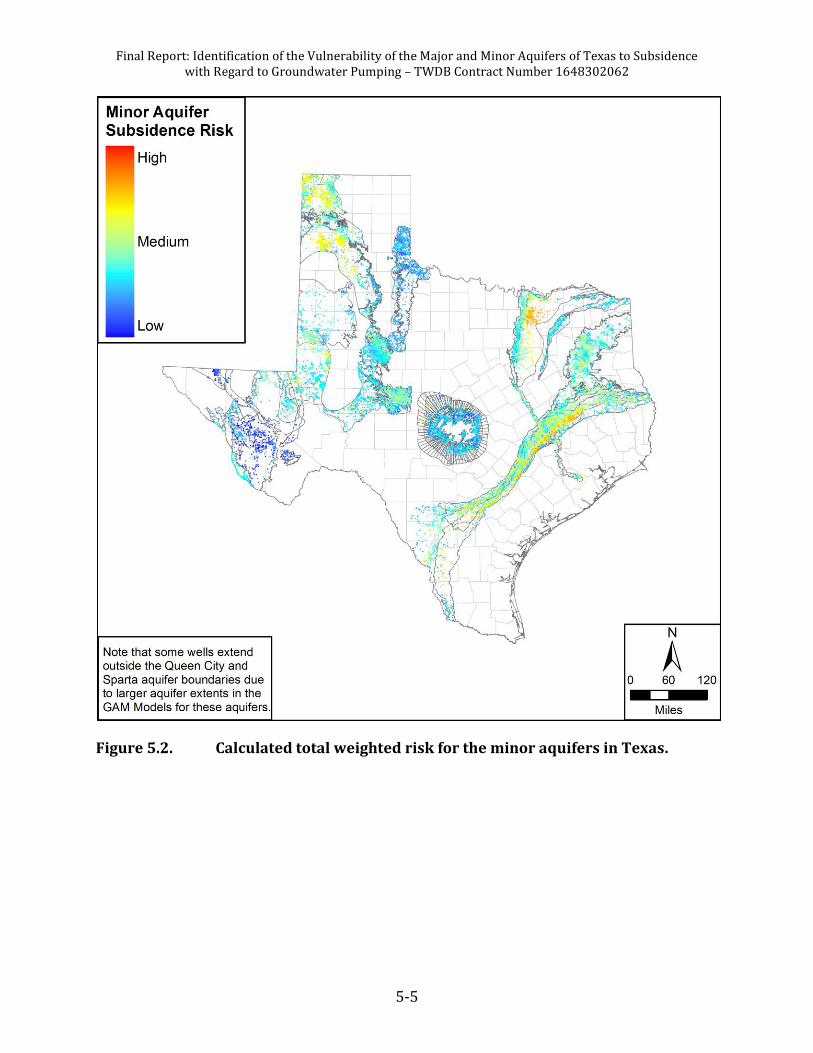
Figure 5.2. Calculated total weighted risk for the minor aquifers in Texas. ........................ 5-5
Figure 5.3. Histograms of total weighted risk for each major aquifer.................................... 5-7
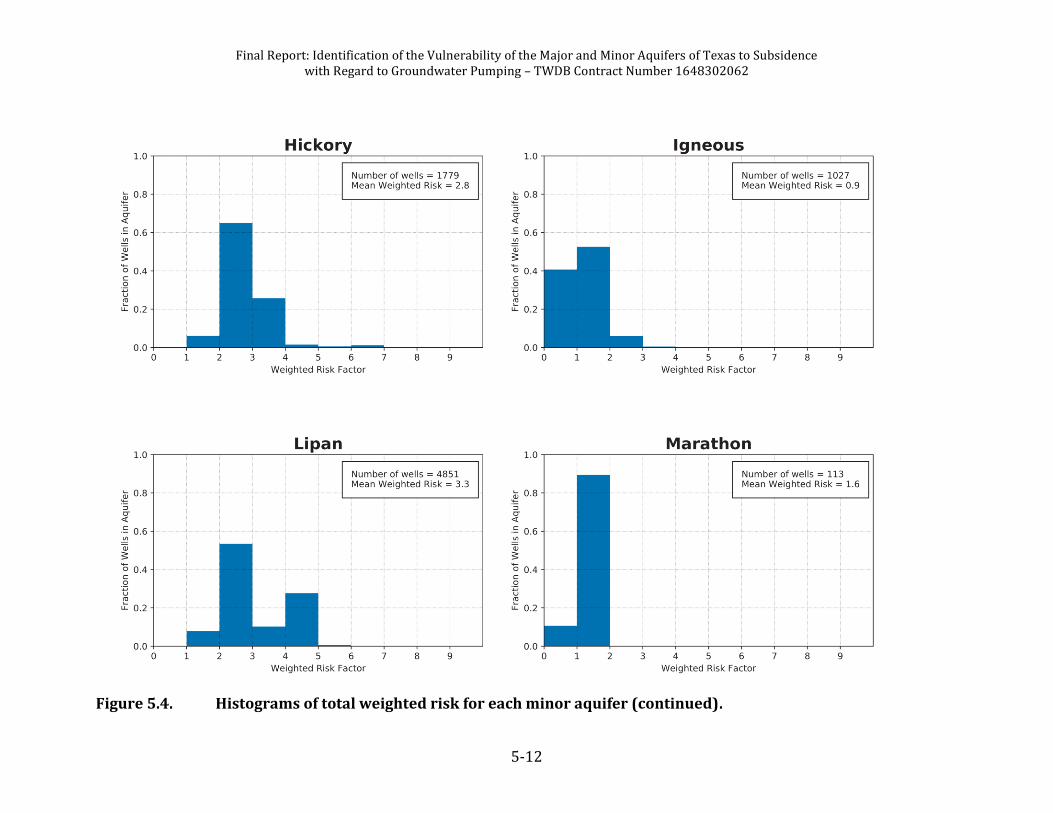
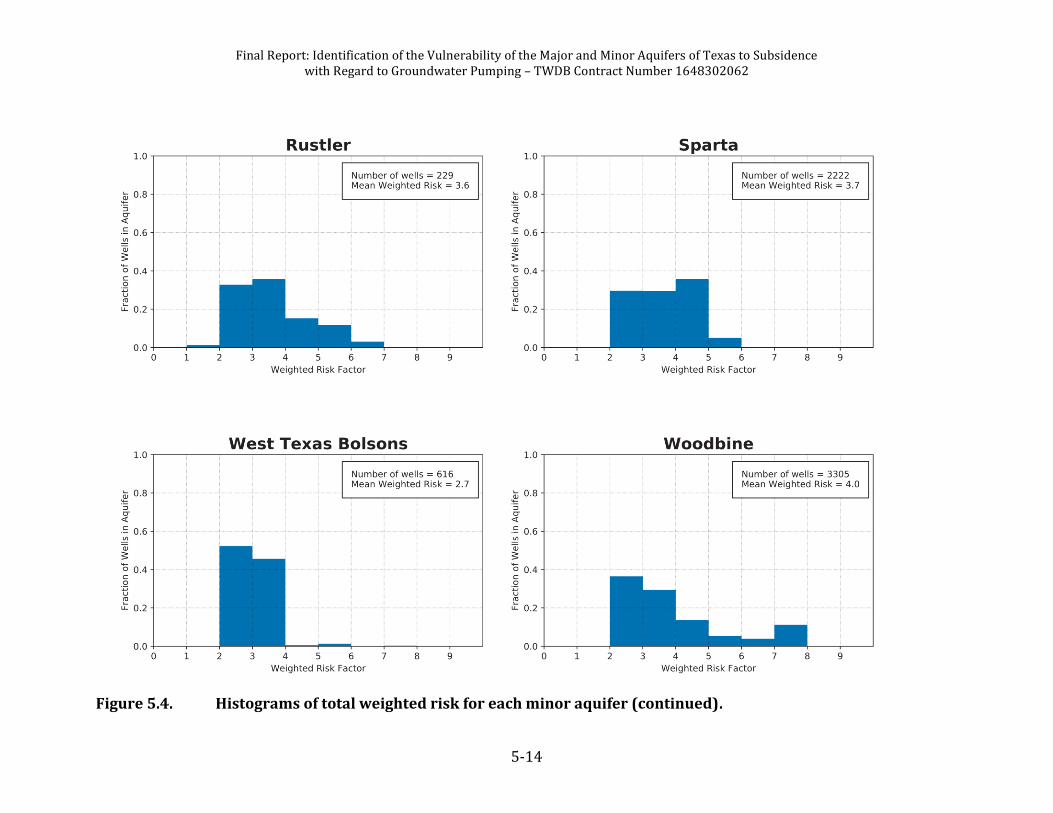
Figure 5.4. Histograms of total weighted risk for each minor aquifer. ............................... 5-10
Figure 5.5. Box Plot and Violin Plot legend. ................................................................................... 5-17
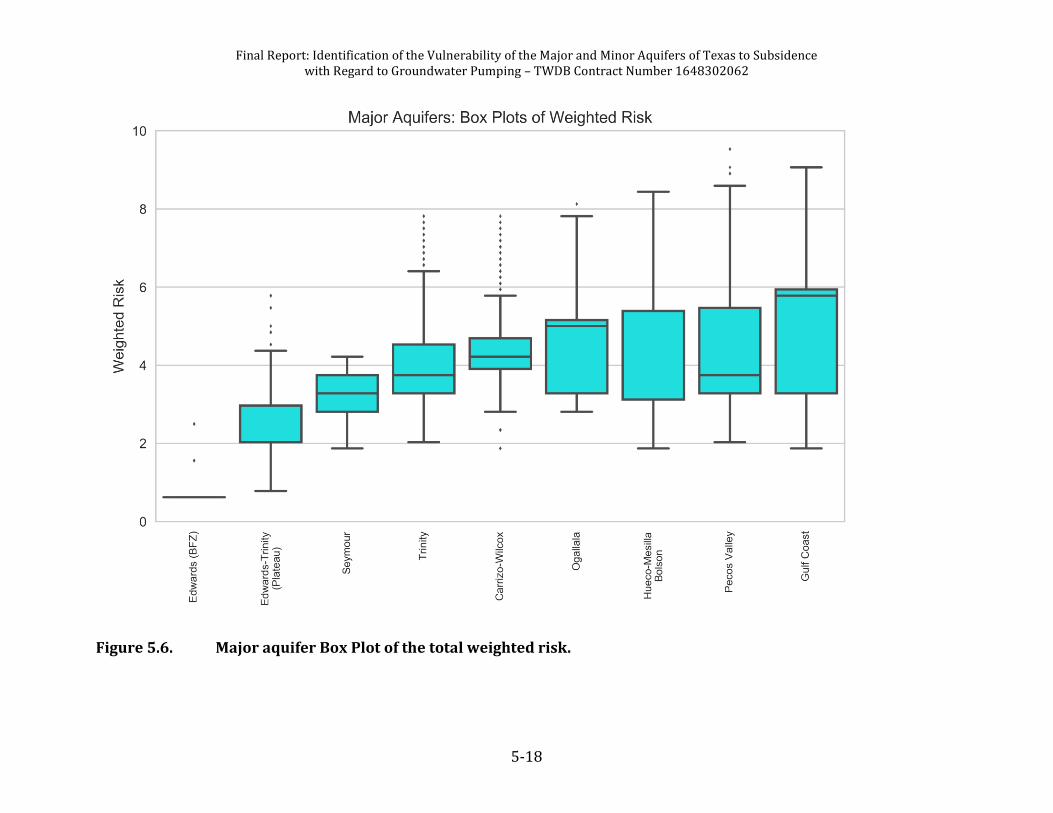
Figure 5.6. Major aquifer Box Plot of the total weighted risk. ................................................ 5-18
Figure 5.7. Minor aquifer Box Plot of the total weighted risk................................................. 5-19
Figure 5.8. Major aquifer Violin Plot of the total weighted risk. ............................................ 5-20
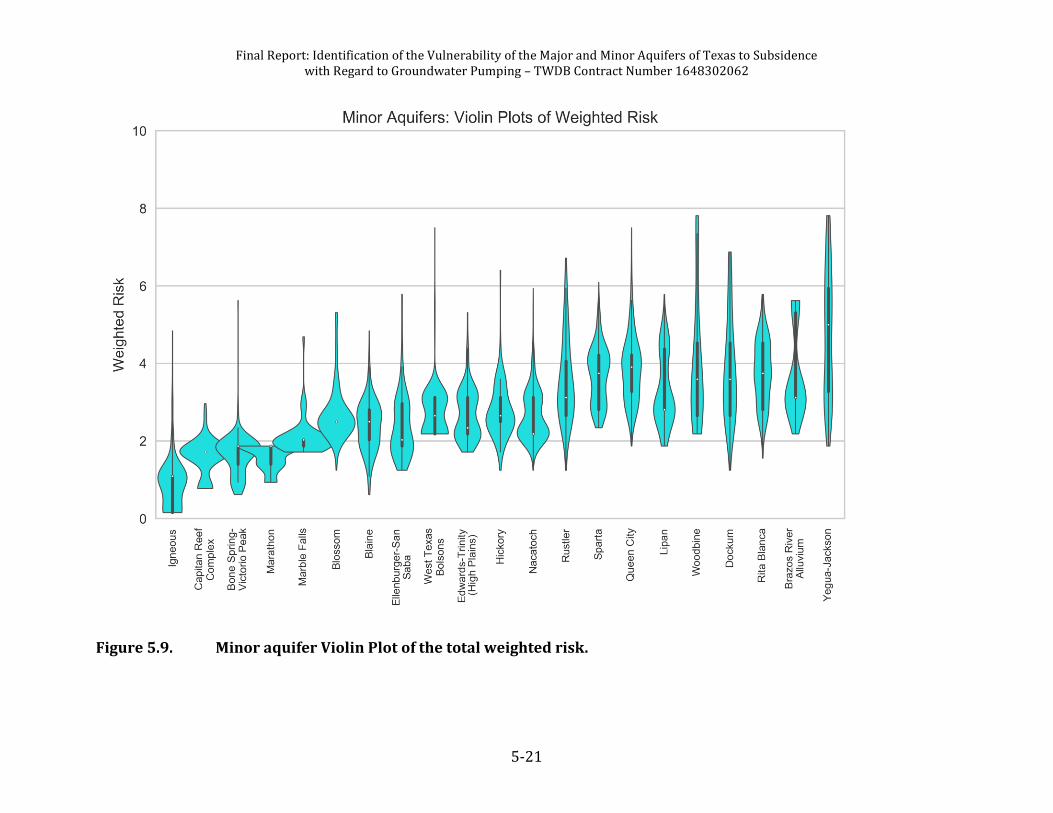
Figure 5.9. Minor aquifer Violin Plot of the total weighted risk. ........................................... 5-21
Figure 6.1. Microsoft Excel macro dialog box. ................................................................................. 6-7
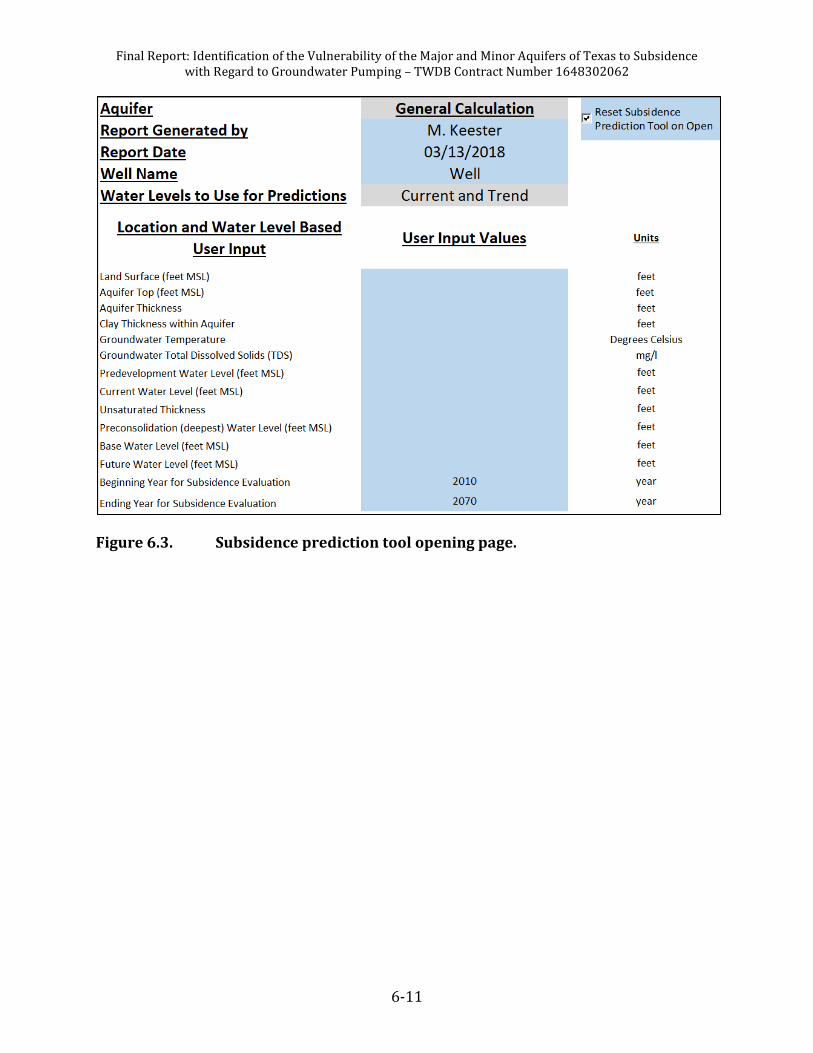
Figure 6.2. General information input section from the subsidence prediction tool. ...... 6-7
Figure 6.6. Subsidence prediction tool Pecos Valley Aquifer average values. ................. 6-13
Figure 6.7. Subsidence prediction tool Pecos Valley Aquifer input values for Tracking Number 417430 in the Submitted Drillers Report database. ....... 6-15
Figure 6.8. Subsidence prediction tool Pecos Valley Aquifer input and calculated values for Tracking Number 417430 in the Submitted Drillers Report database. ................................................................................................ 6-16
Figure 6.9. Subsidence prediction tool predicted water level chart based on the Current and Trend Water Levels to Use for Predictions for Tracking Number 417430 in the Submitted Drillers Report database. .......................... 6-17
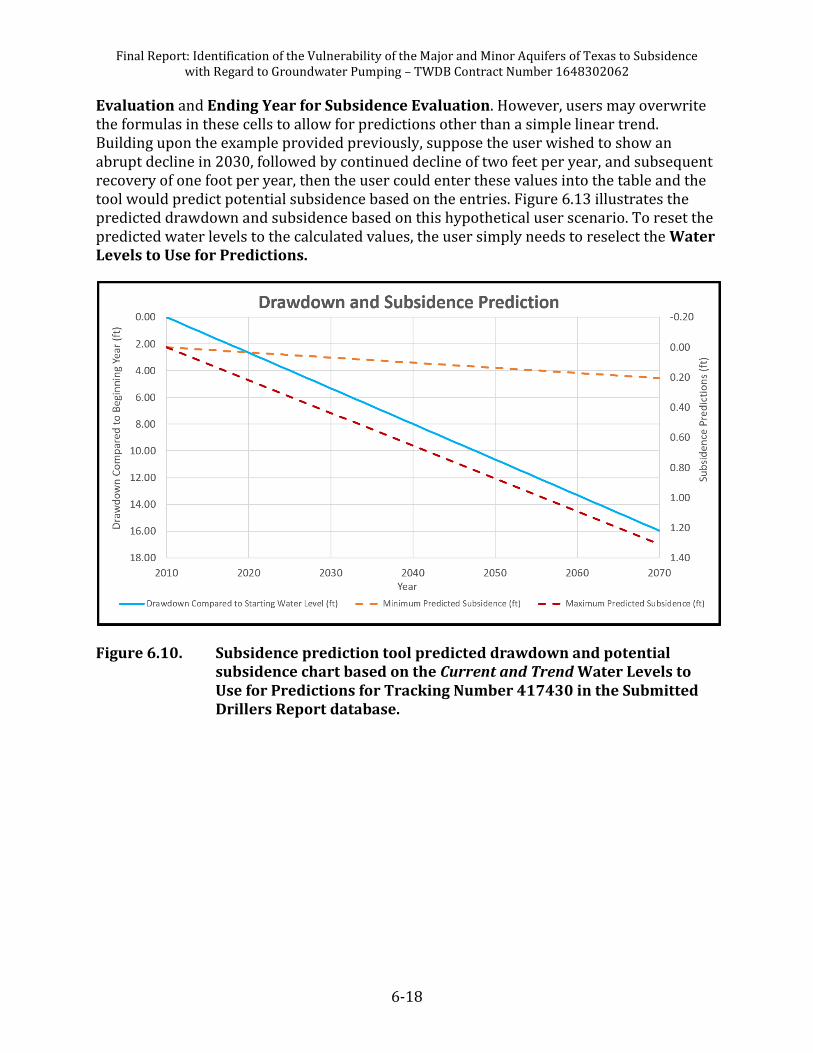
Figure 6.10. Subsidence prediction tool predicted drawdown and potential subsidence chart based on the Current and Trend Water Levels to Use for Predictions for Tracking Number 417430 in the Submitted Drillers Report database. ................................................................................................ 6-18
Figure 6.11. Subsidence prediction tool predicted water level chart based on the Base and Future Water Levels to Use for Predictions for Tracking Number 417430 in the Submitted Drillers Report database. .......................... 6-19
Final Report: Identification of the Vulnerability of the Major and Minor Aquifers of Texas to Subsidence with Regard to Groundwater Pumping – TWDB Contract Number 1648302062
xvii
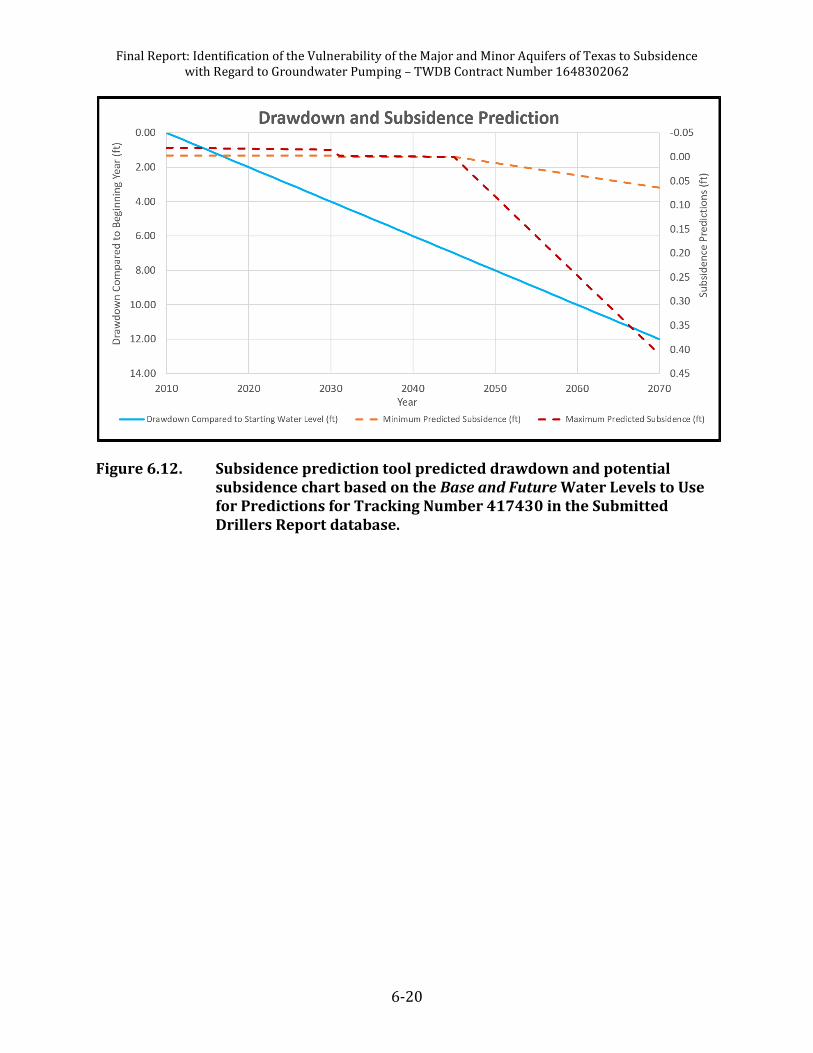
Figure 6.12. Subsidence prediction tool predicted drawdown and potential subsidence chart based on the Base and Future Water Levels to Use for Predictions for Tracking Number 417430 in the Submitted Drillers Report database. ................................................................................................ 6-20
Figure 6.13. Subsidence prediction tool predicted drawdown and potential subsidence chart based on the Base and Future Water Levels to Use for Predictions for Tracking Number 417430 in the Submitted Drillers Report database with manual modifications to the predicted water levels. .................................................................................................... 6-22
Final Report: Identification of the Vulnerability of the Major and Minor Aquifers of Texas to Subsidence with Regard to Groundwater Pumping – TWDB Contract Number 1648302062
xviii
List of Tables
Table 1.1. Aquifer subsidence risk matrix factors, weights, classes, and class values. .. 1-3
Table 1.2. High total weighted risk by aquifer (ranked by third quartile cutoff)............. 1-4
Table 1.3. Medium total weighted risk by aquifer (ranked by third quartile cutoff). .... 1-5
Table 1.4. Low Total weighted risk by aquifer (ranked by third quartile cutoff). ........... 1-6
Table 3.1. Regional Water Planning Group Comment or Question and LRE Water Team Response. ....................................................................................................... 3-8
Table 3.2. Keywords and scale factors for adjusting clay thickness. .................................. 3-13
Table 3.3. Estimates of compressibility for various lithologies. Modified from Domenico and Mifflin (1965). ............................................................................ 3-13
Table 3.4. Aquifer subsidence risk matrix factors, weights, classes, and class values........................................................................................................................... 3-15
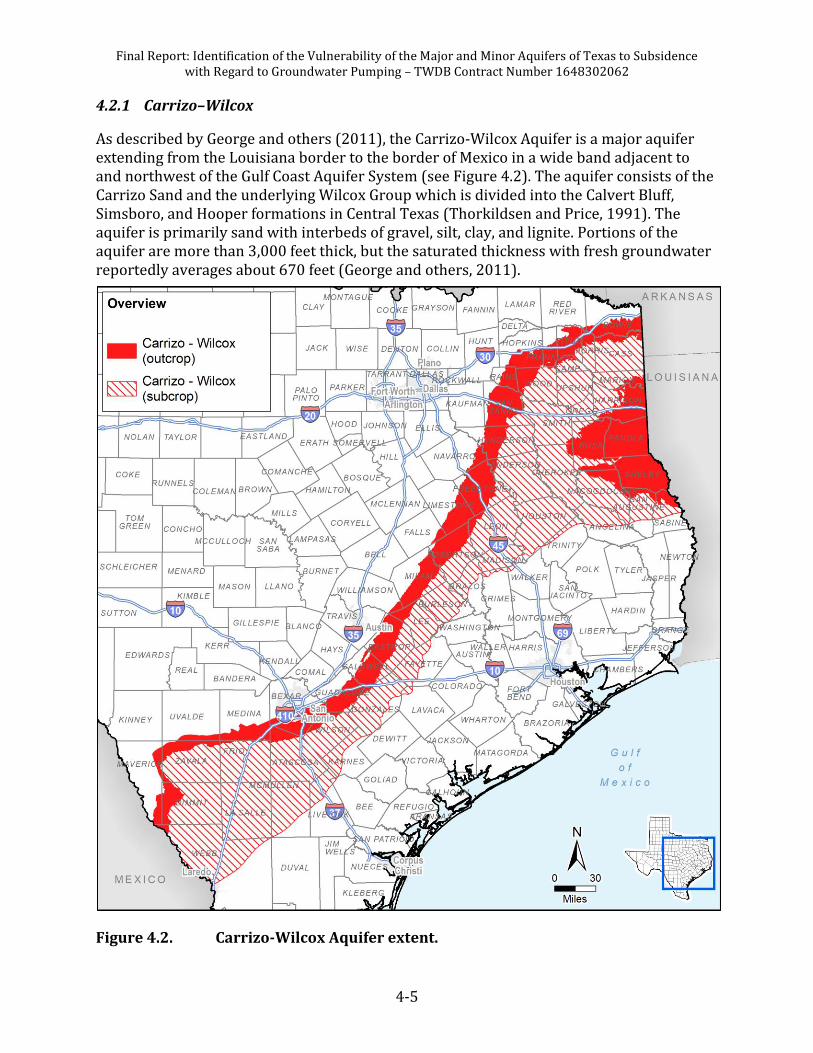
Table 4.1. Geologic units of the Carrizo-Wilcox Aquifer and their water-bearing properties. Modified from Thorkildsen and Price (1991). ................................... 4-8
Table 4.2. Hydraulic properties for the Carrizo-Wilcox Aquifer ............................................. 4-8
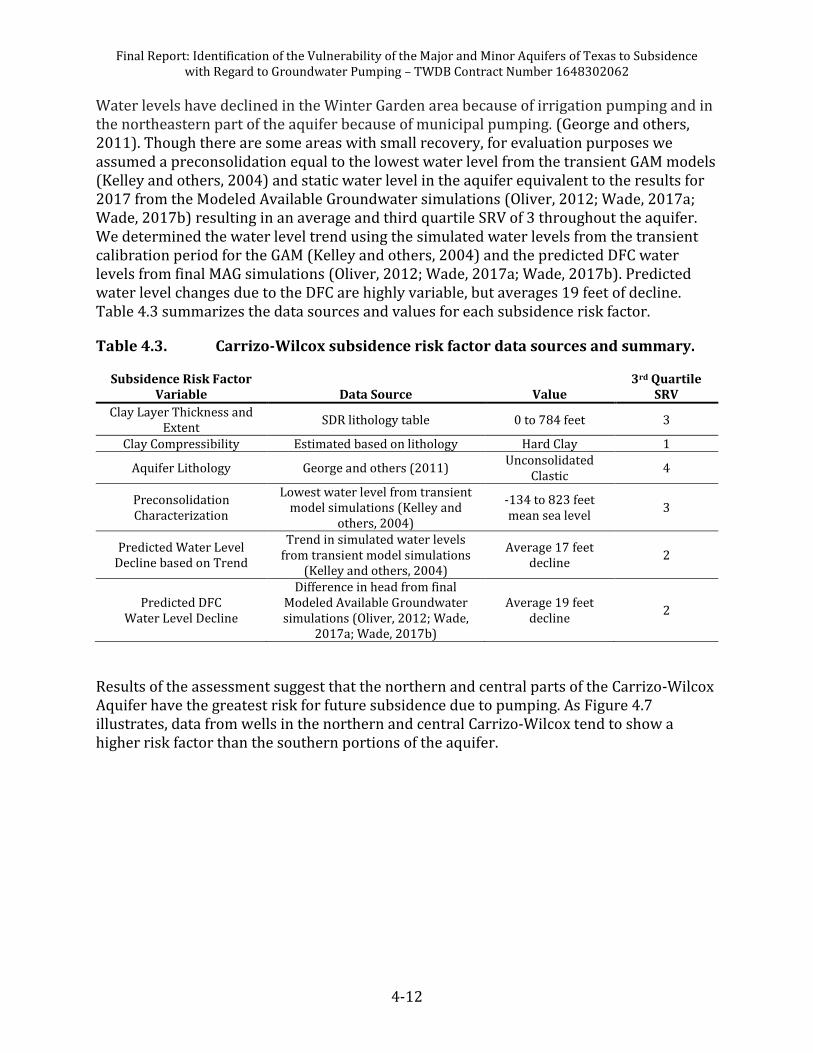
Table 4.3. Carrizo-Wilcox subsidence risk factor data sources and summary. .............. 4-12
Table 4.4. Stratigraphic column of geologic and hydrogeologic units within the Edwards (BFZ) Aquifer. Modified from Maclay (1995), Lindgren and others (2004), and Jones (2003). ....................................................................... 4-15
Table 4.5. Hydraulic properties for the Edwards (BFZ) Aquifer. ........................................ 4-18
Table 4.6. Edwards BFZ subsidence risk factor data sources and summary. ................. 4-22
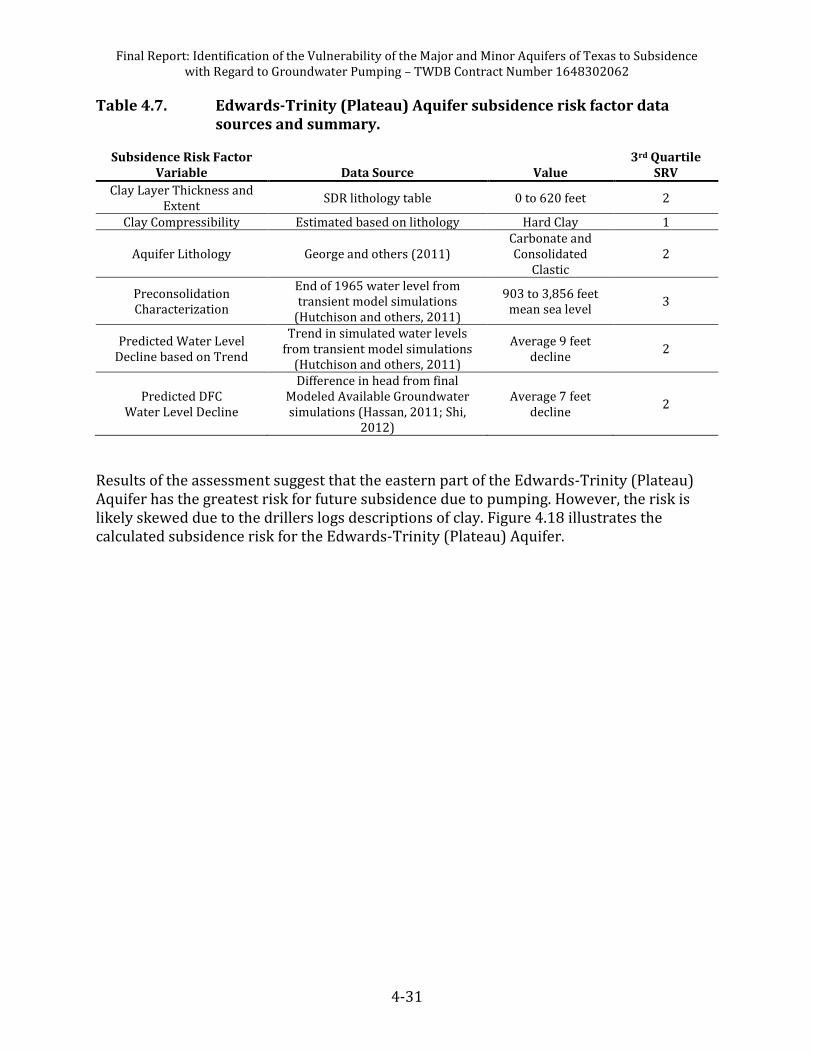
Table 4.7. Edwards-Trinity (Plateau) Aquifer subsidence risk factor data sources and summary. ..................................................................................................... 4-31
Table 4.8. Stratigraphic column of geologic and hydrogeologic units within the Gulf Coast Aquifer System. Modified from Baker, Jr. (1979), Baker, Jr. and others (1986), and Kasmarek and Robinson (2004). ................................. 4-35
Table 4.9. Hydraulic properties for the Gulf Coast Aquifer System. ................................... 4-37
Table 4.10. Gulf Coast subsidence risk factor data sources and summary. ........................ 4-41
Table 4.11. Hueco-Mesilla Bolsons subsidence risk factor data sources and summary. .............................................................................................................................. 4-48
Table 4.12. Ogallala subsidence risk factor data sources and summary. ............................ 4-54
Table 4.13. Pecos Valley Aquifer subsidence risk factor data sources and summary. .. 4-61
Table 4.14. Geologic and hydrostratigraphic column of the sediments in the vicinity of the Seymour Aquifer (Ewing and others, 2004). ............................. 4-64
Table 4.15. Hydraulic properties for the Seymour Aquifer ...................................................... 4-66
Table 4.16. Seymour Aquifer subsidence risk factor data sources and summary. .......... 4-69
Table 4.17. Hydraulic properties for the Trinity Aquifer. ......................................................... 4-75
Table 4.18. Trinity Aquifer subsidence risk factor data sources and summary. .............. 4-78
Final Report: Identification of the Vulnerability of the Major and Minor Aquifers of Texas to Subsidence with Regard to Groundwater Pumping – TWDB Contract Number 1648302062
xix
Table 4.19. Geologic units of the Blaine Aquifer and their water-bearing properties. Modified from Ewing and others (2004) ................................................................. 4-82
Table 4.20. Hydraulic properties for the Blaine Aquifer. .......................................................... 4-83
Table 4.21. Blaine Aquifer subsidence risk factor data sources and summary. ............... 4-86
Table 4.22. Stratigraphic column of geologic and hydrogeologic units within the Blossom Aquifer. Modified from Wood and Guevara (1981) and Nordstrom (1982). ............................................................................................................ 4-90
Table 4.23. Hydraulic properties for the Blossom Aquifer. ...................................................... 4-90
Table 4.24. Blossom Aquifer subsidence risk factor data sources and summary. .......... 4-95
Table 4.25. Hydraulic properties for the Bone Spring–Victorio Peak Aquifer. ................. 4-99
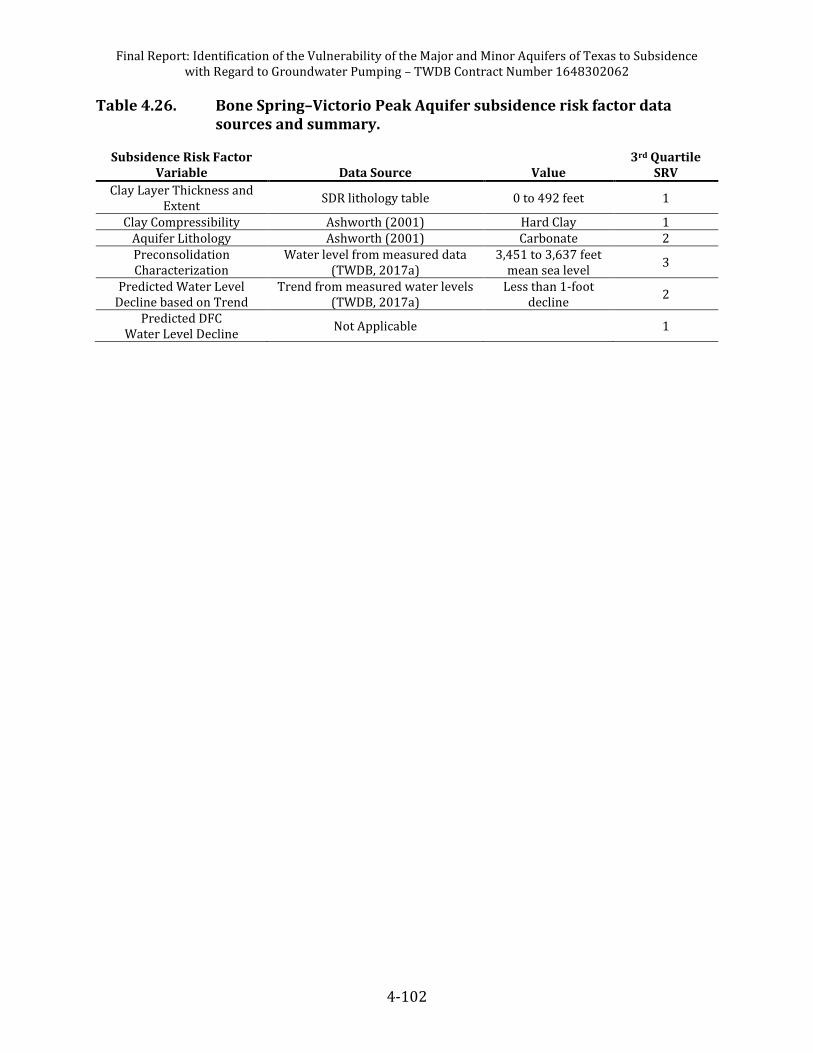
Table 4.26. Bone Spring–Victorio Peak Aquifer subsidence risk factor data sources and summary. .................................................................................................. 4-102
Table 4.27. Hydraulic properties for the Brazos River Alluvium Aquifer........................ 4-106
Table 4.28. Brazos River Alluvium Aquifer subsidence risk factor data sources and summary. .................................................................................................. 4-109
Table 4.29. Capitan Reef Complex subsidence risk factor data sources and summary. ........................................................................................................................... 4-118
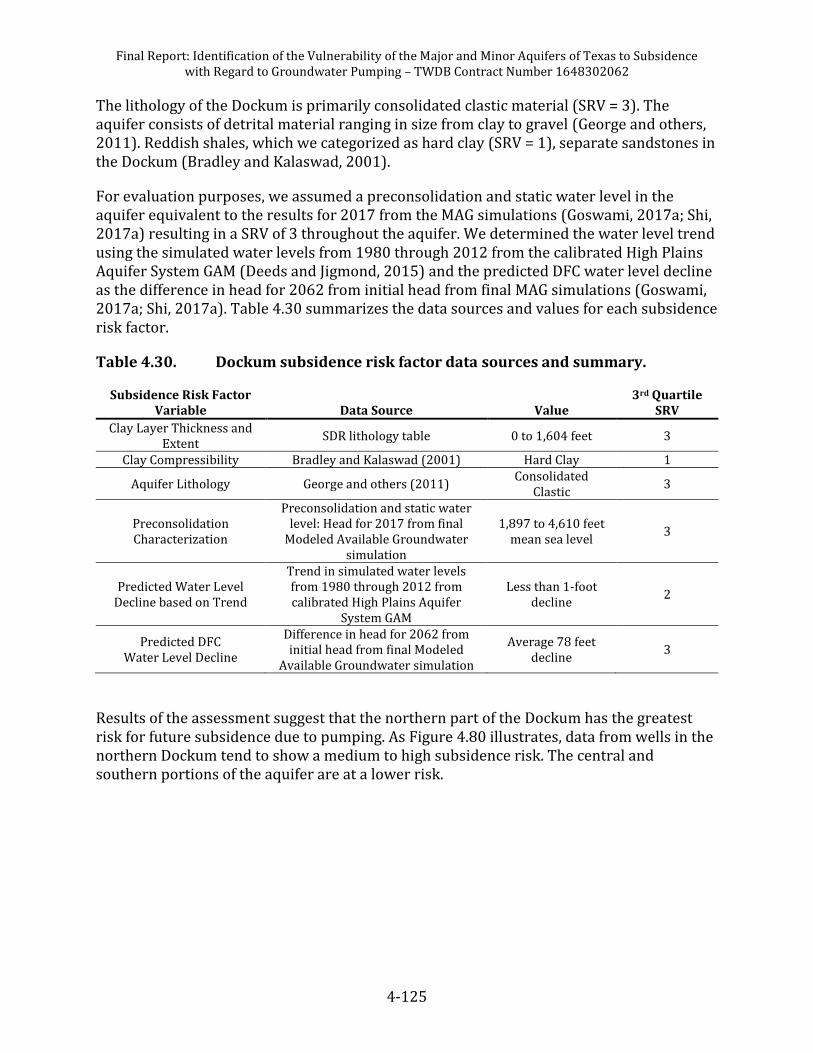
Table 4.30. Dockum subsidence risk factor data sources and summary. ........................ 4-125
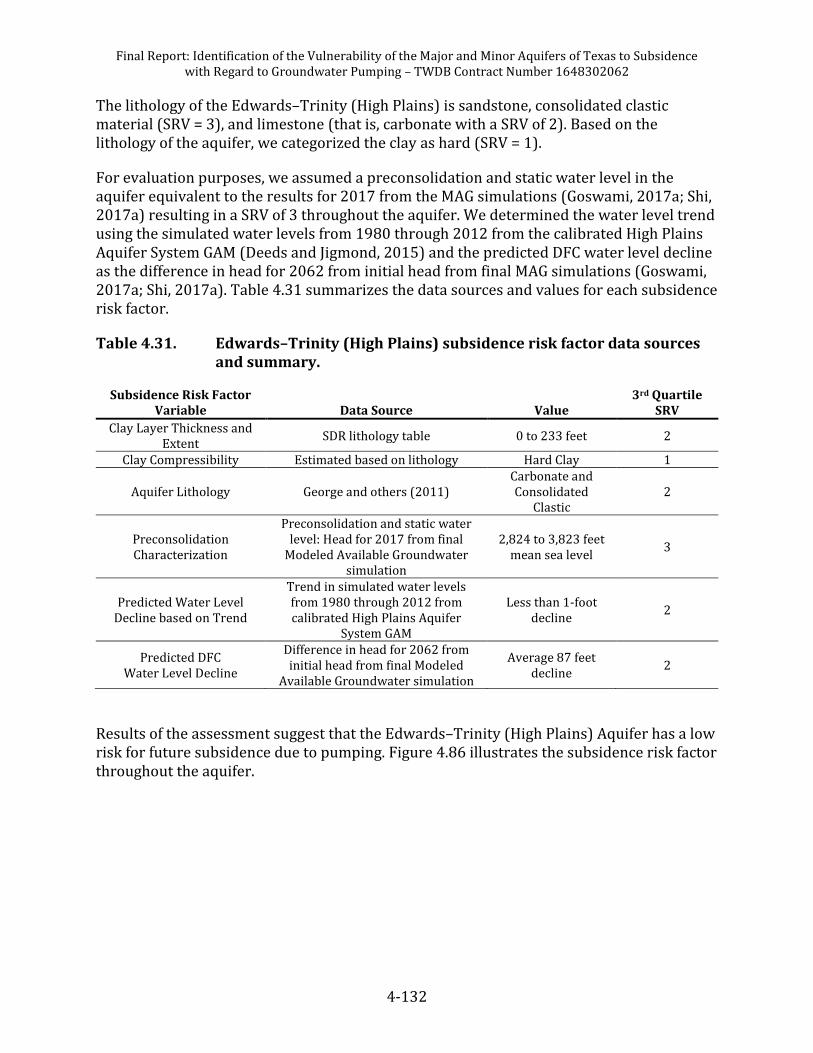
Table 4.31. Edwards–Trinity (High Plains) subsidence risk factor data sources and summary. .................................................................................................................. 4-132
Table 4.32. Stratigraphic column of the Ellenburger-San Saba illustrating the hydrogeologic units (Preston and others, 1996). .............................................. 4-136
Table 4.33. Hydraulic properties for the Ellenburger-San Saba Aquifer. ........................ 4-138
Table 4.34. Ellenburger-San Saba Aquifer subsidence risk factor data sources and summary. .................................................................................................................. 4-141
Table 4.35. Stratigraphic column of the Hickory illustrating the hydrogeologic units (Preston and others, 1996). ............................................................................ 4-145
Table 4.36. Hydraulic properties for the Hickory Aquifer. .................................................... 4-146
Table 4.37. Hickory Aquifer subsidence risk factor data sources and summary. ......... 4-149
Table 4.38. Igneous subsidence risk factor data sources and summary. ......................... 4-156
Table 4.39. Hydrostratigraphic column of the Lipan Aquifer (Lee, 1986; Beach and others, 2004b). ................................................................................................................ 4-159
Table 4.40. Hydraulic properties for the Lipan Aquifer.......................................................... 4-160
Table 4.41. Lipan Aquifer subsidence risk factor data sources and summary. ............. 4-163
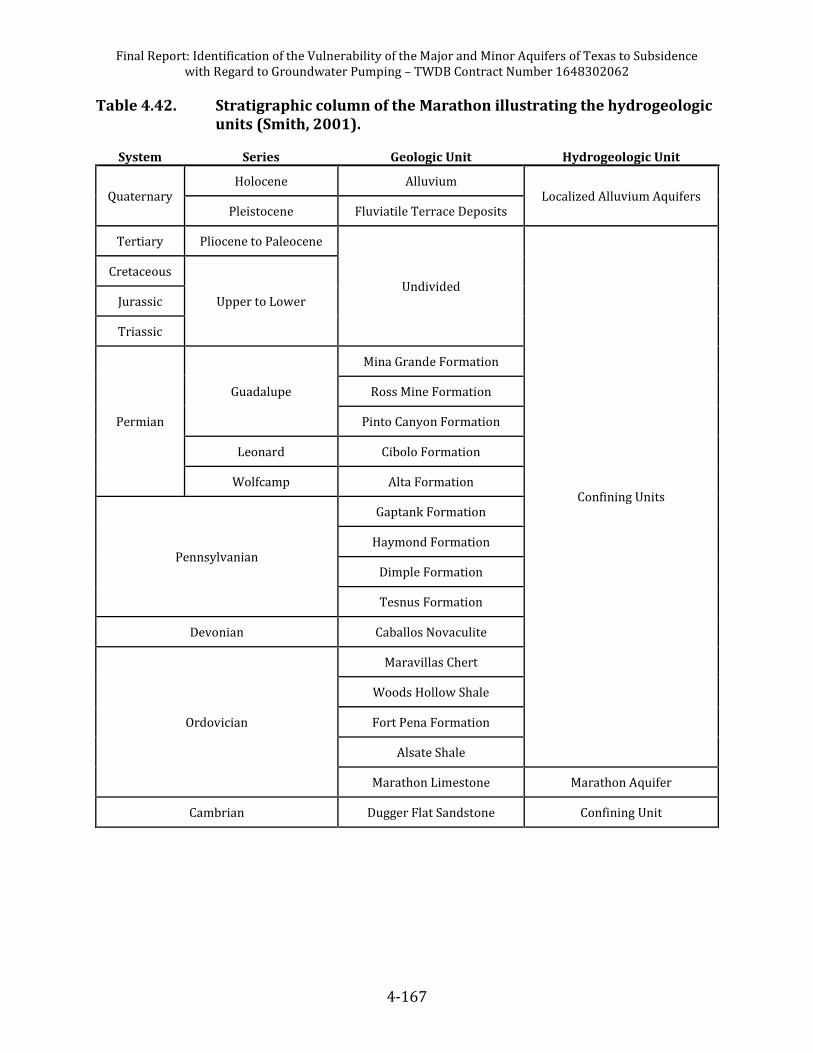
Table 4.42. Stratigraphic column of the Marathon illustrating the hydrogeologic units (Smith, 2001). ....................................................................................................... 4-167
Table 4.43. Hydraulic properties for the Marathon Aquifer. ................................................ 4-168
Table 4.44. Marathon Aquifer subsidence risk factor data sources and summary. ..... 4-170
Table 4.45. Stratigraphic column of the Marble Falls illustrating the hydrogeologic units (Preston and others, 1996). .............................................. 4-174
Final Report: Identification of the Vulnerability of the Major and Minor Aquifers of Texas to Subsidence with Regard to Groundwater Pumping – TWDB Contract Number 1648302062
xx
Table 4.46. Marble Falls Aquifer subsidence risk factor data sources and summary. ........................................................................................................................... 4-178
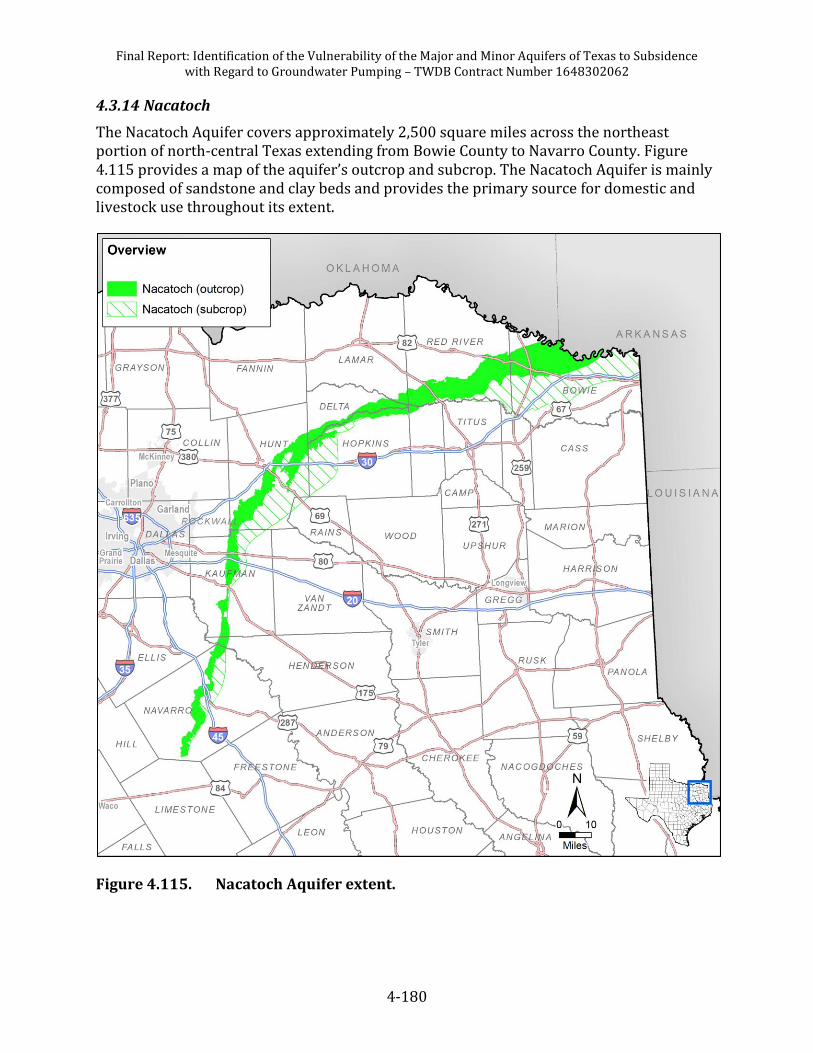
Table 4.47. Stratigraphic column of the Nacatoch illustrating the hydrogeologic units (Wood and Guevara, 1981). ............................................................................ 4-181
Table 4.48. Hydraulic properties for the Nacatoch Aquifer. ................................................. 4-182
Table 4.49. Nacatoch subsidence risk factor data sources and summary. ...................... 4-185
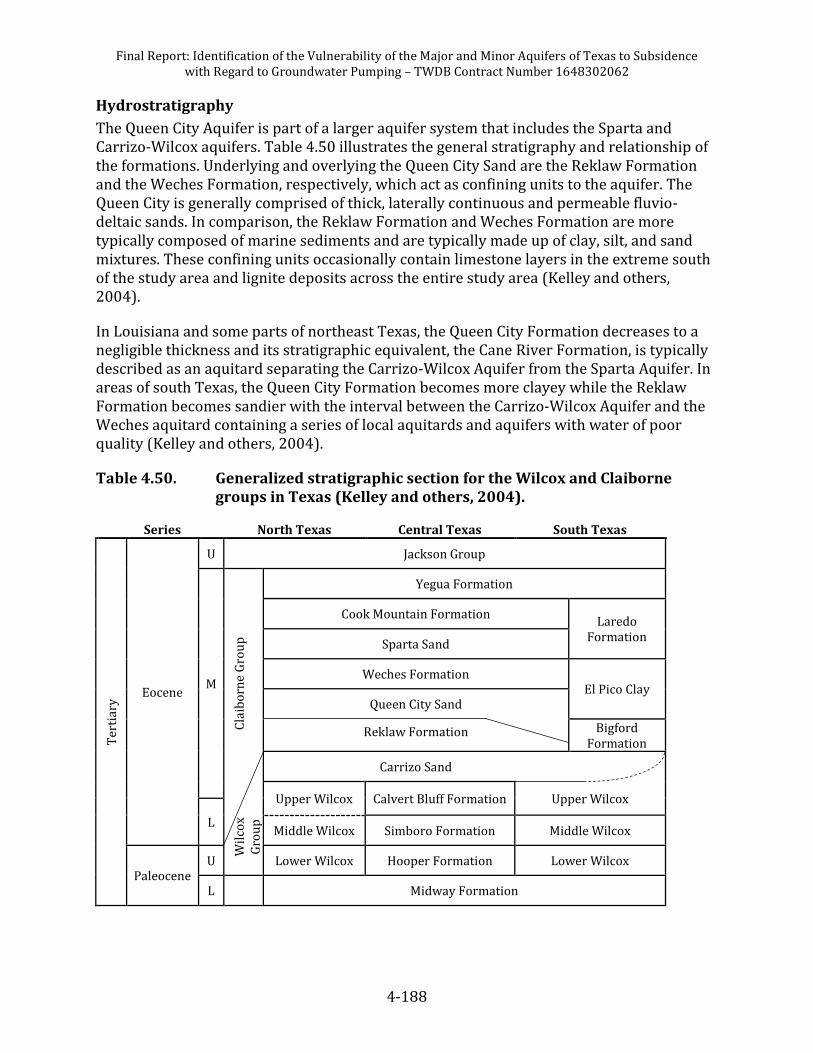
Table 4.50. Generalized stratigraphic section for the Wilcox and Claiborne groups in Texas (Kelley and others, 2004). .......................................................... 4-188
Table 4.51. Hydraulic properties for the Queen City Aquifer. .............................................. 4-189
Table 4.52. Queen City Aquifer subsidence risk factor data sources and summary. ... 4-192
Table 4.53. Rita Blanca subsidence risk factor data sources and summary. .................. 4-198
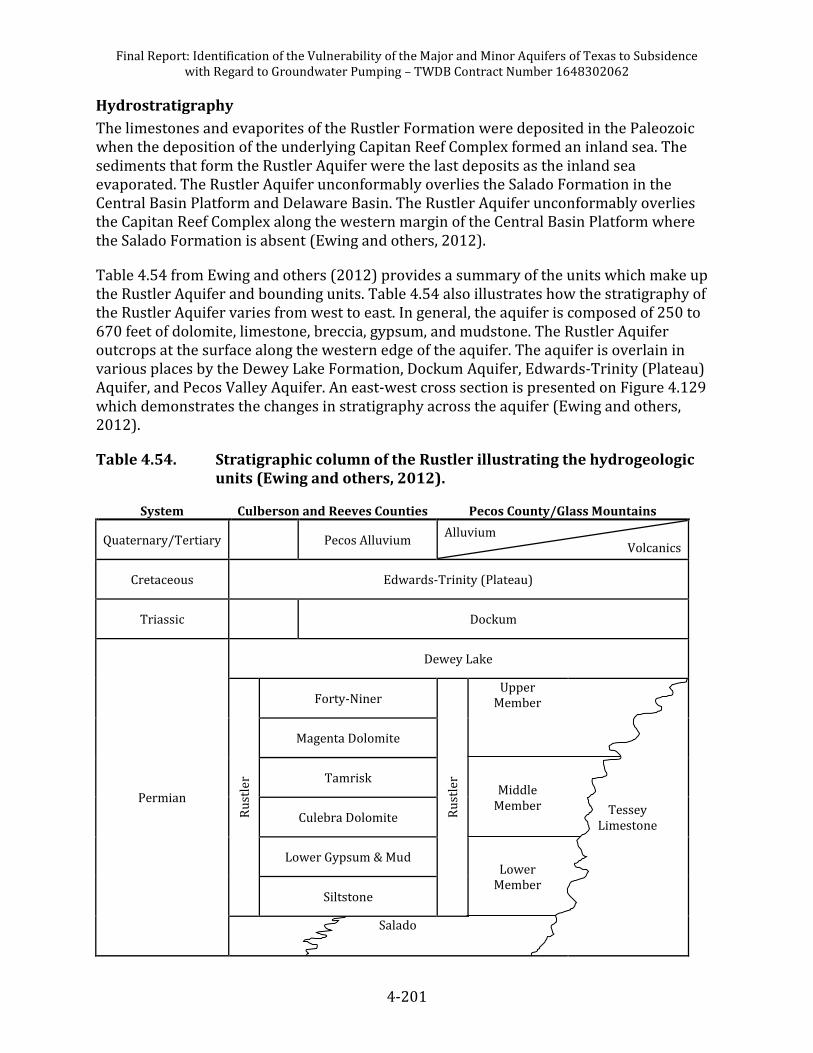
Table 4.54. Stratigraphic column of the Rustler illustrating the hydrogeologic units (Ewing and others, 2012). ............................................................................... 4-201
Table 4.55. Rustler subsidence risk factor data sources and summary. .......................... 4-205
Table 4.56. Stratigraphic column of the Sparta illustrating the hydrogeologic units (Kelley and others, 2004). ........................................................................................... 4-208
Table 4.57. Hydraulic properties for the Sparta Aquifer. ....................................................... 4-209
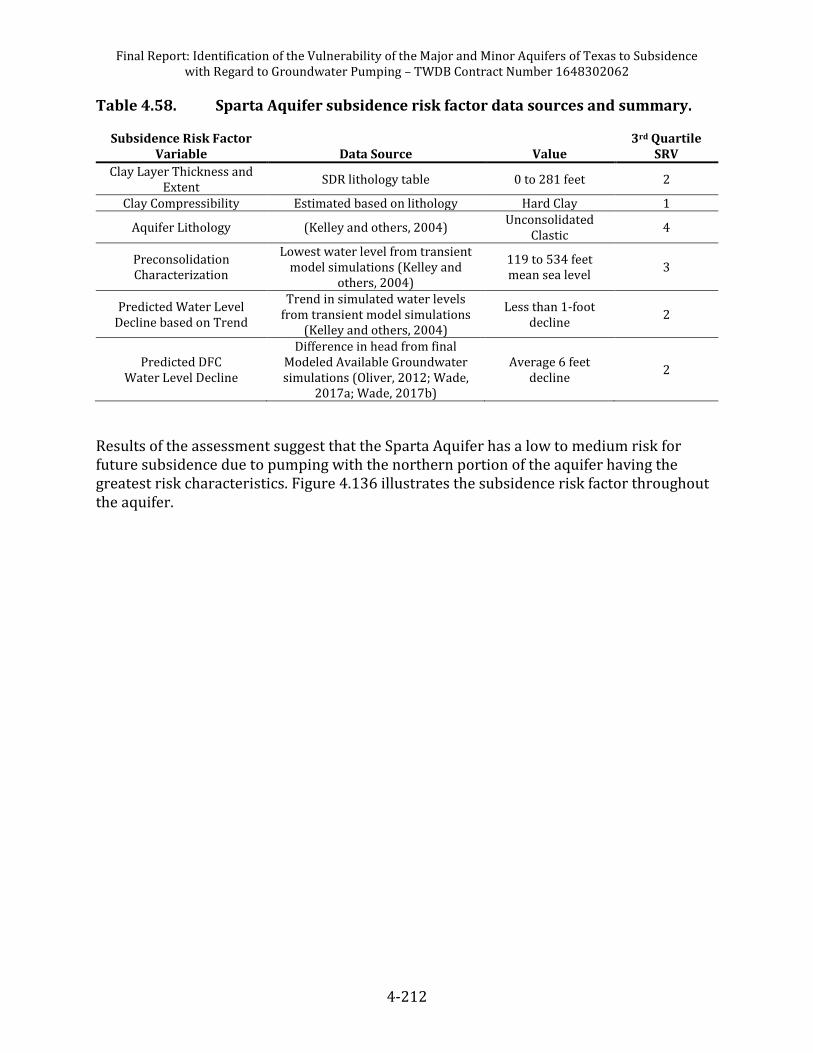
Table 4.58. Sparta Aquifer subsidence risk factor data sources and summary............. 4-212
Table 4.59. Generalized stratigraphic column of the West Texas Bolsons illustrating the hydrogeologic units (Wade and others, 2011). ................... 4-215
Table 4.60. West Texas Bolsons subsidence risk factor data sources and summary. . 4-220
Table 4.61. Hydraulic properties for the Woodbine Aquifer. ............................................... 4-225
Table 4.62. Woodbine Aquifer subsidence risk factor data sources and summary. .... 4-227
Table 4.63. Stratigraphic column of the Yegua-Jackson illustrating the hydrogeologic units (Rogers, 1967; Preston, 2006; Deeds and others, 2010). .................... 4-230
Table 4.64. Hydraulic properties for the Yegua-Jackson Aquifer. ...................................... 4-232
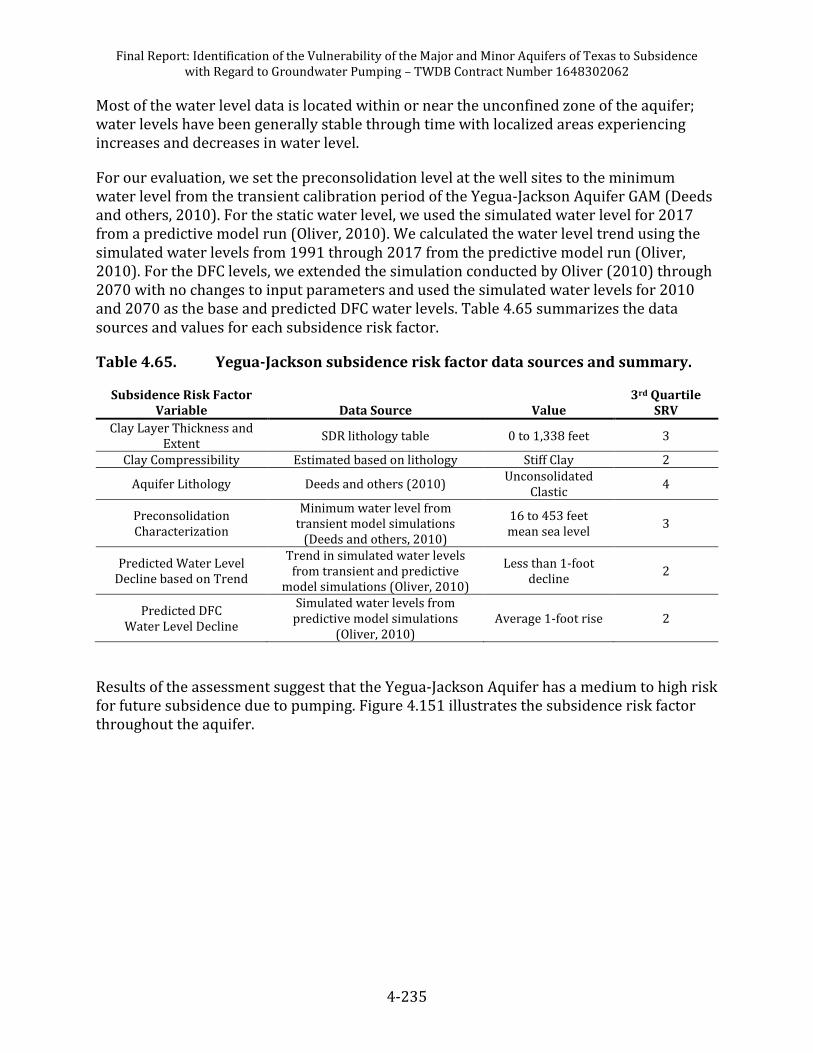
Table 4.65. Yegua-Jackson subsidence risk factor data sources and summary. ............ 4-235
Table 5.1. Average subsidence related properties for the major aquifers of Texas. ....... 5-2
Table 5.2. Average subsidence related properties for the minor aquifers of Texas. ...... 5-3
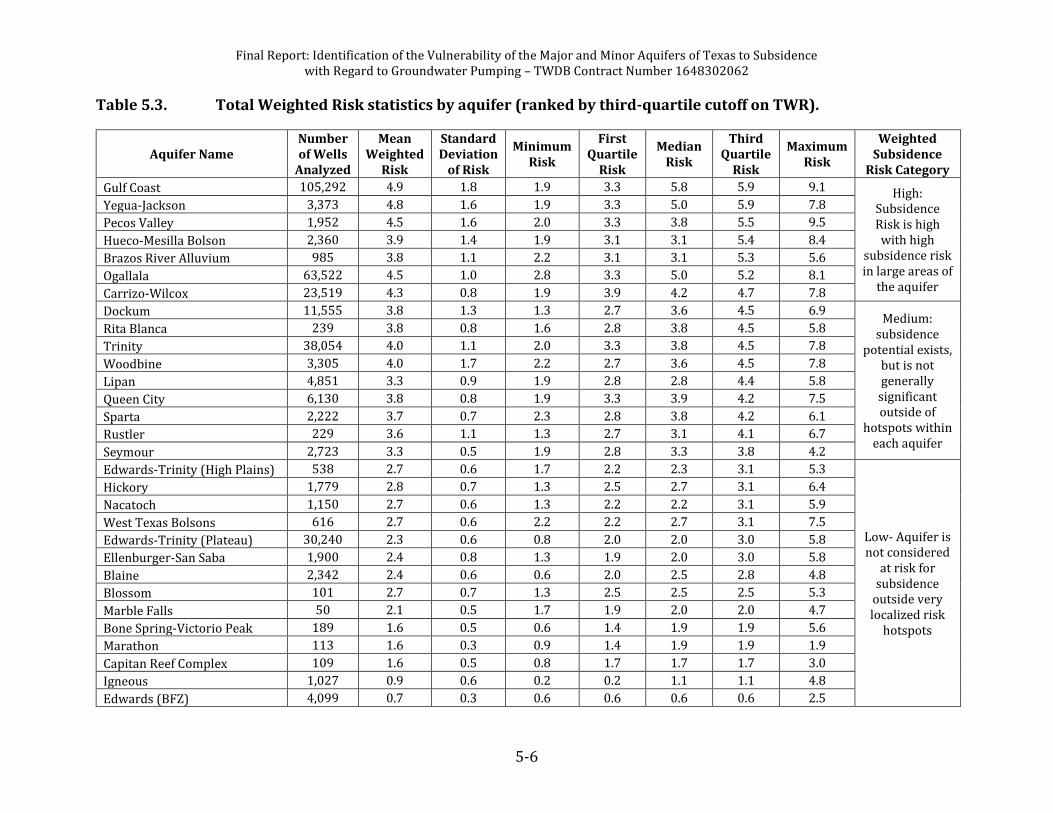
Table 5.3. Total Weighted Risk statistics by aquifer (ranked by third-quartile cutoff on TWR). ..................................................................................................................... 5-6
Table 6.1. Excerpt of the subsidence prediction tool table of predicted water level, drawdown, and potential subsidence for Tracking Number 417430 in the Submitted Drillers Report database. .......................................................................... 6-21
Table 7.3. Aquifers Identified with High Risk of Subsidence ................................................... 7-8
Final Report: Identification of the Vulnerability of the Major and Minor Aquifers of Texas to Subsidence with Regard to Groundwater Pumping – TWDB Contract Number 1648302062
xxi
Abbreviations
CORS ............................................................................. Continuously Operating GPS Reference Stations
ft/d ....................................................................................................................................................... Feet per Day
ft2/d ...................................................................................................................................... Square Feet per Day
GAM .............................................................................................................. Groundwater Availability Model
GCD ........................................................................................................ Groundwater Conservation District
GMA ............................................................................................................. Groundwater Management Area
gpm/ft ..................................................................................... Gallons per Minute per Foot of Drawdown
GPS ............................................................................................................................ Global Positioning System
MAG ............................................................................................................. Modeled Available Groundwater
psi ....................................................................................................................... Pound-Force per Square Inch
RWPG ............................................................................................................ Regional Water Planning Group
SDR ................................... Texas Water Development Board Submitted Drillers Report Database
SRV ................................................................................................................................... Subsidence Risk Value
TAGD ............................................................................................ Texas Alliance of Groundwater Districts
TCEQ .................................................................................. Texas Commission on Environmental Quality
TDA ............................................................................................................. Texas Department of Agriculture
TDS .................................................................................................................................... Total Dissolved Solids
TPWD .................................................................................................... Texas Parks & Wildlife Department
TWCA .............................................................................................. Texas Water Conservation Association
TWDB ......................................................................................................... Texas Water Development Board
TWR ...................................................................................................................................... Total Weighted Risk
USGS ................................................................................................................................. U.S. Geological Survey
Final Report: Identification of the Vulnerability of the Major and Minor Aquifers of Texas to Subsidence with Regard to Groundwater Pumping – TWDB Contract Number 1648302062
xxii
This page is intentionally blank.
Final Report: Identification of the Vulnerability of the Major and Minor Aquifers of Texas to Subsidence with Regard to Groundwater Pumping – TWDB Contract Number 1648302062
1-1
1 Executive Summary This report presents the results of a study the Texas Water Development Board (TWDB) requested to identify areas of vulnerability to subsidence due to groundwater pumping in the major and minor aquifers of Texas outside of the Houston-Galveston and Fort Bend Subsidence Districts. Subsidence is the lowering of the ground surface and typically occurs in unconsolidated aquifers where compressible layers exist. Subsidence also occurs in areas where soluble aquifer layers experience accelerated dissolution, erosion, and void growth.
Subsidence can cause problems with infrastructure that cannot tolerate significant land surface elevation changes. In subsidence prone areas, damage occurs to buildings, roads, canals and other infrastructure. Another potential problem, most often in coastal areas susceptible to subsidence, is increased flood risk due to the lowering of the ground surface. Subsidence due to groundwater pumping typically happens very slowly and subsidence measurements need to be highly accurate, occur over long periods of time, and cover large areas.
The goal of this project is to assist Groundwater Conservation Districts (GCDs) and other local stakeholders in identifying and managing subsidence risks. For aquifers where subsidence risks are identified as high, subsidence investigation, monitoring, and prediction recommendations are provided.
1.1 Materials and Methods (Data Compilation and Stakeholder Outreach)
Our study started with the collection of various types of subsidence related data from publicly available sources. The most important data to our subsidence risk analysis were the Texas Department of Licensing and Regulation’s (TDLR) Submitted Drillers Reports (“SDRs” containing lithology data), the TWDB’s Groundwater Database (water levels), and TWDB’s Groundwater Availability Models (“GAMs” containing aquifer structure, properties, and predicted future water levels).
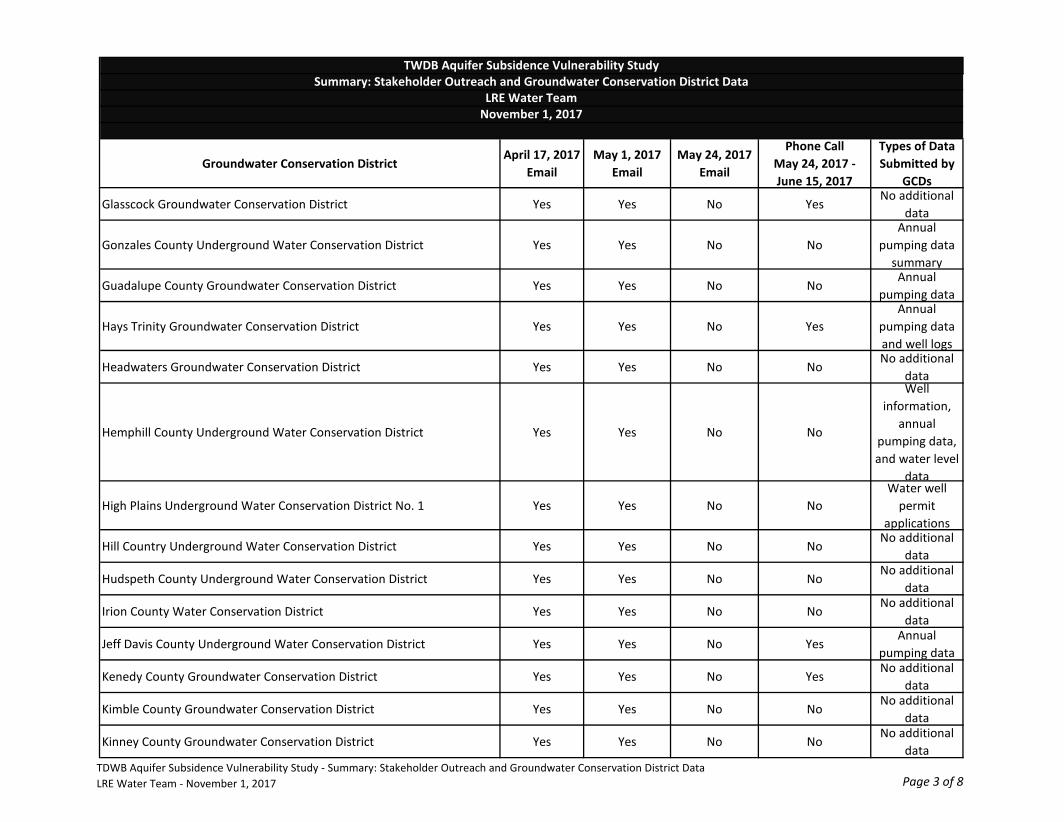
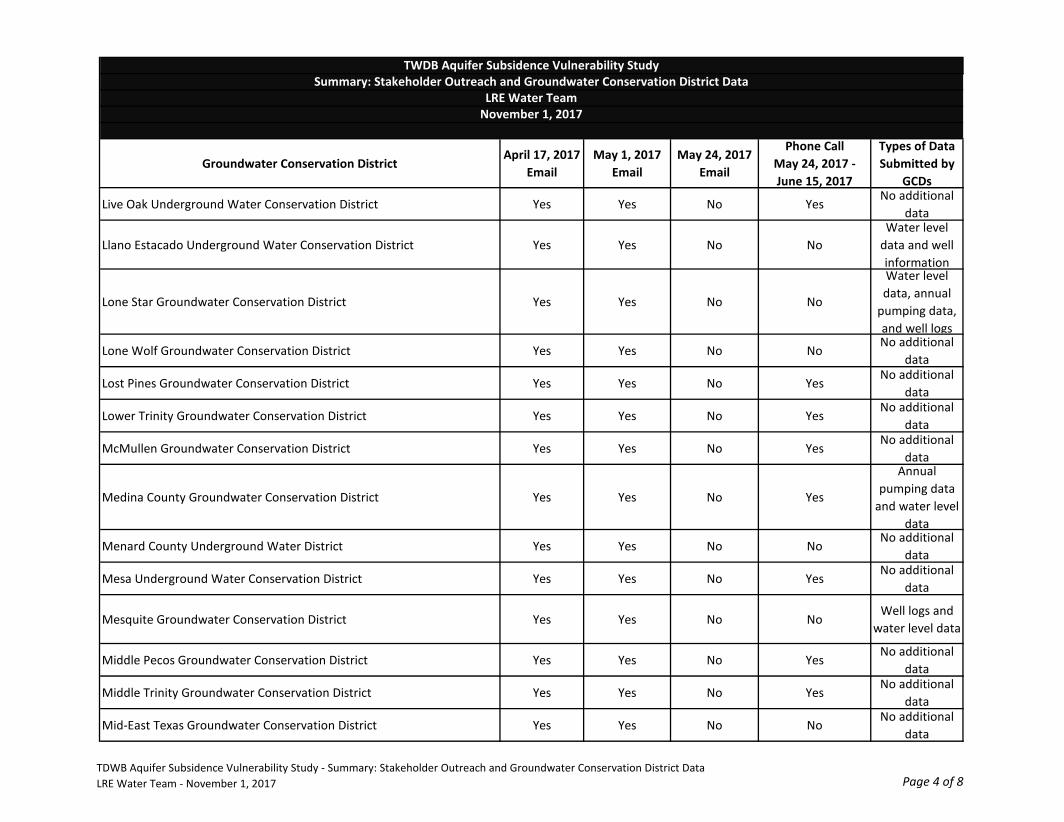
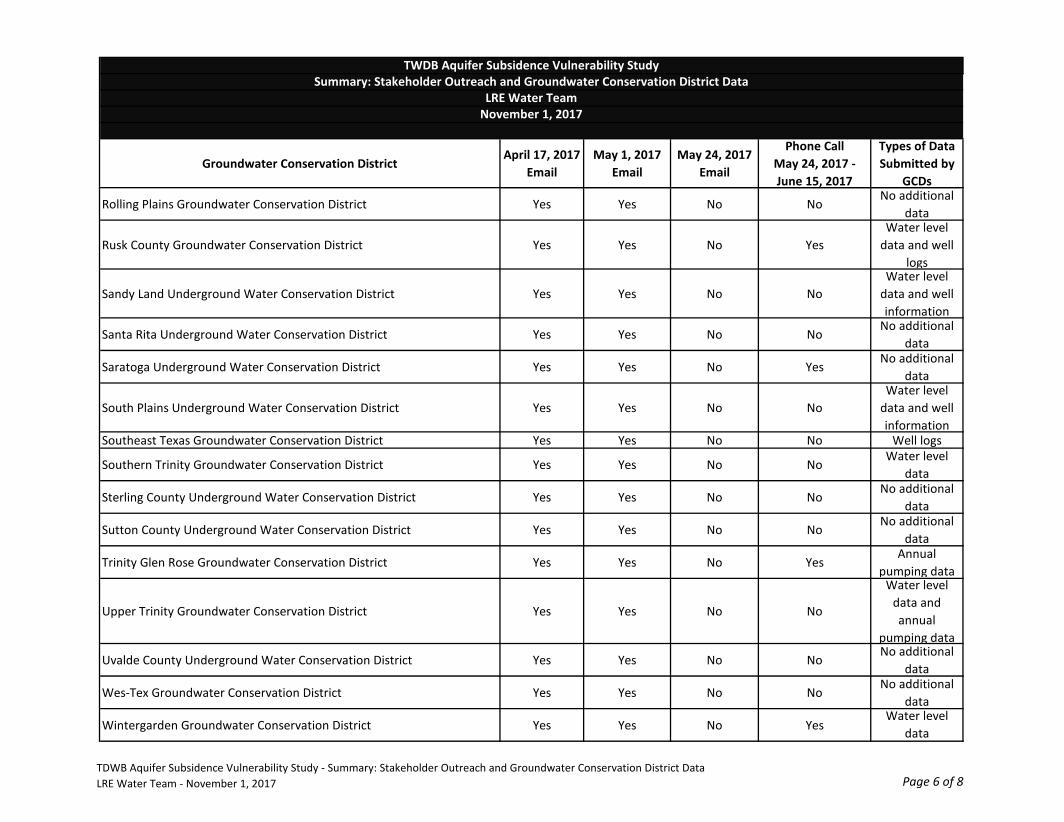
In addition to contacting federal, state, and local agencies, we also conducted an extensive outreach program to raise awareness of this project in the Texas water industry and to gather other lesser-known subsidence related data. Along with other groups, we directly contacted the Texas Alliance of Groundwater Districts (TAGD), GCDs, Subsidence Districts, and regional water planning groups. Much of our interaction focused on GCDs and the TAGD. In total, we contacted all confirmed GCDs as part of this Stakeholder Outreach effort. Of the 98 contacted GCDs, 42 provided additional data not available from other sources. These data consisted of geophysical well logs, lithologic data, annual pumping data, and/or water level data.
Final Report: Identification of the Vulnerability of the Major and Minor Aquifers of Texas to Subsidence with Regard to Groundwater Pumping – TWDB Contract Number 1648302062
1-2
All of the pertinent data collected were compiled into geodatabases consistent with the TWDB GAM geodatabase structure. This consistency will facilitate future integration of the subsidence-related data directly into larger TWDB databases.
There are three primary factors that determine the magnitude, location, and timing of subsidence related to groundwater pumping, namely:
• The distribution, thickness, and compressibility of clay layers; • The amount and timing of water-level changes; and, • The lowest historical water level.
To assign a quantitative value to the subsidence risk for each portion of a subject aquifer, we developed a risk matrix that incorporates each of the above-specified factors into a Subsidence Risk Value (SRV) for each well. In addition, we added a consideration of the general aquifer lithology to the matrix to account for subsidence risk associated with carbonate or evaporite dissolution. Table 1.1 provides the factors and classes within each factor used to quantify the potential aquifer subsidence risk. The sum of the weighted subsidence risk factors could range from 21 to 85. To simplify the results, we normalized the total subsidence risk to be represented by a value between 0 and 10 (inclusive) with the higher values being at the greatest risk. For display purposes on project graphics, we labeled risks on a continuous gradation between “Low” (0) and “High” (10).
1.2 Subsidence Risk Evaluation
Areas with observed historical subsidence are likely an indication of future risk. Our literature review identified four areas of historical subsidence observations located outside of existing subsidence districts. These areas are: 1) Gulf Coast Aquifer System, 2) Pecos Valley Aquifer (including the Wink Sinks), 3) El Paso, and 4) an isolated event near Austin. The evidence of subsidence in these areas ranged from anecdotal information to highly technical investigations and served as Texas specific examples of subsidence causal factors and investigation methods.
Our literature review also resulted in a summary of the aquifer characteristics important to subsidence studies for each major and minor aquifer. For each aquifer, we describe the hydrostratigraphy, hydraulic properties, hydraulic heads, groundwater pumping, and subsidence vulnerability. Over 340,000 wells were analyzed for subsidence risk in this project. There is a large variation among several important aquifer properties that influence aquifer subsidence including clay and aquifer thicknesses.
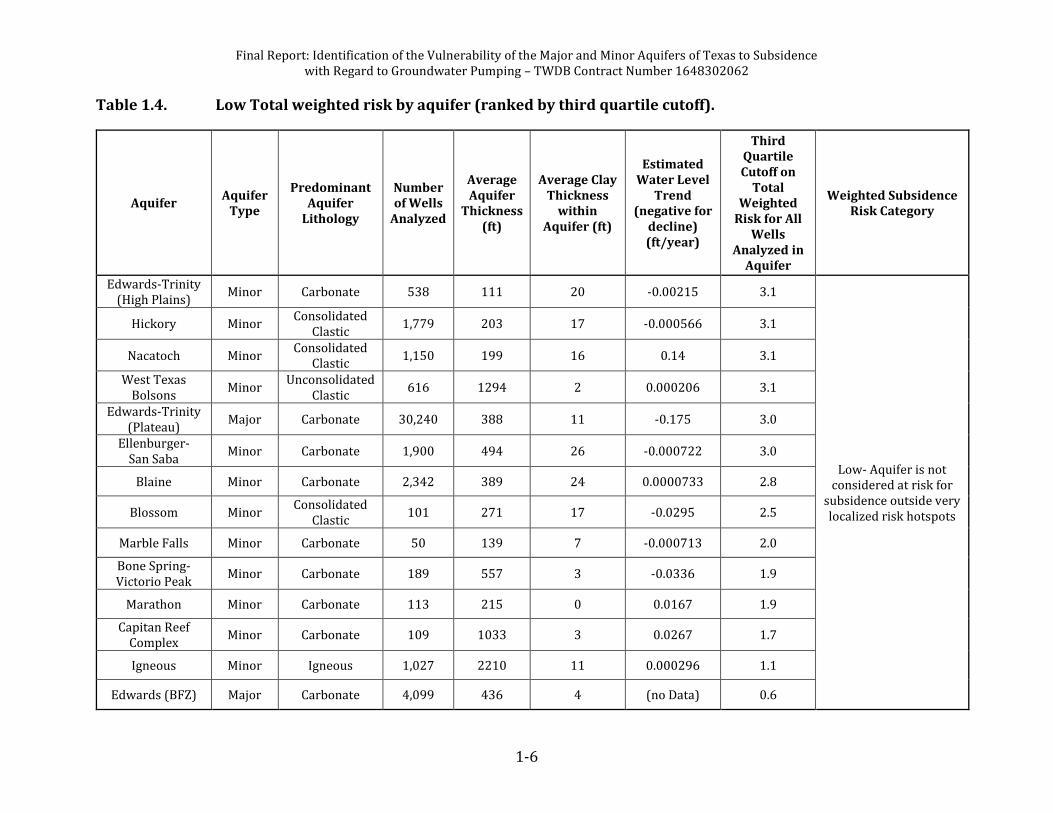
Aggregate Total Weighted Risk statistics were calculated for each aquifer. The Total Weighted Risk third quartile cutoff values were used to classify the aquifers because it places more emphasis on the upper end of the Total Weighted Risk for each aquifer and will somewhat correct for issues such as partial penetration. Table 1.2, Table 1.3, and Table 1.4 show the High, Medium, and Low aquifer risk rankings by Total Weighted Risk third quartile cutoff values, respectively.
Final Report: Identification of the Vulnerability of the Major and Minor Aquifers of Texas to Subsidence with Regard to Groundwater Pumping – TWDB Contract Number 1648302062
1-3
Table 1.1. Aquifer subsidence risk matrix factors, weights, classes, and class values.
Subsidence Risk Factor (Weight) Subsidence Risk Factor Class
Subsidence Risk Value
Clay Layer Saturated Thickness and Extent (6)
Regional Extent – Greater than 300 feet 5 Regional Extent – 200 to 300 feet 4 Regional Extent – 100 to 200 feet 3
Regional Extent – Greater than 0 to 100 feet 2 Local Extent or No Clay 1
Clay Compressibility (5) Plastic Clay 3
Stiff Clay 2 Hard or No Clay 1
Aquifer Lithology (4)
Unconsolidated Clastic 4 Consolidated Clastic 3
Carbonate/Evaporite 2 Igneous 1
Preconsolidation Characterization (3)
Current Static Water Level Less than Historic Low Water Level Plus 25 Feet
3
Current Static Water Level Greater than Historic Low Water Level Plus 25 Feet and Less than Historic Low Water Level Plus 50
Feet
2
Current Static Water Level Greater than Historic Low Water Level Plus 50 Feet
1
Predicted 50-Year Water Level Decline based on Trend (2)
Greater than 200 feet 5 Between 100 and 200 feet 4 Between 50 and 100 feet 3
Between 0 and 50 feet 2 Less than 0 feet 1
Predicted DFC* Water Level Decline (1)
Greater than 200 feet 5 Between 100 and 200 feet 4 Between 50 and 100 feet 3
Between 0 and 50 feet 2 Less than 0 feet 1
*DFC = Desired Future Condition
Aquifers with a Total Weighted Risk third quartile cutoff value above 4.7 are considered at high risk for subsidence. Aquifers with a Total Weighted Risk third quartile cutoff value between 3.8 and 4.5 are considered medium risk for aquifer subsidence. In general, these medium risk aquifers lack at least one major subsidence risk factor (lithology type that is not considered for high risk, or no significant predicted decline in water levels). Aquifers with a Total Weighted Risk third quartile cutoff value at 3.1 or below are not considered to be at significant subsidence. Any aquifer, however may have localized areas of higher and lower subsidence risk than that indicated by the reported aquifer-wide Total Weighted Risk value.
Final Report: Identification of the Vulnerability of the Major and Minor Aquifers of Texas to Subsidence with Regard to Groundwater Pumping – TWDB Contract Number 1648302062
1-4
Table 1.2. High total weighted risk by aquifer (ranked by third quartile cutoff).
Aquifer Aquifer
Type
Predominant Aquifer
Lithology
Number of Wells
Analyzed
Average Aquifer
Thickness (ft)
Average Clay Thickness
within Aquifer (ft)
Estimated Water Level
Trend (negative for
decline) (ft/year)
Third Quartile Cutoff on
Total Weighted
Risk for All Wells
Analyzed in Aquifer
Weighted Subsidence Risk Category
Gulf Coast Major Unconsolidated
Clastic 105,292 650 66 -0.000167 5.9
High: Subsidence Risk is high with high
subsidence risk in large areas of the aquifer
Yegua-Jackson Minor Unconsolidated
Clastic 3,373 828 110 0.0000372 5.9
Pecos Valley Major Unconsolidated
Clastic 1,952 549 36 -0.266 5.5
Hueco-Mesilla Bolson
Major Unconsolidated
Clastic 2,360 810 23 -0.00276 5.4
Brazos River Alluvium
Minor Unconsolidated
Clastic 985 54 1 -0.000237 5.3
Ogallala Major Unconsolidated
Clastic 63,522 223 17 -0.864 5.2
Carrizo-Wilcox Major Unconsolidated
Clastic 23,519 401 66 -0.332 4.7
Final Report: Identification of the Vulnerability of the Major and Minor Aquifers of Texas to Subsidence with Regard to Groundwater Pumping – TWDB Contract Number 1648302062
1-5
Table 1.3. Medium total weighted risk by aquifer (ranked by third quartile cutoff).
Aquifer Aquifer
Type
Predominant Aquifer
Lithology
Number of Wells
Analyzed
Average Aquifer
Thickness (ft)
Average Clay Thickness
within Aquifer (ft)
Estimated Water Level
Trend (negative for
decline) (ft/year)
Third Quartile Cutoff on
Total Weighted
Risk for All Wells
Analyzed in Aquifer
Weighted Subsidence Risk Category
Dockum Minor Consolidated
Clastic 11,555 923 96 -0.00122 4.5
Medium: subsidence potential exists, but is not
generally significant outside of hotspots within each aquifer
Rita Blanca Minor Consolidated
Clastic 239 184 83 -0.00259 4.5
Trinity Major Consolidated
Clastic 38,054 259 82 -0.766 4.5
Woodbine Minor Consolidated
Clastic 3,305 256 104 -0.785 4.5
Lipan Minor Unconsolidated
Clastic 4,851 107 12 0.00188 4.4
Queen City Minor Unconsolidated
Clastic 6,130 425 42 0.0125 4.2
Sparta Minor Unconsolidated
Clastic 2,222 176 28 0.0326 4.2
Rustler Minor Consolidated
Clastic 229 335 79 -0.000564 4.1
Seymour Major Unconsolidated
Clastic 2,723 44 5 0.000586 3.8
Final Report: Identification of the Vulnerability of the Major and Minor Aquifers of Texas to Subsidence with Regard to Groundwater Pumping – TWDB Contract Number 1648302062
1-6
Table 1.4. Low Total weighted risk by aquifer (ranked by third quartile cutoff).
Aquifer Aquifer
Type
Predominant Aquifer
Lithology
Number of Wells
Analyzed
Average Aquifer
Thickness (ft)
Average Clay Thickness
within Aquifer (ft)
Estimated Water Level
Trend (negative for
decline) (ft/year)
Third Quartile Cutoff on
Total Weighted
Risk for All Wells
Analyzed in Aquifer
Weighted Subsidence Risk Category
Edwards-Trinity (High Plains)
Minor Carbonate 538 111 20 -0.00215 3.1
Low- Aquifer is not considered at risk for
subsidence outside very localized risk hotspots
Hickory Minor Consolidated
Clastic 1,779 203 17 -0.000566 3.1
Nacatoch Minor Consolidated
Clastic 1,150 199 16 0.14 3.1
West Texas Bolsons
Minor Unconsolidated
Clastic 616 1294 2 0.000206 3.1
Edwards-Trinity (Plateau)
Major Carbonate 30,240 388 11 -0.175 3.0
Ellenburger- San Saba
Minor Carbonate 1,900 494 26 -0.000722 3.0
Blaine Minor Carbonate 2,342 389 24 0.0000733 2.8
Blossom Minor Consolidated
Clastic 101 271 17 -0.0295 2.5
Marble Falls Minor Carbonate 50 139 7 -0.000713 2.0
Bone Spring-Victorio Peak
Minor Carbonate 189 557 3 -0.0336 1.9
Marathon Minor Carbonate 113 215 0 0.0167 1.9
Capitan Reef Complex
Minor Carbonate 109 1033 3 0.0267 1.7
Igneous Minor Igneous 1,027 2210 11 0.000296 1.1
Edwards (BFZ) Major Carbonate 4,099 436 4 (no Data) 0.6
Final Report: Identification of the Vulnerability of the Major and Minor Aquifers of Texas to Subsidence with Regard to Groundwater Pumping – TWDB Contract Number 1648302062
1-7
The only common characteristic shared by the seven aquifers identified as having high subsidence risk is that they are unconsolidated clastic aquifers. Clay types, storage coefficients, and water level trends varied among these aquifers indicating that there is no single subsidence risk factor, other than the broad aquifer lithology types, that is responsible for an aquifer being at risk.
Figure 1.1 and Figure 1.2 show the calculated subsidence risk mapped at each of the wells evaluated within the major and minor aquifers, respectively.
Figure 1.1. Major aquifer subsidence risk.
Final Report: Identification of the Vulnerability of the Major and Minor Aquifers of Texas to Subsidence with Regard to Groundwater Pumping – TWDB Contract Number 1648302062
1-8
Figure 1.2. Minor aquifer subsidence risk
Final Report: Identification of the Vulnerability of the Major and Minor Aquifers of Texas to Subsidence with Regard to Groundwater Pumping – TWDB Contract Number 1648302062
1-9
1.3 Subsidence Prediction
We developed a Microsoft Excel-based subsidence tool to provide a screening-level analysis of subsidence potential. We designed the tool to express subsidence potential as a table and graph of the numerical estimate of predicted subsidence based on given aquifer properties. The tool also considers the weighted aquifer subsidence vulnerability value at the input location.
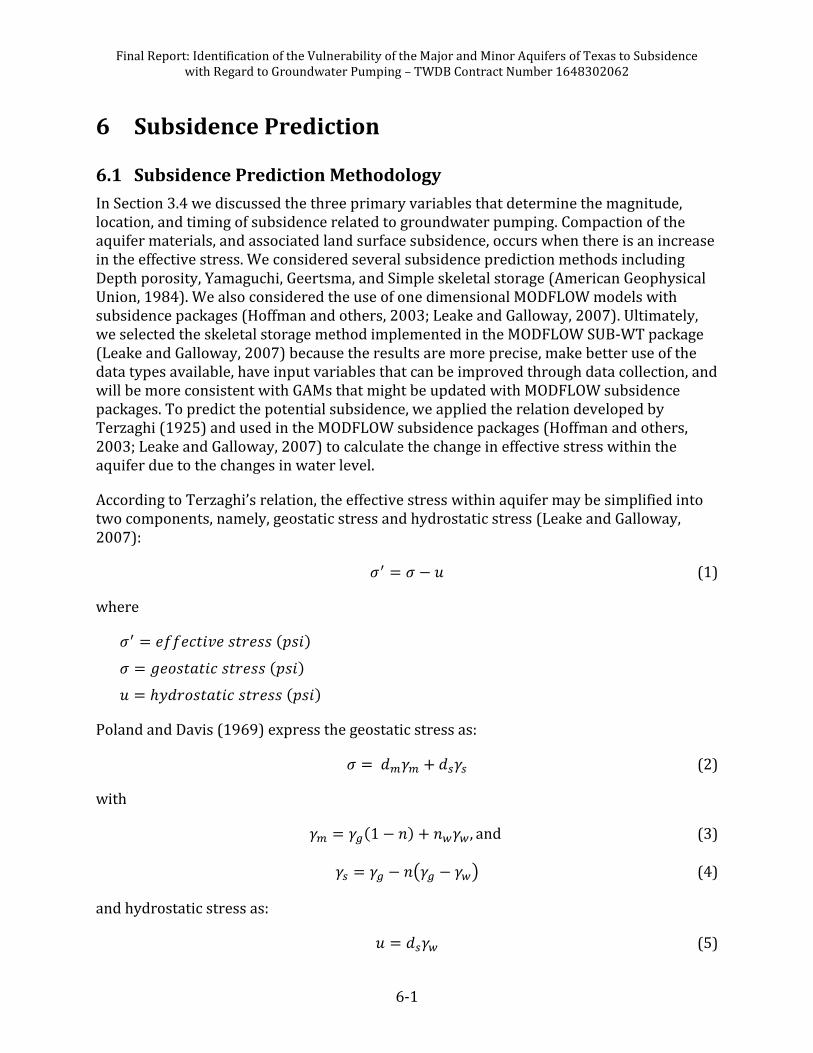
We considered several subsidence prediction methods and ultimately created a tool that implements the skeletal storage method used in the MODFLOW SUB-WT package (Leake and Galloway, 2007) because the results are more precise, make better use of the data types available, have input variables that can be improved through data collection, and will be more consistent with GAMs that might be updated with MODFLOW subsidence packages. To predict the potential subsidence, we applied the relation developed by Terzaghi (1925) and used in the MODFLOW subsidence packages (Hoffman and others, 2003; Leake and Galloway, 2007) to calculate the change in effective stress within the aquifer due to the changes in water level.
For the aquifers we identified to have a high subsidence risk, a higher level of subsidence prediction analysis than the Excel-based tool developed for this project may be warranted. A next step in the analysis may be to apply an existing analytical model such as the PRESS model used by the Harris-Galveston and Fort Bend Subsidence Districts. The PRESS model allows for detailed input of specific storage for various depth intervals that may improve site-specific predictions of subsidence.
After the PRESS model, the most complex level of analysis would be the incorporation of a subsidence package (Hoffman and others, 2003; Leake and Galloway, 2007) into a MODFLOW model of the aquifer. The TWDB has adopted a GAM for each of the aquifers identified to have high subsidence risk. As these models are updated, the project could include the incorporation of a subsidence package and subsequent analysis. Any such subsidence modeling should include a robust uncertainty analysis that clearly communicates the range and timing of potential subsidence associated with projected water level changes.
1.4 Subsidence Monitoring and Investigation
Subsidence investigations may be appropriate in areas where we have identified high risk. Such investigations may also be appropriate for areas identified as medium or high risk with critical infrastructure that would be sensitive to land surface elevation changes and/or land surface fissures. The objective of further investigating subsurface characteristics that lead to subsidence is to provide data that can inform a more accurate evaluation of subsidence risk or that can contribute to more accurate subsidence predictions. Subsidence investigation methods we discuss include: lithologic; geotechnical and/or geophysical borings; geophysical surveys; and, survey benchmark re-leveling.
Final Report: Identification of the Vulnerability of the Major and Minor Aquifers of Texas to Subsidence with Regard to Groundwater Pumping – TWDB Contract Number 1648302062
1-10
Subsidence monitoring may be appropriate for locations of high risk and/or where subsidence has already been observed. The susceptibility of local infrastructure to land surface elevation changes and/or land surface fissures will be an important consideration for local stakeholders considering subsidence monitoring. Subsidence monitoring methods we discuss include: borehole extensometers; Interferometric Synthetic Aperture Radar (InSAR); Global Positioning System (GPS) surveying; and, survey benchmark releveling.
For those aquifers that were identified as having high subsidence risk (and areas of insufficient data), we recommend investigation and monitoring methods that are specific to the aquifer and subsidence risk conditions.
1.5 Recommendations and Limitations
A common theme in subsidence studies is understanding and communicating the uncertainty related to subsidence data, methods, predictions, and risk assessments. The recommendations and limitations of this project are geared towards understanding subsidence risk where necessary, while increasing our confidence through additional data collection and analysis. For those areas where we have identified higher subsidence risk and for other areas where additional subsidence studies are justified, we recommend that local stakeholders develop strategies specific to their local areas that are informed by specialized subsidence training or consultation.
The limitations of this study that need to be considered are:
• This is a regional study and should not be used for local subsidence risk analysis. The results of this study may provide a qualitative indication of local risk, but greater data uncertainty at the local level increases the uncertainty of the results. While the results may inform stakeholders of the risk for potential subsidence, site-specific investigations of aquifer properties affecting subsidence would be needed for local scale analysis.
• This study focused on subsidence due to groundwater pumping and other types of subsidence causes (for example, mining) were not factored into our risk analyses.
• Subsidence is most common in areas with compressible layers. We did consider soluble type subsidence, but our characterization was limited by the local and unpredictable nature of its causes.
• Subsidence has inherent data uncertainty that results in limitations as to how risk analyses and predictions can be used. Subsidence related data are sometimes sparse, or of low quality (for example, accuracy of lithology descriptions in drillers logs), and affect the accuracy of risk analyses and subsidence predictions.
• Some of our information was obtained from planning documents (for example, modeled available groundwater reports or adopted desired future conditions) that are based on recent groundwater management decisions. Changes in groundwater management and usage will affect subsidence risk.
• Horizontal land movements due to subsidence are important considerations at the local scale, but were outside of the scope of this study.
Final Report: Identification of the Vulnerability of the Major and Minor Aquifers of Texas to Subsidence with Regard to Groundwater Pumping – TWDB Contract Number 1648302062
2-1
2 Introduction This report presents the results of a study the Texas Water Development Board commissioned to identify areas of vulnerability to subsidence due to groundwater pumping in the major and minor aquifers of Texas.
Subsidence is the lowering of the ground surface due to subsurface compaction. Subsidence due to pumping occurs in aquifers where pumping causes water level declines in areas with compressible subsurface layers. Groundwater level declines cause a depressurization of the compressible layers, causing them to reduce in thickness. Groundwater pumping can also cause soluble aquifer layers to experience accelerated dissolution, erosion, and void growth. Solution type subsidence can happen if these subsurface voids collapse.
Subsidence is a problem in many areas of the world and in the United States. Subsidence due to groundwater pumping has been studied extensively in California, Arizona, and within Texas, specifically within the state’s two existing subsidence districts (the Houston-Galveston and Fort Bend Subsidence Districts). The goal of this project is to study subsidence vulnerability throughout Texas, yet excluding re-studying subsidence concerns within existing subsidence districts. To achieve this goal, we have tailored existing subsidence investigation, monitoring, and prediction methods developed in other subsidence prone areas of the United States so as to be better applicable to the unique geologic characteristics of Texas.
Subsidence can cause problems with infrastructure that cannot tolerate significant land surface elevation changes. In other subsidence prone areas around the world, damage occurs to buildings, roads, canals and other critical infrastructure. Another potential problem in coastal areas susceptible to subsidence is increased flood risk due to the lowering of the ground surface. An extreme example of the potential flooding impacts to communities in areas experiencing subsidence is the former Brownwood subdivision of Baytown, Texas. The once upscale Galveston Bay waterfront community subsided eight feet over 30 years and had to be abandoned after frequent flooding turned the Brownwood subdivision into swamp-land (Galloway and others, 1999).
Less common is solution type subsidence, which can also lead to infrastructure damage but is likely to happen very suddenly. One such solution cavity collapse occurred in the Edwards Aquifer south of Austin when a sinkhole formed in a storm water detention basin (Hunt and others, 2013).
Subsidence is a process that is difficult to measure because it usually happens very slowly and can take decades to accumulate tens of feet of land surface decline. Because of the slow rate of subsidence, measurements need to be highly accurate and occur over long periods of time. Subsidence measurement methods are somewhat unique and require specialized equipment and skills to collect accurate monitoring data. Another challenge with subsidence investigation and monitoring is that it typically takes place over large areas. Making repeated accurate measurements of land surface changes over large areas can be
Final Report: Identification of the Vulnerability of the Major and Minor Aquifers of Texas to Subsidence with Regard to Groundwater Pumping – TWDB Contract Number 1648302062
2-2
expensive. Luckily, opportunities occasionally exist to repurpose and reanalyze data originally collected for other purposes and utilize the data to estimate subsidence.
Investigating the causes of subsidence is challenging and potentially expensive. Ideally, detailed geotechnical information is available about the compressibility of clay layers. Realistically, however, such data is rarely available, especially over large spatial scales. Traditional groundwater investigations rely heavily on subsurface data collected during the drilling and testing of water wells. Although well data rarely focus on detailed characterization of clay layers, we relied on it as the best available information to estimate subsidence risk across Texas.
As it typically takes a long time to manifest, prediction of future subsidence due to groundwater pumping based on information available today is an important part of subsidence risk evaluation. We synthesized water level decline predictions and aquifer characteristics using subsidence prediction tools and summarized these data for each of the major and minor aquifers. Another reason future prediction is important is that subsidence is most often mitigated by reducing pumping. Such management options take time to implement.
As stated in Texas Water Code §36.0015(b), Groundwater Conservation Districts are created:
“In order to provide for the conservation, preservation, protection, recharging, and prevention of waste of the groundwater, and of groundwater reservoirs or their subdivisions, and to control subsidence caused by withdrawal of water from those groundwater reservoirs or their subdivisions, consistent with the objectives of Section 59, Article XVI, Texas Constitution, groundwater conservation districts may be created as provided by this chapter.” (emphasis added)
As part of their groundwater management responsibilities, Groundwater Conservation Districts engage in joint planning within management areas to develop Aquifer Desired Future Conditions according to Texas Water Code §36.108. One of the requirements when adopting Desired Future Conditions is to develop an explanatory report that addresses nine factors including the impact of the adopted Desired Future Condition on subsidence (Texas Water Code §36.108(d)(5))
The ultimate objective of this project is to assist Groundwater Conservation Districts in meeting their subsidence control and joint planning requirements. In the pages that follow, the results of an evaluation of subsidence risk is presented for each of the major and minor aquifers in Texas outside of the Houston-Galveston and Fort Bend Subsidence Districts. For aquifers where subsidence risks are identified as high, subsidence investigation, monitoring, and prediction recommendations are provided.
Final Report: Identification of the Vulnerability of the Major and Minor Aquifers of Texas to Subsidence with Regard to Groundwater Pumping – TWDB Contract Number 1648302062
3-1
3 Materials and Methods The purpose of this study was to identify and assess the vulnerability of the major and minor aquifers of Texas to subsidence due to groundwater pumping (the project). To perform this assessment, we collected, managed, and analyzed various data types from publicly-available sources. This section presents a discussion of our efforts to: 1) collect and assemble several types of available data, 2) conduct stakeholder outreach to increase project awareness and identify other possible data sources and types, 3) develop the geodatabases used to analyze the data, and 4) to develop the methodology for the aquifer subsidence risk assessment.
3.1 Data Types and Availability
To initiate the data collection and analysis phase of the project, we identified various groundwater and subsidence-related data types to be collected from various publicly-available sources. The initial data types identified included:
We then identified the sources for each of these data types and initiated efforts to contact the various federal, state, and local agencies to obtain the various data sets identified. We collected these data from the Texas Water Development Board (TWDB), the U.S. Geological Survey (USGS), local groundwater conservation districts (GCDs) and other sources. Some of the statewide groundwater data resources compiled and used included the TWDB’s Groundwater Database (GWDB), Texas Department of Licensing and Regulation’s Submitted Driller’s Report Database (SDR), and the TWDB’s Brackish Resources Aquifer Characterization System (BRACS) Database. We also obtained the TWDB Groundwater Availability Model (GAM) data sets.
We considered all of the above data types for our evaluation, but only used geotechnical material properties and well log data quantitatively. Our stakeholder outreach included a request for all of these types of data, but did not result in receiving any geotechnical, geophysical, or remote sensing data. Since we did not obtain site-specific geotechnical data,
Final Report: Identification of the Vulnerability of the Major and Minor Aquifers of Texas to Subsidence with Regard to Groundwater Pumping – TWDB Contract Number 1648302062
3-2
we applied general geotechnical properties to subsurface materials described in lithologic logs. We did not use geophysical and remote sensing data directly in our risk analyses, but we reference them as potential data sources for more detailed historical subsidence evaluation, site investigation, or future monitoring.
For more information regarding the data sets we compiled and analyzed to determine aquifer subsidence evaluation risk, please refer to the summaries contained in Appendix 1, Appendix 2, and Appendix 3 of this report.
Data available in the following formats was used in the study:
Some of the GCDs and others provided data in PDF format. We reviewed such data, but it was not actively used in analyses unless significant variances from other nearby data sources were noted. All data provided in PDF format was archived in one digital file and submitted to the TWDB separately. Please note, the majority of this data was not entered into electronic databases created for this project.
3.2 Stakeholder Outreach
In addition to contacting federal, state, and local agencies, we also conducted an extensive outreach program to raise awareness of this project in the Texas water industry (specifically in the groundwater community) to gather other lesser-known subsidence-related data. We targeted select groups typically involved in the GAM discussions, including GCDs and subsidence districts and regional water planning groups (RWPGs) whose membership includes representatives from groundwater management areas (GMAs), the Texas Commission on Environmental Quality (TCEQ), Texas Parks & Wildlife Department (TPWD), Texas Department of Agriculture (TDA), water utilities, educational groups, agricultural interests, environmental interests, private landowners, and industry on these planning group boards, and the RWPG consultant teams.
In addition to the entities listed above, we also contacted the Texas Alliance of Groundwater Districts (TAGD), whose statewide membership includes about 82 GCDs, and 36 associate members that consist of attorneys, groundwater consulting firms, and other-related businesses (TAGD, 2017). Lastly, to inform the statewide water community of this study and to ensure all possible data sources were sought, we enlisted the assistance of the Texas Water Conservation Association (TWCA), the state’s primary and comprehensive professional water-industry organization.
Discussion of each of these outreach efforts is provided below.
Final Report: Identification of the Vulnerability of the Major and Minor Aquifers of Texas to Subsidence with Regard to Groundwater Pumping – TWDB Contract Number 1648302062
3-3
3.2.1 Groundwater Conservation Districts
Contacting the GCDs for this study was important for a variety of reasons. First, some of the GCDs may have gathered water level or pumping data that had not been submitted to the TWDB, and therefore, not included in the databases we obtained from the TWDB. Secondly, the GCDs could be conducting independent studies and generating data that would be useful to this study. We also contacted the GCDs to determine if there was any local knowledge of known subsidence issues in their areas. Lastly, by contacting the GCDs, we attempted to increase awareness of the study at the local level and possibly gain access to subsidence-related data that would not be available through any of the other sources discussed above. Contacting the GCDs also ensured that each GCD was made aware of the study and the results that the study will provide upon completion.
To conduct this GCD outreach, we obtained a list of all 82 TAGD GCD members (TAGD, 2017), and subsequently supplemented this list with the 16 GCDs that were not members of TAGD. Figure 3.1 depicts all 98 confirmed GCDs in the State of Texas in existence as of initiation of this project (TCEQ, 2015).1
On April 17, 2017, we sent the first email data request to the 82 TAGD GCD members. The email introduced the study, summarized the available data to be gathered, explained our data request, listed the data formats needed, provided options for submitting the data, provided a deadline for GCDs to submit their data, and identified contact information for key members of the study team. We also attached a two-page summary of the study to the email that provided more information on the purpose and need for the study. The initial deadline for GCDs to submit their data was May 31, 20172. A copy of the April 17, 2017 email and project summary sheet are included in Appendix 4.
On May 1, 2017, we sent a second reminder email to the 82 TAGD member GCDs. The second email reiterated the team’s data request and provided clarification on questions raised by some of the GCD contacts resulting from the April 17, 2017 email. Two key points clarified in this email in response to GCD questions or comments were: 1) the need to submit GCD data even if subsidence was not perceived to be a problem for that aquifer; and 2) non-duplication of efforts if the GCD’s most current data had already been submitted to the TWDB or USGS. The second email again explained our data request, listed the data formats needed, provided options for submitting the data, provided a deadline for GCDs to submit their data, and identified contact information for key members of the study team. A copy of the May 1, 2017 email is included in Appendix 4.
On May 24, 2017, we also sent out an email to the 16 GCDs that were not TAGD members. The email to these 16 GCDs combined the messages contained in the April 17, 2017 and
1 Figure 3.1 and Figure 3.2 do not reflect the Aransas County GCD, which was not confirmed as of the initiation of this project, and the Harris-Galveston Subsidence District and the Fort Bend Subsidence District because they were not included in the scope of this study. 2 The May 31, 2017 GCD deadline was subsequently extended to June 15, 2017 later in the Stakeholder Outreach project phase to encourage and allow as much GCD participation as possible.
Final Report: Identification of the Vulnerability of the Major and Minor Aquifers of Texas to Subsidence with Regard to Groundwater Pumping – TWDB Contract Number 1648302062
3-4
May 1, 2017 TAGD GCD-member communications. A copy of the May 24, 2017 email is included in Appendix 4.
Figure 3.1. Confirmed Groundwater Conservation Districts in Texas per TCEQ (2015).
To focus our GCD data gathering on key aquifers or areas of the state and based upon initial responses received from the GCDs, on May 15, 2017, we began contacting individual GCDs by telephone to directly solicit their data. To prepare for this effort, we reviewed the list of GCDs that had not responded to either the April 17 or the May 1 emails and prioritized a list of GCDs to be contacted. These individual phone calls were made between May 25, 2017 and June 15, 2017.
Final Report: Identification of the Vulnerability of the Major and Minor Aquifers of Texas to Subsidence with Regard to Groundwater Pumping – TWDB Contract Number 1648302062
3-5
In total, we contacted all 98 confirmed GCDs as part of this Stakeholder Outreach effort. Of the 98 GCDs, 42 of them provided additional data. These data consisted of geophysical well logs, lithologic data, annual pumping data, and/or water level data. Figure 3.2 is a graphic of all 98 GCDs (TCEQ, 2015) that we contacted and the 42 GCDs that provided additional data. For the complete listing of confirmed GCDs contacted, including when they were contacted and any additional data they provided, please refer to Appendix 1.
Figure 3.2. All confirmed Groundwater Conservation Districts contacted and those providing additional data.
Final Report: Identification of the Vulnerability of the Major and Minor Aquifers of Texas to Subsidence with Regard to Groundwater Pumping – TWDB Contract Number 1648302062
3-6
Lastly, while the Harris-Galveston Subsidence District and the Fort Bend Subsidence District were not included within the scope of this study, they did offer assistance and data related to subsidence for those GCDs that bordered either one of those two districts.
3.2.2 Regional Water Planning Groups
To coordinate the state’s five-year water planning process, the State of Texas created 16 RWPGs representing each of the 16 regional water planning areas across the state (TWDB, 2017c). Figure 3.3 is a map of all 16 regional water planning areas (TWDB, 2015).
Figure 3.3. Sixteen Regional Water Planning Areas in Texas.
Final Report: Identification of the Vulnerability of the Major and Minor Aquifers of Texas to Subsidence with Regard to Groundwater Pumping – TWDB Contract Number 1648302062
3-7
These RWPGs are made up of members that represent a variety of interests, including agriculture, industry, environment, public, municipalities, business, water districts, river authorities, water utilities, counties, groundwater management areas, and power generation (TWDB, 2017c). In addition, several state agencies, such as the TWDB, TDA, TPWD, and TCEQ participate in the regional planning process by providing technical expertise to the RWPGs. Lastly, each of the RWPGs engages the services of a consulting group to assist in developing their regional water plans. These consulting groups are often engaged in other water activities or projects and are involved in the Texas water industry.
Because of the wide-variety in the membership of these RWPGs and those individuals and entities that participate in this process, and the fact that the RWPGs consider groundwater availability to meet the water supply needs in their respective regions, we decided to reach out to these groups as an effective and efficient way to increase awareness of the study, and to possibly gain access to other data that could be useful. On May 23, 2017, we sent an email to each of the RWPG chairmen introducing the study, summarizing the available data to be gathered, explaining our data request, providing a deadline for data to be submitted, listing contact information for key members of the study team, and providing options for submitting the data. We also attached a two-page summary of the study to the email that provided more information on the purpose and need for the study. A copy of the May 23, 2017 email and project summary sheet are included in Appendix 4.
In response to this email, we received suggestions or questions from the RWPGs for Regions B, E, I, and M. Table 3.1 below lists the four RWPG responses we received along with our response. While no new data sources were identified through this effort, we are confident that the outreach effort helped to increase awareness of the study among the water community in Texas.
3.2.3 Texas Alliance of Groundwater Districts
The TAGD consists of GCDs and underground water conservation districts in Texas with the powers and duties to manage groundwater defined in Chapter 36 of the Texas Water Code. Other associate members of TAGD include organizations and/or consultants that work in areas related to groundwater (TAGD, 2017). TAGD’s membership includes most of the GCDs in the State of Texas (about 80) and includes individuals and organizations that regularly participate in discussions regarding technical, legal, policy, and program matters relating to groundwater. In terms of Stakeholder Outreach for this project, communicating with TAGD and its membership was extremely critical to the success of this study.
At the TAGD regular business meeting on January 26, 2017, we made a presentation to introduce the study and study team to the TAGD membership. While the study had not yet commenced, the study team wanted to inform TAGD members about the study and the team’s data request in advance, and to offer the TAGD members an opportunity to ask questions. A copy of the January 26, 2017 presentation is included in Appendix 5.
Final Report: Identification of the Vulnerability of the Major and Minor Aquifers of Texas to Subsidence with Regard to Groundwater Pumping – TWDB Contract Number 1648302062
3-8
Table 3.1. Regional Water Planning Group Comment or Question and LRE Water Team Response.
Regional Water Planning Group
Regional Water Planning Group or Member, and Comment or Question LRE Water Team Response
Region B Submitted for Mayor, City of Crowell - Will the wells that have been dug at individual homes for watering yards, to be included in this study. If so, is there a way that this information can be gathered? The individuals usually go to private well digging company's. Does this company identify the wells that they did? Also, there are some wells at individual sites that are not used because of the salt content is too high. Will these well be included?
In an email response, we let the Mayor know that in most cases, any well completed since about 2003 was reported to the TWDB and compiled in a database. For wells completed prior to 2003, we will incorporate data from other work, but will not be able to catalog all of the existing wells. Many of the records for these earlier wells are available from the TCEQ.
For the wells not used due to high salt content, we will primarily be looking at the rock type that makes up the aquifer. Data from these wells may help us with those determinations. However, we will consider the salt content in some of our calculations. If data on the water quality are available, we will include those in our study.
Regarding pumping, we will use estimates of past and future pumping relative to changes in water levels in the aquifers. These will not necessarily be on a per well basis, but will be more general for the aquifer as a whole.
Far West Texas (Region E)
Submitted on behalf of behalf of the Chairman of the Far West Texas Water Planning Group (Region E) – A letter from the Chairman mentioning four groundwater research reports that Region E completed with TWDB funds (2001 – 2010), and a 1985 USGS report that addressed minor subsidence that occurred in the floodplain region of El Paso where the Rio Grande Alluvium overlies the Hueco Bolson.
In an email response, we expressed appreciation for Region E’s assistance in helping the team with the project.
East Texas (Region I)
General Manager of the Angelina-Neches River Authority – email indicating our email would be passed along to the members of Region I.
No response necessary.
Rio Grande (Region M)
Regional Water Planning Consultant for Region M – in response to the RWPG Chairman’s forward of the May 23rd email to Region M, noted that the only groundwater work not mentioned in the LRE email was the Lower Rio Grande Valley Transport Model.
The data from the Lower Rio Grande Valley Transport Model has been incorporated into dataset for this study.
Final Report: Identification of the Vulnerability of the Major and Minor Aquifers of Texas to Subsidence with Regard to Groundwater Pumping – TWDB Contract Number 1648302062
3-9
To help in our efforts to communicate with the TAGD members, TAGD staff provided an index of the GCDs that contained their contact names and information (TAGD, 2017). This index became the primary source of data used to contact and document communications with the GCDs.
Lastly, to help increase further awareness of the study, we requested that information regarding the study be included in the TAGD monthly newsletter and on the TAGD website. Information regarding the study being conducted was included in the April 2017 newsletter and the TAGD weekly updates sent to the membership every Friday beginning on April 21, 2017 through May 31, 2017. In addition, information about the study was made available on the TAGD website from April 21, 2017 through June 15, 2017 (TAGD, 2017).
3.2.4 Texas Water Conservation Association
The Texas Water Conservation Association (TWCA) is an association of water professionals and organizations in the State of Texas. The TWCA membership represents river authorities, municipalities, navigation and flood control districts, drainage and irrigation districts, utility districts, municipalities, GCDs, and all types of water users. TWCA’s membership includes engineers, hydrogeologists, attorneys, government administrators, and numerous other individuals involved in managing Texas’ water resources (TWCA, 2017).
In an effort to increase awareness of the study, we requested that information regarding the study be included on the TWCA website. Information regarding the study being conducted was made available on the TWCA website from May 26, 2017 through June 15, 2017 (TWCA, 2017).
3.2.5 Other Entities Contacted
In addition to the stakeholder outreach efforts discussed previously, we determined that data related to road repairs due to subsidence issues or related land survey data could assist in the study. The best source for this type of data is the Texas Department of Transportation (TXDOT). We contacted the director of maintenance for each of the 25 TXDOT districts in the state. No additional data, however, was obtained.
The LRE Water Team also contacted the USGS for additional miscellaneous sources of data identified by other stakeholder contacts that could have been useful to the project. However, no additional data were obtained.
Final Report: Identification of the Vulnerability of the Major and Minor Aquifers of Texas to Subsidence with Regard to Groundwater Pumping – TWDB Contract Number 1648302062
3-10
3.3 GeoDatabase Data Organization, Assembly, and Development
We organized the various data types discussed above into an Environmental Systems Research Institute, Inc. (ESRI®) Arc GIS file geodatabase to facilitate three-dimensional aquifer conceptualization. We structured the geodatabase according to the data model for the GAM Geodatabase to aid in our integration with other TWDB groundwater data and GAM-related projects in the future. We reviewed GAM data sets to determine what was applicable to this study and focused on relevant data. The team used the most recent GAM model grids.
3.3.1 Existing Groundwater Availability Model Data
For ease in modeling and integration with a standard TWDB GAM File Geodatabase (GeoDB), we created individual GeoDBs with TWDB standard structure and properties for each aquifer. Existing GAM spatial and tabular data, where available, were incorporated for the 30 major and minor aquifers (Appendix 2). The items shaded in gray in Appendix 2 were not available in the GAM data.
The more recently developed GAM data were already in the standard TWDB GAM GeoDB format and were easily transferred into each individual aquifer GeoDB. Older GAM data, usually ESRI shapefiles, typically required more processing before conversion to a GeoDB. These spatial data were often missing spatial reference information or in projections other than the standard GAM Coordinate System and required projection definition or re-projection prior to conversion to a GeoDB. In addition, for many of the older GAMs, there was a wide variation in naming conventions and data sets.
Five minor aquifers lacked GAM spatial data, particularly aquifer structure data, and other spatial data were either insufficient or incomplete. For example, the Blossom and Marathon aquifers did not have an existing GAM when this study was initiated, and the Hueco-Mesilla Bolsons Aquifer lacked spatial data, containing only numeric MODFLOW data. Also, the Bone Spring-Victorio Peak GAM data was insufficient for inclusion into the subsidence risk model.
3.3.2 Additional Model Data
In addition to the GAM data, we compiled the Submitted Driller’s Report (SDR) well lithology data, the TWDB well water level data, the TWDB’s GWDB TDS (Total Dissolved Solids) well data, and aquifer temperature gradient grid data, and included these data as important inputs to the subsidence risk model.
For the aquifers lacking complete GAM spatial data, these additional data sets served as the primary spatial inputs to the subsidence risk evaluation model. Each of these three statewide well datasets were then “clipped” to the aquifer boundary and stored within each aquifer’s SubsurfaceHydro feature dataset.
Final Report: Identification of the Vulnerability of the Major and Minor Aquifers of Texas to Subsidence with Regard to Groundwater Pumping – TWDB Contract Number 1648302062
3-11
3.3.3 Other Mapping Data
Existing GAM data not essential to the subsidence risk evaluation model were not integrated into the individual aquifer GeoDBs. These datasets include surface hydrography, surface geology, land use/land cover, soils, climate, geopolitical boundaries, and transportation items. However, a statewide GeoDB was created to store statewide well data and mapping reference datasets, including a statewide surface elevation grid, Texas aquifer temperature gradient grid, and other statewide data used for mapping purposes only (such as geopolitical boundaries and surface transportation). These datasets are listed in Appendix 3.
3.3.4 Metadata
Metadata for shapefiles in older GAM data sets received from the TWDB were typically provided as text files instead of the standard FGDC format stored within ArcGIS. These metadata were not converted as part of this project. Additionally, if existing GAM GeoDB data did not have metadata, no new metadata was created. For all resultant subsidence risk data sets and tables, metadata was created in standard FGDC format.
There are three primary variables that determine the magnitude, location, and timing of subsidence related to groundwater pumping, namely:
• The distribution, thickness, and compressibility of clay layers; • The amount and timing of water-level changes; and, • The lowest historical water level.
Subsidence may also occur in areas where carbonate or evaporite dissolution creates or increases void spaces that ultimately collapse under geostatic stress. Our methodology for assessing the risk of subsidence due to pumping utilized the Texas Water Development Board’s available datasets for wells and groundwater availability models. We used the available datasets to efficiently derive estimates of the primary variables that control the potential for subsidence.
3.4.1 Clay Thickness and Distribution
Except within the Gulf Coast Aquifer, few evaluations of the clay layers within the major and minor aquifers have been conducted. Therefore, we developed a method for evaluating the thickness and distribution of the clays within the aquifers through calculations conducted using the reported lithology stored in the “WellLithology” table of the Submitted Drillers Reports (SDR) Database (TWDB, 2017d). Using the descriptions contained in the data table, we calculated estimates of the clay thickness at each of the 439,774 well locations in the database as of May 18, 2017.
The SDR well lithology data table contains five fields for storing data, namely: WellReportTrackingNumber, MigratedSortNumber, TopDepth, BottomDepth,
Final Report: Identification of the Vulnerability of the Major and Minor Aquifers of Texas to Subsidence with Regard to Groundwater Pumping – TWDB Contract Number 1648302062
3-12
LithologyDescription. A previous version of the SDR database stored all the lithology descriptions along with the depth information in a single text field. The second field (MigratedSortNumber) allows the data (depth and lithology) from the previous database to be stored within the current database in the LithologyDescription field and presented in the correct order. Figure 3.4 is an example of the data formats within the SDR well lithology data table.
Figure 3.4. Example data from the SDR well lithology data table.
To calculate the estimated clay thickness from the SDR well lithology data table, we developed a script written in the Julia programming language (Bezanson and others, 2017). The script allowed us to efficiently parse the depth data from LithologyDescription field when necessary (that is, when the MigratedSortNumber did not equal zero). Once we determined the TopDepth and BottomDepth data for each entry, we were then able to search for keywords that would indicate if the interval included clay. Upon review of the SDR well lithology data table, we searched for the following keywords within the LithologyDescription to determine if the interval contained clay: CLAY, CL, SHALE, GUMBO, SHELL, CAY, STICKY, and BLACKLAND.
Frequently, a modifier word would accompany the keyword for clay in the description. For example, an entry may indicate “sand & clay” indicating that the entire reported thickness is not clay. To account for the variability in the thickness that the multiple lithologies in a single description may reflect, we applied a scale factor to the total thickness (see Table 3.2). In the previous example, the reference to “sand” would result in multiplying the total thickness of the interval by one-half.
Following completion, the script then writes the final thickness, top, and bottom calculations for each clay interval to a file. Review of the results indicated that 1,432 of the 439,774 entries had a negative total thickness. In addition, 3,796 of the 1,656,042 computed intervals had negative interval thickness values. The negative interval thickness values are due to an inability to effectively parse the depth data from the LithologyDescription field (such as the well with tracking number 389472 with an entry of “3450363 Gray clay”). Since entries with such errors were a small percentage (less than
WellReportTrackingNumber|MigratedSortNumber|TopDepth|BottomDepth|LithologyDescription 449431|0|0|40|Yellow Shale and Rock 449431|0|40|60|Blue Shale 449431|0|60|140|Red Shale and Sand 449431|0|140|180|Sand 449431|0|180|220|Blue Shale 449431|0|220|340|Sand and Blue Shale 392028|1|||0-20 Blackland 392028|2|||20-40 Red Clay 392028|3|||40-60 Red & Light gray w/ sand streaks 392028|4|||60-100 Fine clay & Sand 392028|5|||100-250 Light gray clay w/sand streaks 392028|6|||250-300 Sand
Final Report: Identification of the Vulnerability of the Major and Minor Aquifers of Texas to Subsidence with Regard to Groundwater Pumping – TWDB Contract Number 1648302062
3-13
0.3%) of the data points and were unlikely to skew the results, we deleted them from the final dataset used for analysis.
Table 3.2. Keywords and scale factors for adjusting clay thickness.
Keyword Multiple on Clay Thickness
SAND 0.5 SANDY 0.5 SHALE 0.75 SHELL 0.75 ROCK 0.25
CLAYEY 0.25 SND 0.5 SD 0.5
SILTY 0.75 SILT 0.75 SLT 0.75
GRAVEL 0.5 STONE 0.25
CALICHE 0.5
To evaluate the distribution of the clay, we mapped the calculated total clay thicknesses at each point within the aquifer. The mapping allows us to quickly identify zones within each aquifer where clays are thicker and more consistent regionally.
3.4.2 Clay Compressibility
We were unable to find regional scale clay compressibility data for the major and minor aquifers in Texas. To apply estimates of compressibility we used reported information about the lithology and deposition along with the knowledge and experience of professional geologists working on this assessment. We converted the reported lithologic information into compressibility estimates by applying standard ranges of values (see Table 3.3).
Table 3.3. Estimates of compressibility for various lithologies. Modified from Domenico and Mifflin (1965).
Lithologic Material Compressibility (β), psi-1
Plastic Clay 1.8 × 10⁻³ to 1.4 × 10⁻² Stiff Clay 9.0 × 10⁻⁴ to 1.8 × 10⁻³
Medium Hard Clay 4.8 × 10⁻⁴ to 9.0 × 10⁻⁴ Loose Sand 3.6 × 10⁻⁴ to 6.9× 10⁻⁴ Dense Sand 9.0 × 10⁻⁵ to 1.4 × 10⁻⁴
Dense Sandy Gravel 3.6 × 10⁻⁵ to 6.9 × 10⁻⁵ Rock, Fissured/Jointed 2.3 × 10⁻⁶ to 4.8 × 10⁻⁵
Rock, Sound Less than 2.3 × 10⁻⁶
Final Report: Identification of the Vulnerability of the Major and Minor Aquifers of Texas to Subsidence with Regard to Groundwater Pumping – TWDB Contract Number 1648302062
3-14
3.4.3 Water Levels
Due to the regional nature of the project, we relied primarily on simulated water levels from the current GAMs for the major and minor aquifers. For the deepest water levels, we evaluated the transient (that is, calibration) modeled water level results to determine when the regionally lowest water level occurred. We used the GAM results instead of measured water levels in many cases for the following reasons:
• As the adopted models for the aquifers, they have been vetted and shown to reasonably reflect the regional aquifer conditions and water levels;
• The results provide consistent data throughout the aquifer with an understood level of uncertainty for evaluating the amount and timing of changes in water levels; and,
• They are the predictive tool used to evaluate the adopted aquifer desired future conditions (DFCs).
The lowest water level elevation is an important consideration for future subsidence because it indicates the elevation above which any substantial new subsidence is unlikely to occur (that is, the preconsolidation depth). For the confined aquifers, the lowest water level tended to coincide with, or shortly follow, when the largest amount of pumping was occurring. For water table aquifers, the lowest water levels were typically relatively recent due to long-term aquifer declines. Water level results from the calibration period and the adopted DFC model runs were extracted to well locations for assessment of past and future changes in aquifer water levels.
3.4.4 Aquifer Subsidence Risk Matrix
To assign a quantitative value to the subsidence risk for each aquifer, we developed a risk matrix that incorporates each of the factors to provide a Subsidence Risk Value (SRV). In addition, we added a consideration of the general aquifer lithology to the matrix to account for subsidence risk associated with carbonate or evaporite dissolution. Table 3.4 provides the factors and classes within each factor used to quantify the potential aquifer subsidence risk.
Using the information compiled for each well, we assigned the class value for each subsidence risk factor. We then multiplied the class value by a weighting value for each risk factor. We assigned the weighting values by subjectively ranking the factors in order of importance (based on our professional judgement) and assigning the highest weight to the most important factor.
As shown in Table 3.4, we ranked clay layer saturated thickness and extent as the most important subsidence risk factor followed by clay compressibility. We ranked those two factors as shown because it is possible for a clay to be highly compressible, but also thin which would make the risk of subsidence much less; however, a thick clay that is less compressible could result in significant subsidence. Our ordering of the predicted water level declines ranked the prediction based on historical trends higher than the predicted change based on the DFC because the DFC runs may reflect greater production than would
Final Report: Identification of the Vulnerability of the Major and Minor Aquifers of Texas to Subsidence with Regard to Groundwater Pumping – TWDB Contract Number 1648302062
3-15
actually occur and the trend is based on the past changes in water levels due to the best estimates of actual production.
The sum of the weighted subsidence risk factors could range from 21 to 85. To simplify the results, we normalized the total subsidence risk to be represented by a value between 0 and 10 (inclusive) with the higher values being at the greatest risk. For display purposes on project graphics, we labeled risks on a continuous gradation between “Low” (0) and “High” (10).
Table 3.4. Aquifer subsidence risk matrix factors, weights, classes, and class values.
Subsidence Risk Factor (Weight) Subsidence Risk Factor Class
Subsidence Risk Value
Clay Layer Saturated Thickness and Extent (6)
Regional Extent – Greater than 300 feet 5 Regional Extent – 200 to 300 feet 4 Regional Extent – 100 to 200 feet 3
Regional Extent – Greater than 0 to 100 feet 2 Local Extent or No Clay 1
Clay Compressibility (5) Plastic Clay 3
Stiff Clay 2 Hard or No Clay 1
Aquifer Lithology (4)
Unconsolidated Clastic 4 Consolidated Clastic 3
Carbonate/Evaporite 2 Igneous 1
Preconsolidation Characterization (3)
Current Static Water Level Less than Historic Low Water Level Plus 25 Feet
3
Current Static Water Level Greater than Historic Low Water Level Plus 25 Feet and Less than Historic Low Water Level Plus 50
Feet
2
Current Static Water Level Greater than Historic Low Water Level Plus 50 Feet
1
Predicted 50-Year Water Level Decline based on Trend (2)
Greater than 200 feet 5 Between 100 and 200 feet 4 Between 50 and 100 feet 3
Between 0 and 50 feet 2 Less than 0 feet 1
Predicted DFC Water Level Decline (1)
Greater than 200 feet 5 Between 100 and 200 feet 4 Between 50 and 100 feet 3
Between 0 and 50 feet 2 Less than 0 feet 1
Final Report: Identification of the Vulnerability of the Major and Minor Aquifers of Texas to Subsidence with Regard to Groundwater Pumping – TWDB Contract Number 1648302062
4-1
4 Subsidence Risk Evaluation Results
4.1 Historical Subsidence Evaluation
Historical subsidence evidence can provide an indication of future subsidence risk while also providing insight into the local nature and extent of conditions that lead to subsidence. Across much of Texas, local data is available for the evaluation of evidence of historical subsidence. We recommend that any localized area warranting additional subsidence risk evaluation include historical subsidence research using one or more of the following methods. Many of the historical subsidence lines of evidence are based on subsidence evaluation and investigation methods that are discussed further in Section 7 Subsidence Monitoring and Investigation. The sections below provide descriptions of historical subsidence observation data types that are commonly available and several examples of subsidence observations in Texas.
While the Fort Bend Subsidence District and Harris-Galveston Subsidence District are specifically excluded from this study, they are areas of the state where subsidence risk has been previously identified and thoroughly studied. Their historical subsidence investigations and subsidence monitoring programs can serve as a model for other areas where additional subsidence investigation and/or monitoring is warranted.
Historical evidence of subsidence in other areas of the state are relatively uncommon, but serve as good examples of the types of subsidence risk evaluated in this study. Below are descriptions of some of the historical subsidence observations within Texas.
4.1.1 Gulf Coast Aquifer
Within the subsidence districts excluded from this study, land surface subsidence resulting from groundwater withdrawal is well known and documented. In addition to several published reports, the USGS developed an interactive viewer for exploring historical subsidence in the Houston area (USGS, 2017). However, as documented by Ratzlaff (1982), subsidence has occurred in many areas along the Texas Gulf Coast.
Ratzlaff (1982) discussed both local and regional subsidence throughout the Texas Gulf Coast. Localized subsidence tended to be associated with oil and gas and/or mining activities; for example, Ratzlaff (1982) noted up to 15 feet of subsidence had occurred south of Beaumont, Texas due to the combination of oil and gas activities and sulfur mining. He also documented regional subsidence outside of the Houston-Galveston area of more than one foot in Jackson and Matagorda counties due to groundwater withdrawals for rice irrigation (Ratzlaff, 1982).
The investigations conducted by Ratzlaff (1980; 1982) look at subsidence along the Texas Gulf Coast through 1977 at the latest. It is likely that subsidence in many of the areas outside of the subsidence districts that Ratzlaff discussed has continued. Historical subsidence along the Texas Gulf Coast is likely greater in many areas than is currently
Final Report: Identification of the Vulnerability of the Major and Minor Aquifers of Texas to Subsidence with Regard to Groundwater Pumping – TWDB Contract Number 1648302062
4-2
documented and planned increases in groundwater production, such as brackish groundwater development in the Rio Grande Valley (RGRWPG, 2015), may increase subsidence rates in some areas.
4.1.2 Pecos Valley Aquifer and the Wink Sinks
The “Wink Sinks” are dissolution features that were discovered in the 1980s near Wink, Texas. These sinkholes formed in an area of the Pecos Valley Aquifer where there is oil and gas development. It is believed that the unintended results of oil and gas water management activities caused water to dissolve salt deposits which created subsurface voids that eventually collapsed. There was no significant risk to human health or infrastructure, but there would have been if these sinkholes happened in a more densely populated area. The Wink Sinks are representative of the difficulty in detecting or predicting the occurrence of solution type subsidence features. There have been many investigations into the Wink Sinks and a recent Texas Bureau of Economic Geology report provides a good demonstration of how Interferometric Synthetic Aperture Radar (InSAR), surface geophysical surveys, and other investigation techniques can be used in areas where solution cavity subsidence is believed to be a risk (Paine, 2016).
Another report of subsidence observations in the Pecos Valley Aquifer area is near Imperial, Texas. This subsidence is also attributed to salt dissolution cavities and illustrates the infrastructure risks and costs due to subsidence in a rural area. This subsidence area has been less studied than the Wink Sinks and is a good example of how local knowledge (sometimes even anecdotal evidence) can be important in discovering and investigating areas of historical subsidence (Malewitz, 2017).
Evidence of subsidence near Pecos, Texas was derived from survey re-leveling. Unlike the other observations of subsidence in the Pecos Valley Aquifer, a report by researchers at Cornell University indicated that the cause of this subsidence area was declining water levels in areas of compressible clay layers (Rosepiler and Reilinger, 1977). This report provides a good example of how re-leveling of survey data can provide valuable information about historical subsidence.
4.1.3 El Paso Area Subsidence Data
Observed subsidence in the El Paso area is attributed to clay layer compression due to declining water levels. The USGS has several reports characterizing the causes of the subsidence. Their 1985 report provides a description of clay layer investigations and survey re-leveling data that are used to identify localized areas that are (and other areas that are not) at risk of subsidence (Land and Armstrong, 1985). In addition to being a good example of how re-leveling data are obtained and processed, this report used a clay layer characterization methodology similar to ours and can serve as an example of how our data and approach can be scaled down to more localized areas of interest. Other USGS reports provide details on extensometers that have been installed in the El Paso area and the results of their monitoring (Heywood, 1995a; Heywood, 2003).
Final Report: Identification of the Vulnerability of the Major and Minor Aquifers of Texas to Subsidence with Regard to Groundwater Pumping – TWDB Contract Number 1648302062
4-3
4.1.4 Edwards Aquifer Solution Cavity Collapse
In 2012, a sinkhole appeared in a stormwater retention pond in the Edwards Aquifer recharge zone southwest of Austin. The Barton Springs/Edwards Aquifer Conservation District performed a study after the event to better understand the causes of the sinkhole (Hunt and others, 2013). The District and their consultants determined that a localized depression focused recharge during a precipitation event and caused leakage out of the bottom of the stormwater retention pond into the underlying karst aquifer. The increased recharge under the pond likely caused existing fractures and voids to have accelerated erosion and dissolution, ultimately leading to void growth and collapse. Subsidence features of this type are difficult to predict, but this occurrence underscores the importance of understanding the effects of water management activities. Although our report is focused on subsidence caused by groundwater pumping, this example serves as a good illustration of the contributing factors to subsidence in karst areas.
Final Report: Identification of the Vulnerability of the Major and Minor Aquifers of Texas to Subsidence with Regard to Groundwater Pumping – TWDB Contract Number 1648302062
4-4
4.2 Major Aquifers
The Texas Water Development Board currently delineates nine major aquifers in Texas. These major aquifers are defined as aquifers that produce large amounts of water over large areas (George and others, 2011). Figure 4.1 illustrates the nine major aquifers we assessed for vulnerability to subsidence with regard to groundwater pumping.
Figure 4.1. Major aquifers in Texas.
Final Report: Identification of the Vulnerability of the Major and Minor Aquifers of Texas to Subsidence with Regard to Groundwater Pumping – TWDB Contract Number 1648302062
4-5
4.2.1 Carrizo–Wilcox
As described by George and others (2011), the Carrizo-Wilcox Aquifer is a major aquifer extending from the Louisiana border to the border of Mexico in a wide band adjacent to and northwest of the Gulf Coast Aquifer System (see Figure 4.2). The aquifer consists of the Carrizo Sand and the underlying Wilcox Group which is divided into the Calvert Bluff, Simsboro, and Hooper formations in Central Texas (Thorkildsen and Price, 1991). The aquifer is primarily sand with interbeds of gravel, silt, clay, and lignite. Portions of the aquifer are more than 3,000 feet thick, but the saturated thickness with fresh groundwater reportedly averages about 670 feet (George and others, 2011).
Figure 4.2. Carrizo-Wilcox Aquifer extent.
Final Report: Identification of the Vulnerability of the Major and Minor Aquifers of Texas to Subsidence with Regard to Groundwater Pumping – TWDB Contract Number 1648302062
4-6
Carrizo-Wilcox groundwater is generally fresh and typically contains less than 500 milligrams per liter of total dissolved solids in the outcrop. Salinity increases in the downdip portions of the aquifer and high iron and manganese content in excess of secondary drinking water standards is characteristic of the deeper subsurface portions of the aquifer (George and others, 2011).
Hydrostratigraphy
More than one depositional system, including an extensive fluvial-deltaic depositional complex, deposited the sediments composing the Wilcox Group. Over time, this depositional complex enlarged toward the southeast and transported large quantities of sediment into the ancestral Gulf Coast basin. The large influx of material caused subsidence of the basin and thus allowed for the accumulation of a very thick sequence of Wilcox Group sedimentary rocks. The overlying Carrizo Formation was then deposited in a combination fluvial and nearshore marine process (Thorkildsen and Price, 1991).
The Carrizo-Wilcox units form a band 10 to 26 miles wide that trends northeast to southwest. The beds dip southeast at a rate from 100 to 200 feet per mile. The total thickness of the Carrizo-Wilcox system can attain exceed 3,800 feet. Figure 4.3 provides cross sections illustrating the dip and sequence of the geologic units. Table 4.1 summarizes the hydrostratigraphy of the Carrizo-Wilcox Aquifer.
Hydraulic Properties
Recharge to the Carrizo-Wilcox is from infiltration of rainfall on the outcrop and seepage from lakes and streams. However, only a small portion of the infiltration reaches the water table. Much of the precipitation on the outcrop is lost to surface evaporation or becomes runoff to local streams and lakes. Much of precipitation that does infiltrate below the soil is lost by transpiration through plants. A small part of the original precipitation moves slowly downward by gravity and becomes part of the saturated zone of the aquifer. An additional source, based on model analysis of the area from the Trinity to Brazos Rivers and the work of others (Thompson, 1966; Fogg and Kreitler, 1982; Fogg and others, 1983), is from interformational leakage from overlying younger beds. Discharge in the aquifer system is by loss to streams and springs, interformational flow, and discharge to wells.
In the Carrizo-Wilcox Aquifer, water-table conditions exist in the outcrop areas where the top of the zone of saturation is under direct atmospheric pressure. Wells in the outcrop area are filled with water to the level of the water table and water levels fluctuate in response to the volume of water in storage. Downdip from the outcrop, where less permeable beds overlie the Carrizo-Wilcox, ground water is under artesian pressure. Under these artesian conditions, pressure will cause the water level in the wells to rise above the top of the aquifer (Thorkildsen and Price, 1991).
Hydraulic properties controlling how water moves through the aquifer vary greatly. The variations in properties are due to the large extent of the aquifer and conditions under which the aquifer sediments were deposited. Table 4.2 summarizes the hydraulic properties for the aquifer.
Final Report: Identification of the Vulnerability of the Major and Minor Aquifers of Texas to Subsidence with Regard to Groundwater Pumping – TWDB Contract Number 1648302062
4-7
Figure 4.3. Cross sections trending northwest to southeast over the northern and southern portions of the Carrizo-Wilcox, Queen City, Sparta aquifers system (George and others, 2011; Kelley and others, 2004).
Final Report: Identification of the Vulnerability of the Major and Minor Aquifers of Texas to Subsidence with Regard to Groundwater Pumping – TWDB Contract Number 1648302062
4-8
Table 4.1. Geologic units of the Carrizo-Wilcox Aquifer and their water-bearing properties. Modified from Thorkildsen and Price (1991).
Group Geologic Units
Approximate Maximum Thickness
(feet) Rock Type Water Bearing
Properties
Cla
ibo
rne
Carrizo 880
Fine to coarse sand, Light to dark gray, massive, commonly cross-bedded with some thin beds of
sandstone and clay
Yields small to large quantities
of fresh to slightly-saline
water
Wil
cox
Wil
cox-
Un
dif
fere
nti
ated
Calvert Bluff
3,4
30
2,130
Fine to coarse lenticular sand and sand stone, Light gray to
pale brown, cross-bedded, and argillaceous in some areas interbedded with various
amounts of mud stone, ironstone concretions, and discontinuous
beds of lignite.
Yie
lds
smal
l to
larg
e q
uan
titi
es o
f fr
esh
to
sli
ghtl
y-s
alin
e w
ater
Yields small to
moderate quantities of fresh to slightly-
saline water
Simsboro 880
Fine to coarse light gray sand composed dominantly of quartz.
Sand is massive and cross-bedded, containing relatively
small amounts of clay, mudstone, and mudstone conglomerate.
Yields small to
large quantities of fresh to slightly-
saline water
Hooper 1,138
Dominantly mudstone with various amounts of light gray to
medium brown sandstone, lignite, and ironstone
concretions. Sandstone is fine to medium grained, cross bedded,
and argillaceous in the lower part of the formation. Lignite
forms thin, discontinuous beds in the upper part of the formation
Yields small to
moderate quantities of fresh to slightly-
saline water
Table 4.2. Hydraulic properties for the Carrizo-Wilcox Aquifer
Aquifer Properties Range References
Hydraulic conductivity (ft/d) 1.00 – 204 1 Transmissivity (ft2/d) 1.21 x 10² – 1.80 x 10⁵ 1
Storativity 1.61 x 10⁻⁵ – 3.4 x 10⁻³ 1 References. (1) Thorkildsen and Price (1991)
Final Report: Identification of the Vulnerability of the Major and Minor Aquifers of Texas to Subsidence with Regard to Groundwater Pumping – TWDB Contract Number 1648302062
4-9
Hydraulic Heads
Regional groundwater flowpaths for the Carrizo-Wilcox are generally in a down-dip direction. The conceptual model of groundwater flow in the Carrizo–Wilcox Aquifer assumes that groundwater flows primarily from outcrop recharge areas, especially where sandy soils are present, to discharge areas in low-lying areas such as river bottomlands, to wells, and to deeper regional flow paths including cross-formational flow. Some flow paths are relatively short and remain in the unconfined part of the aquifer. These short flow paths beneath the outcrop are from upland areas toward discharge zones in low-lying areas. Other flow paths pass deeper into the confined part of the aquifer (Dutton and others, 2002). Figure 4.4 illustrates the general flow in the downdip direction.
Figure 4.4. Conceptual model of flow in the Carrizo-Wilcox Aquifer system. Modified from (Dutton and others, 2002).
Wilcox
Final Report: Identification of the Vulnerability of the Major and Minor Aquifers of Texas to Subsidence with Regard to Groundwater Pumping – TWDB Contract Number 1648302062
4-10
Groundwater Pumping
Data from the Texas Water Development Board indicates pumping rates have generally declined between 2000 and 2015 (TWDB, 2017b). Typically, irrigation pumping accounts for slightly more than half the water pumped and pumping for municipal supply accounts for another 40 percent. However, in more recent years the amount of municipal pumping has increased while irrigation pumping has decreased. Figure 4.5 illustrates the historical pumping from the aquifer.
Figure 4.5. Historic pumping volumes from the Carrizo-Wilcox Aquifer in the municipal, manufacturing, mining, and steam/electricity production, irrigation, and livestock sectors from 1980 to 2015 (TWDB, 2017b).
Final Report: Identification of the Vulnerability of the Major and Minor Aquifers of Texas to Subsidence with Regard to Groundwater Pumping – TWDB Contract Number 1648302062
4-11
Subsidence Vulnerability
Clay thickness in the Carrizo-Wilcox is greatest in the northern part with values in much of the area exceeding 200 feet. While the maximum reported total clay thickness in the aquifer is nearly 800 feet, the average SRV based on clay thickness and extent is 2.2 with a third quartile of 3. Figure 4.6 illustrates the clay thickness at SDR well locations and the regional distribution of the thicknesses. The lithology of the Carrizo-Wilcox is primarily unconsolidated to semi-consolidated clastic material (SRV = 4.4). The aquifer consists of detrital material ranging in size from clay to gravel (George and others, 2011).
Figure 4.6. Calculated Carrizo-Wilcox Aquifer clay thickness at well locations.
Final Report: Identification of the Vulnerability of the Major and Minor Aquifers of Texas to Subsidence with Regard to Groundwater Pumping – TWDB Contract Number 1648302062
4-12
Water levels have declined in the Winter Garden area because of irrigation pumping and in the northeastern part of the aquifer because of municipal pumping. (George and others, 2011). Though there are some areas with small recovery, for evaluation purposes we assumed a preconsolidation equal to the lowest water level from the transient GAM models (Kelley and others, 2004) and static water level in the aquifer equivalent to the results for 2017 from the Modeled Available Groundwater simulations (Oliver, 2012; Wade, 2017a; Wade, 2017b) resulting in an average and third quartile SRV of 3 throughout the aquifer. We determined the water level trend using the simulated water levels from the transient calibration period for the GAM (Kelley and others, 2004) and the predicted DFC water levels from final MAG simulations (Oliver, 2012; Wade, 2017a; Wade, 2017b). Predicted water level changes due to the DFC are highly variable, but averages 19 feet of decline. Table 4.3 summarizes the data sources and values for each subsidence risk factor.
Table 4.3. Carrizo-Wilcox subsidence risk factor data sources and summary.
Subsidence Risk Factor Variable Data Source Value
3rd Quartile SRV
Clay Layer Thickness and Extent
SDR lithology table 0 to 784 feet 3
Clay Compressibility Estimated based on lithology Hard Clay 1
Aquifer Lithology George and others (2011) Unconsolidated
Clastic 4
Preconsolidation Characterization
Lowest water level from transient model simulations (Kelley and
others, 2004)
-134 to 823 feet mean sea level
3
Predicted Water Level Decline based on Trend
Trend in simulated water levels from transient model simulations
(Kelley and others, 2004)
Average 17 feet decline
2
Predicted DFC Water Level Decline
Difference in head from final Modeled Available Groundwater simulations (Oliver, 2012; Wade,
2017a; Wade, 2017b)
Average 19 feet decline
2
Results of the assessment suggest that the northern and central parts of the Carrizo-Wilcox Aquifer have the greatest risk for future subsidence due to pumping. As Figure 4.7 illustrates, data from wells in the northern and central Carrizo-Wilcox tend to show a higher risk factor than the southern portions of the aquifer.
Final Report: Identification of the Vulnerability of the Major and Minor Aquifers of Texas to Subsidence with Regard to Groundwater Pumping – TWDB Contract Number 1648302062
4-13
Figure 4.7. Carrizo-Wilcox Aquifer subsidence risk vulnerability at well locations.
Final Report: Identification of the Vulnerability of the Major and Minor Aquifers of Texas to Subsidence with Regard to Groundwater Pumping – TWDB Contract Number 1648302062
4-14
4.2.2 Edwards (Balcones Fault Zone)
The Edwards Balcones Fault Zone (BFZ) Aquifer is a thick and regionally extensive aquifer system composed of Lower Cretaceous carbonates that were deposited from Kinney County in the west to Bell County in the north. Figure 4.8 provides a map showing the extent of the aquifer’s outcrop and subcrop. The aquifer is comprised of three segments separated by groundwater divides, namely, the San Antonio segment, the Barton Springs segment, and the Northern segment. Each segment of the Edwards BFZ is a major water resource supplying the area with domestic, public supply, municipal, irrigation, and recreational water.
Figure 4.8. Edwards (BFZ) Aquifer extent.
Northern Segment
Barton Springs Segment
San Antonio Segment
Final Report: Identification of the Vulnerability of the Major and Minor Aquifers of Texas to Subsidence with Regard to Groundwater Pumping – TWDB Contract Number 1648302062
4-15
Hydrostratigraphy
The nomenclature of the Edwards (BFZ) Aquifer geology varies within different depositional provinces of the aquifer (Lindgren and others, 2004). These provinces include the Maverick Basin, the Devils River Trend, the San Marcos Platform, and North Central Texas. Table 4.4 shows the stratigraphic and hydrogeologic units encountered throughout the aquifer and Figure 4.9 provides a generalized cross-section of the Edwards (BFZ) Aquifer from west to east.
Table 4.4. Stratigraphic column of geologic and hydrogeologic units within the Edwards (BFZ) Aquifer. Modified from Maclay (1995), Lindgren and others (2004), and Jones (2003).
System Maverick
Basin
Devils River
Trend` San Marcos Platform North Central
Texas Hydrogeologic
Units
Up
per
C
reta
ceo
us Anacacho Limestone
Austin Chalk Austin Chalk
Upper Confining Units
Eagle Ford Group
Buda Limestone
Del Rio Clay
Lo
wer
Cre
tace
ou
s
Salmon Peak
Formation
Devils River
Limestone
Georgetown Formation Georgetown Formation
Edwards Aquifer
Erosional hiatus
Edwards Limestone
Ed
war
ds
Gro
up
Per
son
Fo
rmat
ion
Cyclic and marine
members
Leached member
Collapsed member
McKnight Formation
West Nueces
Formation
Regional dense member
Kai
ner
Fo
rmat
ion
Grainstone member
Kirschberg evaporite member
Dolomitic member
Comanche Peak Basal nodular member
Walnut Formation
Confining Unit
Paluxy Formation Upper Trinity
Glen Rose Limestone Upper member
Lower member Middle Trinity
Final Report: Identification of the Vulnerability of the Major and Minor Aquifers of Texas to Subsidence with Regard to Groundwater Pumping – TWDB Contract Number 1648302062
4-16
Figure 4.9. Generalized cross-section of the Edwards (BFZ) Aquifer (George and others, 2011).
The Fredericksburg and lower Washita units of the Maverick basin consist of three units, from oldest to youngest, the West Nueces Formation, the McKnight Formation, and the Salmon Peak Formation (Maclay and Small, 1986). The West Nueces Formation can be up to approximately 140 feet thick and consists of shaly limestone. The McKnight Formation can reach a thickness of 150 to 300 feet consisting of thinly bedded limestone and mud. The upper unit, the Salmon Peak Limestone, can be 400 to 500 feet thick and may be divided into a lower unit consisting of a dense mud limestone and an upper unit consisting of mostly grainstones with some mudstone.
The Devils River Formation is a composite of dolomite, limestone, and reef debris and is relatively homogeneous from top to bottom. Along the San Marcos Platform, the Edwards (BFZ) Aquifer is divided into the Edwards Group and the Georgetown Formation. The Edwards Group, from oldest to youngest, is divided into the Kainer and Person formations. These formations formed during the Cretaceous period when the San Marcos Platform depositional environment varied from open marine to supratidal flats where significant exposure and inundation of the sediments took place (Rose, 1972).
At the base of the Edwards Group lies the Kainer Formation which is comprised of the basal nodular bed, dolomitic, and grainstone members. The basal nodular member (Walnut Clay
Final Report: Identification of the Vulnerability of the Major and Minor Aquifers of Texas to Subsidence with Regard to Groundwater Pumping – TWDB Contract Number 1648302062
4-17
equivalent) is a marine deposit consisting of massive, nodular wackestones with low permeability. The dolomitic member consists mostly of intertidal and tidal, burrowed and dolomitized wackestones with significant permeability. The upper part of the dolomitic member contains leached evaporitic deposits of the Kirschberg evaporite. The uppermost member of the Kainer Formation is the grainstone member which is a shallow marine deposit that marks the beginning of another cycle of sedimentation started by a transgressing sea. This member consists of well-cemented, miliolid grainstones with lesser quantities of mudstone (Maclay and Small, 1986).
The upper stratigraphic unit of the Edwards Group is the Person Formation, which consists of the regional dense, collapsed, leached, and marine members (Rose, 1972). The basal member is a laterally extensive marine deposit consisting of dense, shaley mudstone known as the regional dense member. The overlying members, the collapsed member and leached member, consist of intertidal to supratidal deposits containing permeable units formed by collapse breccias and by dolomitized and burrowed wackestones. The uppermost member is the marine member consisting of rudist-bearing wackestones and packstones and shell-fragment grainstone (Maclay and Small, 1986).
The Edwards (BFZ) Aquifer in northern portion consist of three formations, from oldest to youngest, the Comanche Peak, the Edwards Limestone, and the Georgetown. The aquifer overlies older Cretaceous rock of the Walnut and Glen Rose formations and is overlain by younger units that consist of the Del Rio Clay, Buda Limestone, Austin Chalk, Taylor Marl, and Navarro Group. The confining units for North Central Texas are the overlying Del Rio Clay and the underlying Walnut Formation (Brune and Duffin, 1983; Baker, Jr. and others, 1986). In some areas, the Walnut Formation can be included in the Edwards (BFZ) Aquifer due to permeable shell beds.
The Comanche Peak Limestone is composed of nodular and fossiliferous marly limestone. This unit is characterized by considerable jointing and pinches out to the south (Garner and Young, 1976; Brune and Duffin, 1983). The Edwards Limestone is composed of 200 to 350 feet of highly fractured and thickly bedded to massive limestone or dolomite, with minor shale, clay, and siliceous limestone. The Edwards Limestone consists of the Kainer, Person, Kiamichi, and Duck Creek formations. The Person and Kainer formations are composed of brittle, massive limestone that is sometimes dolomitic (Flores, 1990).
The Edwards Limestone is vuggy in places because of the occurrence of solution-collapse zones and other diagenetic processes (Brune and Duffin, 1983). These vuggy zones occur parallel to bedding planes and are the result of dissolution of gypsum beds that formerly occurred in this stratigraphic unit. These vuggy zones can be cavernous, iron stained, and contain brecciated limestone, chert, crystalline calcite, and residual clay. They occur mainly 60 to 80 feet above the base of the Edwards Limestone, within the Person and Kainer formations, and are often referred to as the Kirschberg solution zone (Brune and Duffin, 1983; Flores, 1990).
The Kiamichi and Duck Creek formations constitute the Regional Dense Member near the top of the Edwards Limestone, especially in the northern part of the study area. The
Final Report: Identification of the Vulnerability of the Major and Minor Aquifers of Texas to Subsidence with Regard to Groundwater Pumping – TWDB Contract Number 1648302062
4-18
Regional Dense Member separates the Edwards Aquifer into upper and lower units that may be circumvented by fault displacement (Flores, 1990). The Georgetown Formation is a massive nodular limestone that is often hydrologically connected to the underlying Edwards Limestone (Brune and Duffin, 1983).
The regional dip of the aquifer is generally about 70 feet per mile to the southeast. To the west, the Balcones Fault Zone significantly alters the hydrogeologic structure of the aquifer. The BFZ is a series of normal en-echelon faults that trend in a general northeast-to-southwest direction extending from Williamson County in the northeast to Kinney County in the west. Faulting in the area has caused some rock units to be upthrown against others creating both barriers to flow and conduits for water to pass through. The San Marcos arch or platform as described by Sellards and others (1932) is a broad anticlinal extension of the Llano uplift extending toward the city of San Marcos in Hays County and has had significant impacts on the deposition of overlying sediments (Ashworth, 1983). Southeast of the Balcones Fault Zone, the dip of the units becomes progressively greater toward the Gulf, approaching 100 feet per mile in southeastern Travis County (DeCook, 1963).
Hydraulic Properties
Within the Edwards (BFZ) Aquifer, extensive studies have documented the hydraulic properties including: hydraulic conductivity, transmissivity, and storativity. Across the extent of the Edwards (BFZ) Aquifer, the hydraulic properties can vary by as much as eight orders of magnitude. This is due to the complex geology and karst nature of the aquifer. Table 4.5 provides a summary of the hydraulic properties calculated for each segment of the Edwards (BFZ) Aquifer. Hydraulic conductivity and transmissivity values are typically higher within the confined portions of the aquifer near fault zones with an average value up to 120 times greater value than values in the recharge zone (Hovorka and others, 1998).
Table 4.5. Hydraulic properties for the Edwards (BFZ) Aquifer.
Aquifer Properties Northern Segment
Barton Springs Segment
San Antonio Segment References
Hydraulic conductivity (ft/d)
0.01 – 30,000 0.4 – 75.3 0.01 – 1.0 x 10⁵ 1, 2, 3
Transmissivity (ft2/d) 0.5 – 4.0 x 10⁶ 53.6 – 3.72 x 10⁵ 1.0 – 1.0 x 10⁷ 1, 2, 3
Storativity * 1.0 x 10⁻⁶ – 2.9 x 10⁻² 1.0 x 10⁻⁵ – 8.0 x 10⁻⁴ 1, 2, 3 * No storativity values calculated, GAM utilizes Barton Springs Segment values References. (1) Jones (2003); (2) Scanlon and others (2001); (3) Lindgren and others (2004)
Hydraulic Heads
The three segments of the Edwards (BFZ) Aquifer are separated by hydraulic boundaries. The San Antonio segment is bounded to the west by a groundwater divide located near Brackettville and is separated from the Barton Springs segment via a groundwater divide generally located near the city of Kyle. The Barton Springs segment is separated from the Northern segment by the Colorado River. The general flow direction of water is from the recharge zone towards the confined zone of the aquifer. Low hydraulic gradients present in the confined zone assist the movement of water through fractures and conduits towards major springs located within the aquifer (Comal, San Marcos, and Barton Springs).
Final Report: Identification of the Vulnerability of the Major and Minor Aquifers of Texas to Subsidence with Regard to Groundwater Pumping – TWDB Contract Number 1648302062
4-19
Within the San Antonio segment, three regional hydraulic trends are identified: 1) broad low-gradient flow in the confined zone of the aquifer in Medina and Bexar counties; 2) steeper hydraulic gradients within the confined zone to the west and east of Medina and Bexar counties; 3) generally steep gradients across the transition zone from unconfined to confined sections of the aquifer (Lindgren and others, 2004).
Flow through the aquifer is primarily via fractures and conduits (Hovorka and others, 1998) controlled by structural influences. Within eastern Uvalde County near Knippa lies the Knippa Gap which is characterized by steep hydraulic gradients and interpreted by Maclay and Land (1988) as a narrow opening within a complex barrier-fault system. Groundwater flow in this area is channeled through this narrow opening causing a bottlenecking of groundwater west of the gap. Flow in the aquifer is controlled laterally by barrier faults that locally compartmentalize the aquifer (Maclay, 1995; Groschen, 1996) with flow in the recharge zone entering the aquifer within segments and diverted via relay ramps in the western part of the aquifer before flow moves eastward (Maclay and Land, 1988; Lindgren and others, 2004).
Groundwater Pumping
Groundwater pumpage from the aquifer primarily supplies domestic, municipal, irrigation, and industrial uses and has generally increased with the growth in population within the counties supplied by the aquifer since the early 1900s. Figure 4.10 provides a graph of the historic pumping volumes from the Edwards (BFZ) Aquifer in the municipal, manufacturing, mining, and steam/electricity production, irrigation, and livestock sectors from 1980 to 2015 (TWDB, 2017b). Within the San Antonio segment of the aquifer, historical pumpage ranges from a low of 101,900 acre-feet in 1934 to nearly 600,000 acre-feet in 1989. Between 1939 and 2000, well pumpage has increased by approximately 4,500 acre-feet per year (Lindgren and others, 2004), but as Figure 4.10 shows, the pumping has generally decreased since its peak in 1989. More than 95 percent of the pumpage is used for municipal, irrigation and industrial uses; within Comal County mining also accounts for a significant portion of the withdrawals (Lindgren and others, 2004). Irrigation usage occurs predominantly within Uvalde and Medina counties with Bexar and Uvalde counties being the largest producers of groundwater (Lindgren and others, 2004).
In the Barton Springs segment, annual groundwater production has ranged from approximately 2,800 acre-feet up to 4,300 acre-feet (Lindgren and others, 2004). Within the Northern segment of the aquifer the total pumping ranged from approximately 16,000 acre-feet in 1980 to 30,000 acre-feet in 1999 (Jones, 2003). Within the freshwater portion of the confined zone in the aquifer, well yields are generally more than 1,000 gallons per minute. In the San Antonio segment of the aquifer, well yields greater than 5,000 gallons per minute are common. Although well yields in the Northern segment are generally lower than those in the Barton Springs and San Antonio segments, well yields are typically greater than 300 gallons per minute (Brune and Duffin, 1983; Flores, 1990).
Final Report: Identification of the Vulnerability of the Major and Minor Aquifers of Texas to Subsidence with Regard to Groundwater Pumping – TWDB Contract Number 1648302062
4-20
Figure 4.10. Historic pumping volumes from the Edwards (BFZ) Aquifer in the municipal, manufacturing, mining, and steam/electricity production, irrigation, and livestock sectors from 1980 to 2015 (TWDB, 2017b).
Final Report: Identification of the Vulnerability of the Major and Minor Aquifers of Texas to Subsidence with Regard to Groundwater Pumping – TWDB Contract Number 1648302062
4-21
Subsidence Vulnerability
Clay thickness within the Edwards BFZ is low being typically less than 10 feet and uniform throughout the aquifer (SRV = 1). Because of the massive limestone and dolomite makeup of the aquifer, the Edwards BFZ has a uniformly low distribution of subsidence risk. Figure 4.11 provides the clay thickness at well locations and the regional distribution of the thicknesses.
Figure 4.11. Calculated Edwards BFZ Aquifer clay thickness at well locations.
The lithology of the Edwards BFZ is predominantly composed of massive limestone and dolomitic beds with some marly interbeds classified as a hard clay. On driller’s logs, these
Final Report: Identification of the Vulnerability of the Major and Minor Aquifers of Texas to Subsidence with Regard to Groundwater Pumping – TWDB Contract Number 1648302062
4-22
marly sections are sometimes described as clays leading to some well reports erroneously reporting unusually large clay thickness. The composition of these marly sections is calcareous with low plasticity.
Water levels within the Edwards BFZ do not show any long-term reduction as a result of pumping (Lindgren and others, 2004). Water levels generally decline during periods of drought and recover rapidly with precipitation events. Table 4.6 summarizes the data sources and values for each subsidence risk factor.
Table 4.6. Edwards BFZ subsidence risk factor data sources and summary.
Subsidence Risk Factor Variable Data Source Value
3rd Quartile SRV
Clay Layer Thickness and Extent
SDR lithology table 0 to 191 feet 1
Clay Compressibility Estimated based on lithology Hard Clay 1 Aquifer Lithology Lindgren et al., 2004 Carbonate 2 Preconsolidation Characterization
— Not Applicable 1
Predicted Water Level Decline based on Trend
— Not Applicable 1
Predicted DFC Water Level Decline
— Not Applicable 1
Results of the assessment suggest that the Edwards BFZ has a very low risk for future subsidence due to pumping. However, there is a minor risk of local subsidence due to dissolution of the aquifer material and subsequent collapse. Figure 4.12 illustrates the subsidence risk factor throughout the aquifer.
Final Report: Identification of the Vulnerability of the Major and Minor Aquifers of Texas to Subsidence with Regard to Groundwater Pumping – TWDB Contract Number 1648302062
4-23
Figure 4.12. Edwards BFZ Aquifer subsidence risk vulnerability at well locations.
Final Report: Identification of the Vulnerability of the Major and Minor Aquifers of Texas to Subsidence with Regard to Groundwater Pumping – TWDB Contract Number 1648302062
4-24
4.2.3 Edwards–Trinity (Plateau)
The Edwards-Trinity (Plateau) Aquifer is located in central-west Texas and is the primary source of water for development in the Edwards Plateau region. Figure 4.13 provides a map of the aquifer extent. The aquifer is composed of three early Cretaceous sedimentary rock units, from oldest to youngest, the Trinity, Fredericksburg, and Lower Washita. The Fredericksburg and Lower Washita are typically lumped together as the Edwards Aquifer.
Final Report: Identification of the Vulnerability of the Major and Minor Aquifers of Texas to Subsidence with Regard to Groundwater Pumping – TWDB Contract Number 1648302062
4-25
Hydrostratigraphy
The Edwards-Trinity (Plateau) Aquifer is large in spatial extent and the hydrostratigraphy varies across the extent of the aquifer. In this section, we describe the aquifer based on the six geographic regions shown on Figure 4.14. The Edwards-Trinity (Plateau) Aquifer is subdivided into the Trinity Group and Edwards Group. In general, the Trinity hydrostratigraphic unit of the aquifer is composed of sandstone, siltstone, claystone, and shale. The Edwards hydrostratigraphic unit is composed of limestone and dolomite. Figure 4.15 provides a cross-section of the aquifer from south to north and from northwest to southeast.
The southeastern and northeastern Edwards Plateau is underlain by a relatively impermeable base of Paleozoic rock. In these regions, the Trinity Group is subdivided into three units, from oldest to youngest, up to approximately 880 feet of Hosston Sand underlying up to approximately 240 feet of Sligo formation. The Lower Trinity is hydraulically separated from the Middle Trinity by the Hammett Shale. The Middle Trinity is composed of up to 88 feet of Cow Creek Limestone underlying 210 feet of Hensell Sand and underlying the lower member of the Glen Rose Limestone. The Upper Trinity is composed of the upper member of the Glen Rose Limestone. The Upper and Lower Glen Rose limestone combined is up to 1,530 feet thick. The Edwards Group, from oldest to youngest, is composed of up to approximately 300 feet of Fort Terrett Formation underlying up to approximately 380 feet of the Segovia Formation. In the higher elevation points of the southeastern Plateau, the Edwards Group Aquifer overlays the Trinity Aquifer and is exposed at the surface (Barker and Ardis, 1996). At the lower elevations, the Edwards Group Aquifer is not present and the Trinity Aquifer is exposed at the surface.
The central Edwards Plateau of the aquifer is underlain in areas by a relatively impermeable base of Paleozoic rock and in other areas by the Triassic age Dockum Group. The Dockum Group is generally impermeable except for areas of Santa Rosa sandstone which is hydraulically connected to the Trinity Group. The Trinity Group is composed of, from oldest to youngest, up to approximately 395 feet of basal cretaceous sand, up to approximately 1,530 feet of Glen Rose Limestone and Antlers Sand. The Basal Cretaceous sand is interbedded by and grouped with the Maxon Sand. The Edwards Formation is up to approximately 1,045 feet thick and composed of, from oldest to youngest, the West Nueces Formation, Fort Terrett Formation, McKnight Formation, Fort Lancaster Formations, Devils River Formation, and Salmon Peak Formation. The aquifer is generally confined by up to or greater than approximately 620 feet of Upper Cretaceous sediments (Barker and Ardis, 1996).
The northwestern Edwards-Trinity (Plateau) is underlain by Late Triassic sediments of the Dockum Group. In general, the hydraulic connection between the Edwards-Trinity (Plateau) Aquifer and Dockum group is limited, except in areas where the aquifer contacts the Santa Rosa Sandstone. The Trinity Aquifer is composed of, from oldest to youngest, up to approximately 385 feet of Basal Cretaceous Sand and Antlers Sand. The Edwards Aquifer is composed of, from oldest to youngest, up to approximately 165 feet of Finlay Formation and up to approximately 410 feet of Boracho Formation. Portions of the northwest aquifer is overlain by and hydraulically connected to the Ogallala Aquifer (Barker and Ardis, 1996).
Final Report: Identification of the Vulnerability of the Major and Minor Aquifers of Texas to Subsidence with Regard to Groundwater Pumping – TWDB Contract Number 1648302062
4-26
The Southwestern Edwards-Trinity (Plateau) section is underline by a relatively impermeable base of Paleozoic rock. The Trinity Group is composed of, from oldest to youngest, up to approximately 385 feet of Basal Cretaceous Sand and up to approximately 200 feet of Maxon Sand. The Edwards Aquifer is composed of the Telephone Canyon, Del Carmen, Sue Peaks, and Santa Elena Formations. The aquifer is confined by the Upper Cretaceous sediments of the Del Rio Clay, Buda Limestone, and Boquillas Formation (Barker and Ardis, 1996).
The western Edwards Plateau section of the aquifer is underlain by the Dockum Group, Capitan Reef Complex, and Rustler aquifers. The Capitan Reef Complex and Rustler Aquifer are hydraulically connected to the Edwards-Trinity (Plateau) Aquifer and the Dockum is hydraulically connected where there is Santa Rosa Sandstone. The Trinity Aquifer is composed of, from youngest to oldest, up to approximately 395 feet of Basal Cretaceous Sand and up to approximately 220 Feet of Maxon sand. In the farthest northwestern region, the Trinity Aquifer is composed of, from oldest to youngest, up to approximately 180 feet of Yearwood Formation and up to approximately 170 feet of Cox Sandstone (Barker and Ardis, 1996; George and others, 2011). The Edwards Aquifer is composed of, from oldest to youngest, up to approximately 300 feet of Fort Terrett Formation and up to approximately 405 feet of Fort Lancaster Formation or up to approximately 165 feet of Finlay Formation and up to approximately 410 feet of Boracho Formation. The aquifer is confined in portions by Upper Cretaceous sediments of the Del Rio Clay, Buda Limestone, and Boquillas Formation. In other areas the aquifer is hydraulically connected to the Pecos Valley Alluvium Aquifer (Barker and Ardis, 1996).
Figure 4.14. Stratigraphic column and geologic and hydrogeologic units within the Edwards-Trinity (Plateau) Aquifer (Anaya and Jones, 2009).
Final Report: Identification of the Vulnerability of the Major and Minor Aquifers of Texas to Subsidence with Regard to Groundwater Pumping – TWDB Contract Number 1648302062
4-27
Figure 4.15. Cross Section of the Edwards-Trinity (Plateau) Aquifer (George and others, 2011).
Hydraulic Properties
Within the Edwards-Trinity (Plateau) Aquifer, there have been many studies that documented the hydraulic properties including: hydraulic conductivity, transmissivity, and storativity. Across the extent of the Edwards hydrostratigraphic unit, the aquifer hydraulic properties can vary greatly due to the influence of very high hydraulic conductivity in Karst terrain. The hydraulic properties of the Edwards-Trinity (Plateau) Aquifer documented by Anaya and Jones (2009) are used as the primary source for aquifer hydraulic properties presented in this section.
The geometric mean of the hydraulic conductivity for the Edwards Aquifer outside of karstic areas is 6.7 feet per day. The geometric mean of the hydraulic conductivity of the Trinity Group of the aquifer varies between 4.5 feet per day in the north and 2.5 feet per day in the south. For the Edwards and Trinity aquifers, estimated maximum transmissivity values are 8,000 square feet per day and 7,000 square feet per day, respectively (Anaya and Jones, 2009).
The saturated thickness of the aquifer varies between approximately 0 to more than 2,000 feet. The saturated thickness is generally greater in the southern and southeastern portions of the aquifer and thins to the north and northwest. Correspondingly, the transmissivity of the aquifer is also greater in the southeastern portion of the aquifer and smaller towards the northwest (Anaya and Jones, 2009).
Final Report: Identification of the Vulnerability of the Major and Minor Aquifers of Texas to Subsidence with Regard to Groundwater Pumping – TWDB Contract Number 1648302062
4-28
Hydraulic Heads
The Trinity hydrostratigraphic unit acts as confined or semi-confined across most of the aquifer due to the overlying low permeability lower member of the Edwards hydrostratigraphic unit. Gradients are generally directed from the north to the south and southeast. In many areas, the water levels in the aquifer have declined across time primarily due to withdrawals for agricultural use. In the southern portions of the aquifer water levels have declined due to withdrawals for increased municipal use due to population growth (Anaya and Jones, 2009).
The Edwards hydrostratigraphic unit acts as unconfined across much of the aquifer. Gradients are generally directed from the north to the south and southwest towards the Balcones Fault Zone. The water levels in the aquifer have remained fairly consistent across time with minor variations primarily in response to climatic changes (Anaya and Jones, 2009).
Groundwater Pumping
More than two-thirds of the groundwater extraction from the aquifer is used for irrigation with the remaining being used primarily for municipal and livestock supply (TWDB, 2017b). Based on Texas Water Development Board data, recent annual pumping from the Edwards-Trinity (Plateau) Aquifer has ranged from less than 150,000 acre-feet to more than 250,000 acre-feet (see Figure 4.16). Overall, the extraction of groundwater has had a minimal impact on water levels as recharge rate is estimated to be greater than the extraction rate. The average recharge rate estimated through groundwater model calibration is about 1.2 million acre-feet per year (Anaya and Jones, 2009).
Subsidence Vulnerability
Clay thickness in the Edwards-Trinity (Plateau) Aquifer is greatest in the eastern part of the aquifer. Like the Edwards BFZ, many of the marly sections in the eastern portion of the aquifer are described as clay by local drillers which result in large clay thicknesses. While the maximum reported total clay thickness in the aquifer is over 600 feet, the average SRV based on clay thickness and extent is 1.4 with a third quartile of 2. Figure 4.17 illustrates the clay thickness at SDR well locations and regional distribution of the thicknesses. The lithology of the Edwards-Trinity (Plateau) Aquifer is primarily carbonates in the Edwards and detrital sands in the Trinity (George and others, 2011) resulting in an average SRV of 2.
For evaluation purposes we assumed a preconsolidation equal to the water level following peak pumping in 1965 (Hutchison and others, 2011). We set the static water level in the aquifer equivalent to the results for the end of the model calibration period. These values resulted in an average and third quartile preconsolidation SRV of 3.
Final Report: Identification of the Vulnerability of the Major and Minor Aquifers of Texas to Subsidence with Regard to Groundwater Pumping – TWDB Contract Number 1648302062
4-29
Figure 4.16. Historic pumping volumes from the Edwards-Trinity (Plateau) Aquifer in the municipal, manufacturing, mining, and steam/electricity production, irrigation, and livestock sectors from 1980 to 2015 (TWDB, 2017b).
Final Report: Identification of the Vulnerability of the Major and Minor Aquifers of Texas to Subsidence with Regard to Groundwater Pumping – TWDB Contract Number 1648302062
4-30
Figure 4.17. Calculated Edwards-Trinity (Plateau) Aquifer clay thickness at well locations.
We determined the water level trend using the simulated water levels from 1980 through 2005 of the transient calibration period for the model (Hutchison and others, 2011) and the predicted DFC water levels from final MAG simulation (Hassan, 2011; Shi, 2012). Predicted water level changes due to the water level trend are highly variable, but average 9 feet of decline. Table 4.7 summarizes the data sources and values for each subsidence risk factor.
Final Report: Identification of the Vulnerability of the Major and Minor Aquifers of Texas to Subsidence with Regard to Groundwater Pumping – TWDB Contract Number 1648302062
4-31
Table 4.7. Edwards-Trinity (Plateau) Aquifer subsidence risk factor data sources and summary.
Subsidence Risk Factor Variable Data Source Value
3rd Quartile SRV
Clay Layer Thickness and Extent
SDR lithology table 0 to 620 feet 2
Clay Compressibility Estimated based on lithology Hard Clay 1
Aquifer Lithology George and others (2011) Carbonate and Consolidated
Clastic 2
Preconsolidation Characterization
End of 1965 water level from transient model simulations
(Hutchison and others, 2011)
903 to 3,856 feet mean sea level
3
Predicted Water Level Decline based on Trend
Trend in simulated water levels from transient model simulations
(Hutchison and others, 2011)
Average 9 feet decline
2
Predicted DFC Water Level Decline
Difference in head from final Modeled Available Groundwater simulations (Hassan, 2011; Shi,
2012)
Average 7 feet decline
2
Results of the assessment suggest that the eastern part of the Edwards-Trinity (Plateau) Aquifer has the greatest risk for future subsidence due to pumping. However, the risk is likely skewed due to the drillers logs descriptions of clay. Figure 4.18 illustrates the calculated subsidence risk for the Edwards-Trinity (Plateau) Aquifer.
Final Report: Identification of the Vulnerability of the Major and Minor Aquifers of Texas to Subsidence with Regard to Groundwater Pumping – TWDB Contract Number 1648302062
4-32
Figure 4.18. Edwards-Trinity (Plateau) Aquifer subsidence risk vulnerability at well locations.
Final Report: Identification of the Vulnerability of the Major and Minor Aquifers of Texas to Subsidence with Regard to Groundwater Pumping – TWDB Contract Number 1648302062
4-33
4.2.4 Gulf Coast
The Gulf Coast Aquifer System parallels the Gulf of Mexico coastline from the Louisiana border to the border of Mexico. Figure 4.19 provides a map showing the extent of the aquifer. The aquifer is a primary source for municipal, industrial, and irrigation purposes. For our study, the Harris-Galveston Subsidence District and Fort Bend Subsidence District were excluded though each district did assist with invaluable information that contributed to our effort.
Figure 4.19. Gulf Coast Aquifer System extent. Harris-Galveston Subsidence District and Fort Bend Subsidence District excluded from this study.
Final Report: Identification of the Vulnerability of the Major and Minor Aquifers of Texas to Subsidence with Regard to Groundwater Pumping – TWDB Contract Number 1648302062
4-34
Hydrostratigraphy
From oldest to youngest, the: Catahoula confining unit; Jasper Aquifer; Burkeville confining unit; Evangeline Aquifer; and the Chicot Aquifer make up the Gulf Coast Aquifer System. The depositional environments shifted back and forth from marine to non-marine and fluvial-deltaic. The resulting sediment composition is made up of heterogeneous sequences of sands, silts, clays, and gravels (Kasmarek and Robinson, 2004). Subsidence of the underlying basement rock and rising land surfaces caused the units to thicken gulfward and dip at a rate of 70 feet to 100 feet per mile (Baker, Jr., 1979). The massive deposition of sediments also caused growth faults to form parallel to the coastline. Table 4.8 shows a stratigraphic column of geologic and hydrogeologic units within the Gulf Coast Aquifer System. Figure 4.20 provides regional cross-sections of the Gulf Coast Aquifer System from west to east.
The lower confining unit of the Gulf Coast Aquifer System is composed of the Catahoula Sandstone. The Catahoula is composed of many alternations of sandstones, sands, and clays that act as a confining unit allowing very little water to pass through. At greater depths, the Catahoula confining unit includes the Anahuac Formation and Frio Formation (Baker, Jr., 1979).
The Jasper Aquifer is comprised of, from oldest to youngest, the Catahoula Sandstone, the Oakville Sandstone, and the Fleming Formation. In some areas where the Catahoula Sandstone contains more sand, it is grouped into the Jasper Aquifer. Above the Catahoula is the Oakville Sandstone and the Fleming Formation both of which are composed of land-derived sands and clays. The upper part of the Fleming Formation is comprised of clays and silts which form the Burkeville Confining System. The Burkeville Confining System acts as the basal confining unit for the two primary aquifers of the Gulf Coast Aquifer System, namely the Evangeline and Chicot aquifers (Baker, Jr., 1979).
The Evangeline Aquifer is a mixture of alternating sand and clay layers of tens of feet in thickness. The Fleming Formation and the Goliad Sand make up the Evangeline Aquifer. The Chicot Aquifer is composed of, from oldest to youngest, the Willis Sand, Bentley Formation, Montgomery Formation, Beaumont Clay, and younger alluvium. These formations consist of sand, clay, and gravel layers with similar alternating patterns of sand and clay layers. The units that make up the Chicot and Evangeline aquifers are similar in lithology and are difficult to differentiate. The sediments from the Chicot Aquifer are less compacted and cemented resulting in a higher permeability than the Evangeline Aquifer. A reduction in permeability separates the Chicot Aquifer from the Evangeline Aquifer. Both the Chicot and the Evangeline aquifers have poorly sorted sediments (Baker, Jr., 1979).
Final Report: Identification of the Vulnerability of the Major and Minor Aquifers of Texas to Subsidence with Regard to Groundwater Pumping – TWDB Contract Number 1648302062
4-35
Table 4.8. Stratigraphic column of geologic and hydrogeologic units within the Gulf Coast Aquifer System. Modified from Baker, Jr. (1979), Baker, Jr. and others (1986), and Kasmarek and Robinson (2004).
System Series Geologic Unit Hydrogeologic Unit
Quaternary
Holocene Alluvium
Chicot Aquifer
Pleistocene
Beaumont Clay
Montgomery Formation
Bentley Formation
Willis Sand
Tertiary
Pliocene Goliad Sand
Evangeline Aquifer
Miocene
Fleming Formation
Burkeville Confining Unit
Oakville Sandstone
Jasper Aquifer
Catahoula Sandstone
Catahoula Confining Unit
Anahuac Formation
Frio Formation
Final Report: Identification of the Vulnerability of the Major and Minor Aquifers of Texas to Subsidence with Regard to Groundwater Pumping – TWDB Contract Number 1648302062
4-36
Figure 4.20. Cross-sections of the Gulf Coast Aquifer System (George and others, 2011). Modified from Baker, Jr. (1979), Baker, Jr. and others (1986), Chowdhury and Mace (2003), and Kasmarek and Robinson (2004).
Final Report: Identification of the Vulnerability of the Major and Minor Aquifers of Texas to Subsidence with Regard to Groundwater Pumping – TWDB Contract Number 1648302062
4-37
Hydraulic Properties
Within the Gulf Coast Aquifer System, hydraulic properties of transmissivity, storativity, and hydraulic conductivity have been examined for the Chicot, Evangeline, and Jasper aquifers. Across the extent of the Gulf Coast Aquifer System, the hydraulic properties are relatively similar within the three sub aquifers. Table 4.9 provides a summary of the hydraulic properties calculated for each aquifer unit within the Gulf Coast Aquifer System.
Table 4.9. Hydraulic properties for the Gulf Coast Aquifer System.
x 104 2.1 x 10³ – 1.5 x 10⁴ 1.1 x 10³ – 3.5 x 10⁷ 2, 3, 4, 5
Storativity 0.4 x 10⁻⁴ –
0.1 5.0 x 10⁻⁴ – 0.1 3.8 x 10⁻⁴ – 0.2 2, 3, 4, 5
References. (1) Ryder (1988); (2) Carr and others (1983); (3) Wesselman (1967); (4) Baker Jr. and others (1986); (5) Strom and others (2003)
Hydraulic Heads
The Gulf Coast Aquifer System groundwater system is separated into three zones: shallow, intermediate, and deep. Shallow zones are located in the northern parts of the aquifer and are associated with outcrop areas. The intermediate and deep zones are associated with the subcrop region and transition from semiconfined to confined conditions whereas shallow zones are usually defined as water-table conditions (Kasmarek and Robinson, 2004).
Within the Gulf Coast Aquifer System there are hydraulic trends separated into local, regional, and intermediate flow systems (Johnston, 1999). Local flow consists of short paths going from topographically high areas where recharge occurs to low areas of discharge. Regional groundwater flow patterns begin in areas of recharge going through deep zones to the downgradient discharge areas. Intermediate flow begins in the recharge zone moving through transitional zones to discharge areas in the downgradient limits of the aquifer.
Groundwater Pumping
Groundwater development within the Gulf Coast Aquifer System began initially with the construction of shallow wells in the early 1900s and increased almost exponentially due to industrial development and population growth. Peak groundwater production exceeded 1.1 billion gallons per day in the late 1970s and early 1980s (Kasmarek and Robinson, 2004). The large pumping volumes resulted in significant head declines and subsequent land subsidence in the Houston area. The Texas Legislature created the Harris-Galveston Subsidence District in 1975 and water management strategies were put in place to combat water level decline and land subsidence.
Figure 4.21 provides a graph of the historic pumping volumes from the Gulf Coast Aquifer System in the municipal, manufacturing, mining, and steam/electricity production,
Final Report: Identification of the Vulnerability of the Major and Minor Aquifers of Texas to Subsidence with Regard to Groundwater Pumping – TWDB Contract Number 1648302062
4-38
irrigation, and livestock sectors from 1980 to 2015. Overall, groundwater pumping volumes have decreased by approximately 42% in the Gulf Coast Aquifer System since 1998; with the largest reduction from the municipal sector. Much of the reduction is due to the implementation of groundwater reduction requirements enforced by the subsidence districts.
Figure 4.21. Historic pumping volumes from the Gulf Coast Aquifer System in the municipal, manufacturing, mining, and steam/electricity production, irrigation, and livestock sectors from 1980 to 2015 (TWDB, 2017b).
Final Report: Identification of the Vulnerability of the Major and Minor Aquifers of Texas to Subsidence with Regard to Groundwater Pumping – TWDB Contract Number 1648302062
4-39
Subsidence Vulnerability
Clay thickness within the Gulf Coast Aquifer System is generally larger than most aquifers within the State of Texas. There are three zones within the Gulf Coast Aquifer System where clay thicknesses typically exceed 300 feet (SRV = 5) marked by the downdip confined zones of the Jasper, Evangeline and Chicot aquifers (northwest to southeast). Figure 4.22 provides the clay thickness at well locations and the regional distribution of the thicknesses.
Figure 4.22. Calculated Gulf Coast Aquifer System clay thickness at well locations.
Final Report: Identification of the Vulnerability of the Major and Minor Aquifers of Texas to Subsidence with Regard to Groundwater Pumping – TWDB Contract Number 1648302062
4-40
From the northwest moving southeast there are three distinct bands of clay thickness going from low clay thickness (less than 100 feet) to high clay thickness (more than 300 feet) which are associated with the Jasper (furthest northwest), Evangeline (middle of aquifer) and Chicot (furthest southeast) aquifers. Within each aquifer, clay thickness gradationally increases from the unconfined to the confined zone. The lithology of the Gulf Coast Aquifer System is predominantly composed of unconsolidated marine to non-marine and fluvial deltaic clastics composed of heterogeneous sequences of sands, silts, clays, and gravels (Kasmarek and Robinson, 2004). The clay layers within each of the three aquifers is characterized as an easily deformed plastic clay (SRV = 3).
Water levels within the Gulf Coast Aquifer System are generally declining although unconfined portions of the aquifer are stable. The largest changes in the potentiometric surface have occurred in the central portion of the aquifer within the Houston area. Substantial and concentrated withdrawals of groundwater from the Evangeline and Chicot aquifers within the Houston area resulted in as much as 350 feet and 250 feet of water level decline, respectively in the Evangeline and Chicot aquifers (Gabrysch, 1979). The declines in potentiometric surface have caused a depressurization of the aquifer releasing water slowly over time from the clay layers. The dewatering of these clay layers occurs slowly over time causing the reorientation of the clay grains perpendicular to the vertical load causing compaction and subsidence (Kasmarek, 2013).
The Gulf Coast Aquifer System is modeled using three GAM models (northern, central, and southern). Since the aquifer is covered by three GAMs, we decided to create a single dataset for extracting necessary values to wells. We extracted the required MODFLOW head arrays from the simulation results and converted the arrays to grid files using the program REAL2SRF (Watermark Numerical Computing, 2015). We then used the Mosaic to New Raster tool within ArcGIS to combine the three grids into a single dataset using the minimum of the results in the areas where the models overlap. The disparities in water levels along the boundaries in the single dataset are inconsequential to the evaluation results as these disparities would also exist in the three separate datasets.
For evaluation purposes we assumed a preconsolidation in the aquifer from stress period 27, time step 5 of the northern GAM (Kasmarek, 2013), stress period 2, time step 20 of the central GAM (Chowdhury and others, 2004), and stress period 2, time step 1 of the southern GAM (Chowdhury and Mace, 2003) which correlate to the end of 1980. We assigned static water levels as stress period 85, time step 4 of the northern GAM MAG run (Wade, 2016), stress period 18, time step 6 of the central GAM MAG run (Goswami, 2017b), and stress period 17, time step 1 of the southern GAM MAG run (Goswami, 2017c) which correlate to the end of 2016. Water level trends were evaluated using the simulated water levels from the three GAM MAG runs. Table 4.10 summarizes the data sources and values for each subsidence risk factor.
Final Report: Identification of the Vulnerability of the Major and Minor Aquifers of Texas to Subsidence with Regard to Groundwater Pumping – TWDB Contract Number 1648302062
4-41
Table 4.10. Gulf Coast subsidence risk factor data sources and summary.
Subsidence Risk Factor Variable Data Source Value
3rd Quartile SRV
Clay Layer Thickness and Extent
SDR lithology table 1.4 to 3,645 feet 2
Clay Compressibility Estimated based on lithology Plastic Clay 3
Aquifer Lithology Kasmarek and Robinson (2004) Unconsolidated
Clastic 4
Preconsolidation Characterization
Preconsolidation and static water level from transient model calibration and final MAG
simulations
-353 to 798 feet mean sea level
3
Predicted Water Level Decline based on Trend
Trend in simulated water levels – Northern GAM: 1981 – 2021 (Wade,
2016); Central GAM: 2000 – 2020 (Goswami, 2017b); Southern GAM:
2000 – 2020 (Goswami, 2017c)
Less than 1-foot decline
2
Predicted DFC Water Level Decline
Difference in head as described in final MAG simulations
Average 28 feet decline
2
Results of the assessment suggest that the confined zones of the Jasper, Evangeline, and Chicot aquifers exhibit the highest risk for future subsidence due to pumping. The unconfined zones of these aquifers have a lower risk of subsidence due primarily to the lower clay thicknesses. Figure 4.23 illustrates the risk factor for the Gulf Coast Aquifer System.
Final Report: Identification of the Vulnerability of the Major and Minor Aquifers of Texas to Subsidence with Regard to Groundwater Pumping – TWDB Contract Number 1648302062
4-42
Figure 4.23. Gulf Coast Aquifer System subsidence risk vulnerability at well locations.
Final Report: Identification of the Vulnerability of the Major and Minor Aquifers of Texas to Subsidence with Regard to Groundwater Pumping – TWDB Contract Number 1648302062
4-43
4.2.5 Hueco–Mesilla Bolsons
The Hueco-Mesilla Bolsons Aquifer is located in far west Texas. It is a basin fill aquifer that is the primary source of municipal water for the El Paso area and surrounding counties. The aquifer is composed of basin fill clay, silt, sand, and gravel in two separate basins, the Hueco Bolson Basin and Mesilla Bolson Basin as shown in Figure 4.24 (George and others, 2011). The aquifer shown in Figure 4.24 is how it is defined in Texas. The geologic units for the aquifer extend to New Mexico and Mexico, however, potential subsidence impacts from aquifer pumping outside Texas (if any) were not addressed in this project.
Final Report: Identification of the Vulnerability of the Major and Minor Aquifers of Texas to Subsidence with Regard to Groundwater Pumping – TWDB Contract Number 1648302062
4-44
Hydrostratigraphy
The Rio Grande Rift and corresponding series of normal block faulting resulting in down dropped basins caused the deposition of the thick basin fill deposits forming the aquifer. The basin is bounded to the east by Precambrian and Tertiary rocks and to the southwest by Cretaceous age sediments (Ashworth, 1990). These boundaries are the source of the sediments which form the basin fill deposits of the aquifer. The basin is underlain by semi-permeable Paleogene volcanics (Sheng and others, 2001). Figure 4.25 shows a cross-section of the aquifer and associated geologic units.
The Hueco Bolson is composed of up to 9,000 feet of relatively young basin fill deposits (George and others, 2011). The upper deposits are higher energy fluvial stream deposits composed of silt, sand, and gravel. The lower deposits are lower energy lacustrine deposits composed of silts and clays (Ashworth, 1990). Recent alluvial deposits overlay the Hueco Bolson deposits.
The Mesilla Bolson is composed of up to 2,000 feet of relatively young basin fill deposits (George and others, 2011). The higher deposits tend to be higher energy and composed of coarser grained materials. Lower energy deposits are found lower in the basin fill and the gradation of the materials tend to get finer with depth with increased amounts of silt and clay (Hawley and others, 2001). Recent alluvial deposits, including the Rio Grande Alluvial Aquifer, overlay the Mesilla Bolson deposits.
Hydraulic Properties
For the Hueco Bolson, Heywood and Yager (2003) estimated the hydraulic conductivity of the aquifer from analysis of 85 pumping tests. The evaluated aquifer tests were concentrated in productive areas of the aquifer and are likely not representative of the lowest end of the aquifer hydraulic conductivity. The hydraulic conductivity estimated varied between approximately 0.3 and 15 feet per day. Vertical hydraulic conductivity was assumed to be controlled by clay beds and estimated to be between approximately 2x10⁻³ and 6x10⁻³ feet per day. Heywood and Yager (2003) estimated the specific yield of the aquifer through model calibration to be between 0.1 and 0.2.
Hawley and others (2001) used pumping test results to estimate the transmissivity of the Mesilla Bolson Aquifer. Results indicated the transmissivity is between 10,900 and 40,000 square feet per day. The results also indicated the average horizontal hydraulic conductivity is approximately 67 feet per day.
Hydraulic Heads
The Hueco-Mesilla Bolson Aquifer generally acts as an unconfined or leaky confined aquifer. The Hueco Bolson and Mesilla Bolson are hydraulically separated. Groundwater does not flow between the two basins despite them being grouped as a single aquifer. The depth to groundwater in the Hueco Bolson is typically under 100 feet in areas of little to no pumping and up to 350 feet in areas of pumping. Gradients in the aquifer are controlled primarily by drawdown from pumping and are directed towards areas of withdrawal
Final Report: Identification of the Vulnerability of the Major and Minor Aquifers of Texas to Subsidence with Regard to Groundwater Pumping – TWDB Contract Number 1648302062
4-45
(Ashworth, 1990). According to the groundwater model developed by Heywood and Yager (2003), there is a gentle regional gradient directed to the south.
The depth to water in the Mesilla Bolson is typically under 15 feet, but is lower in areas of pumping. Gradients in the aquifer are generally controlled by the Rio Grande River and other surface water bodies. Modeling results indicate that gradients in the aquifer fluctuate with the irrigation seasons and steep gradients form around production centers during periods of high demand (CH2MHILL, 2002).
Figure 4.25. Geologic cross-section of the Hueco-Mesilla Bolsons Aquifer and associated geologic units. Modified from George and others (2011).
Groundwater Pumping
The primary use of water from Hueco-Mesilla Bolson Aquifer is public use with over 90 percent going to municipal supply (George and others, 2011). Pumping from the aquifer within Texas amounted to about 69,000 acre-feet in 1999 (Sheng and others, 2001). The pumping from the aquifer caused water level declines are in excess of 100 feet in areas of high withdrawals (Ashworth, 1990). However, since the 1980s the water levels have stabilized (George and others, 2011).
Final Report: Identification of the Vulnerability of the Major and Minor Aquifers of Texas to Subsidence with Regard to Groundwater Pumping – TWDB Contract Number 1648302062
4-46
Figure 4.26 provides a graph of the historic pumping volumes from the Hueco-Mesilla Bolson Aquifer in the municipal, manufacturing, mining, and steam/electricity production, irrigation, and livestock sectors from 1980 to 2015. Pumping rates generally declined from 1989 until 2007. Since 2007 the pumping from the aquifer has increased from about 60,000 acre-feet to over 100,000 acre-feet in 2015.
Figure 4.26. Historic pumping volumes from the Hueco-Mesilla Bolson Aquifer in the municipal, manufacturing, mining, and steam/electricity production, irrigation, and livestock sectors from 1980 to 2015 (TWDB, 2017b).
Final Report: Identification of the Vulnerability of the Major and Minor Aquifers of Texas to Subsidence with Regard to Groundwater Pumping – TWDB Contract Number 1648302062
4-47
Subsidence Vulnerability
Clay thickness within the Hueco-Mesilla Bolsons Aquifer is generally less than 25 feet with thicker clays observed in wells on the east side of El Paso. In the area to the east of El Paso the maximum calculated clay thickness is more than 1,100 feet. However, due to most of the wells having a relatively thin clay thickness the average SRV is 1.4 with a third quartile of 2. Figure 4.27 provides the clay thickness at well locations and the regional distribution of the thicknesses.
Figure 4.27. Calculated Hueco-Mesilla Bolsons Aquifer clay thickness at well locations.
Final Report: Identification of the Vulnerability of the Major and Minor Aquifers of Texas to Subsidence with Regard to Groundwater Pumping – TWDB Contract Number 1648302062
4-48
The lithology of the Hueco-Mesilla Bolsons is described as unconsolidated clastic material. Based on the work of Heywood (1995a), we categorized the clay in the Hueco-Mesilla Bolsons Aquifer as plastic clay.
For our evaluation we used measured water level data from the Texas Water Development Board Groundwater Database (2017a) instead of the local flow model. For wells without any measurements, the nearest measurement was used with water level trends based upon available measurements. Preconsolidation and static water levels were based upon the minimum water level and the most recent water level, respectively resulting in a SRV of 3. Table 4.11 summarizes the data sources and values for each subsidence risk factor.
Table 4.11. Hueco-Mesilla Bolsons subsidence risk factor data sources and summary.
Results of the assessment suggest that the Hueco-Mesilla Bolsons has a medium risk for future subsidence due to pumping in most of the area. However, near El Paso the risk is higher which correlates with the measured subsidence in the area (Heywood, 1995b; Heywood, 1995a; Heywood, 2003). Figure 4.28 illustrates the subsidence risk factors throughout the aquifer.
Final Report: Identification of the Vulnerability of the Major and Minor Aquifers of Texas to Subsidence with Regard to Groundwater Pumping – TWDB Contract Number 1648302062
4-49
Figure 4.28. Hueco-Mesilla Bolsons Aquifer subsidence risk vulnerability at well locations.
Final Report: Identification of the Vulnerability of the Major and Minor Aquifers of Texas to Subsidence with Regard to Groundwater Pumping – TWDB Contract Number 1648302062
4-50
4.2.6 Ogallala
The Ogallala is the largest aquifer in the United States extending from the Texas Panhandle up into southern South Dakota. In Texas, the aquifer is used primarily for irrigation and water level declines over the last 50 to 60 years associated with the irrigation pumping are more than 300 feet in many areas (George and others, 2011). Figure 4.29 illustrates the extent of the aquifer in Texas.
Figure 4.29. Ogallala Aquifer extent.
Final Report: Identification of the Vulnerability of the Major and Minor Aquifers of Texas to Subsidence with Regard to Groundwater Pumping – TWDB Contract Number 1648302062
4-51
Hydrostratigraphy
The Laramide Orogeny caused the formation of the Rocky Mountains and eastward tilting of the geologic formations in the area. Streams flowing over the formations incised valleys into the existing formations. The Ogallala Formation was then deposited unconformably upon these weathered formations (Deeds and others, 2015).
Deeds and others (2015) discuss that sand and gravel typically compose the base of the Ogallala while sand and clay are more common in the upper portions. The coarse-grained deposits near the base are commonly unconsolidated. There is less gravel and more sand and clay in the middle portions of the Ogallala. The upper Ogallala is characterized as a heterogeneous mixture of sand, silt, and clay.
In the northwest part of the Texas Panhandle, the Ogallala overlies the Rita Blanca Aquifer. Elsewhere, the Ogallala overlies the Dockum Aquifer and in portions of western Texas, the Edwards-Trinity (High Plains). Figure 4.30 is a cross-section from Deeds and others (2015) illustrating the relationship of the Ogallala and other underlying aquifers.
Figure 4.30. Cross-section illustrating the configuration of aquifers associated with the Ogallala (Deeds and others, 2015).
Hydraulic Properties
Deeds and others (2015) compiled information from previous modeling efforts and included newly available hydraulic property data from wells completed and tested subsequent to the previous studies. Generally, the results of the evaluation did not alter the overall range of hydraulic conductivity values for the aquifer. For the southern portion of the aquifer, the reported geometric mean of hydraulic conductivity is 6.8 feet per day and it is 14.8 feet per day for the northern portion of the aquifer (Deeds and others, 2015).
Hydraulic Heads
Pre-development water levels in the aquifer generally followed land surface topography with flow from the northwest to the southeast. While most portions of the aquifer have
Final Report: Identification of the Vulnerability of the Major and Minor Aquifers of Texas to Subsidence with Regard to Groundwater Pumping – TWDB Contract Number 1648302062
4-52
exhibited declines associated with irrigation pumping, there are some areas, primarily in the southern portion of the aquifer, where a water level rise has been observed. Despite the declines in water level, the general direction of flow has remained from northwest to the southeast (Deeds and others, 2015).
Groundwater Pumping
Most of the water wells pumping from the Ogallala Aquifer are for irrigation purposes. Figure 4.31 provides a graph of the historic pumping volumes from the Ogallala Aquifer in the municipal, manufacturing, mining, and steam/electricity production, irrigation, and livestock sectors from 1980 to 2015. Overall, the pumping demand was relatively constant from 1993 through 2012. However, by 2015 irrigation pumping had declined by more than 2,000,000 acre-feet from 2012 levels.
Figure 4.31. Historic pumping volumes from the Ogallala Aquifer in the municipal, manufacturing, mining, and steam/electricity production, irrigation, and livestock sectors from 1980 to 2015 (TWDB, 2017b).
Final Report: Identification of the Vulnerability of the Major and Minor Aquifers of Texas to Subsidence with Regard to Groundwater Pumping – TWDB Contract Number 1648302062
4-53
Subsidence Vulnerability
Saturated clay thickness in the Ogallala is greatest in the northern panhandle with values in much of the area exceeding 100 feet (SRV = 3). In the central and southern portions of the aquifer the clay thickness is typically less than 100 feet (SRV = 2). Figure 4.32 illustrates the saturated clay thickness at SDR well locations and regional distribution of the thicknesses.
Figure 4.32. Calculated Ogallala Aquifer clay thickness at well locations.
The lithology of the Ogallala is primarily unconsolidated to semiconsolidated clastic material (SRV = 4). The aquifer consists of detrital material ranging in size from clay to
Final Report: Identification of the Vulnerability of the Major and Minor Aquifers of Texas to Subsidence with Regard to Groundwater Pumping – TWDB Contract Number 1648302062
4-54
gravel (George and others, 2011). Results from analyses of playa-lake water contain clay minerals that are dominantly montmorillonite (Brown and Keys, 1985) suggesting the clays within the upper Ogallala are plastic and easily deformed (SRV = 3); however, clays in the upper portions of the aquifer are typically unsaturated. Based on the lithology and hydrostratigraphy of the aquifer, we set the overall clay type for the aquifer as stiff.
Water levels throughout the aquifer are generally declining (George and others, 2011). Though there are some areas with small recovery, for evaluation purposes we assumed a preconsolidation and static water level in the aquifer equivalent to the results for 2017 from the MAG simulations (Goswami, 2017a; Shi, 2017a) resulting in a SRV of 3 throughout the aquifer. We determined the water level trend using the simulated water levels from 1980 through 2012 from calibrated High Plains Aquifer System GAM (Deeds and Jigmond, 2015) and the predicted DFC water level decline as the difference in head for 2062 from initial head from final MAG simulations (Goswami, 2017a; Shi, 2017a). Predicted water level changes are variable ranging from a rise of more than 50 feet to declines of more than 200 feet. Table 4.12 summarizes the data sources and values for each subsidence risk factor.
Table 4.12. Ogallala subsidence risk factor data sources and summary.
Subsidence Risk Factor Variable Data Source Value
3rd Quartile SRV
Clay Layer Thickness and Extent
SDR lithology table 0 to 560 feet 2
Clay Compressibility Estimated based on lithology Plastic Clay 2
Aquifer Lithology George and others (2011) Unconsolidated
Clastic 4
Preconsolidation Characterization
Preconsolidation and static water level: Head for 2017 from final
Modeled Available Groundwater simulation
2,116 to 4,474 feet mean sea level
3
Predicted Water Level Decline based on Trend
Trend in simulated water levels from 1980 through 2012 from calibrated High Plains Aquifer
System GAM
Average 43 feet decline
3
Predicted DFC Water Level Decline
Difference in head for 2062 from initial head from final Modeled
Available Groundwater simulation
Average 35 feet decline
2
Results of the assessment suggest that the northern part of the Ogallala has the greatest risk for future subsidence due to pumping. As Figure 4.33 illustrates, data from wells in the northern Ogallala tend to show a medium to high subsidence risk. The central and southern portions of the aquifer are at a lower risk with a medium subsidence risk.
Final Report: Identification of the Vulnerability of the Major and Minor Aquifers of Texas to Subsidence with Regard to Groundwater Pumping – TWDB Contract Number 1648302062
4-55
Figure 4.33. Ogallala Aquifer subsidence risk vulnerability at well locations.
Final Report: Identification of the Vulnerability of the Major and Minor Aquifers of Texas to Subsidence with Regard to Groundwater Pumping – TWDB Contract Number 1648302062
4-56
4.2.7 Pecos Valley
The Pecos Valley Aquifer is a thick deposit of tertiary and quaternary alluvial sediments that fill deep solution collapse troughs in northwest Texas. There are two primary troughs, the Pecos River and Monument Draw troughs, which form the most productive areas of the aquifer. The troughs trend northwest to southeast and are up to approximately 1,500 to 1,700 feet deep (George and others, 2011; Meyer and others, 2012). Figure 4.34 illustrates the extent of the Pecos Valley Aquifer.
Figure 4.34. Pecos Valley Aquifer extent.
Final Report: Identification of the Vulnerability of the Major and Minor Aquifers of Texas to Subsidence with Regard to Groundwater Pumping – TWDB Contract Number 1648302062
4-57
Hydrostratigraphy
The Pecos Valley Aquifer is formed of two solution collapse troughs that were infilled by tertiary and quaternary alluvial deposits. These alluvial deposits form the water bearing strata of the Pecos Valley Aquifer. The cross section of the aquifer presented on Figure 4.35 highlights the structure of the aquifer forming troughs. The compositions of the alluvial deposits are typical of alluvial channels with thin to massive beds of poorly sorted to well sorted sands and gravels interbedded with thin to massive beds of silt and clay.
The deep bedrock units below the Pecos Valley Aquifer area are the Paleozoic Delaware and Permian Basin deposits. During the late Paleozoic the Capitan Reef complex was deposited along the edge of the Delaware basin followed by the evaporites of the Castile Formation which continued filling the basin. Evaporites of the Salado Formation were deposited over the top of the Castile Formation and Capitan Reef Complex. Carbonates, evaporites, and clastic sediments of the Rustler Formation were deposited on top of the Castile Formation followed by deposition of the Dewey Lake Formation (Meyer and others, 2012).
Deposition of the Trinity Group took place during the Cretaceous from the transgression and regression of the sea across central North America. Erosion during the Cenozoic area exposed the older Permian Basin rock units. Volcanic activity then deposited ash-flow tuffs in the area. Following the period of volcanic activity, solution collapse of the Paleozoic evaporites and carbonates resulted in the formation of the Pecos and Monument Draw troughs (Meyer and others, 2012).
Hydraulic Properties
The coarse grained alluvial deposits of the Pecos Valley Aquifer typically have a high hydraulic conductivity and high storativity. In the GAM of the Pecos Valley Alluvium, Anaya and Jones (2009) modeled the aquifer using hydraulic conductivity values ranging between 4 feet per day and 27 feet per day with a geometric mean of 8.6 feet per day. The aquifer transmissivity varied between less than 1 square foot per day and 14,000 square feet per day based on an aquifer saturated thickness between less than 100 feet and 1,400 feet. The storativity of the aquifer ranged from 0.1 to 0.25.
Hydraulic Heads
Areas of significant saturated thickness are generally confined to the Pecos Trough and Monument Draw Trough. The troughs are hydraulically separated by a ridge of high bedrock. The depth to static water level varies between 0 and 355 feet below ground surface (Meyer and others, 2012). Gradients in the troughs are very shallow and generally directed from west to east in the Pecos Trough and north to south in the Monument Draw Trough (Anaya and Jones, 2009). The Pecos River typically acts as a discharge area for groundwater and flow paths are generally toward the river. Groundwater in the Pecos Valley is hydraulically connected to the Santa Rosa Sandstone of the Dockum group and the Edwards-Trinity (Plateau) Aquifer. Anaya and Jones (2009) model the hydraulic gradient from the Edwards-Trinity (Plateau) into the Pecos Valley Aquifer.
Final Report: Identification of the Vulnerability of the Major and Minor Aquifers of Texas to Subsidence with Regard to Groundwater Pumping – TWDB Contract Number 1648302062
4-58
Figure 4.35. Cross section of the Pecos Valley Aquifer highlights the two solution collapse troughs that form the thick deposits of water bearing strata (George and others, 2011).
Final Report: Identification of the Vulnerability of the Major and Minor Aquifers of Texas to Subsidence with Regard to Groundwater Pumping – TWDB Contract Number 1648302062
4-59
Groundwater Pumping
The majority of groundwater pumped, more than 80 percent since 2009, from the aquifer is used for irrigation (TWDB, 2017). As reported by George and others (2011), since groundwater usage declined in the 1970s water levels have remained relatively stable though extraction rates have increased recently for industrial use and subsequently water levels have begun to slowly decline. As shown on Figure 4.36, data from the Texas Water Development Board indicates pumping from the aquifer since 2009 is about 80,000 acre-feet per year.
Figure 4.36. Historic pumping volumes from the Pecos Valley Aquifer in the municipal, manufacturing, mining, and steam/electricity production, irrigation, and livestock sectors from 2000 to 2015 (TWDB, 2017b).
Final Report: Identification of the Vulnerability of the Major and Minor Aquifers of Texas to Subsidence with Regard to Groundwater Pumping – TWDB Contract Number 1648302062
4-60
Subsidence Vulnerability
As expected, clay thickness in the Pecos Valley Aquifer is greatest in the two troughs of the aquifer. However, in many of the wells with low clay thickness, the value is likely skewed toward a lower value due to the depth of the well rather than the actual clay thicknesses within the aquifer. While the maximum reported total clay thickness in the aquifer is over 500 feet, the average SRV based on clay thickness and extent is 1.6 with a third quartile of 2. Figure 4.37 illustrates the clay thickness at SDR well locations and regional distributionof the thicknesses. The lithology of the aquifer is primarily unconsolidated clastic sediments (George and others, 2011) resulting in an average SRV of 4.
Figure 4.37. Calculated Pecos Valley Aquifer clay thickness at well locations.
Final Report: Identification of the Vulnerability of the Major and Minor Aquifers of Texas to Subsidence with Regard to Groundwater Pumping – TWDB Contract Number 1648302062
4-61
For evaluation purposes we assumed a preconsolidation equal to the water level following peak pumping in 1965 (Hutchison and others, 2011). We set the static water level in the aquifer equivalent to the results for the end of the model calibration period. These values resulted in an average preconsolidation SRV of 2.8 with a third quartile of 3.
We determined the water level trend using the simulated water levels from 1980 through 2005 of the transient calibration period for the model (Hutchison and others, 2011) and the predicted DFC water levels from final MAG simulation (Hassan, 2011; Shi, 2012). Predicted water level changes due to the water level trend are highly variable, but average 0.27 feet per year of decline. Table 4.13 summarizes the data sources and values for each subsidence risk factor.
Table 4.13. Pecos Valley Aquifer subsidence risk factor data sources and summary.
Subsidence Risk Factor Variable Data Source Value
3rd Quartile SRV
Clay Layer Thickness and Extent
SDR lithology table 0 to 525 feet 2
Clay Compressibility Estimated based on lithology Plastic Clay 3
Aquifer Lithology George and others (2011) Unconsolidated
Clastic 4
Preconsolidation Characterization
End of 1965 water level from transient model simulations
(Hutchison and others, 2011)
2,223 to 3,144 feet mean sea level
3
Predicted Water Level Decline based on Trend
Trend in simulated water levels from transient model simulations
(Hutchison and others, 2011)
Average 13 feet decline
3
Predicted DFC Water Level Decline
Difference in head from final Modeled Available Groundwater simulations (Hassan, 2011; Shi,
2012)
Average 50 feet decline
3
Results of the assessment suggest that the troughs of the Pecos Valley Aquifer have the greatest risk for future subsidence due to pumping. In particular, the Monument Draw Trough shows a higher subsidence risk which also correlates with the greater number of wells. Figure 4.38 illustrates the calculated subsidence risk for the Pecos Valley Aquifer.
Final Report: Identification of the Vulnerability of the Major and Minor Aquifers of Texas to Subsidence with Regard to Groundwater Pumping – TWDB Contract Number 1648302062
4-62
Figure 4.38. Pecos Valley Aquifer subsidence risk vulnerability at well locations.
Final Report: Identification of the Vulnerability of the Major and Minor Aquifers of Texas to Subsidence with Regard to Groundwater Pumping – TWDB Contract Number 1648302062
4-63
4.2.8 Seymour
The Seymour Aquifer is a major aquifer existing in portions of 25 counties across the Rolling Prairies region of northcentral Texas from the southern Brazos River watershed northward to the border with Oklahoma. Figure 4.39 provides a map showing the aquifer extent. The Seymour Aquifer consists of hydraulically isolated segments of Quaternary-age, alluvial sediments unconformably overlying Permian-age rocks. The thickness of the aquifer units varies from 0 to 360 feet but is usually less than 100 feet (Duffin and Beynon, 1992). The aquifer is used mostly for irrigation purposes with minor pumpage for livestock, domestic, municipal, and industrial use (Ashworth and Hopkins, 1995).
Figure 4.39. Seymour Aquifer extent.
Final Report: Identification of the Vulnerability of the Major and Minor Aquifers of Texas to Subsidence with Regard to Groundwater Pumping – TWDB Contract Number 1648302062
4-64
Hydrostratigraphy
Remnants of the Seymour Formation, the Lingos Formation, and younger alluvial deposits, all of Quaternary age, compose the Seymour Aquifer. All materials forming the Seymour Aquifer are unconsolidated alluvial sediments of non-marine origin deposited on the erosional surface of Permian beds. The periods between the Permian and Quaternary are not recorded in the rock sequence in the study area due predominantly to continental uplift and erosion (Ewing and others, 2004). In general, sediments of the Seymour Aquifer are predominantly material eroded from the High Plains and deposited by eastward moving streams (R.W. Harden & Associates, 1978; Nordstrom, 1991; Duffin and Beynon, 1992). It is likely that the sediments originally blanketed the entire region, but were subsequently eroded by recent streams leaving only remnants of the once continuous deposits (Ogilbee and Osborne Jr., 1962; Preston, 1978; Price, 1978). Table 4.14 provides a chart of the hydrostratigraphic units associated with the Seymour Aquifer and Figure 4.40 provides a conceptualized geologic cross-section of the Seymour Aquifer subsurface from west to east. The westerly dip of the Permian strata depicted in Figure 4.40 is the result of westerly tilting caused by development of the Concho Arch, a major structural feature associated with the Ouachita Orogeny.
Table 4.14. Geologic and hydrostratigraphic column of the sediments in the vicinity of the Seymour Aquifer (Ewing and others, 2004).
Era System Series Group Formation Hydrogeologic
Unit
Cenozoic Quaternary
Pleistocene to Recent alluvium deposits (alluvium, fluviatile terrace, playa, pond, and windblown
Seymour Aquifer
Lingos
Seymour
Tertiary
Not Present
Confining Units Mesozoic
Cretaceous
Jurassic
Triassic
Paleozoic Permian
Ochoa Quartermaster
Guadalupe
Whitehorse
Pease River
Blaine Gypsum Blaine Aquifer
Dog Creek Shale
Confining Units
Flowerpot Shale
San Angelo
Leonard
Clear Fork
Choza
Vale
Arroyo
Wichita (Upper Portion)
Lueders
Clyde
Final Report: Identification of the Vulnerability of the Major and Minor Aquifers of Texas to Subsidence with Regard to Groundwater Pumping – TWDB Contract Number 1648302062
4-65
Figure 4.40. Conceptualized cross-section of the geologic sequence of the Seymour Aquifer and underlying Permian units. Modified from Ewing and others (2004).
Sediments of the Seymour Aquifer are composed of clay, silt, sand, conglomerate, gravel, and some caliche. In general, the sediments are distributed in a “fining upward” sequence, where the upper portion contains beds of fine-grained sand with silt or clay and some caliche and the basal section contains coarse sand and gravel beds in many portions of the aquifer. Individual beds within the Seymour Aquifer are discontinuous and grade laterally into beds of coarser or finer grained material. This variation is due to the uneven erosional surface of the underlying Permian beds. In areas where the aquifer overlies a buried channel, it has a greater thickness and an increased amount of coarse material at its base. Where the aquifer is thin, it consists predominantly of finer-grained material (Ewing and others, 2004).
Permian sediments of the Wichita Group, Clear Fork Group, Pease River Group, Whitehorse Group, and Quartermaster Formation underlie the Seymour Aquifer (see Table 4.14). The foundation for the sediment deposition of the region was established near the end of the Paleozoic Era when uplift and tectonism associated with the Ouachita Orogeny created a mountain range extending from northern Mexico through the present-day Balcones Escarpment and up into the Ouachita Mountains of Oklahoma and Arkansas. This uplift created a flexural depression, known as the Ouachita geosyncline, in which formed a shallow Permian sea, allowing for the deposition of Paleozoic sediments (Barker and Ardis, 1996; Anaya and Jones, 2009). The Permian shallow seas characterized by continued rapid transgression and regression events yielded a thick sequence of relatively thin-bedded deposits of almost every type of depositional environment from shallow-shelf, through deltaic, fluvial, and continental (Preston, 1978). The Permian sediments are characterized
Final Report: Identification of the Vulnerability of the Major and Minor Aquifers of Texas to Subsidence with Regard to Groundwater Pumping – TWDB Contract Number 1648302062
4-66
by a large variety of physiochemical facies which include clastic and calcareous sediments, anhydrite, gypsum, salt, and other evaporites, and non-marine red beds (Ogilbee and Osborne Jr., 1962).
Hydraulic Properties
The fining upward sequence of the Seymour Aquifer results in relatively high permeability where thick sand and gravel layers make up the lower portions of the aquifer. The underlying Permian sediment consists of generally low-permeability rocks with poor water transmitting characteristics. Due to the lack of hydraulic data calculated from field tests, transmissivity and hydraulic conductivity for the aquifer were estimated by utilizing reported specific capacity and saturated thickness data. No estimates of vertical hydraulic conductivity values are available. The stratified nature of sediments will likely result in some degree of anisotropy in hydraulic conductivity. While horizontal hydraulic conductivity is dominated by the higher permeability sediments, vertical hydraulic conductivity will be dominated by the lower permeability strata and will tend to be lower than the horizontal hydraulic conductivity. Table 4.15 provides a summary of the hydraulic properties calculated for each aquifer unit within the Seymour Aquifer.
Table 4.15. Hydraulic properties for the Seymour Aquifer
Aquifer Properties Range References
Hydraulic conductivity (ft/d) 4.3 – 463.4 1, 2 Transmissivity (ft2/d) 1.93 x 10⁴ – 5.99 x 10⁴ 3
The Seymour Aquifer is composed of 15 hydraulically isolated segments of Quaternary sediment. Regional groundwater flow in the Seymour Aquifer under steady-state conditions prior to about 1880 was topographically driven from areas of high topography to areas of low topography along the Brazos River and Lake Creek. In the portion of the Seymour Aquifer located in Baylor County, a groundwater divide oriented west-northwest to east-southeast is present from the Baylor-Knox county line to about the center of the Seymour Aquifer (Preston, 1978). The location of this divide is approximately along the divide between the Red River Basin and Brazos River Basin. Groundwater north of this divide flows to the north and northeast toward seeps and springs along the northern edge of the aquifer and groundwater south of the divide flows to the south and southeast towards the Brazos River. In addition, groundwater in the narrow portion of the aquifer located south of the Brazos River flows northward to the river. The direction of groundwater flow in the Seymour Aquifer in Haskell and southern Knox counties is generally to the northwest, north, and northeast following the slope of the ground surface and the slope of the underlying Permian-age beds. In the very southern portion of the aquifer in Haskell County, groundwater flow is generally to the east and southeast with some flow also to the southwest.
Final Report: Identification of the Vulnerability of the Major and Minor Aquifers of Texas to Subsidence with Regard to Groundwater Pumping – TWDB Contract Number 1648302062
4-67
Predictive groundwater availability modeling based on future estimates of pumping indicates that average water levels are not expected to change by more than several feet in the Seymour Aquifer, with or without a new drought of record (Shi, 2017b). Water levels in localized areas are predicted to decline in the Seymour Aquifer by as much as 30 feet. Actual water level declines have reduced the saturated thickness in some areas.
Groundwater Pumping
The TWDB has compiled historical estimates of groundwater pumping throughout Texas (TWDB, 2017b). Figure 4.41 provides a graph of the historic pumping volumes from the Seymour Aquifer in the municipal, manufacturing, mining, and steam/electricity production, irrigation, and livestock sectors from 1980 to 2015. Overall, the pumping demand has stayed relatively constant since 1980, with average withdrawal volumes of 137,482 acre-feet per year. Irrigation accounts for over 90 percent of all production from the Seymour Aquifer. Future pumping demands are not predicted to significantly increase. The regional water planning groups, in their 2016 Regional Water Plans, recommended several water management strategies that use the Seymour Aquifer, including drilling new wells, over drafting, and constructing a nitrate removal plant in Wilbarger County.
Figure 4.41. Historic pumping volumes from the Seymour Aquifer in the municipal, manufacturing, mining, and steam/electricity production, irrigation, and livestock sectors from 1980 to 2015 (TWDB, 2017b).
Final Report: Identification of the Vulnerability of the Major and Minor Aquifers of Texas to Subsidence with Regard to Groundwater Pumping – TWDB Contract Number 1648302062
4-68
Subsidence Vulnerability
Clay thickness in the Seymour Aquifer is less than 100 feet throughout the aquifer. The maximum reported total clay thickness in the aquifer is 59 feet resulting in an average SRV based on clay thickness and extent of 1.5 with a third quartile of 2. Figure 4.42 illustrates the clay thickness at SDR well locations and the regional distribution of the thicknesses. The lithology of the aquifer is primarily unconsolidated clastic alluvial sediments (George and others, 2011) resulting in an average SRV of 4.
Figure 4.42. Calculated Seymour Aquifer clay thickness at well locations.
Final Report: Identification of the Vulnerability of the Major and Minor Aquifers of Texas to Subsidence with Regard to Groundwater Pumping – TWDB Contract Number 1648302062
4-69
For evaluation purposes we assumed a preconsolidation equal to the lowest water level from the transient GAM (Ewing and others, 2004). We set the static water level in the aquifer equivalent to the results for 2017 from the MAG run for Groundwater Management Area 6 (Shi, 2017b). These values resulted in an average preconsolidation SRV of 2.9.
We determined the water level trend using the simulated water levels from the transient calibration period for the model (Ewing and others, 2004) and the predicted DFC water levels from final MAG simulation (Shi, 2017b). Predicted water level changes due to the water level trend show essentially no change in water levels over a 50-year period. Table 4.16 summarizes the data sources and values for each subsidence risk factor.
Table 4.16. Seymour Aquifer subsidence risk factor data sources and summary.
Subsidence Risk Factor Variable Data Source Value
3rd Quartile SRV
Clay Layer Thickness and Extent
SDR lithology table 0 to 59 feet 2
Clay Compressibility Estimated based on lithology Hard Clay 1
Aquifer Lithology George and others (2011) Unconsolidated
Clastic 4
Preconsolidation Characterization
Minimum water level from transient model simulations (Ewing
and others, 2004)
874 to 2,442 feet mean sea level
3
Predicted Water Level Decline based on Trend
Trend in simulated water levels from transient model simulations
(Ewing and others, 2004)
Less than 1-foot decline
2
Predicted DFC Water Level Decline
Difference in head from final Modeled Available Groundwater
simulations (Shi, 2017b) Average 7 feet rise 1
Results of the assessment suggest that the aquifer has generally low risk for future subsidence due to pumping. Figure 4.43 illustrates the calculated subsidence risk for the Seymour Aquifer.
Final Report: Identification of the Vulnerability of the Major and Minor Aquifers of Texas to Subsidence with Regard to Groundwater Pumping – TWDB Contract Number 1648302062
4-70
Figure 4.43. Seymour Aquifer subsidence risk vulnerability at well locations.
Final Report: Identification of the Vulnerability of the Major and Minor Aquifers of Texas to Subsidence with Regard to Groundwater Pumping – TWDB Contract Number 1648302062
4-71
4.2.9 Trinity
The Trinity Aquifer is a major aquifer that extends across central and northeastern Texas. The northern portion of the Trinity Aquifer is a major water resource for a large portion of north-central Texas including the growing population centers along the Interstate 35 corridor from the Dallas-Fort Worth Metroplex to Austin. Figure 4.44 provides a map showing the aquifer extent. This aquifer is one of the most extensive and highly used groundwater resources in Texas. Although its primary use is for municipal purposes, it is also used for livestock, irrigation, and other domestic purposes.
Figure 4.44. Trinity Aquifer extent.
Northern Trinity
Hill Country Trinity
Final Report: Identification of the Vulnerability of the Major and Minor Aquifers of Texas to Subsidence with Regard to Groundwater Pumping – TWDB Contract Number 1648302062
4-72
Hydrostratigraphy
The Trinity Aquifer is composed of smaller aquifers that are named differently in different parts of the state. The Trinity Group is composed of the Antlers, Glen Rose, Paluxy, Twin Mountains, Travis Peak, Hensell, and Hosston aquifers. The aquifer consists of limestones, sands, clays, gravels, and conglomerates.
As discussed by Kelley and others (2014), the northern Trinity Aquifer is sandstone-dominated in the northwest, where it is locally referred to as the Antlers Aquifer. Elsewhere, limestones of the Glen Rose Formation separate the lower portion of the northern Trinity Aquifer (namely, sandstones of the Hosston and Hensell aquifers and the Pearsall Formation) from the sandstones in the upper portion of the northern Trinity Aquifer (namely, the Paluxy Aquifer). Sandstones in the Woodbine Aquifer are separated from the underlying northern Trinity Aquifer by limestones and shales in the Washita/and Fredericksburg groups. The Hosston Aquifer, which is the stratigraphically lowest sandstone layer, is the most widespread and best developed aquifer in the system. The Hosston Aquifer includes greater net sandstone and thicker individual sandstones than any other layer. The Hensell Aquifer is well developed in western portions of the study area, but thins and becomes increasingly shale dominated to the east. The Pearsall and Glen Rose formations include sandstones only in the north. The Paluxy Aquifer is dominated by thick sandstones across broad areas, where it rivals the Hosston Aquifer, but thins across the southern one-third of the study area. The Woodbine Aquifer includes thick sandstones in the east-central and northeastern portions of the study area. Figure 4.45 illustrates the geologic units of the northern portion of the Trinity.
As discussed by Jones and others (2011), the Hill Country portion of the Trinity Aquifer system comprises sediments of the Trinity Group and is divided into lower, middle, and upper aquifers on the basis of hydraulic characteristics of the sediments. The Lower Trinity Aquifer consists of the Hosston (and the Sycamore Sand in outcrop) and Sligo formations; the Middle Trinity Aquifer consists of the Cow Creek Limestone, the Hensell Sand, and the lower member of the Glen Rose Limestone; and the Upper Trinity Aquifer consists of the upper member of the Glen Rose Limestone. Low-permeability sediments throughout the upper member of the Glen Rose Limestone separate the Middle and Upper Trinity aquifers. The Lower and Middle Trinity aquifers are separated by the low-permeability Hammett Shale. Figure 4.46 illustrates the geologic units of the Hill Country portion of the Trinity.
Final Report: Identification of the Vulnerability of the Major and Minor Aquifers of Texas to Subsidence with Regard to Groundwater Pumping – TWDB Contract Number 1648302062
4-73
Figure 4.45. Conceptualized cross-section of the geologic sequence of the northern portion of the Trinity Aquifer (Kelley and others, 2014).
Final Report: Identification of the Vulnerability of the Major and Minor Aquifers of Texas to Subsidence with Regard to Groundwater Pumping – TWDB Contract Number 1648302062
4-74
Figure 4.46. Conceptualized cross-section of the geologic sequence of the Hill Country portion of the Trinity Aquifer (Jones and others, 2011).
Final Report: Identification of the Vulnerability of the Major and Minor Aquifers of Texas to Subsidence with Regard to Groundwater Pumping – TWDB Contract Number 1648302062
4-75
Hydraulic Properties
Extensive studies have been conducted on the hydraulic properties of the Trinity Aquifer (Jones and others, 2011; Kelley and others, 2014). Across the aquifer, the hydraulic properties can vary greatly. In many parts of the system, the properties may vary over relatively short distances due to fractures and dissolution features. Table 4.17 provides a summary of the hydraulic properties calculated for the Trinity Aquifer.
Table 4.17. Hydraulic properties for the Trinity Aquifer.
Aquifer Properties Northern Portion* Hill Country Portion References
Storativity 1.0 x 10⁻⁶ – 3.0 x 10⁻³ 1.0 x 10⁻⁵ – 1.0 x 10⁻³ 2 * Excludes values for shale References. (1) Kelley and others (2014); (2) Jones and others (2011)
Hydraulic Heads
Generally, groundwater will flow from the outcrop areas of the aquifer to the west and north where recharge occurs toward the downdip portions of the aquifer. Kelley and others (2014) indicate recharge to the northern portion of the aquifer based on chloride mass balance calculations ranges from 0.03 to 6.4 inches per year. For the Hill Country portion of the Trinity, Jones and others (2011) estimate recharge to be about 72,000 acre-feet per year.
In some parts of the northern Trinity Aquifer, water levels have declined as much as 850 feet (Mace and others, 1994; Kelley and others, 2014). In the Hill Country portion, water levels have generally declined in most areas (Jones and others, 2011). These localized water level declines change the natural downdip flow of groundwater toward the pumping centers.
Groundwater Pumping
Figure 4.47 provides a graph of the historic pumping volumes from the Trinity Aquifer in the municipal, manufacturing, mining, and steam/electricity production, irrigation, and livestock sectors from 1980 to 2015. Overall, the pumping demand has stayed relatively constant since 1980, with average withdrawal volumes of approximately 180,000 acre-feet per year. Municipal production accounts for over half of all production from the Trinity Aquifer. With continued growth in the areas overlying the aquifer, future pumping demands are likely to increase as reflected in the adopted DFC evaluation model run by GMA 8 (Beach and others, 2016).
Final Report: Identification of the Vulnerability of the Major and Minor Aquifers of Texas to Subsidence with Regard to Groundwater Pumping – TWDB Contract Number 1648302062
4-76
Figure 4.47. Historic pumping volumes from the Trinity Aquifer in the municipal, manufacturing, mining, and steam/electricity production, irrigation, and livestock sectors from 1980 to 2015 (TWDB, 2017b).
Final Report: Identification of the Vulnerability of the Major and Minor Aquifers of Texas to Subsidence with Regard to Groundwater Pumping – TWDB Contract Number 1648302062
4-77
Subsidence Vulnerability
Clay thickness in the Trinity is greatest in the downdip areas of the Hill Country portion of the Trinity with values in much of the area exceeding 200 feet. On driller’s logs, marly layers in the Cretaceous units of the Trinity are frequently documented as clays leading to larger than otherwise expected clay thicknesses. The maximum reported total clay thickness in the aquifer is more than 800 feet, but the average SRV based on clay thickness and extent is 2.3 with a third quartile of 3. Figure 4.48 illustrates the clay thickness and regional distribution of the thicknesses. The lithology of the Trinity is primarily carbonate and consolidated clastic material.
Figure 4.48. Calculated Trinity Aquifer clay thickness at well locations.
Final Report: Identification of the Vulnerability of the Major and Minor Aquifers of Texas to Subsidence with Regard to Groundwater Pumping – TWDB Contract Number 1648302062
4-78
Municipal pumping has resulted in water level declines of more than 800 feet in the northern part of the aquifer (Kelley and others, 2014). Though there are some areas with small recovery, we assumed a preconsolidation equal to the water level from the end of the transient calibration period for the GAMs (Jones and others, 2011; Kelley and others, 2014). We also assumed a static water level in the aquifer equivalent to the results for 2017 from the adopted DFC model run for GMA 8 (Beach and others, 2016) and the MAG run for GMA 9 (Jones, 2017). The preconsolidation and static water levels resulted in an average and third quartile SRV of 3 throughout the aquifer.
For the northern portion of the aquifer, we determined the water level trend using the simulated water levels for 1992 through 2012 from the transient calibration period for the GAM (Kelley and others, 2014). For the Hill Country portion, we used the simulated water levels for 1998 through 2017 from the GMA 9 MAG run (Jones, 2017). DFC water levels are from the adopted DFCs for GMA 8 and the GMA 9 MAG run (Beach and others, 2016; Jones, 2017). Table 4.18 summarizes the data sources and values for each subsidence risk factor.
Table 4.18. Trinity Aquifer subsidence risk factor data sources and summary.
Subsidence Risk Factor Variable Data Source Value
3rd Quartile SRV
Clay Layer Thickness and Extent
SDR lithology table 0 to 862 feet 3
Clay Compressibility Estimated based on lithology Hard Clay 1
Aquifer Lithology Jones and others (2011); Kelley and others (2014)
Carbonate/ Consolidated
Clastic 3
Preconsolidation Characterization
Water level from end of transient model simulations (Jones and
others, 2011; Kelley and others, 2014)
-621 to 2,003 feet mean sea level
3
Predicted 50-Year Water Level Decline based on
Trend
Trend in simulated water levels from transient and MAG model simulations (Kelley and others, 2014; Beach and others, 2016;
Jones, 2017)
Average 38 feet decline
3
Predicted DFC Water Level Decline
Difference in head from final DFC and MAG simulations (Beach and
others, 2016; Jones, 2017)
Average 50 feet decline
3
Results of the assessment indicate the downdip (that is, eastern) portions of the aquifer have the greatest risk for future subsidence due to pumping. However, as discussed by Mace and others (1994), land surface subsidence has not been observed despite significant water level declines. Figure 4.49 illustrates the subsidence risk factor throughout the aquifer.
Final Report: Identification of the Vulnerability of the Major and Minor Aquifers of Texas to Subsidence with Regard to Groundwater Pumping – TWDB Contract Number 1648302062
4-79
Figure 4.49. Trinity Aquifer subsidence risk vulnerability at well locations.
Final Report: Identification of the Vulnerability of the Major and Minor Aquifers of Texas to Subsidence with Regard to Groundwater Pumping – TWDB Contract Number 1648302062
4-80
4.3 Minor Aquifers
The Texas Water Development Board currently delineates 21 minor aquifers in Texas. These minor aquifers are defined as aquifers that produce minor amounts of water over large areas or large amounts of water over small areas (George and others, 2011). Figure 4.50 illustrates the 21 minor aquifers we assessed for vulnerability to subsidence with regard to groundwater pumping.
Figure 4.50. Minor aquifers in Texas.
Final Report: Identification of the Vulnerability of the Major and Minor Aquifers of Texas to Subsidence with Regard to Groundwater Pumping – TWDB Contract Number 1648302062
4-81
4.3.1 Blaine
The Blaine Aquifer System is a minor aquifer located at the east end of the High Plains in North Texas. It is predominantly a karst aquifer, where the aquifer permeability is the result of dissolution collapse and the disruption of soluble evaporite beds. Groundwater from the Blaine Aquifer System is used for livestock and for irrigation of crops that are highly tolerant of salt (George and others, 2011). Figure 4.51 is a map showing the aquifer extent.
Figure 4.51. Blaine Aquifer extent.
Final Report: Identification of the Vulnerability of the Major and Minor Aquifers of Texas to Subsidence with Regard to Groundwater Pumping – TWDB Contract Number 1648302062
4-82
Hydrostratigraphy
The Blaine Aquifer is part of the Pease River Group (see Table 4.19) deposited approximately 300 to 250 million years ago during the Permian Period of the Paleozoic Era (Ewing and others, 2004). The aquifer matrix is comprised of Permian-age sedimentary rocks of the Whitehorse Group and Blaine Formation with the overlying Quartermaster Red Beds and underlying Flowerpot Shale functioning as the upper and lower confining units, respectively. The Blaine Aquifer is composed primarily of red silty shale and sandstone or dolomite interbedded with gypsum, halite, and anhydrite. The evaporite layers may range from 10 to 30 feet thick. Regionally, the formation is as much as 1,200 feet thick (LBG-Guyton Associates, 2003).
Deposition of red beds (sedimentary layers colored red owing to the presence of iron oxides) and evaporites (sedimentary rocks such as gypsum and halite that form as water evaporates from a lake or ocean) occurred when much of the southwestern United States was covered by a broad and shallow sea. The gypsum beds, along with minor amounts of dolomite (magnesium-rich limestone), originated from the shallow marine sea. In other areas, non-marine sandstone and mudstone (or shale) were deposited as stream and river sediments (Ewing and others, 2004). After deposition of sediments during the Late Permian and Triassic Periods, the area was elevated and extensively eroded (Gould, 1906).
Table 4.19. Geologic units of the Blaine Aquifer and their water-bearing properties. Modified from Ewing and others (2004)
System Group Geologic Units Water Bearing Properties
Quaternary Alluvium Yields small to large quantities of fresh to saline water,
depending on local thickness and quality of water in adjacent formations. Uses: domestic, irrigation, and public supply Seymour
Tertiary
Geologic units not present Cretaceous
Jurassic
Triassic
Permian
Quartermaster
Whitehorse Yields small to moderate amounts of fresh to saline water.
Pease River
Dog Creek Shale Yields small amounts of slightly to moderately saline water
Blaine Gypsum Yields small to large quantities of fresh to moderately saline water to wells and springs. Use: predominantly for irritation.
Flowerpot Shale Yields small quantities of slightly saline water.
San Angelo Yields fresh to predominantly moderately saline water in small
quantities.
Final Report: Identification of the Vulnerability of the Major and Minor Aquifers of Texas to Subsidence with Regard to Groundwater Pumping – TWDB Contract Number 1648302062
4-83
Hydraulic Properties
Groundwater in the Blaine Aquifer occurs primarily in dissolution channels and caverns within the beds of anhydrite and gypsum. Productivity of a well depends on the number and size of dissolution channels intersected by the wellbore. Because of the irregular distribution of dissolution channels within the formation, well yields in the Blaine Aquifer vary greatly (LBG-Guyton Associates, 2003), making predictions of productivity difficult in nearby wells or across the aquifer. That is, wells having relatively low production rates may be close to wells having higher production rates.
Ewing and others (2004) conducted an analysis of 59 data samples for hydraulic conductivity and found the median value for the Blaine Aquifer to be 16.3 feet per day with a geometric mean of 9.2 feet per day. However, the hydraulic properties vary greatly throughout the aquifer. Table 4.20 provides a summary of the hydraulic properties for the Blaine Aquifer.
Table 4.20. Hydraulic properties for the Blaine Aquifer.
Aquifer Properties Range References
Hydraulic conductivity (ft/d) 0.02 – 1,290 1 Transmissivity (ft2/d) 3.7 x 10³ - 3.5 x 10⁵ 1
Storativity 4.0 x 10⁻⁴ – 1.0 1, 2 References. (1) Finch and others (2016) (2) Ewing and others (2004)
Hydraulic Heads
In general, the groundwater flows to the west toward the down-dip or subcrop portion of the aquifer (Ewing and others, 2004). However, in Hardeman County the direction is reversed and the groundwater flows down-dip to the east (Maderak, 1972). Furthermore, the beds of gypsum and dolomite are relatively impermeable in the subcropping portion of the aquifer. Groundwater movement in the deeper parts of the aquifer is therefore greatly reduced (Maderak, 1972). Groundwater movement is also influenced artificially by pumping wells, resulting in groundwater movement from all directions toward the centers of pumping and localized areas of depression in the water table (Smith, 1970).
Recharge to the Blaine Aquifer is through the infiltration of precipitation on the outcrop. Groundwater then moves downdip predominantly along dissolution channels in the gypsum, anhydrite, and halite beds (LBG-Guyton Associates, 2003). Groundwater discharge occurs in topographically low areas, contaminating rivers and tributaries that flow through the area and producing salt seeps and springs that tend to be very high in total dissolved solids (LBG-Guyton Associates, 2003).
Final Report: Identification of the Vulnerability of the Major and Minor Aquifers of Texas to Subsidence with Regard to Groundwater Pumping – TWDB Contract Number 1648302062
4-84
Groundwater Pumping
Figure 4.52 shows groundwater pumping from the Blaine Aquifer from 1980 to 2015. Overall, the pumping demand has stayed relatively constant from 1980 through 1993 at less than 10,000 acre-feet per year. Since 1993, pumping typically increased with irrigation accounting for over 90 percent of all production from the Blaine Aquifer.
Figure 4.52. Historic pumping volumes from the Blaine Aquifer in the municipal, manufacturing, mining, and steam/electricity production, irrigation, and livestock sectors from 1980 to 2015 (TWDB, 2017b).
Final Report: Identification of the Vulnerability of the Major and Minor Aquifers of Texas to Subsidence with Regard to Groundwater Pumping – TWDB Contract Number 1648302062
4-85
Subsidence Vulnerability
Clay thickness in the Blaine is greatest in the southeastern panhandle with a maximum thickness of 235 feet. Generally, there is very limited amounts of hard clay evident within wells examined in the study area resulting in an average SRV of 1.7 with a third quartile of 2. In the southern portion of the aquifer the clay thickness is typically less than 20 feet.Figure 4.53 illustrates the calculated clay thickness and regional distribution of the thicknesses. The lithology of the Blaine is primarily silty shale, gypsum, anhydrite, salt, and dolomite (SRV = 2).
Figure 4.53. Calculated Blaine Aquifer clay thickness at well locations.
Final Report: Identification of the Vulnerability of the Major and Minor Aquifers of Texas to Subsidence with Regard to Groundwater Pumping – TWDB Contract Number 1648302062
4-86
Water levels throughout the aquifer are generally stable (George and others, 2011). We assumed a preconsolidation level equal to the lowest water level from the transient GAM (Ewing and others, 2004). We set the static water level in the aquifer equivalent to the results for 2017 from the MAG run for Groundwater Management Area 6 (Shi, 2017b). These values resulted in an average preconsolidation SRV of 2.9 with a third quartile of 3.
We determined the water level trend using the simulated water levels from the transient calibration period for the model (Ewing and others, 2004) and the predicted DFC water levels from the final MAG simulation (Shi, 2017b). Predicted water level changes due to the water level trend show essentially no change in water levels over a 50-year period. Table 4.21 summarizes the data sources and values for each subsidence risk factor.
Table 4.21. Blaine Aquifer subsidence risk factor data sources and summary.
Subsidence Risk Factor Variable Data Source Value
3rd Quartile SRV
Clay Layer Thickness and Extent
SDR lithology table 0 to 235 feet 2
Clay Compressibility Estimated based on lithology Hard Clay 1 Aquifer Lithology George and others (2011) Carbonate/Evaporite 2
Preconsolidation Characterization
Minimum water level from transient model simulations
(Ewing and others, 2004)
1,359 to 2,429 feet mean sea level
3
Predicted Water Level Decline based on Trend
Trend in simulated water levels from transient model simulations
(Ewing and others, 2004)
Less than 1-foot decline
2
Predicted DFC Water Level Decline
Difference in head from final Modeled Available Groundwater
simulations (Shi, 2017b)
Average 6 feet decline
2
Results of the assessment suggest that the Blaine Aquifer System has low risk for future subsidence due to pumping. As Figure 4.54 illustrates, data from wells in the Blaine tend to show a generally low subsidence risk factor. However, there is a minor risk of local subsidence due to the dissolution of the aquifer material and subsequent collapse.
Final Report: Identification of the Vulnerability of the Major and Minor Aquifers of Texas to Subsidence with Regard to Groundwater Pumping – TWDB Contract Number 1648302062
4-87
Figure 4.54. Blaine Aquifer subsidence risk vulnerability at well locations.
Final Report: Identification of the Vulnerability of the Major and Minor Aquifers of Texas to Subsidence with Regard to Groundwater Pumping – TWDB Contract Number 1648302062
4-88
4.3.2 Blossom
The Blossom Aquifer spans across Bowie, Red River, and Lamar counties in the northeast corner of Texas. Figure 4.55 provides a map showing the extent of the aquifer’s outcrop and subcrop. The aquifer consists of the Blossom Sand Formation, which is composed of alternating sequences of Cretaceous-aged sand and clay. The majority of the water pumped from the aquifer is used for irrigation purposes with minor pumpage for livestock, domestic, municipal, and industrial use (Nordstrom, 1982).
Figure 4.55. Blossom Aquifer extent.
Final Report: Identification of the Vulnerability of the Major and Minor Aquifers of Texas to Subsidence with Regard to Groundwater Pumping – TWDB Contract Number 1648302062
4-89
Hydrostratigraphy
The Blossom Aquifer outcrops near the Texas-Oklahoma border and dips to the south at approximately 85 feet per mile. In northeast Texas, transgressive seas with occasional regressive periods characterized the Cretaceous Period. During this period, sediments consisting of sandstone, shale, marl, and chalk were deposited unconformably on the underlying rocks (Waters and others, 1955). A major transgression which began with the deposition of the Austin Group proceeded relatively uninterrupted through the end of the Cretaceous.
The Blossom Sand Formation was deposited during minor regressive phases of this Upper Cretaceous transgression on the northern periphery of the East Texas Basin (McLaurin, 1988). The aquifer is vertically bounded by the underlying Bonham Formation and overlying Brownstone Marl. Table 4.22 shows the stratigraphic column for the Quaternary and Cretaceous sediments in the vicinity of the Blossom Aquifer and Figure 4.56 provides a geologic cross section of the Blossom Aquifer from west to east.
The Blossom Sand crops out in a narrow east-west trending belt in Fannin, Lamar, and Red River Counties. The Blossom Sand Formation consists of layers of bluish to light-grayish, fine- to medium-grained, unconsolidated, ferruginous, and glauconitic sand separated by layers of shale, clay, marl, and chalk. Formation thickness within the study area ranges from zero in central Fannin County to 400 feet in southern Red River and Bowie Counties. Alluvial deposits that are hydrologically connected to the Blossom Sand cover much of the outcrop, particularly in northeast Red River and northwest Bowie Counties. South of the outcrop, the Blossom Sand underlies younger deposits of the Austin Group.
Less than 29 percent of the formation thickness is sand with areas of greatest net sand thickness occurring in Red River and Bowie Counties (McLaurin, 1988). The sand beds are generally discontinuous; however, two water-bearing sand units appear to be laterally persistent. The lowest water-producing sand is up to 60 feet thick and is traceable through Bowie and Red River Counties, merging into chalk and marl approximately at the Lamar County line. The upper water-producing sand is generally less than 20 feet thick extending from central through eastern Lamar County. These two sand beds are separated by thick beds of impermeable clay and marl and are not hydrologically connected.
Hydraulic Properties
Within the Blossom Aquifer, few studies have documented the hydraulic properties including: hydraulic conductivity, transmissivity, and storativity. McLaurin (1988) has documented the most comprehensive dataset for the hydraulic properties of the Blossom Aquifer to date. The Texas Water Development Board is currently developing a GAM for the aquifer. Due to the heterogeneous nature of the aquifer, calculated values for the hydraulic properties often range by several orders of magnitude. Table 4.23 provides a summary of the documented Blossom Aquifer hydraulic properties.
Final Report: Identification of the Vulnerability of the Major and Minor Aquifers of Texas to Subsidence with Regard to Groundwater Pumping – TWDB Contract Number 1648302062
4-90
Table 4.22. Stratigraphic column of geologic and hydrogeologic units within the Blossom Aquifer. Modified from Wood and Guevara (1981) and Nordstrom (1982).
System Group Geologic Units Hydrogeologic Unit
Quaternary
Alluvium
Localize Alluvial Aquifers
Fluviatile, terrace deposits
Cretaceous
Taylor
Marbrook Marl
Confining Units
Pecan Gap Chalk
Wolfe City-Ozan
Austin
Gober Chalk
Brownstown
Blossom Sand Blossom Aquifer
Bonham
Confining Units Ector
Eagle Ford
Table 4.23. Hydraulic properties for the Blossom Aquifer.
Storativity 1.0 x 10⁻⁶ – 0.30 1, 2 Specific Yield 0.07 – 0.37 1, 3
References. (1) McLaurin (1988) (2) Williams (2009); (3) Ulery and others (2011)
Final Report: Identification of the Vulnerability of the Major and Minor Aquifers of Texas to Subsidence with Regard to Groundwater Pumping – TWDB Contract Number 1648302062
4-91
Figure 4.56. West-east geologic cross-section along the Blossom Aquifer (McLaurin, 1988; TWDB, 2018).
Final Report: Identification of the Vulnerability of the Major and Minor Aquifers of Texas to Subsidence with Regard to Groundwater Pumping – TWDB Contract Number 1648302062
4-92
Hydraulic Heads
Groundwater in the Blossom Aquifer generally moves downgradient in a south-southeasterly direction. Factors which may alter the normal direction of groundwater movement include variance in lithology and change in slope of the potentiometric surface due to pumping. Such a change in slope is evident in central Red River County where pumping has caused an increase in the hydraulic gradient toward the production wells. As a result, a preferred flow path has developed toward those well locations (McLaurin, 1988).
Groundwater Pumping
Most of the water wells pumping from the Blossom Aquifer are shallow domestic or livestock wells located near or on the outcrop. However, a large amount of domestic wells have been abandoned due in favor of public supply systems. Figure 4.57 provides a graph of the historic pumping volumes from the Blossom Aquifer in the municipal, manufacturing, mining, and steam/electricity production, irrigation, and livestock sectors from 1980 to 2015. Overall, the pumping demand has stayed relatively constant since 1980 with the exception of irrigation, which significantly increased in 2004. Irrigation now accounts for over 80 percent of all production from the Blossom Aquifer. Future pumping demands are not predicted to significantly increase.
Subsidence Vulnerability
Clay thickness within the Blossom Aquifer is less than 5 feet and uniformly low throughout the aquifer (average SRV = 1.3 with a third quartile of 1). Figure 4.58 provides the clay thickness at well locations and the regional distribution of the thicknesses. The lithology of the Blossom is primarily consolidated clastic material consisting of fine to medium grained sandstone separated by marl, clay, and chalk layers. The clay is categorized as a hard clay.
Limited water level data in the aquifer has made analyses of water level trends difficult. McLaurin (1988) stated that heavy pumpage in central Red River County resulted in significant water level decline with wells closely spaced. For evaluation purposes measured water level data from the Texas Water Development Board Groundwater Database (2017a) were used instead of models. For wells without any measurements, the nearest measurement was used with water level trends based upon available measurements. Preconsolidation and static water levels were based upon the minimum water level and the most recent water level, respectively resulting in a SRV of 3. Table 4.24 summarizes the data sources and values for each subsidence risk factor.
Results of the assessment suggest that the Blossom has a low to medium-low risk for future subsidence due to pumping. Figure 4.59 illustrates the subsidence risk factor throughout the aquifer.
Final Report: Identification of the Vulnerability of the Major and Minor Aquifers of Texas to Subsidence with Regard to Groundwater Pumping – TWDB Contract Number 1648302062
4-93
Figure 4.57. Historic pumping volumes from the Blossom Aquifer in the municipal, manufacturing, mining, and steam/electricity production, irrigation, and livestock sectors from 1980 to 2015 (TWDB, 2017b).
Final Report: Identification of the Vulnerability of the Major and Minor Aquifers of Texas to Subsidence with Regard to Groundwater Pumping – TWDB Contract Number 1648302062
4-94
Figure 4.58. Calculated Blossom Aquifer clay thickness at well locations.
Final Report: Identification of the Vulnerability of the Major and Minor Aquifers of Texas to Subsidence with Regard to Groundwater Pumping – TWDB Contract Number 1648302062
4-95
Table 4.24. Blossom Aquifer subsidence risk factor data sources and summary.
Subsidence Risk Factor Variable Data Source Value
3rd Quartile SRV
Clay Layer Thickness and Extent
SDR lithology table 0 to 290 feet 1
Clay Compressibility Estimated based on lithology Hard Clay 1
Aquifer Lithology George and others (2011) Consolidated
Clastic 3
Preconsolidation Characterization
Minimum water level from measured data (TWDB, 2017a)
89 to 615 feet mean sea level
3
Predicted Water Level Decline based on Trend
Trend from measured water levels (TWDB, 2017a)
Less than 1-foot decline
2
Predicted DFC Water Level Decline
Not Applicable 1
Final Report: Identification of the Vulnerability of the Major and Minor Aquifers of Texas to Subsidence with Regard to Groundwater Pumping – TWDB Contract Number 1648302062
4-96
Figure 4.59. Blossom Aquifer subsidence risk vulnerability at well locations.
Final Report: Identification of the Vulnerability of the Major and Minor Aquifers of Texas to Subsidence with Regard to Groundwater Pumping – TWDB Contract Number 1648302062
4-97
4.3.3 Bone Spring–Victorio Peak
The Bone Spring-Victorio Peak Aquifer is used primarily for irrigation in northern Hudspeth County in a region commonly referred to as Dell Valley. The valley consists of approximately 40,000 acres of irrigable land in Texas and extends north into New Mexico. Figure 4.60 provides a map showing the extent of the aquifer within Texas.
Figure 4.60. Bone Spring–Victorio Peak Aquifer extent.
Final Report: Identification of the Vulnerability of the Major and Minor Aquifers of Texas to Subsidence with Regard to Groundwater Pumping – TWDB Contract Number 1648302062
4-98
Hydrostratigraphy
The Bone Spring Limestone is predominantly a black to dark-gray, cherty limestone with thin interbedded black or brown layers of siliceous shale. The Bone Spring grades upward into the Victorio Peak Limestone, a light-gray, thick-bedded, mainly calcitic but slightly dolomitic limestone. These Permian age rocks are the principal water bearing units of the aquifer. Flow through the aquifer is primarily along dissolution features in the rock (Ashworth, 2001).
At land surface, up to 150 feet of alluvium overlies much of the aquifer. The alluvial sediments were deposited by runoff from upland areas to the west and northwest. These sediments range in size from boulders to clay particles (Ashworth, 2001).
Figure 4.61. Generalized cross-section from west to east illustrating the Bone Spring–Victorio Peak Aquifer and associated features (George and others, 2011).
Hydraulic Properties
Hutchison (2008) compiled data for specific capacity tests indicating a range from 7 to 1,167 gallons per minute per foot of drawdown. Using these specific capacity values, Hutchison (2008) estimated the transmissivity of the aquifer and then calculated the hydraulic conductivity assuming a 1,000-foot-thick aquifer. Within the flow model for the aquifer, the hydraulic properties were defined for delineated zones. Table 4.25 summarizes the hydraulic properties for the largest of the defined aquifer zones which is more than 1,000 square miles
Final Report: Identification of the Vulnerability of the Major and Minor Aquifers of Texas to Subsidence with Regard to Groundwater Pumping – TWDB Contract Number 1648302062
4-99
Table 4.25. Hydraulic properties for the Bone Spring–Victorio Peak Aquifer.
Groundwater flow is primarily from the north and west to the southeast. The lowest water levels occur along Highway 62 near the eastern border of the aquifer. Water levels in the aquifer fluctuate seasonally in response to irrigation demands. During peak irrigation periods, water levels may decline up to 35 feet and then rebound during the winter as water is recharged to the system (Ashworth, 2001).
Groundwater Pumping
Most of the water wells pumping from the Bone Spring–Victorio Peak Aquifer are irrigation wells. Figure 4.62 provides a graph of the historic pumping volumes from the aquifer in the municipal, manufacturing, mining, and steam/electricity production, irrigation, and livestock sectors from 1980 to 2015. Pumping demand increased significantly in the 1990s but has since declined to generally less than 50,000 acre-feet per year since 2005.
Subsidence Vulnerability
Reported clay thicknesses within the Bone Spring–Victorio Peak Aquifer are minimal. Only one well shows a clay thickness greater than 100 feet resulting in an average and third quartile SRV of 1. Figure 4.63 provides the clay thickness at well locations and the regional distribution of the thicknesses. The lithology of the Bone Spring–Victorio Peak is described as carbonate material with thin interbeds of siliceous shale (Ashworth, 2001) that we categorized as hard clay.
For our evaluation we used measured water level data from the Texas Water Development Board Groundwater Database (2017a) instead of the local flow model. For wells without any measurements, the nearest measurement was used with water level trends based upon available measurements. Preconsolidation and static water levels were based upon the minimum water level and the most recent water level, respectively resulting in a SRV of 2.5 with a third quartile of 3. Table 4.26 summarizes the data sources and values for each subsidence risk factor.
Results of the assessment suggest that the Bone Spring–Victorio Peak Aquifer has a low risk for future subsidence due to pumping. Figure 4.64 illustrates the subsidence risk factor throughout the aquifer.
Final Report: Identification of the Vulnerability of the Major and Minor Aquifers of Texas to Subsidence with Regard to Groundwater Pumping – TWDB Contract Number 1648302062
4-100
Figure 4.62. Historic pumping volumes from the Bone Spring–Victorio Peak Aquifer in the municipal, manufacturing, mining, and steam/electricity production, irrigation, and livestock sectors from 1980 to 2015 (TWDB, 2017b).
Final Report: Identification of the Vulnerability of the Major and Minor Aquifers of Texas to Subsidence with Regard to Groundwater Pumping – TWDB Contract Number 1648302062
4-101
Figure 4.63. Calculated Bone Spring–Victorio Peak Aquifer clay thickness at well locations.
Final Report: Identification of the Vulnerability of the Major and Minor Aquifers of Texas to Subsidence with Regard to Groundwater Pumping – TWDB Contract Number 1648302062
4-102
Table 4.26. Bone Spring–Victorio Peak Aquifer subsidence risk factor data sources and summary.
Final Report: Identification of the Vulnerability of the Major and Minor Aquifers of Texas to Subsidence with Regard to Groundwater Pumping – TWDB Contract Number 1648302062
4-103
Figure 4.64. Bone Spring–Victorio Peak Aquifer subsidence risk vulnerability at well locations.
Final Report: Identification of the Vulnerability of the Major and Minor Aquifers of Texas to Subsidence with Regard to Groundwater Pumping – TWDB Contract Number 1648302062
4-104
4.3.4 Brazos River Alluvium
The Brazos River Alluvium Aquifer extends approximately 350 river miles from the dam at Lake Whitney to Fort Bend County and intersects portions of 13 counties from north to south within a roughly west-east swath spanning up to 7 miles. Figure 4.65 provides a map of the aquifer extent.
Figure 4.65. Brazos River Alluvium Aquifer extent.
Final Report: Identification of the Vulnerability of the Major and Minor Aquifers of Texas to Subsidence with Regard to Groundwater Pumping – TWDB Contract Number 1648302062
4-105
Hydrostratigraphy
The Brazos River Alluvium Aquifer is comprised of alluvial floodplain and terrace deposits. The floodplain alluvium consists of fine to coarse sand, gravel, silt, and clay. The thickness of the aquifer ranges from negligible to 168 feet, with an overall average of about 50 feet. It has the capability to supply water for irrigation, domestic, stock, and commercial use (Shah and others, 2007).
Generally, the Brazos River Alluvium Aquifer is unconfined, and hydrogeologic characteristics including recharge, groundwater flow, transmissivity, hydraulic conductivity, and discharge for the aquifer are spatially heterogeneous due to the multifaceted depositional environment in which the aquifer material was deposited. The sequence of finer upward deposits transitioning to coarser deposits below is consistent throughout the aquifer. However, due to pinching out and interfingering, the grain size and relative position of individual constituents in the sequence vary from place to place. The transition from one type of material to another, both laterally and vertically, can be either sharp and distinct or gradual (Ewing and others, 2016).
The aquifer structure is comprised of three main components: bedrock of Cretaceous age (Lake Whitney to Falls County) to Tertiary age (Falls County to Fort Bend County), terrace alluvial sediment deposited by the paleo-Brazos River, and floodplain alluvium deposited by the Brazos River (Wong, 2012). In some places, the Brazos River Alluvium Aquifer sediments have been reworked by tributary streams or disturbed by changes in land use, resulting in re-deposition of the original sediment within the floodplain or terraces in addition to the local tributary deposits (Yelderman Jr., 2008). In short, the aquifer makes up a complex geological framework with irregular lateral interfingering of sediments with varying permeability and vertical fining-upward sequences resulting in significant heterogeneity.
Formation of the Brazos River Valley and the subsequent Brazos River Alluvium Aquifer occurred through a sequence of degradational and aggradational events related to glacial melts during the Pleistocene Period (Epps, 1973; Harlan, 1990). As a result, multiple floodplains were deposited and reworked by the Brazos River, ultimately forming the present-day geologic framework. Three major terraces formed above the present-day floodplain that consist of clay, silt, sand, and gravel which can be slightly cemented and as thick as 75 feet in some areas, but are generally much thinner (Cronin and Wilson, 1967; Epps, 1973; Wong, 2012). Younger terraces along the Brazos River present opportunities for hydraulic connection between the lower floodplains and the upper (older) terraces, although it has been noted that older terraces are not hydraulically connected to the floodplain alluvium and are, in some places, physically separated by bedrock (Cronin and Wilson, 1967; Harlan, 1990; Shah and others, 2007). Though the younger terraces contribute water to the floodplain alluvium through underflow, the overall water contribution is thought to be small (Cronin and Wilson, 1967).
The floodplain alluvium represents the major water-bearing unit within the Brazos River Alluvium Aquifer matrix. As the Brazos River meandered and cut through the river valley, sand, gravel, silt, and clay sediments were deposited in sequences associated with changing
Final Report: Identification of the Vulnerability of the Major and Minor Aquifers of Texas to Subsidence with Regard to Groundwater Pumping – TWDB Contract Number 1648302062
4-106
and somewhat unstable geomorphic, hydrologic, and climatic conditions (Waters and Nordt, 1995). Typically, a stratigraphic profile of the floodplain sediments displays a “fining upwards” sequence, where coarse sands and gravels make up the lower, more prolific portion of the aquifer and silts and clays make up the surface (Cronin and Wilson, 1967). The clays associated with the fine-grained upper portion of the unit can create local confining conditions (Shah and others, 2007). The composition of the gravels found in the floodplain alluvium is predominantly limestone, while the gravels found in the terraces are non-siliceous (Ewing and others, 2016).
Hydraulic Properties
Heterogeneity is most evident in the hydraulic parameters in the Brazos River Alluvium Aquifer. The irregular lateral interfingering of sediments with varying permeability and vertical fining-upward sequences result in hydraulic conductivity, transmissivity, and specific capacity values ranging by orders of magnitude. Long-duration aquifer pumping tests to estimate hydraulic properties are lacking in the Brazos River Alluvium Aquifer. Ewing and others (2016) developed a theoretical relationship between transmissivity and specific capacity to estimate hydraulic properties at 575 wells where short-duration specific capacity measurements were available. In Table 4.27, studies by Cronin and Wilson (1967), Shah and others (2007), Ju (2014), and Ewing and others (2016) highlight the variable hydraulic properties of the Brazos River Alluvium Aquifer from field and laboratory experiments.
Table 4.27. Hydraulic properties for the Brazos River Alluvium Aquifer.
Transmissivity (ft2/d) 289 – 40,100 1, 2, 7 Specific Yield 7 x 10⁻⁴ – 0.6 1, 8
References: (1) Cronin and Wilson (1967); (2) Shah and others (2007); (3) Ju (2014); (4) Ewing and others (2016); (5) Munster and others (1996); (6) Wilson (1967); (7) Follett (1974); (8) Wrobelski (1996)
Hydraulic Heads
Groundwater flow in the Brazos River Alluvium Aquifer is affected by surface topography, the Brazos River and its tributaries, and the configuration of underlying confining beds (Cronin and Wilson, 1967; Harlan, 1990). Typically, groundwater flows toward the Brazos River and slightly down valley, but terraces and tributaries may locally direct flow toward tributary channels (Harlan, 1990). The alluvial sediments occur immediately adjacent to the Brazos River channel, resulting in a hydrologic connection between surface water and groundwater. Groundwater levels are known to fluctuate in response to river levels, indicating a fairly direct connection (Cronin and Wilson, 1967). High-volume pumping can temporarily alter groundwater flow, while mine reclamation and landfill activities may permanently impact local flow directions (Yelderman Jr., 2008; Ju, 2014).
Historical water levels have fluctuated, but they have remained generally stable in the long term. However, during the last several years declines have been observed in some counties.
Final Report: Identification of the Vulnerability of the Major and Minor Aquifers of Texas to Subsidence with Regard to Groundwater Pumping – TWDB Contract Number 1648302062
4-107
Water levels generally dip toward the Brazos River locally and follow the regional downward trend in topography from the northwest towards the Gulf of Mexico (Ewing and others, 2016).
Groundwater Pumping
Discharge in the Brazos River Alluvium Aquifer is thought to occur mainly as seeps and springs into tributaries and the Brazos River (Yelderman Jr., 2008). Other discharge occurs as pumping from wells, dewatering in mining activities, and evapotranspiration from open water bodies and phreatophytes reaching the water table. Groundwater production from the Brazos River Alluvium Aquifer is used primarily for irrigation purposes, with smaller quantities used for rural domestic, livestock, and municipal purposes. Figure 4.66 provides a graph of the historic pumping volumes from the Brazos River Alluvium Aquifer in the municipal, manufacturing, mining, and steam/electricity production, irrigation, and livestock sectors from 1980 to 2015. From the data, over 98 percent of the groundwater pumping is for irrigation purposes with production increasing significantly since 2000.
Figure 4.66. Historic pumping volumes from the Brazos River Alluvium Aquifer in the municipal, manufacturing, mining, and steam/electricity production, irrigation, and livestock sectors from 1980 to 2015 (TWDB, 2017b).
Final Report: Identification of the Vulnerability of the Major and Minor Aquifers of Texas to Subsidence with Regard to Groundwater Pumping – TWDB Contract Number 1648302062
4-108
Subsidence Vulnerability
Clay thickness within the Brazos River Alluvium Aquifer is generally less than 1 foot throughout the aquifer resulting in an average SRV of 1.3 with a third quartile of 2. As Figure 4.67 illustrates, clay thicknesses throughout the aquifer are less than 100 feet. The lithology of the aquifer is predominantly composed of unconsolidated clastic sediments consisting of heterogeneous sequences of sands, silts, clays, and gravels displayed in a fining upward sequence. The clay layers within the aquifer are characterized as plastic clay.
Figure 4.67. Calculated Brazos River Alluvium Aquifer clay thickness at well locations.
Final Report: Identification of the Vulnerability of the Major and Minor Aquifers of Texas to Subsidence with Regard to Groundwater Pumping – TWDB Contract Number 1648302062
4-109
Water levels within the Brazos River Alluvium Aquifer are generally stable with no long term declining trends; however, Ewing and others (2016) note there are a few areas of the aquifer experiencing water level decline, most notably within southern Brazos County (see Figure 4.65). We set the preconsolidation level at the well sites to the minimum water level from the GAM and the static water level to the simulated water level at the end of the GAM calibration period (Ewing and others, 2016). We calculated the water level trend using all of the simulated water levels from the GAM and used a value of 6 feet of decline from the initial water level as an estimate of the DFC. Table 4.28 summarizes the data sources and values for each subsidence risk factor.
Table 4.28. Brazos River Alluvium Aquifer subsidence risk factor data sources and summary.
Subsidence Risk Factor Variable Data Source Value
3rd Quartile SRV
Clay Layer Thickness and Extent
SDR lithology table 0 to 43.5 feet 2
Clay Compressibility Estimated based on lithology Plastic Clay 3
Aquifer Lithology Ewing and others (2016) Unconsolidated
Clastic 4
Preconsolidation Characterization
Minimum water level from transient model simulations
(Ewing and others, 2016)
-9 to 445 feet mean sea level
3
Predicted Water Level Decline based on Trend
Trend in simulated water levels from transient model simulations
(Ewing and others, 2016)
Less than 1-foot decline
2
Predicted DFC Water Level Decline
Estimate from adopted DFCs for GMA 12
6 feet decline 1
Results of the assessment suggest that the Brazos River Alluvium Aquifer has a medium risk for future subsidence due to pumping. Figure 4.68 illustrates the subsidence risk factor for the Brazos River Alluvium Aquifer.
Final Report: Identification of the Vulnerability of the Major and Minor Aquifers of Texas to Subsidence with Regard to Groundwater Pumping – TWDB Contract Number 1648302062
4-110
Figure 4.68. Brazos River Alluvium Aquifer subsidence risk vulnerability at well locations.
Final Report: Identification of the Vulnerability of the Major and Minor Aquifers of Texas to Subsidence with Regard to Groundwater Pumping – TWDB Contract Number 1648302062
4-111
4.3.5 Capitan Reef Complex
The Capitan Reef Complex is classified as a minor aquifer and is a saddle or horseshoe shaped, limestone aquifer that surrounds the Permian Aged Delaware Basin. The aquifer is located primarily in northwest Texas and extends into southeast New Mexico. Figure 4.69 provides a map of the aquifer extent.
Figure 4.69. Capitan Reef Complex Aquifer extent.
Final Report: Identification of the Vulnerability of the Major and Minor Aquifers of Texas to Subsidence with Regard to Groundwater Pumping – TWDB Contract Number 1648302062
4-112
Hydrostratigraphy
Figure 4.70 illustrates the units which make up the Capitan Reef Complex Aquifer and bounding units. Figure 4.71 illustrates the structural feature associated with the aquifer.
The Capitan Reef Complex is composed of the Goat Seep Dolomite, Capitan Limestone, and Carlsbad Limestone (Standen and others, 2009; Jones, 2016a). The aquifer is composed of up to approximately 2,500 feet of massively bedded gray limestone rich with fossils. The aquifer is compartmentalized by dissecting faults (Standen and others, 2009). The aquifer is encompassed on the back-reef side (outside of the horseshoe) by the Artesia group limestones and sandstones. The aquifer is bound on the fore side (interior side of the horseshoe) by the Delaware Mountain Group. These limestones grade into the Capitan Reef Complex, but act as an aquitard (Jones, 2016a).
The Capitan Reef Complex overlies various geologic units that are assumed to act as an aquitard and not hydraulically connected to the Capitan Reef Aquifer (Jones, 2016a). In the Apache Mountains area, the Capitan Reef Complex is underlain by up to 450 feet of the Munn Formation. In the Guadalupe Mountains area, the aquifer overlies the San Andres and Cherry Canyon formations. In the Glass Mountains the Capitan Reef Aquifer was deposit above the Word Formation (Standen and others, 2009).
In areas of the Guadalupe Mountains and eastern arm, the Capitan Reef Complex Aquifer is overlain by 1,500 to 2,000 feet of Castile and Salado Formation evaporites. The overlying Castile and Salado formations act as an aquitard (Jones, 2016a). The Capitan Reef Complex is directly overlain by sand, siltstone, and shale of the Rustler Formation in areas of Pecos County. Standen and others (2009) also indicate that in the Glass Mountains area, the Capitan Reef Aquifer is overlain by up to approximately 740 feet of Bissett Formation after dipping below land surface in a northern direction.
During the Tertiary and Quaternary periods, salt basin sediments were deposited across the majority of the aquifer area. The young sediments are composed of up to 3,000 feet of alluvial, lacustrine, and evaporite deposits (Standen and others, 2009). Dissolution collapse of portions of the Capitan Reef Complex attributed to the development of the deep Monument Draw trough section of the near surface Pecos Valley Aquifer (Jones, 2016a) discussed in Section 4.2.7. Erosion of overlying layers resulted in the Capitan Reef Aquifer being exposed at the surface in parts of the Guadalupe Mountains, Patterson Hills, Apache Mountains, and Glass Mountains (Standen and others, 2009).
Final Report: Identification of the Vulnerability of the Major and Minor Aquifers of Texas to Subsidence with Regard to Groundwater Pumping – TWDB Contract Number 1648302062
4-113
Figure 4.70. Geologic section of the Capital Reef Complex Aquifer. Modified from Standen and others (2009).
Final Report: Identification of the Vulnerability of the Major and Minor Aquifers of Texas to Subsidence with Regard to Groundwater Pumping – TWDB Contract Number 1648302062
4-114
Figure 4.71. Structural features associated with the Capital Reef Complex Aquifer (Standen and others, 2009).
Final Report: Identification of the Vulnerability of the Major and Minor Aquifers of Texas to Subsidence with Regard to Groundwater Pumping – TWDB Contract Number 1648302062
4-115
Hydraulic Properties
There is little available data to characterize the hydraulic properties of the Capital Reef Aquifer, but the properties are known to vary significantly primarily due to karst features and variations in extent of rock fracturing. Estimates of hydraulic conductivity vary between 0.009 and 517 feet per day (Jones, 2016a). In the GAM of the Capitan Reef Aquifer, the aquifer was modeled to have a horizontal hydraulic conductivity of 12 feet per day and a vertical hydraulic conductivity of 1.2 feet per day (Jones, 2016b). The specific storage of the aquifer was modeled as 5.0 x 10⁻⁵ (Jones, 2016b).
Hydraulic Heads
The Capitan Reef Aquifer generally acts as a confined aquifer. Groundwater flow in the aquifer is broken up into three sections by a structural divide caused by faulting and located in the northwest corner of the saddle along the New Mexico and Texas border. Groundwater flows away from this divide to the south-southeast and to the northeast. The flow to the northeast is driven by recharge from the Guadalupe Mountains, where the aquifer is exposed at the surface. A second groundwater divide, located in Winkler County just south of the New Mexico border, is caused by a zone of low groundwater. Groundwater flows to this divide from both the north and south. Groundwater flow in the Eastern portion of the aquifer is driven by recharge directly to the aquifer from the Pecos River where the aquifer is exposed or near the surface and upward inter-aquifer gradients driven by gaining reaches of the Pecos River (Jones, 2016a).
Groundwater Pumping
Based on records from the Texas Water Development Board, irrigation has been the primary aquifer use since 1994 (TWDB, 2017). Figure 4.75 provides a graph of the historic pumping volumes from the Capitan Reef Aquifer in the municipal, manufacturing, mining, and steam/electricity production, irrigation, and livestock sectors from 1980 to 2015. Over the past 10 years, reported irrigation production has averaged more than 9,500 acre-feet per year.
Jones (2016) discusses groundwater use from the Capitan Reef Aquifer associated with oil and gas activities. While the TWDB pumping estimates do not include groundwater pumping for oil and gas activities, it is likely that some use continues to occur. However, the inherent temporal variability in oil and gas operations, would also suggest that the pumping from the aquifer for these activities would vary significantly from year to year (Jones, 2016). In the transient Groundwater Availability Model of the eastern arm of the aquifer it was assumed that the extraction rate from the aquifer in 2005 was only 560 acre-feet per year (Jones, 2016).
Final Report: Identification of the Vulnerability of the Major and Minor Aquifers of Texas to Subsidence with Regard to Groundwater Pumping – TWDB Contract Number 1648302062
4-116
Figure 4.72. Historic pumping volumes from the Capitan Reef Complex Aquifer in the municipal, manufacturing, mining, and steam/electricity production, irrigation, and livestock sectors from 1980 to 2015 (TWDB, 2017b).
Final Report: Identification of the Vulnerability of the Major and Minor Aquifers of Texas to Subsidence with Regard to Groundwater Pumping – TWDB Contract Number 1648302062
4-117
Subsidence Vulnerability
Reported clay thicknesses within the Capitan Reef Complex Aquifer are minimal. Only one well shows a clay thickness greater than 100 feet resulting in an average and third quartile SRV of 1. Figure 4.73 provides the clay thickness at well locations and the regional distribution of the thicknesses.
Figure 4.73. Calculated Capitan Reef Complex Aquifer clay thickness at well locations.
The lithology of the Capitan Reef Complex is described as carbonate material (Uliana, 2001; Standen and others, 2009; Jones, 2016a) with clays categorized as hard. Due to the
Final Report: Identification of the Vulnerability of the Major and Minor Aquifers of Texas to Subsidence with Regard to Groundwater Pumping – TWDB Contract Number 1648302062
4-118
carbonate aquifer lithology, the SRV is 2 to indicate a risk of subsidence due to dissolution. However, the risk does not consider the potential for subsidence due to dissolution of geologic units not associated with the Capitan Reef Complex Aquifer, such as those units overlying the aquifer where it is in the subsurface.
As the GAM for the Capitan Reef Complex Aquifer only covers the eastern limb (Jones, 2016b), for our evaluation we used measured water level data from the Texas Water Development Board Groundwater Database (2017a). For wells without any measurements, the nearest measurement was used with water level trends based upon available measurements. Preconsolidation and static water levels were based upon the minimum water level and the most recent water level, respectively resulting in a SRV of 2.6 with a third quartile of 3. Table 4.29 summarizes the data sources and values for each subsidence risk factor.
Table 4.29. Capitan Reef Complex subsidence risk factor data sources and summary.
Subsidence Risk Factor Variable Data Source Value
3rd Quartile SRV
Clay Layer Thickness and Extent
SDR lithology table 0 to 161 feet 1
Clay Compressibility Uliana (2001), Standen and others
(2009), Jones (2016a) Hard Clay 1
Aquifer Lithology Uliana (2001), Standen and others
(2009), Jones (2016a) Carbonate 2
Preconsolidation Characterization
Water level from measured data (TWDB, 2017a)
2,551 to 5,450 feet mean sea level
3
Predicted Water Level Decline based on Trend
Trend from measured water levels (TWDB, 2017a)
No change 1
Predicted DFC Water Level Decline
Bradley (2011) 15 to 200 feet
decline 2
Results of the assessment suggest that Capitan Reef Complex has a low risk for future subsidence due to pumping. Figure 4.64 illustrates the subsidence risk factor throughout the aquifer.
Final Report: Identification of the Vulnerability of the Major and Minor Aquifers of Texas to Subsidence with Regard to Groundwater Pumping – TWDB Contract Number 1648302062
4-119
Figure 4.74. Capitan Reef Complex Aquifer subsidence risk vulnerability at well locations.
Final Report: Identification of the Vulnerability of the Major and Minor Aquifers of Texas to Subsidence with Regard to Groundwater Pumping – TWDB Contract Number 1648302062
4-120
4.3.6 Dockum
The Dockum Aquifer is found in northwest Texas underlying the Ogallala. Locally, the aquifer is frequently referred to as the Santa Rosa Aquifer. Production from the aquifer is primarily for irrigation with the highest well yields coming from coarse grained deposits in the middle and base of the formations that make up the aquifer (George and others, 2011). Figure 4.75 illustrates the extent of the aquifer in Texas.
Figure 4.75. Dockum Aquifer extent.
Final Report: Identification of the Vulnerability of the Major and Minor Aquifers of Texas to Subsidence with Regard to Groundwater Pumping – TWDB Contract Number 1648302062
4-121
Hydrostratigraphy
The Triassic age Dockum Aquifer is the lowermost aquifer of the High Plains Aquifer System in west Texas. Underlying the Dockum are low permeability Permian age formations. Within the Dockum, the primary sandy aquifer formations are the Santa Rosa and Trujillo (Deeds and others, 2015).
Fining upward transitions of sandstone to shale divide the Dockum into upper and lower units. Sands of the Santa Rosa Formation correspond to the lower Dockum while the sands of the Trujillo Formation correspond to the upper Dockum. Figure 4.76 is a cross-section from Deeds and others (2015) illustrating the relationship of the Dockum and other area aquifers.
Figure 4.76. Cross-section illustrating the configuration of aquifers associated with the Dockum (Deeds and others, 2015).
Hydraulic Properties
Deeds and others (2015) compiled information from previous modeling efforts and included newly available hydraulic property data from wells completed and tested subsequent to the previous studies. The lower Dockum has an average hydraulic conductivity of 6.6 feet per day while the average value for the upper Dockum is 8.1 feet per day. However, the range of values is much greater for the lower Dockum being 0.59 to 76.5 feet per day compared to a range of 0.41 to 20 feet per day for the upper (Deeds and others, 2015).
Hydraulic Heads
Pre-development water levels in the aquifer generally followed land surface topography with flow from the northwest to the southeast. Most of upper Dockum shows little change in water level from pre-development conditions. However, local water level declines of more than 50 feet are evident in the lower portion of the Dockum. These local declines have locally altered the general direction of groundwater flow toward the pumping centers (Deeds and others, 2015).
Final Report: Identification of the Vulnerability of the Major and Minor Aquifers of Texas to Subsidence with Regard to Groundwater Pumping – TWDB Contract Number 1648302062
4-122
Groundwater Pumping
Most of the water wells pumping from the Dockum Aquifer are for irrigation purposes. Figure 4.77 provides a graph of the historic pumping volumes from the Dockum Aquifer in the municipal, manufacturing, mining, and steam/electricity production, irrigation, and livestock sectors from 1980 to 2015. Overall, the pumping demand was relatively constant since 1994.
Figure 4.77. Historic pumping volumes from the Dockum Aquifer in the municipal, manufacturing, mining, and steam/electricity production, irrigation, and livestock sectors from 1980 to 2015 (TWDB, 2017b).
The abrupt decline in pumping amounts from 1993 to 1994 is likely due to a correction applied to the data. Review of data from Deeds and others (2015) indicates that the reported pumping from 1980 through 1993 is likely much less than shown on Figure 4.77. Figure 4.78 is a chart from Deeds and others (2015) illustrating the estimated pumping from the Dockum Aquifer in Texas.
Final Report: Identification of the Vulnerability of the Major and Minor Aquifers of Texas to Subsidence with Regard to Groundwater Pumping – TWDB Contract Number 1648302062
4-123
Figure 4.78. Estimated pumping from the Dockum Aquifer in Texas (Deeds and others, 2015).
Final Report: Identification of the Vulnerability of the Major and Minor Aquifers of Texas to Subsidence with Regard to Groundwater Pumping – TWDB Contract Number 1648302062
4-124
Subsidence Vulnerability
Saturated clay thickness in the Dockum is greatest in the northern portion of the aquifer with values in much of the area exceeding 200 feet. Clays are typically thinner in the central and southern portions of the aquifer. Overall the average SRV for the clay thickness and extent is 2.2 with the third quartile of 3. Figure 4.79 illustrates the saturated clay thickness at SDR well locations and regional distribution of the thicknesses.
Figure 4.79. Calculated Dockum Aquifer clay thickness at well locations.
Final Report: Identification of the Vulnerability of the Major and Minor Aquifers of Texas to Subsidence with Regard to Groundwater Pumping – TWDB Contract Number 1648302062
4-125
The lithology of the Dockum is primarily consolidated clastic material (SRV = 3). The aquifer consists of detrital material ranging in size from clay to gravel (George and others, 2011). Reddish shales, which we categorized as hard clay (SRV = 1), separate sandstones in the Dockum (Bradley and Kalaswad, 2001).
For evaluation purposes, we assumed a preconsolidation and static water level in the aquifer equivalent to the results for 2017 from the MAG simulations (Goswami, 2017a; Shi, 2017a) resulting in a SRV of 3 throughout the aquifer. We determined the water level trend using the simulated water levels from 1980 through 2012 from the calibrated High Plains Aquifer System GAM (Deeds and Jigmond, 2015) and the predicted DFC water level decline as the difference in head for 2062 from initial head from final MAG simulations (Goswami, 2017a; Shi, 2017a). Table 4.30 summarizes the data sources and values for each subsidence risk factor.
Table 4.30. Dockum subsidence risk factor data sources and summary.
Subsidence Risk Factor Variable Data Source Value
3rd Quartile SRV
Clay Layer Thickness and Extent
SDR lithology table 0 to 1,604 feet 3
Clay Compressibility Bradley and Kalaswad (2001) Hard Clay 1
Aquifer Lithology George and others (2011) Consolidated
Clastic 3
Preconsolidation Characterization
Preconsolidation and static water level: Head for 2017 from final
Modeled Available Groundwater simulation
1,897 to 4,610 feet mean sea level
3
Predicted Water Level Decline based on Trend
Trend in simulated water levels from 1980 through 2012 from calibrated High Plains Aquifer
System GAM
Less than 1-foot decline
2
Predicted DFC Water Level Decline
Difference in head for 2062 from initial head from final Modeled
Available Groundwater simulation
Average 78 feet decline
3
Results of the assessment suggest that the northern part of the Dockum has the greatest risk for future subsidence due to pumping. As Figure 4.80 illustrates, data from wells in the northern Dockum tend to show a medium to high subsidence risk. The central and southern portions of the aquifer are at a lower risk.
Final Report: Identification of the Vulnerability of the Major and Minor Aquifers of Texas to Subsidence with Regard to Groundwater Pumping – TWDB Contract Number 1648302062
4-126
Figure 4.80. Dockum Aquifer subsidence risk vulnerability at well locations.
Final Report: Identification of the Vulnerability of the Major and Minor Aquifers of Texas to Subsidence with Regard to Groundwater Pumping – TWDB Contract Number 1648302062
4-127
4.3.7 Edwards–Trinity (High Plains)
The Edwards–Trinity (High Plains) Aquifer is found in west Texas underlying the Ogallala Aquifer. Production from the aquifer is primarily for irrigation (George and others, 2011). Figure 4.81 illustrates the extent of the aquifer in Texas.
Final Report: Identification of the Vulnerability of the Major and Minor Aquifers of Texas to Subsidence with Regard to Groundwater Pumping – TWDB Contract Number 1648302062
4-128
Hydrostratigraphy
The Edwards-Trinity (High Plains) Aquifer is an erosional remnant of the more extensive Edwards-Trinity (Plateau) Aquifer to the southeast. Sandstones in the Antlers and Walnut formations form the base of the aquifer with the limestones of the Comanche Peak and Edwards formations forming the upper part of the aquifer. The aquifer is also interbedded with several thin shale-dominated formations (Deeds and others, 2015). The Edwards-Trinity (High Plains) Aquifer overlies the Dockum and underlies the Ogallala. Figure 4.82 is a cross-section from Deeds and others (2015) illustrating the relationship of the Edwards-Trinity (High Plains) and other area aquifers.
Figure 4.82. Cross-section illustrating the configuration of aquifers associated with the Edwards-Trinity (High Plains) Aquifer (Deeds and others, 2015).
Hydraulic Properties
Limited data are available regarding the hydraulic properties of the Edwards-Trinity (High Plains). Deeds and others (2015) compiled information from previous modeling efforts indicating a range of 0.4 to 42.8 feet per day for the aquifer. The results do not make a distinction between the Trinity and Edwards portions of the aquifer.
Hydraulic Heads
Pre-development water levels in the aquifer generally followed land surface topography with flow from the northwest to the southeast. Reported water level declines in the aquifer are minimal. Flow in the aquifer is generally consistent with pre-development conditions (Deeds and others, 2015).
Edward-Trinity(High Plains)
(High Plains)
Final Report: Identification of the Vulnerability of the Major and Minor Aquifers of Texas to Subsidence with Regard to Groundwater Pumping – TWDB Contract Number 1648302062
4-129
Groundwater Pumping
Most of the water wells pumping from the Edwards–Trinity (High Plains) Aquifer are for irrigation purposes. Figure 4.83 provides a graph of the historic pumping volumes from the Edwards–Trinity (High Plains) Aquifer in the municipal, manufacturing, mining, and steam/electricity production, irrigation, and livestock sectors from 1980 to 2015. Overall, the pumping demand was generally increasing from the mid-1980s through 2002, and has since fluctuated and declined since 2011.
The low pumping amounts from 1994 to 2000 is likely due to incomplete data. Review of data from Deeds and others (2015) indicates that the reported pumping from 1994 through 2000 likely continued to increase. Figure 4.84 is a chart from Deeds and others (2015) illustrating the estimated pumping from the Edwards–Trinity (High Plains) Aquifer.
Figure 4.83. Historic pumping volumes from the Edwards–Trinity (High Plains) Aquifer in the municipal, manufacturing, mining, and steam/electricity production, irrigation, and livestock sectors from 1980 to 2015 (TWDB, 2017b).
Final Report: Identification of the Vulnerability of the Major and Minor Aquifers of Texas to Subsidence with Regard to Groundwater Pumping – TWDB Contract Number 1648302062
4-130
Figure 4.84. Estimated pumping from the Edwards–Trinity (High Plains) Aquifer (Deeds and others, 2015).
Final Report: Identification of the Vulnerability of the Major and Minor Aquifers of Texas to Subsidence with Regard to Groundwater Pumping – TWDB Contract Number 1648302062
4-131
Subsidence Vulnerability
There are few locations in the Edwards–Trinity (High Plains) Aquifer where clay thickness exceeds 100 feet. Overall the average SRV for the clay thickness and extent is 1.5 with the third quartile of 2. Figure 4.85 illustrates the saturated clay thickness at SDR well locations and regional distribution of the thicknesses.
Figure 4.85. Calculated Edwards–Trinity (High Plains) Aquifer clay thickness at well locations.
Final Report: Identification of the Vulnerability of the Major and Minor Aquifers of Texas to Subsidence with Regard to Groundwater Pumping – TWDB Contract Number 1648302062
4-132
The lithology of the Edwards–Trinity (High Plains) is sandstone, consolidated clastic material (SRV = 3), and limestone (that is, carbonate with a SRV of 2). Based on the lithology of the aquifer, we categorized the clay as hard (SRV = 1).
For evaluation purposes, we assumed a preconsolidation and static water level in the aquifer equivalent to the results for 2017 from the MAG simulations (Goswami, 2017a; Shi, 2017a) resulting in a SRV of 3 throughout the aquifer. We determined the water level trend using the simulated water levels from 1980 through 2012 from the calibrated High Plains Aquifer System GAM (Deeds and Jigmond, 2015) and the predicted DFC water level decline as the difference in head for 2062 from initial head from final MAG simulations (Goswami, 2017a; Shi, 2017a). Table 4.31 summarizes the data sources and values for each subsidence risk factor.
Table 4.31. Edwards–Trinity (High Plains) subsidence risk factor data sources and summary.
Subsidence Risk Factor Variable Data Source Value
3rd Quartile SRV
Clay Layer Thickness and Extent
SDR lithology table 0 to 233 feet 2
Clay Compressibility Estimated based on lithology Hard Clay 1
Aquifer Lithology George and others (2011) Carbonate and Consolidated
Clastic 2
Preconsolidation Characterization
Preconsolidation and static water level: Head for 2017 from final
Modeled Available Groundwater simulation
2,824 to 3,823 feet mean sea level
3
Predicted Water Level Decline based on Trend
Trend in simulated water levels from 1980 through 2012 from calibrated High Plains Aquifer
System GAM
Less than 1-foot decline
2
Predicted DFC Water Level Decline
Difference in head for 2062 from initial head from final Modeled
Available Groundwater simulation
Average 87 feet decline
2
Results of the assessment suggest that the Edwards–Trinity (High Plains) Aquifer has a low risk for future subsidence due to pumping. Figure 4.86 illustrates the subsidence risk factor throughout the aquifer.
Final Report: Identification of the Vulnerability of the Major and Minor Aquifers of Texas to Subsidence with Regard to Groundwater Pumping – TWDB Contract Number 1648302062
4-133
Figure 4.86. Edwards–Trinity (High Plains) Aquifer subsidence risk vulnerability at well locations.
Final Report: Identification of the Vulnerability of the Major and Minor Aquifers of Texas to Subsidence with Regard to Groundwater Pumping – TWDB Contract Number 1648302062
4-134
4.3.8 Ellenburger–San Saba
The Ellenburger-San Saba Aquifer spans across 16 counties in the Central Texas Hill Country. The aquifer is composed of Paleozoic limestone and dolomite that extends in a circular pattern around the Llano Uplift and dip radially into the subsurface away from the center of the uplift to depths of approximately 3,000 feet. Figure 4.87 provides a location map showing the outcrop and subcrop portions of the aquifer. Regional block faulting has significantly compartmentalized the aquifer.
Figure 4.87. Ellenburger-San Saba Aquifer extent.
Final Report: Identification of the Vulnerability of the Major and Minor Aquifers of Texas to Subsidence with Regard to Groundwater Pumping – TWDB Contract Number 1648302062
4-135
Hydrostratigraphy
The Ellenberger-San Saba Aquifer consists of the Tanyard, Gorman, and Honeycut formations of the Ellenburger Group and the San Saba Limestone Member of the Wilberns Formation. The unconfined portion of the aquifer crops out in a circular pattern around the Llano Uplift. The Llano Uplift is a structural high dome consisting of Precambrian rocks, much of which are igneous granites and other metamorphics aging up to over 1.36 billion years (Reese and others, 2000). Metamorphosis including compression and folding occurred approximately 1.2 billion years ago with multi-directional fracturing (Johnson, 2004).
The complex Precambrian formations which make up the structural base in the area are composed of a sequence of meta-sedimentary and meta-igneous rock, with scattered intrusive igneous rock. Major meta-sedimentary units include the Packsaddle Schist and the Valley Spring Gneiss; meta-igneous units include the Coal Creek Serpentine, the Big Spring Gneiss, and the Red Mountain Gneiss. Igneous rocks include the Llanite Quartz Porphyry, the Sixmile Granite, the Oatman Creek Granite, and the Town Mountain Granite (Preston and others, 1996). In general, these rocks crop out in the center of the uplift and act as confining units to overlying aquifers. Rocks overlying the Precambrian Base dip radially away from the dome structure with high variability in magnitude, ranging from a few feet to over 100 feet per mile (Barnes and Bell, 1977). Table 4.32 provides a stratigraphic column of the geologic units near the Llano Uplift; Figure 4.88 provides a cross-section of a portion of the Ellenburger-San Saba Aquifer with overlying and underlying hydrogeologic units near Gillespie County.
Stratigraphically above the Precambrian base lies the Cambrian aged Moore Hollow Group which consists of the Riley and Wilberns Formations. The oldest member of the Riley Formation is the Hickory Sandstone consisting of cross-bedded terrestrial and marine quartz sandstones, siltstones, and mudstones which make up the Hickory Aquifer. In certain areas the Cap Mountain limestone overlies the Hickory, acting as a confining unit. The youngest member of the Riley Formation, the Lion Mountain Sandstone, is intermittently found overlying the Cap Mountain Limestone. The Welge Sandstone, the oldest member of the Wilberns Group, is hydraulically connected to the Lion Mountain forming the Mid-Cambrian Aquifer. The Morgan Creek Limestone and the Point Peak Shale are found directly above the Welge Sandstone and act as a confining unit between the Mid-Cambrian and the Ellenburger-San Saba aquifers. Completing the Wilberns Group is the San Saba Limestone which is the stratigraphically lowest part of the Ellenburger-San Saba Aquifer (Barnes and Bell, 1977; Preston and others, 1996).
Final Report: Identification of the Vulnerability of the Major and Minor Aquifers of Texas to Subsidence with Regard to Groundwater Pumping – TWDB Contract Number 1648302062
4-136
Table 4.32. Stratigraphic column of the Ellenburger-San Saba illustrating the hydrogeologic units (Preston and others, 1996).
Era System Group Formation Member Hydrogeologic
Unit
CZ
Quaternary Pleistocene to Recent floodplain (alluvium
and fluviatile terrace deposits)
Localized Alluvium
Mes
ozo
ic
Cretaceous
Edwards
Segovia
Edwards Plateau Aquifer
Ed
war
ds-
Tri
nit
y A
qu
ifer
Fort Terrett
Kirschberg Evaporite
Dolomitic
Burrowed
Basal Nodular Confining
Unit
Trinity
Glen Rose Limestone Upper
Upper Trinity Aquifer
Lower
Middle Trinity Aquifer
Tra
vis
Pea
k E
qu
ival
ent Hensell Sand
Bexar Shale
Cow Creek Limestone
Hammett Shale Confining Unit
Sligo Sycamore Sand
Hosston
Lower Trinity Aquifer
Pal
eozo
ic
Pennsylvanian
Canyon Undivided Undivided
Confining Units Strawn Undivided
Bend Smithwick
Marble Falls Limestone Marble Falls
Aquifer
Mississippian and Devonian
Mississippian and Devonian Undivided Rocks Confining Units
Ordovician Ellenburger
Honeycut Undivided
Ellenburger-San Saba Aquifer
Gorman Undivided
Tanyard Staendebach
Threadgill
Cambrian Moore Hollow
Wilberns
San Saba
Point Peak Confining Units
Morgan Ck Ls
Welge Ss Mid-Cambrian Aquifer
Riley
Lion Mtn Ss
Cap Mtn Ls Confining Unit
Hickory Ss Hickory Aquifer
Pre
cam
bri
an
Town Mountain Granite
Confining Units
Red Mountain Gneiss
Packsaddle Schist
Lost Creek Gneiss
Valley Springs Gneiss
Final Report: Identification of the Vulnerability of the Major and Minor Aquifers of Texas to Subsidence with Regard to Groundwater Pumping – TWDB Contract Number 1648302062
4-137
Figure 4.88. Cross-section of the Ellenburger-San Saba Aquifer along with overlying and underlying hydrogeologic units (George and others, 2011).
Overlying the Moore Hollow Group is the Ordovician aged Ellenburger Group which consists of the Tanyard, Gorman, and Honeycut Formations and generally encircles the Llano Uplift. The Tanyard Formation is divided into two members: the basal dolostone Threadgill Member and the overlying limestone Staendebach Member. Above the Tanyard Formation, the Gorman and Honeycut Formations are comprised of dolostones and limestones which complete the Ellenburger Group and the Ellenburger-San Saba Aquifer (Preston and others, 1996). The aquifer is highly permeable in places, as indicated by wells that yield as much as 1,000 gallons per minute and springs that issue from the aquifer maintaining the base flow of streams in the area.
Scattered discontinuously throughout the study area, Devonian and Mississippian aged formations consist of thin remnants of dark shales, petroliferous limestones, crinoidal limestone, chert breccias, fractured cherts, and microgranular limestones with bedded chert (Preston and others, 1996; Standen and Ruggiero, 2007). Where present, the formations act as confining layers between the Ellenburger-San Saba Aquifer and the Marble Falls Aquifer (Preston and others, 1996).
Final Report: Identification of the Vulnerability of the Major and Minor Aquifers of Texas to Subsidence with Regard to Groundwater Pumping – TWDB Contract Number 1648302062
4-138
Hydraulic Properties
Within the Ellenburger-San Saba Aquifer, hydraulic properties of transmissivity, storativity, and hydraulic conductivity have been examined extensively by Bluntzer (1992). Due to the heterogeneity of the aquifer, the hydraulic properties vary by several orders of magnitude. Table 4.33 provides a summary of the hydraulic properties calculated for the Ellenburger-San Saba Aquifer.
Table 4.33. Hydraulic properties for the Ellenburger-San Saba Aquifer.
Storativity 8.0 x 10⁻⁵ – 1.7 x 10⁻³ 1 References: (1) Bluntzer (1992), Shi and others (2016a)
Hydraulic Heads
The Ellenburger-San Saba Aquifer can be related in groundwater flow and direction to the other Paleozoic aquifers (that is, the overlying Marble Falls and underlying Hickory). The predominant force driving the movement of groundwater flow through this aquifer is gravity. Within outcrop areas, karstic features such as sinkholes and caves exist to allow for recharge and subsequent higher heads. Prior to the 1950s, water levels in the Ellenburger-San Saba were under steady state conditions. Fluctuations were influenced by natural cycles of recharge and discharge events. Water levels were estimated to be at an elevation of 1,600 feet MSL decreasing to 1,200 feet MSL in the eastern counties. Transient water levels have remained steady in this aquifer with the exception of three wells in Gillespie County showing a net decline from the 1980s to early 1990s.
Groundwater Pumping
Figure 4.89 provides a graph of the historic pumping volumes from the Ellenburger-San Saba Aquifer in the municipal, manufacturing, mining, and steam/electricity production, irrigation, and livestock sectors from 1980 to 2015. Withdrawal rates have stayed relatively constant since the 1980s averaging over 6,700 acre-feet per year. Withdrawals for municipal use is the dominant form of pumping in the Ellenburger-San Saba and accounts for approximately 60 percent of the production. Future demands for pumping are unlikely to increase significantly.
Final Report: Identification of the Vulnerability of the Major and Minor Aquifers of Texas to Subsidence with Regard to Groundwater Pumping – TWDB Contract Number 1648302062
4-139
Figure 4.89. Historic pumping volumes from the Ellenburger-San Saba Aquifer in the municipal, manufacturing, mining, and steam/electricity production, irrigation, and livestock sectors from 1980 to 2015 (TWDB, 2017b).
Final Report: Identification of the Vulnerability of the Major and Minor Aquifers of Texas to Subsidence with Regard to Groundwater Pumping – TWDB Contract Number 1648302062
4-140
Subsidence Vulnerability
Reported clay thickness within the Ellenburger-San Saba Aquifer is generally less than 10 feet. Clay thickness increases radially downdip within the aquifer, with clay thickness ranging from 0 to 882 feet resulting in an average SRV of 1.5 with a third quartile of 2. Figure 4.90 illustrates the clay thicknesses and regional distribution throughout the aquifer. The lithology of the aquifer is predominantly composed of carbonate limestone and dolostone with some consolidated clastic sediments. The clay layers within the aquifer are characterized as hard clay.
Figure 4.90. Calculated Ellenburger-San Saba Aquifer clay thickness at well locations.
Final Report: Identification of the Vulnerability of the Major and Minor Aquifers of Texas to Subsidence with Regard to Groundwater Pumping – TWDB Contract Number 1648302062
4-141
Water levels within the Ellenburger-San Saba Aquifer are generally stable with small fluctuations. Shi and others (2016a) noted that water level declines in the aquifer have been experienced in a small area of Gillespie County. We set the preconsolidation level at the well sites to the minimum water level from the calibrated GAM (Shi and others, 2016b). For the static water level, we used the simulated water level for 2017 from the MAG run for GMA 9 (Jones, 2017). We calculated the water level trend using all of the simulated water levels from the calibrated GAM (Shi and others, 2016b) and the GMA 9 adopted DFCs and MAG run for the DFC water levels. While most of the aquifer is located in GMA 7 with smaller portions in GMA 8 and GMA 9, we used the 2016 joint planning cycle GMA 9 MAG run results (Jones, 2017) for our analyses because, as of the time of our analysis, the 2016 joint planning cycle MAG simulations had not yet been conducted. Table 4.34 summarizes the data sources and values for each subsidence risk factor.
Table 4.34. Ellenburger-San Saba Aquifer subsidence risk factor data sources and summary.
Subsidence Risk Factor Variable Data Source Value
3rd Quartile SRV
Clay Layer Thickness and Extent
SDR lithology table 0 to 882 feet 2
Clay Compressibility Estimated based on lithology Hard Clay 1
Aquifer Lithology Shi and others (2016a) Carbonate/
Consolidated Clastic
2
Preconsolidation Characterization
Minimum water level from transient model simulations (Shi
and others, 2016b)
718 to 1,804 feet mean sea level
3
Predicted Water Level Decline based on Trend
Trend in simulated water levels from transient model simulations
(Shi and others, 2016b)
Less than 1-foot decline
2
Predicted DFC Water Level Decline
Estimate from adopted DFCs for GMA 9
2 feet decline 2
Results of the assessment suggest that the Ellenburger-San Saba Aquifer has a low to medium-low risk for future subsidence due to pumping. Figure 4.91 illustrates the subsidence risk factor for the Ellenburger-San Saba Aquifer.
Final Report: Identification of the Vulnerability of the Major and Minor Aquifers of Texas to Subsidence with Regard to Groundwater Pumping – TWDB Contract Number 1648302062
4-142
Figure 4.91. Ellenburger-San Saba Aquifer subsidence risk vulnerability at well locations.
Final Report: Identification of the Vulnerability of the Major and Minor Aquifers of Texas to Subsidence with Regard to Groundwater Pumping – TWDB Contract Number 1648302062
4-143
4.3.9 Hickory
The Hickory Aquifer consists of the water-bearing Hickory Sandstone member of the Riley Formation. Figure 4.92 shows the extent of the Hickory Aquifer extending radially from the Llano Uplift in the Central Texas area. The aquifer is considered to be the primary aquifer in the central portion of the Llano Uplift region and reaches a maximum thickness of approximately 480 feet.
Figure 4.92. Hickory Aquifer extent.
Final Report: Identification of the Vulnerability of the Major and Minor Aquifers of Texas to Subsidence with Regard to Groundwater Pumping – TWDB Contract Number 1648302062
4-144
Hydrostratigraphy
The Hickory Aquifer consists of the Hickory Sandstone of the Riley Formation. Like the Ellenburger-San Saba Aquifer, the unconfined portion of the aquifer crops out in a circular pattern around the Llano Uplift. The Llano Uplift is a structural high dome consisting of Precambrian rocks, much of which are igneous granites and other metamorphics aging up to over 1.36 billion years (Reese and others, 2000). Metamorphosis including compression and folding occurred approximately 1.2 billion years ago with multi-directional fracturing (Johnson, 2004).
The complex Precambrian formations which make up the structural base in the area are composed of a sequence of meta-sedimentary and meta-igneous rock, with scattered intrusive igneous rock. Major meta-sedimentary units include the Packsaddle Schist and the Valley Spring Gneiss; meta-igneous units include the Coal Creek Serpentine, the Big Spring Gneiss, and the Red Mountain Gneiss. Igneous rocks include the Llanite Quartz Porphyry, the Sixmile Granite, the Oatman Creek Granite, and the Town Mountain Granite (Preston and others, 1996). In general, these rocks crop out in the center of the uplift and act as confining units to overlying aquifers. Rocks overlying the Precambrian Base dip radially away from the dome structure with high variability in magnitude, ranging from a few feet to over 100 feet per mile (Barnes and Bell, 1977). Table 4.35 provides a stratigraphic column of the geologic units near the Llano Uplift; Figure 4.93 provides a cross-section of a portion of the Hickory Aquifer with overlying and underlying hydrogeologic units near Gillespie County.
Stratigraphically above the Precambrian base lies the Cambrian aged Moore Hollow Group which consists of the Riley and Wilberns Formations. The oldest member of the Riley Formation is the Hickory Sandstone consisting of crossbedded terrestrial and marine quartz sandstones, siltstones, and mudstones which make up the Hickory Aquifer. In some areas, the sandstones are composed of grains from the igneous granitic rocks of the Llano Uplift. The granitic rocks contain minerals which are a source of radium and in certain areas can be detected in groundwater pumped from the Hickory Aquifer. The major faulting associated with the Llano Uplift has influenced the flow of groundwater and the production ability of the Hickory Aquifer in this area. Faults have caused portions of the aquifer to become compartmentalized which restrict groundwater flow in some areas and increase production in other portions of the aquifer.
In certain areas the Cap Mountain limestone overlies the Hickory, acting as a confining unit. The youngest member of the Riley Formation, the Lion Mountain Sandstone, is intermittently found overlying the Cap Mountain Limestone. The Welge Sandstone, the oldest member of the Wilberns Group, is hydraulically connected to the Lion Mountain forming the Mid-Cambrian Aquifer. The Morgan Creek Limestone and the Point Peak Shale are found directly above the Welge Sandstone and act as a confining unit between the Mid-Cambrian and the Ellenburger-San Saba aquifers. Completing the Wilberns Group is the San Saba Limestone which is the stratigraphically lowest part of the Ellenburger-San Saba Aquifer (Barnes and Bell, 1977; Preston and others, 1996).
Final Report: Identification of the Vulnerability of the Major and Minor Aquifers of Texas to Subsidence with Regard to Groundwater Pumping – TWDB Contract Number 1648302062
4-145
Table 4.35. Stratigraphic column of the Hickory illustrating the hydrogeologic units (Preston and others, 1996).
Era System Group Formation Member Hydrogeologic
Unit
CZ
Quaternary Pleistocene to Recent floodplain (alluvium
and fluviatile terrace deposits)
Localized Alluvium
Mes
ozo
ic
Cretaceous
Edwards
Segovia
Edwards Plateau Aquifer
Ed
war
ds-
Tri
nit
y A
qu
ifer
Fort Terrett
Kirschberg Evaporite
Dolomitic
Burrowed
Basal Nodular Confining
Unit
Trinity
Glen Rose Limestone Upper
Upper Trinity Aquifer
Lower
Middle Trinity Aquifer
Tra
vis
Pea
k E
qu
ival
ent Hensell Sand
Bexar Shale
Cow Creek Limestone
Hammett Shale Confining Unit
Sligo Sycamore Sand
Hosston
Lower Trinity Aquifer
Pal
eozo
ic
Pennsylvanian
Canyon Undivided Undivided
Confining Units Strawn Undivided
Bend Smithwick
Marble Falls Limestone Marble Falls
Aquifer
Mississippian and Devonian
Mississippian and Devonian Undivided Rocks Confining Units
Ordovician Ellenburger
Honeycut Undivided
Ellenburger-San Saba Aquifer
Gorman Undivided
Tanyard Staendebach
Threadgill
Cambrian Moore Hollow
Wilberns
San Saba
Point Peak Confining Units
Morgan Ck Ls
Welge Ss Mid-Cambrian Aquifer
Riley
Lion Mtn Ss
Cap Mtn Ls Confining Unit
Hickory Ss Hickory Aquifer
Pre
cam
bri
an
Town Mountain Granite
Confining Units
Red Mountain Gneiss
Packsaddle Schist
Lost Creek Gneiss
Valley Springs Gneiss
Final Report: Identification of the Vulnerability of the Major and Minor Aquifers of Texas to Subsidence with Regard to Groundwater Pumping – TWDB Contract Number 1648302062
4-146
Figure 4.93. Cross-section of the Hickory Aquifer along with overlying and underlying hydrogeologic units (George and others, 2011).
Hydraulic Properties
Within the Hickory Aquifer, hydraulic properties of transmissivity, storativity, and hydraulic conductivity have been examined extensively by Shi and others (2016a). Due to the heterogeneity and structural disconformity of the aquifer, the hydraulic properties vary by several orders of magnitude. Table 4.36 provides a summary of the hydraulic properties calculated for the Hickory Aquifer.
Table 4.36. Hydraulic properties for the Hickory Aquifer.
Storativity 3.7 x 10⁻⁵ – 1.0 x 10⁻⁴ 1 References: (1) Shi and others (2016a)
Hydraulic Heads
The groundwater trends of the Hickory Aquifer associated with the other Paleozoic aquifers are from areas of high water level elevations to low water level elevations as well as from areas of recharge to discharge. The groundwater movement is controlled by several factors such as: 1) hydraulic gradient, 2) rock permeability distribution, 3) orientation of bedding plane, and 4) faulting and fractures. Withdrawals from wells can induce change to the direction and rate of groundwater movement throughout the aquifer,
Final Report: Identification of the Vulnerability of the Major and Minor Aquifers of Texas to Subsidence with Regard to Groundwater Pumping – TWDB Contract Number 1648302062
4-147
especially if withdrawal occurs along faults acting as hydraulic barriers between aquifer units (Bluntzer, 1992). Generally, gradients are from the Llano Uplift toward deeper parts of the aquifer.
Groundwater Pumping
Discharge for the Hickory Aquifer occurs through various springs and channel seepage. Seepage is produced from the base flow of effluent streams (Bluntzer, 1992). Other sources of discharge come from well withdrawals for irrigation, municipal, and other practices. In the Hickory Aquifer, the predominant use of water is for agricultural purposes followed by municipal and most recently mining uses. Figure 4.94 provides a graph of the historic pumping volumes from the Hickory Aquifer in the municipal, manufacturing, mining, and steam/electricity production, irrigation, and livestock sectors from 1980 to 2015. Overall, pumping rates generally declined from 1980 through 2000 and have since remained relatively constant typically ranging between 15,000 and 20,000 acre-feet per year.
Figure 4.94. Historic pumping volumes from the Hickory Aquifer in the municipal, manufacturing, mining, and steam/electricity production, irrigation, and livestock sectors from 1980 to 2015 (TWDB, 2017b).
Final Report: Identification of the Vulnerability of the Major and Minor Aquifers of Texas to Subsidence with Regard to Groundwater Pumping – TWDB Contract Number 1648302062
4-148
Subsidence Vulnerability
Reported clay thickness within the Hickory Aquifer is generally less than 5 feet. Most wells are completed within or near the unconfined zone of the aquifer where there is little clay. Within the aquifer, clay thickness increases radially downdip, with clay thickness ranging from 0 to 754 feet resulting in an average SRV of 1.4 with a third quartile of 2. Figure 4.95 illustrates the clay thicknesses and regional distribution throughout the aquifer. The lithology of the aquifer is predominantly composed of sandstone (consolidated clastic) with some carbonates. The clay layers within the aquifer are characterized as hard clay.
Figure 4.95. Calculated Hickory Aquifer clay thickness at well locations.
Final Report: Identification of the Vulnerability of the Major and Minor Aquifers of Texas to Subsidence with Regard to Groundwater Pumping – TWDB Contract Number 1648302062
4-149
Water levels within the Hickory Aquifer are generally stable with small fluctuations. Shi and others (2016a) noted that water level increases have been documented in a well in Gillespie County and water level declines have been experienced in a well within McCulloch County. We set the preconsolidation level at the well sites to the minimum water level from the calibrated GAM (Shi and others, 2016b). For the static water level, we used the simulated water level for 2017 from the MAG run (Jones, 2017). We calculated the water level trend using all of the simulated water levels from the calibrated GAM (Shi and others, 2016b) and the GMA 9 adopted DFCs and MAG run for the DFC water levels. While most of the aquifer is located in GMA 7 with smaller portions in GMA 8 and GMA 9, we used the 2016 joint planning cycle GMA 9 MAG run results (Jones, 2017) for our analyses because, as of the time of our analysis, the 2016 joint planning cycle MAG simulations had not yet been conducted. Table 4.37 summarizes the data sources and values for each subsidence risk factor.
Table 4.37. Hickory Aquifer subsidence risk factor data sources and summary.
Subsidence Risk Factor Variable Data Source Value
3rd Quartile SRV
Clay Layer Thickness and Extent
SDR lithology table 0 to 754 feet 2
Clay Compressibility Estimated based on lithology Hard Clay 1
Aquifer Lithology Shi and others (2016a) Consolidated
Clastic 3
Preconsolidation Characterization
Minimum water level from transient model simulations (Shi
and others, 2016b)
754 to 1,857 feet mean sea level
3
Predicted Water Level Decline based on Trend
Trend in simulated water levels from transient model simulations
(Shi and others, 2016b)
Less than 1-foot decline
2
Predicted DFC Water Level Decline
Estimate from adopted DFCs for GMA 9
Less than 1-foot decline
2
Results of the assessment suggest that the Hickory Aquifer has a low risk for future subsidence due to pumping. Figure 4.96 illustrates the subsidence risk factor for Hickory Aquifer.
Final Report: Identification of the Vulnerability of the Major and Minor Aquifers of Texas to Subsidence with Regard to Groundwater Pumping – TWDB Contract Number 1648302062
4-150
Figure 4.96. Hickory Aquifer subsidence risk vulnerability at well locations.
Final Report: Identification of the Vulnerability of the Major and Minor Aquifers of Texas to Subsidence with Regard to Groundwater Pumping – TWDB Contract Number 1648302062
4-151
4.3.10 Igneous
The Igneous Aquifer is located in west Texas between the Marathon and Capitan Reef aquifers to the east, and the western extent of West Texas Bolsons Aquifer to the west. Figure 4.97 shows the extent of the aquifer. The Igneous Aquifer is Tertiary in age and is composed of lava flows, tuffs, and additional intrusive rocks (Ashworth and Hopkins, 1995). The City of Alpine and some other communities use the Igneous Aquifer as a municipal water supply (Ashworth and Hopkins, 1995). The total area of the aquifers is approximately 6,000 square miles and topographic relief is greater than 5,000 feet across the aquifer (Beach and others, 2004a).
Figure 4.97. Igneous Aquifer extent.
Final Report: Identification of the Vulnerability of the Major and Minor Aquifers of Texas to Subsidence with Regard to Groundwater Pumping – TWDB Contract Number 1648302062
4-152
Hydrostratigraphy
Over 40 named volcanic units, mainly of Tertiary age, comprise the Igneous Aquifer. No single volcanic event created the aquifer. Rather, several volcanic events created a series of interbedded vents and flows, with volcanic-sedimentary units with intrusive igneous units present as well (Chastain-Howley, 2001). The tertiary volcanic units are generally over 1,000 feet thick and is up to 6,000 feet thick in Jeff Davis County (George and others, 2011). The Igneous Aquifer is underlain by Cretaceous and Paleozoic units on top of Precambrian basement rocks. Figure 4.98 shows a cross-section of the Igneous Aquifer illustrating the approximate formation thicknesses in the area and associated geologic units.
The hydrogeology of the Igneous Aquifer is extremely complex owing to its complex geology. Water bearing zones in igneous rocks with primary porosity (vesicular basalts, interflow zones in lava successions, sandstones, conglomerates and breccia) are the best water-bearing zones. Secondary porosity from faults and fractures increases yields within the shallower igneous layers (George and others, 2011).
Hydraulic Properties
Hydrogeological properties of the Igneous Aquifer vary greatly. The geometric mean of aquifer transmissivity from 24 available pumping tests identified for the groundwater availability model of the Igneous Aquifer is 138 square feet per day. The median value of estimated hydraulic conductivity is approximately 0.75 feet per day with a range between about 0.003 and 300 feet per day. The calibrated model hydraulic conductivity ranged between 0.02 and 1 feet per day and storativity ranged between 3x10⁻⁵ to 2x10⁻⁴ from a few pumping tests in the northwest portion of the aquifer (Beach and others, 2004a).
Hydraulic Heads
Regional heads form a radial pattern emanating from near the central portion of the Igneous Aquifer (Beach and others, 2004a). Water level trends in wells measured by the Texas Water Development Board generally show no significant declines (George and others, 2011). One well near the City of Alpine has shown approximately 180 feet of head decline since 1960 (Beach and others, 2004a). Water levels are between approximately 3,000 and over 6,600 feet above mean sea level within the Igneous Aquifer (Beach and others, 2004a).
Final Report: Identification of the Vulnerability of the Major and Minor Aquifers of Texas to Subsidence with Regard to Groundwater Pumping – TWDB Contract Number 1648302062
4-153
Figure 4.98. Geologic cross-section of the Igneous Aquifer and associated geologic units (George and others, 2011).
Final Report: Identification of the Vulnerability of the Major and Minor Aquifers of Texas to Subsidence with Regard to Groundwater Pumping – TWDB Contract Number 1648302062
4-154
Groundwater Pumping
Municipal wells in Alpine, Fort Davis, and Marfa are the major water users of the aquifer in addition to the irrigation pumping. Overall, pumping from the aquifer is small due to the relatively low populations of these cities (Ashworth and Hopkins, 1995). Groundwater use in 1997 in the Jeff Davis, Brewster, and Presidio counties was less than 5,000 acre-feet per year (Chastain-Howley, 2001). Reported water use in 2003 was 7,000 acre-feet (George and others, 2011).
Total estimated recoverable storage from the aquifer is approximately 64 million acre-feet (Boghici and others, 2014). However, under drought-of-record conditions the Far West Texas Water Planning Group (FWRWPG, 2010) indicates that approximately 14,000 acre-feet per year is available for withdrawal. Figure 4.99 provides a graph of the historic pumping volumes from the Igneous Aquifer in the municipal, manufacturing, mining, and steam/electricity production, irrigation, and livestock sectors from 1980 to 2015. Generally, the pumping demand increased from 1990 through the mid-2000s and has since declined.
Figure 4.99. Historic pumping volumes from the Igneous Aquifer in the municipal, manufacturing, mining, and steam/electricity production, irrigation, and livestock sectors from 1980 to 2015 (TWDB, 2017b).
Final Report: Identification of the Vulnerability of the Major and Minor Aquifers of Texas to Subsidence with Regard to Groundwater Pumping – TWDB Contract Number 1648302062
4-155
Subsidence Vulnerability
Clay thickness within the Igneous Aquifer is generally less than 10 feet with a few locations having reportedly significantly thicker clays. However, due to most of the wells having a relatively thin clay thickness the average SRV is 1.2 with the third quartile of 1. Figure 4.100 provides the clay thickness at well locations and the regional distribution of the thicknesses. George and others (2011) describe the lithology of the Igneous Aquifer “as a complex series of welded pyroclastic rock, lava, and volcaniclastic sediments” which we categorized as igneous lithology with hard clay (SRV = 1)
Figure 4.100. Calculated Igneous Aquifer clay thickness at well locations.
Final Report: Identification of the Vulnerability of the Major and Minor Aquifers of Texas to Subsidence with Regard to Groundwater Pumping – TWDB Contract Number 1648302062
4-156
For our evaluation we used measured water level data from the Texas Water Development Board Groundwater Database (2017a) instead of the local flow model. For wells without any measurements, the nearest measurement was used with water level trends based upon available measurements. Preconsolidation and static water levels were based upon the minimum water level and the most recent water level, respectively resulting in a SRV of 3. Table 4.38 summarizes the data sources and values for each subsidence risk factor.
Table 4.38. Igneous subsidence risk factor data sources and summary.
Subsidence Risk Factor Variable Data Source Value
3rd Quartile SRV
Clay Layer Thickness and Extent
SDR lithology table 0 to 390 feet 1
Clay Compressibility George and others (2011) Hard Clay 1 Aquifer Lithology George and others (2011) Igneous 1 Preconsolidation Characterization
Water level from measured data (TWDB, 2017a)
389 to 5,838 feet mean sea level
3
Predicted Water Level Decline based on Trend
Trend from measured water levels (TWDB, 2017a)
No change 1
Predicted DFC Water Level Decline
Oliver (2011a) Average 28 feet
decline 2
Results of the assessment suggest that the Igneous Aquifer has a low risk for future subsidence due to pumping. Figure 4.101 illustrates the subsidence risk factor throughout the aquifer.
Final Report: Identification of the Vulnerability of the Major and Minor Aquifers of Texas to Subsidence with Regard to Groundwater Pumping – TWDB Contract Number 1648302062
4-157
Figure 4.101. Igneous Aquifer subsidence risk vulnerability at well locations.
Final Report: Identification of the Vulnerability of the Major and Minor Aquifers of Texas to Subsidence with Regard to Groundwater Pumping – TWDB Contract Number 1648302062
4-158
4.3.11 Lipan
The Lipan extends across numerous counties in the west-central Texas area. Figure 4.102 provides a map of the aquifer extent. Alluvial deposits comprise the water-bearing units for this aquifer that overlie Permian aged limestones, shales, and dolomites (Ashworth and Hopkins, 1995). These Permian aged formations are hydrologically continuous with the overlying Quaternary Leona Formation and Alluvium. The Lipan Aquifer produces fresh to slightly saline water that is used to support the farming industry in both the Tom Green and Concho counties.
Figure 4.102. Lipan Aquifer extent.
Final Report: Identification of the Vulnerability of the Major and Minor Aquifers of Texas to Subsidence with Regard to Groundwater Pumping – TWDB Contract Number 1648302062
4-159
Hydrostratigraphy
The Lipan Aquifer is comprised of seven hydrologic units with the youngest of Quaternary aged alluvium overlying Permian aged shales and limestones of the Clear Fork and Pease River Groups (Lee, 1986). The contact between the Quaternary and Permian units is not abrupt. An undulating erosional surface characterized by differential weathering of the Permian formations forms the basal portion of the Lipan Aquifer. Edwards-Trinity (Plateau) Aquifer formations of Cretaceous age outcrop to the north, west, and south, and represent the lateral extent of the Lipan Aquifer in those directions. Those formations have been eroded away in the area where the Lipan Aquifer is situated allowing contact with the Permian units. At this contact point streams and springs are found to drain water from the Edwards-Trinity (Plateau) Aquifer into the Quaternary aged Leona Formation and alluvium of the Lipan Aquifer. Table 4.39 provides a stratigraphic column of the geologic units associated with the Lipan Aquifer and Figure 4.103 provides cross-sections of the aquifer in Tom Green County, Texas.
Each of the underlying Permian units within the Lipan Aquifer yield small quantities of water. In general, they are composed of alternating layers of marly limestone, shale, sandstone, and gypsum. The Permian formations of limestones and shales have a westward dip towards the Midland Basin of approximately 50 feet per mile. The youngest Quaternary-aged sediment of the Leona Formation and alluvium is the most water-bearing unit with conglomerates and limestones cemented with sandy limestone. Previous assessments of the Lipan Aquifer have shown that higher production corresponds to the Leona Formation where the alluvial deposits are thicker (Beach and others, 2004b). In terms of production for pumping usage, the Permian-aged Bullwagon Formation provides abundant amounts of water for irrigation. In the other layers of the Clear Fork Group water quantities are lower in the limestone layers.
Table 4.39. Hydrostratigraphic column of the Lipan Aquifer (Lee, 1986; Beach and others, 2004b).
System Series/Group Formation Hydrologic Unit
Quaternary Holocene
Alluvium, fluviatile terrace, playa, pond, and windblown deposits
Final Report: Identification of the Vulnerability of the Major and Minor Aquifers of Texas to Subsidence with Regard to Groundwater Pumping – TWDB Contract Number 1648302062
4-160
Figure 4.103. Cross-sections of the Lipan Aquifer in Tom Green County (Beach and others, 2004b).
Hydraulic Properties
There is limited information on published hydraulic properties in the Lipan Aquifer. Estimated specific capacity data from available driller’s logs in the area were utilized to calculate transmissivity and hydraulic conductivity for the aquifer after Mace (2001). Specific yield values were first estimated based on lithology and then adjusted during transient calibration during the GAM development (Beach and others, 2004b). Table 4.40 provides a summary of the hydraulic properties calculated for the Lipan Aquifer.
Table 4.40. Hydraulic properties for the Lipan Aquifer.
Storativity 0.5 x 10⁻³ – 0.3 1 References: (1) Beach and others (2004b)
Hydraulic Heads
Beach and others (2004b) evaluated the potentiometric surfaces to determine that regional groundwater flow is generally into the Lipan Aquifer from water-bearing units located to the north, south, and west. Seeps, springs, and evapotranspiration are the sources of natural discharge within the Lipan Aquifer. The Concho River acts as an area of both discharge during high levels of groundwater and recharge when groundwater levels are particularly low. Sources of recharge for the Lipan Aquifer include infiltration of
Final Report: Identification of the Vulnerability of the Major and Minor Aquifers of Texas to Subsidence with Regard to Groundwater Pumping – TWDB Contract Number 1648302062
4-161
precipitation, cross-formational inflow from the Edwards-Trinity (Plateau) Aquifer, stream loss, and irrigation return flow (Beach and others, 2004b).
Factors that can control the sources of recharge for infiltration of precipitation can be the properties of soil such as: thickness and permeability. Stream loss occurs when groundwater drops below stream bed level; this recharge comes in the form of leakage. Irrigation return flow occurs when water that is not received from crops is returned to the groundwater areas.
Groundwater Pumping
Figure 4.104 provides a graph of the historic pumping volumes from the Lipan Aquifer in the municipal, manufacturing, mining, and steam/electricity production, irrigation, and livestock sectors from 1980 to 2015. The primary use for water for the Lipan Aquifer is for irrigation. Development in the early 1990s has led to population growth in the San Angelo area, resulting in higher water demand from the aquifer for municipal use. Pivot irrigation was also reported to have become more popular during this time (Beach and others, 2004b).
Figure 4.104. Historic pumping volumes from the Lipan Aquifer in the municipal, manufacturing, mining, and steam/electricity production, irrigation, and livestock sectors from 1980 to 2015 (TWDB, 2017b).
Final Report: Identification of the Vulnerability of the Major and Minor Aquifers of Texas to Subsidence with Regard to Groundwater Pumping – TWDB Contract Number 1648302062
4-162
Subsidence Vulnerability
Calculated clay thickness within the Lipan Aquifer is uniform and generally less than two feet across the aquifer. The average SRV based on clay thickness and extent is 1.4 with a third quartile of 2. Figure 4.105 illustrates the clay thickness at well locations and regional distribution of the thicknesses. The lithology of the aquifer is predominantly composed of marly limestone, shale, sandstone and gypsum characterized as unconsolidated clastics resulting in an average SRV of 4. The clay layers within the aquifer are characterized as stiff clay.
Figure 4.105. Calculated Lipan Aquifer clay thickness at well locations.
Final Report: Identification of the Vulnerability of the Major and Minor Aquifers of Texas to Subsidence with Regard to Groundwater Pumping – TWDB Contract Number 1648302062
4-163
Water levels throughout the aquifer are generally stable with no significant changes (Beach and others, 2004b). For the Lipan Aquifer, we assigned a preconsolidation level equal to the lowest water level measurement for the well (TWDB, 2017a). We set the static water level to the most recent measurement available. If a well did not have a water level measurement, we used measurements from the nearest available well. These values resulted in an average preconsolidation SRV of 2.6 with a third quartile of 3. We determined the water level trend using all of the available water level measurements from a well or nearest well, as applicable. Table 4.41 summarizes the data sources and values for each subsidence risk factor.
Table 4.41. Lipan Aquifer subsidence risk factor data sources and summary.
Subsidence Risk Factor Variable Data Source Value
3rd Quartile SRV
Clay Layer Thickness and Extent
SDR lithology table 0 to 165 feet 2
Clay Compressibility Estimated based on lithology Stiff Clay 2 Aquifer Lithology Carbonate 4 Preconsolidation Characterization
Lowest measured water level (TWDB, 2017a)
1,590 to 2,550 feet mean sea level
3
Predicted Water Level Decline based on Trend
Based on available measurements (TWDB, 2017a)
No change 1
Predicted DFC Water Level Decline
Not Applicable 1
Results of the assessment suggest that the Lipan Aquifer has a low risk for future subsidence due to pumping. Figure 4.106 illustrates the calculated subsidence risk for the Lipan Aquifer.
Final Report: Identification of the Vulnerability of the Major and Minor Aquifers of Texas to Subsidence with Regard to Groundwater Pumping – TWDB Contract Number 1648302062
4-164
Figure 4.106. Lipan Aquifer subsidence risk vulnerability at well locations.
Final Report: Identification of the Vulnerability of the Major and Minor Aquifers of Texas to Subsidence with Regard to Groundwater Pumping – TWDB Contract Number 1648302062
4-165
4.3.12 Marathon
The Marathon Aquifer is a fractured limestone aquifer located in northern Brewster County in the Trans-Pecos region of west Texas. Figure 4.107 provides a map showing the extent of the Marathon Aquifer. The aquifer is situated within the Marathon Basin, an uplifted portion of the Ouachita fold belt bounded on the north and west by the Glass Mountains and Del Norte Mountains, respectively (Smith, 2001). The aquifer is a major source of municipal water for the town of Marathon. It also provides water to livestock farmers and rural homesteaders in the area around Marathon.
Figure 4.107. Marathon Aquifer extent.
Final Report: Identification of the Vulnerability of the Major and Minor Aquifers of Texas to Subsidence with Regard to Groundwater Pumping – TWDB Contract Number 1648302062
4-166
Hydrostratigraphy
The water-bearing unit for the Marathon Aquifer is the Ordovician-age Marathon Limestone. Table 4.42 provides a hydrostratigraphic column of the geologic units associated with the aquifer. The aquifer is bounded vertically by the overlying Alsate Shale and the underlying Dagger Flat Sandstone. The Marathon Aquifer ranges in thickness from 900 feet in the town of Marathon at the north end of the Marathon Basin and decreases to approximately 350 feet at the southern portion of the basin. The lithology of the Marathon Limestone consists of dark-gray flaggy limestone with gray or green shale (DeCook, 1961). Within the limestone are interbedded sandstones and conglomerates containing limestone and shale.
Hydraulic Properties
Groundwater occurs in numerous crevices, joints, and cavities at depths ranging from 350 feet to about 900 feet and well yields range from 10 gallons per minute to more than 300 gallons per minute. Typically, larger well yields are associated with areas influenced by faulting. Specific hydraulic data, such as hydraulic conductivity, transmissivity, and storativity values are limited. Boghici and others (2014) utilized an estimated storativity value of 0.03 for the Marathon Aquifer to assess future groundwater availability. The Far West Texas Water Planning Group (FWRWPG, 2010) performed aquifer tests on four wells near the northern boundary of the Marathon Aquifer in order to document the hydraulic properties. Table 4.43 provides a summary of the findings.
Hydraulic Heads
Geologic structure is the dominant controlling factor for the movement and direction of groundwater flow in the Marathon Aquifer. Due to the folding, portions of the aquifer have been raised to shallow depths where it is under unconfined conditions. However, in areas where a structural syncline is present, the Marathon Limestone is under artesian pressure. The groundwater moves by gravity through joints and cavities of the limestone from recharge areas to lower levels of natural discharge. In general, groundwater in the Marathon Basin moves southward and southeastward toward the Rio Grande. This groundwater movement reflects the surface topography and the general drainage pattern of the area. Groundwater pumping near the City of Marathon may locally impact groundwater flow (Smith, 2001).
Groundwater Pumping
According to data compiled from the TWDB water use survey, demand from the Marathon Aquifer has not been excessive, most likely due to its location. Figure 4.108 provides a graph of the historic pumping volumes from the Marathon Aquifer in the municipal, manufacturing, mining, and steam/electricity production, irrigation, and livestock sectors from 1980 to 2015. Since 2000, irrigation has progressively become a major use for this aquifer surpassing municipal use in some years. Since 1980, the average pumping rate of the Marathon Aquifer is approximately 170 acre-feet/year, with municipal use being 57 percent of the total pumpage.
Final Report: Identification of the Vulnerability of the Major and Minor Aquifers of Texas to Subsidence with Regard to Groundwater Pumping – TWDB Contract Number 1648302062
4-167
Table 4.42. Stratigraphic column of the Marathon illustrating the hydrogeologic units (Smith, 2001).
Final Report: Identification of the Vulnerability of the Major and Minor Aquifers of Texas to Subsidence with Regard to Groundwater Pumping – TWDB Contract Number 1648302062
4-168
Table 4.43. Hydraulic properties for the Marathon Aquifer.
Storativity 1.0 x 10⁻³ – 3.0 x 10⁻² 1, 2 References: (1) Far West Texas Water Planning Group (FWRWPG, 2010); (2) Boghici and others (2014)
Figure 4.108. Historic pumping volumes from the Marathon Aquifer in the municipal, manufacturing, mining, and steam/electricity production, irrigation, and livestock sectors from 1980 to 2015 (TWDB, 2017b).
Final Report: Identification of the Vulnerability of the Major and Minor Aquifers of Texas to Subsidence with Regard to Groundwater Pumping – TWDB Contract Number 1648302062
4-169
Subsidence Vulnerability
There is no reported clay thickness within the Marathon Aquifer resulting in a SRV based on clay thickness and extent of 1. Figure 4.109 illustrates the clay thickness at well locations and regional distribution of the thicknesses. The aquifer is composed of limestone with some sandstone and conglomerates interbedded (SRV = 2).
Figure 4.109. Calculated Marathon Aquifer clay thickness at well locations.
For the Marathon Aquifer, we assigned a preconsolidation level equal to the lowest water level measurement for the well (TWDB, 2017a). We set the static water level as the most recent measurement available. If a well did not have a water level measurement, we used
Final Report: Identification of the Vulnerability of the Major and Minor Aquifers of Texas to Subsidence with Regard to Groundwater Pumping – TWDB Contract Number 1648302062
4-170
measurements from the nearest available well. These values resulted in an average preconsolidation SRV of 2.5 with a third quartile of 3. We determined the water level trend using all of the available water level measurements from a well or nearest well, as applicable. Table 4.44 summarizes the data sources and values for each subsidence risk factor.
Table 4.44. Marathon Aquifer subsidence risk factor data sources and summary.
Subsidence Risk Factor Variable Data Source Value
3rd Quartile SRV
Clay Layer Thickness and Extent
SDR lithology table 0 feet 1
Clay Compressibility Estimated based on lithology Not Applicable 1 Aquifer Lithology George and others (2011) Carbonate 2 Preconsolidation Characterization
Lowest measured water level (TWDB, 2017a)
835 to 4,137 feet mean sea level
3
Predicted Water Level Decline based on Trend
Based on available measurements (TWDB, 2017a)
Less than 1-foot decline
2
Predicted DFC Water Level Decline
Not Applicable 1
Results of the assessment suggest that the Marathon Aquifer has a low risk for future subsidence due to pumping. Figure 4.110 illustrates the calculated subsidence risk for the Marathon Aquifer.
Final Report: Identification of the Vulnerability of the Major and Minor Aquifers of Texas to Subsidence with Regard to Groundwater Pumping – TWDB Contract Number 1648302062
4-171
Figure 4.110. Marathon Aquifer subsidence risk vulnerability at well locations.
Final Report: Identification of the Vulnerability of the Major and Minor Aquifers of Texas to Subsidence with Regard to Groundwater Pumping – TWDB Contract Number 1648302062
4-172
4.3.13 Marble Falls
The Marble Falls Aquifer occurs in several separated outcrops along the northern and eastern flanks of the Llano Uplift region of Central Texas. Figure 4.111 provides a map of the aquifer’s extent. The aquifer is composed of the Marble Falls Limestone, which contains groundwater in fractures, solution cavities, and channels.
Figure 4.111. Marble Falls Aquifer extent.
Final Report: Identification of the Vulnerability of the Major and Minor Aquifers of Texas to Subsidence with Regard to Groundwater Pumping – TWDB Contract Number 1648302062
4-173
Hydrostratigraphy
The Marble Falls Aquifer is comprised solely of the Marble Falls Limestone, a fossiliferous Pennsylvanian-aged, fine-grained, cherty limestone. Table 4.45 provides a stratigraphic column showing hydrogeologic units associated with the Marble Falls Aquifer. The unconfined portion of the aquifer crops out in a semicircular pattern around the north side of the Llano Uplift. The Llano Uplift is a structural high dome consisting of Precambrian rocks, much of which are igneous granites and other metamorphics aging up to over 1.36 billion years (Reese and others, 2000). Metamorphosis including compression and folding occurred approximately 1.2 billion years ago with multi-directional fracturing (Johnson, 2004).
Scattered discontinuously throughout the study area, Devonian and Mississippian aged formations consist of thin remnants of dark shales, petroliferous limestones, crinoidal limestone, chert breccias, fractured cherts, and microgranular limestones with bedded chert (Preston and others, 1996; Standen and Ruggiero, 2007). Where present, the formations act as confining layers between the Ellenburger-San Saba Aquifer and the Marble Falls Aquifer (Preston and others, 1996).
Pennsylvanian aged rocks unconformably overlie either the Ellenburger Group or the Devonian-Mississippian Formations. Groups making up this system include the Bend, Canyon, and Strawn Groups. The oldest member of the Bend Group is the Marble Falls Limestone, which is locally divided and makes up the Marble Falls Aquifer. The lower unit consists of massive limestone and reef deposits and the upper unit consists of fine grained bedded limestone with chert nodules and beds. The overlying Smithwick Formation consists of interbedded claystone, siltstone, and sandstone. Above the Bend Group are the Strawn and Canyon Groups comprised of limestones, shales, and fine grained sandstones. Together with the Smithwick Formation, these groups act as confining units above the Marble Falls Aquifer (Preston and others, 1996).
Cretaceous-aged rocks overlie the Pennsylvanian system. In some areas, the Canyon and Strawn sediments are thin or not present, resulting in a hydraulic connection between the Cretaceous and Paleozoic units. Formations comprising the Lower Trinity Aquifer include, from oldest to youngest, the Hosston Sand Member and Sligo Limestone Member of the Travis Peak Formation. Updip in some parts of the outcrop, the equivalent rocks of the Hosston and Sligo are called the Sycamore sand.
Final Report: Identification of the Vulnerability of the Major and Minor Aquifers of Texas to Subsidence with Regard to Groundwater Pumping – TWDB Contract Number 1648302062
4-174
Table 4.45. Stratigraphic column of the Marble Falls illustrating the hydrogeologic units (Preston and others, 1996).
Era System Group Formation Member Hydrogeologic
Unit
CZ
Quaternary Pleistocene to Recent floodplain (alluvium
and fluviatile terrace deposits)
Localized Alluvium
Mes
ozo
ic
Cretaceous
Edwards
Segovia
Edwards Plateau Aquifer
Ed
war
ds-
Tri
nit
y A
qu
ifer
Fort Terrett
Kirschberg Evaporite
Dolomitic
Burrowed
Basal Nodular Confining
Unit
Trinity
Glen Rose Limestone Upper
Upper Trinity Aquifer
Lower
Middle Trinity Aquifer
Tra
vis
Pea
k E
qu
ival
ent Hensell Sand
Bexar Shale
Cow Creek Limestone
Hammett Shale Confining Unit
Sligo Sycamore Sand
Hosston
Lower Trinity Aquifer
Pal
eozo
ic
Pennsylvanian
Canyon Undivided Undivided
Confining Units Strawn Undivided
Bend Smithwick
Marble Falls Limestone Marble Falls
Aquifer
Mississippian and Devonian
Mississippian and Devonian Undivided Rocks Confining Units
Ordovician Ellenburger
Honeycut Undivided
Ellenburger-San Saba Aquifer
Gorman Undivided
Tanyard Staendebach
Threadgill
Cambrian Moore Hollow
Wilberns
San Saba
Point Peak Confining Units
Morgan Ck Ls
Welge Ss Mid-Cambrian Aquifer
Riley
Lion Mtn Ss
Cap Mtn Ls Confining Unit
Hickory Ss Hickory Aquifer
Pre
cam
bri
an
Town Mountain Granite
Confining Units
Red Mountain Gneiss
Packsaddle Schist
Lost Creek Gneiss
Valley Springs Gneiss
Final Report: Identification of the Vulnerability of the Major and Minor Aquifers of Texas to Subsidence with Regard to Groundwater Pumping – TWDB Contract Number 1648302062
4-175
Hydraulic Properties
The Marble Falls Aquifer has limited data in terms of hydraulic properties include transmissivity and hydraulic conductivity. In Burnet County, the only two values of transmissivity are 63 and 2,366 square feet per day with corresponding hydraulic conductivity values of 6.29 and 197.20 feet per day. Due to the limited data, it is difficult to effectively model hydrogeologic responses to groundwater pumping or climatic events for the Marble Falls Aquifer (Shi and others, 2016a). There is also no existing data for storativity from well tests in the Marble Falls Aquifer. However, Shi and others (2016a) assume that storativity and specific yield are similar to the Cretaceous aquifers (8.0 x 10⁻⁷ – 5.0 x 10⁻⁵) due to the relative texture. Due to the highly fractured and channelized limestone, wells in the Marble Falls Aquifer have been known to produce up to 2,000 gallons per minute.
Hydraulic Heads
The Marble Falls Aquifer is hydraulically connected to the overlying Cretaceous aquifers in some areas (Barker and Ardis, 1996). The characteristic flow of groundwater in Paleozoic aquifers is influenced by gravity moving from high water elevations to low water elevations. The areas of high water elevations are associated with recharge zones in contrast to low relief areas of discharge. Due to limited data, rates of groundwater movement and direction cannot be ascertained. It is assumed that the direction of movement follows a southward and southeastward orientation associated with the downdip of the bedding planes of the aquifers.
Groundwater Pumping
Figure 4.112 provides a graph of the historic pumping volumes from the Marble Falls Aquifer in the municipal, manufacturing, mining, and steam/electricity production, irrigation, and livestock sectors from 1980 to 2015. It is evident that the Marble Falls Aquifer has experienced increased rates of pumping since the early 1990s and has declined since 2010. The average pumping rate is more than 1,000 acre-feet per year, with municipal practices accounting for most of the total pumping, but the pumping is typically less than 400 acre-feet per year since 2010.
Subsidence Vulnerability
Reported clay thickness within the Marble Falls Aquifer is generally less than 2 feet. Most wells are completed within or near the unconfined zone of the aquifer where there is little clay. While there is one well with a reported clay thickness of 215 feet, most of the well have no clay reported in the lithology logs and the resulting SRV for the aquifer is 1.1 with a third quartile of 1. Figure 4.113 illustrates the clay thicknesses and regional distribution throughout the aquifer. The lithology of the aquifer is predominantly composed of limestone (carbonate) with some clastics. The clay layers within the aquifer are characterized as hard clay.
Final Report: Identification of the Vulnerability of the Major and Minor Aquifers of Texas to Subsidence with Regard to Groundwater Pumping – TWDB Contract Number 1648302062
4-176
Figure 4.112. Historic pumping volumes from the Marble Falls Aquifer in the municipal, manufacturing, mining, and steam/electricity production, irrigation, and livestock sectors from 1980 to 2015 (TWDB, 2017b).
Final Report: Identification of the Vulnerability of the Major and Minor Aquifers of Texas to Subsidence with Regard to Groundwater Pumping – TWDB Contract Number 1648302062
4-177
Figure 4.113. Calculated Marble Falls Aquifer clay thickness at well locations.
Little water level data is available for the Marble Falls Aquifer (Shi and others, 2016a). For our evaluation, we set the preconsolidation level at the well sites to the minimum water level from the calibrated GAM (Shi and others, 2016b). For the static water level, we used the simulated water level for 2017 from the MAG run (Jones, 2017). We calculated the water level trend using all of the simulated water levels from the calibrated GAM (Shi and others, 2016b) and the GMA 9 adopted DFCs and MAG run for the DFC water levels. While most of the aquifer is located in GMA 7 with smaller portions in GMA 8 and GMA 9, we used the 2016 joint planning cycle GMA 9 MAG run results (Jones, 2017) for our analyses because, as of the time of our analysis, the 2016 joint planning cycle MAG simulations had
Final Report: Identification of the Vulnerability of the Major and Minor Aquifers of Texas to Subsidence with Regard to Groundwater Pumping – TWDB Contract Number 1648302062
4-178
not yet been conducted. Table 4.46 summarizes the data sources and values for each subsidence risk factor.
Table 4.46. Marble Falls Aquifer subsidence risk factor data sources and summary.
Subsidence Risk Factor Variable Data Source Value
3rd Quartile SRV
Clay Layer Thickness and Extent
SDR lithology table 0 to 754 feet 1
Clay Compressibility Estimated based on lithology Hard Clay 1
Aquifer Lithology Shi and others (2016a) Consolidated
Clastic 2
Preconsolidation Characterization
Minimum water level from transient model simulations (Shi
and others, 2016b)
754 to 1,857 feet mean sea level
3
Predicted Water Level Decline based on Trend
Trend in simulated water levels from transient model simulations
(Shi and others, 2016b)
Less than 1-foot decline
2
Predicted DFC Water Level Decline
Estimate from adopted DFCs for GMA 9
Less than 1-foot decline
2
Results of the assessment suggest that the Marble Falls Aquifer has a low risk for future subsidence due to pumping. Figure 4.114 illustrates the subsidence risk factor for the Marble Falls Aquifer.
Final Report: Identification of the Vulnerability of the Major and Minor Aquifers of Texas to Subsidence with Regard to Groundwater Pumping – TWDB Contract Number 1648302062
4-179
Figure 4.114. Marble Falls Aquifer subsidence risk vulnerability at well locations.
Final Report: Identification of the Vulnerability of the Major and Minor Aquifers of Texas to Subsidence with Regard to Groundwater Pumping – TWDB Contract Number 1648302062
4-180
4.3.14 Nacatoch
The Nacatoch Aquifer covers approximately 2,500 square miles across the northeast portion of north-central Texas extending from Bowie County to Navarro County. Figure 4.115 provides a map of the aquifer’s outcrop and subcrop. The Nacatoch Aquifer is mainly composed of sandstone and clay beds and provides the primary source for domestic and livestock use throughout its extent.
Figure 4.115. Nacatoch Aquifer extent.
Final Report: Identification of the Vulnerability of the Major and Minor Aquifers of Texas to Subsidence with Regard to Groundwater Pumping – TWDB Contract Number 1648302062
4-181
Hydrostratigraphy
The water-bearing unit in the Nacatoch Aquifer is the Late Cretaceous-aged Nacatoch Sand Formation within the Navarro Group. Table 4.47 provides a stratigraphic column of the geologic units associated with the Nacatoch Aquifer. The structural framework of the Nacatoch Aquifer is defined by three major components: (1) deposition into the East Texas Basin; (2) deltaic sedimentation processes; and (3) stratigraphic offsets resulting from the Mexia-Talco Fault Zone (Beach and others, 2009). The Late Jurassic was a time of significant land surface erosion in Texas as the lowering of the ancestral Gulf of Mexico shifted drainage patterns to the east and southeast. The Cretaceous units were deposited in the East Texas Basin of the ancestral Gulf as the sea retreated in the waning period of the Mesozoic Era (Beach and others, 2009).
Table 4.47. Stratigraphic column of the Nacatoch illustrating the hydrogeologic units (Wood and Guevara, 1981).
Era System Series Group Geologic Unit Hydrogeologic Unit
Cenozoic
Quaternary Pleistocene to Recent floodplain
(alluvium and fluviatile terrace deposits) Localized Alluvium Aquifers
Tertiary
Eocene Wilcox
Confining Units Paleocene Midway Wills Point
Kincaid
Mesozoic Cretaceous Gulf
Navarro
Kemp Clay
Nacatoch Sand Nacatoch Aquifer
Neylandville Clay
Confining Units Taylor
Marlbrook Marl
Pecan Gap Chalk
Wolfe City-Ozan
The Nacatoch Aquifer is bounded vertically by the underlying Neylandville Clay and the overlying Kemp Clay of the Navarro Group. The aquifer is not a single sand layer, but rather a sequence of sand layers separated by layers of mudstone that dip south and southeast in the subsurface toward the central axis of the East Texas Basin. The number of sand layers varies throughout the Nacatoch Aquifer extent and the thickness of individual sand units varies from over 100 feet in deltaic areas to less than 20 feet in shelf deposits in the southern extent (Ashworth, 1988). Thickness of intervening mudstone units similarly ranges from over 100 feet to only a few feet. Net sand thickness is greatest along the state line in eastern Bowie County. Elsewhere, increased sand thickness in the range of 120 feet occur in southern Red River and northern Titus Counties, eastern Hunt and western Delta Counties, and in southern Hunt County. The Mexia-Talco Fault Zone, consisting primarily of
Final Report: Identification of the Vulnerability of the Major and Minor Aquifers of Texas to Subsidence with Regard to Groundwater Pumping – TWDB Contract Number 1648302062
4-182
strike-oriented normal faults that often formed grabens, disrupts the basin-ward dip of the Nacatoch Aquifer units (Beach and others, 2009).
Hydraulic Properties
Hydraulic properties including transmissivity, hydraulic conductivity, specific capacity, and storativity were analyzed from wells completed in the Nacatoch Aquifer. Estimated specific capacity data from available driller’s logs in the area were utilized to calculate transmissivity and hydraulic conductivity for the aquifer after Ashworth (1988). Table 4.48 provides a summary of the calculated hydraulic properties for the Nacatoch Aquifer. The average transmissivity value for the aquifer is 225 square feet per day, average hydraulic conductivity is five feet per day, and average well specific capacity is 1.2 gallons per minute per foot of drawdown (Myers, 1969; Ashworth, 1988).
Table 4.48. Hydraulic properties for the Nacatoch Aquifer.
Specific Capacity (gpm/ft) 0.04 – 13.8 1 Storativity 5.0 x 10⁻⁵ – 0.3 1, 2
References: (1) Beach and others (2009); (2) Freeze and Cherry (1979)
Hydraulic Heads
Groundwater flow in the Nacatoch Aquifer is predominantly controlled by faulting due to the structure of the Mexia-Talco Fault Zone causing discontinuity of sands within the aquifer. Topography dictates the water levels in the unconfined portions of the aquifer as higher water levels are associated with higher elevations and low water levels coinciding with lower elevations. Hydraulic heads begin to decrease as groundwater travels from areas of unconfined to the confined portions of the aquifer and as discharge increases.
Groundwater Pumping
Figure 4.116 provides a graph of the historic pumping volumes from the Nacatoch Aquifer in the municipal, manufacturing, mining, and steam/electricity production, irrigation, and livestock sectors from 1980 to 2015. Pumping rates have been relatively steady throughout the given period with an increase in 2010. Municipality water pumpage is the main use in the Nacatoch Aquifer accounting for nearly 70 percent of the total pumpage.
Subsidence Vulnerability
Clay thickness within the Nacatoch Aquifer is generally less than 25 feet with thicker clays observed in the central portion of the aquifer within southern Hunt County where clay thickness between 100 to 200 feet (average SRV = 1.5 with a third quartile of 2). Figure 4.117 provides the clay thickness at well locations and the regional distribution of the thicknesses. The lithology of the Nacatoch is described as consolidated clastic material consisting of sequences of sand layers separated by mudstone. The clay is categorized as hard clay.
Final Report: Identification of the Vulnerability of the Major and Minor Aquifers of Texas to Subsidence with Regard to Groundwater Pumping – TWDB Contract Number 1648302062
4-183
Figure 4.116. Historic pumping volumes from the Nacatoch Aquifer in the municipal, manufacturing, mining, and steam/electricity production, irrigation, and livestock sectors from 1980 to 2015 (TWDB, 2017b).
Final Report: Identification of the Vulnerability of the Major and Minor Aquifers of Texas to Subsidence with Regard to Groundwater Pumping – TWDB Contract Number 1648302062
4-184
Figure 4.117. Calculated Nacatoch Aquifer clay thickness at well locations.
Water levels throughout the aquifer have been generally stable with portions of the aquifer experiencing water level declines. The continued use of groundwater in the vicinity of the City of Commerce within Hunt County has resulted in measurable water level declines (Beach and others, 2009). For evaluation purposes, the Nacatoch GAM transient model was extended through 2070 with no changes to future pumping and we assumed a preconsolidation and static water level in the aquifer as the minimum transient GAM water level from the calibration period and predictive model equivalent to the year 2017, respectively. Water level trends were determined using the simulated water levels from the
Final Report: Identification of the Vulnerability of the Major and Minor Aquifers of Texas to Subsidence with Regard to Groundwater Pumping – TWDB Contract Number 1648302062
4-185
transient calibration period for the GAM. Table 4.49 summarizes the data sources and values for each subsidence risk factor.
Table 4.49. Nacatoch subsidence risk factor data sources and summary.
Subsidence Risk Factor Variable Data Source Value
3rd Quartile SRV
Clay Layer Thickness and Extent
SDR lithology table 0 to 361 feet 2
Clay Compressibility Estimated based on lithology Hard Clay 1
Aquifer Lithology Ashworth (1988) Consolidated
Clastic 3
Preconsolidation Characterization
Minimum water level from transient model simulations (Beach
and others, 2009)
257 to 505 feet mean sea level
3
Predicted Water Level Decline based on Trend
Trend in simulated water levels from transient model simulations
(Beach and others, 2009) Average 7 feet rise 1
Predicted DFC Water Level Decline
Not applicable 1
Results of the assessment suggest that the Nacatoch has a medium-low risk for future subsidence due to pumping. Figure 4.118 illustrates the subsidence risk factor throughout the aquifer.
Final Report: Identification of the Vulnerability of the Major and Minor Aquifers of Texas to Subsidence with Regard to Groundwater Pumping – TWDB Contract Number 1648302062
4-186
Figure 4.118. Nacatoch Aquifer subsidence risk vulnerability at well locations.
Final Report: Identification of the Vulnerability of the Major and Minor Aquifers of Texas to Subsidence with Regard to Groundwater Pumping – TWDB Contract Number 1648302062
4-187
4.3.15 Queen City
The Queen City Aquifer is a minor aquifer that occurs in a band approximately parallel to the Texas Gulf coastline. Groundwater is stored in the sand, loosely cemented sandstone, and interbedded clay layers of the Queen City Formation. In south Texas, the thickness of the formation is up to 2,000 feet. Livestock and domestic well usage are the most common uses for water from the aquifer, but there is significant municipal and industrial use in northeast Texas (George and others, 2011).
Figure 4.119. Queen City Aquifer extent.
Final Report: Identification of the Vulnerability of the Major and Minor Aquifers of Texas to Subsidence with Regard to Groundwater Pumping – TWDB Contract Number 1648302062
4-188
Hydrostratigraphy
The Queen City Aquifer is part of a larger aquifer system that includes the Sparta and Carrizo-Wilcox aquifers. Table 4.50 illustrates the general stratigraphy and relationship of the formations. Underlying and overlying the Queen City Sand are the Reklaw Formation and the Weches Formation, respectively, which act as confining units to the aquifer. The Queen City is generally comprised of thick, laterally continuous and permeable fluvio-deltaic sands. In comparison, the Reklaw Formation and Weches Formation are more typically composed of marine sediments and are typically made up of clay, silt, and sand mixtures. These confining units occasionally contain limestone layers in the extreme south of the study area and lignite deposits across the entire study area (Kelley and others, 2004).
In Louisiana and some parts of northeast Texas, the Queen City Formation decreases to a negligible thickness and its stratigraphic equivalent, the Cane River Formation, is typically described as an aquitard separating the Carrizo-Wilcox Aquifer from the Sparta Aquifer. In areas of south Texas, the Queen City Formation becomes more clayey while the Reklaw Formation becomes sandier with the interval between the Carrizo-Wilcox Aquifer and the Weches aquitard containing a series of local aquitards and aquifers with water of poor quality (Kelley and others, 2004).
Table 4.50. Generalized stratigraphic section for the Wilcox and Claiborne groups in Texas (Kelley and others, 2004).
Series North Texas Central Texas South Texas
Ter
tiar
y Eocene
U Jackson Group
M
Cla
ibo
rne
Gro
up
Yegua Formation
Cook Mountain Formation Laredo
Formation Sparta Sand
Weches Formation El Pico Clay
Queen City Sand
Reklaw Formation Bigford Formation
Carrizo Sand
Upper Wilcox Calvert Bluff Formation Upper Wilcox
L
Wil
cox
Gro
up
Middle Wilcox Simboro Formation Middle Wilcox
Paleocene U Lower Wilcox Hooper Formation Lower Wilcox
L Midway Formation
Final Report: Identification of the Vulnerability of the Major and Minor Aquifers of Texas to Subsidence with Regard to Groundwater Pumping – TWDB Contract Number 1648302062
4-189
Hydraulic Properties
The aquifer dips to the southeast 100 to 150 feet per mile in the south to 15 feet per mile in the north. In northeast Texas the aquifer, present only in outcrop, is expressed by hilly terrain and sandy soil. Thickness across the formation is quite variable and is up 2,000 feet in south Texas. Table 4.51 provides a summary of the hydraulic properties for the Queen City Aquifer based on data compiled for the GAM (Kelley and others, 2004).
Table 4.51. Hydraulic properties for the Queen City Aquifer.
Aquifer Properties Range References
Hydraulic conductivity (ft/d) 3 x 10⁻³ – 300 1 Storativity 1.0 x 10⁻⁴ – 5.2 x 10⁻³ 1
References: (1) Kelley and others (2004)
Hydraulic Heads
George and others (2011) indicate that Queen City Aquifer water levels have remained fairly stable over time in the northern part of the aquifer with some small water level declines in the central and southern parts of the aquifer. Flow is primarily from outcrop areas where recharge occurs to downdip portions of the aquifer. Muller and Price (1979) estimated that recharge in the Queen City Aquifer in Texas is approximately 682,000 acre-feet per year. Faulting of the geologic formations may affect groundwater flow patterns, but there are very few fault zones within the Queen City Aquifer for which there is hydraulic evidence that the fault is a barrier to flow.
Groundwater Pumping
Pumping from the Queen City Aquifer to date has been small relative to its reported recharge rate. Figure 4.120 provides a graph of the historic pumping volumes from the Queen City Aquifer in the municipal, manufacturing, mining, and steam/electricity production, irrigation, and livestock sectors from 1980 to 2015. Pumping rates were declining from 1980 through 2003 but have been generally increasing since 2003. Municipal water pumpage is the main use in the Queen City Aquifer with irrigation use increasing during the last decade.
Subsidence Vulnerability
Clay thickness within the Queen City Aquifer is generally less than 50 feet with thicker clays observed in the southern portion of the aquifer. Maximum calculated clay thickness is 816 feet and the average SRV for the clay thickness and extent is 1.5 with a third quartile of 2. Figure 4.121 provides the clay thickness at well locations and the regional distribution of the thicknesses. The lithology of the Queen City is described as unconsolidated clastic material consisting of sequences of sand layers with interbedded clays. The clay is categorized as hard clay.
Final Report: Identification of the Vulnerability of the Major and Minor Aquifers of Texas to Subsidence with Regard to Groundwater Pumping – TWDB Contract Number 1648302062
4-190
Figure 4.120. Historic pumping volumes from the Queen City Aquifer in the municipal, manufacturing, mining, and steam/electricity production, irrigation, and livestock sectors from 1980 to 2015 (TWDB, 2017b).
Final Report: Identification of the Vulnerability of the Major and Minor Aquifers of Texas to Subsidence with Regard to Groundwater Pumping – TWDB Contract Number 1648302062
4-191
Figure 4.121. Calculated Queen City Aquifer clay thickness at well locations. Results shown beyond aquifer boundary reflect extent of the groundwater availability model.
Water levels throughout the aquifer have been generally stable with portions of the aquifer experiencing relatively small water level declines. For evaluation purposes we assumed a preconsolidation equal to the lowest water level from the transient models (Kelley and others, 2004) and static water level in the aquifer equivalent to the results for 2017 from the Modeled Available Groundwater simulations (Oliver, 2012; Wade, 2017a; Wade, 2017b) resulting in an average and third quartile SRV of 3 throughout the aquifer. We determined the water level trend using the simulated water levels from transient
Final Report: Identification of the Vulnerability of the Major and Minor Aquifers of Texas to Subsidence with Regard to Groundwater Pumping – TWDB Contract Number 1648302062
4-192
calibration period for the GAM (Kelley and others, 2004) and the predicted DFC water levels from final MAG simulations (Oliver, 2012; Wade, 2017a; Wade, 2017b). Predicted water level changes due to the DFC are highly variable, but average three feet of decline. Table 4.52 summarizes the data sources and values for each subsidence risk factor.
Table 4.52. Queen City Aquifer subsidence risk factor data sources and summary.
Subsidence Risk Factor Variable Data Source Value
3rd Quartile SRV
Clay Layer Thickness and Extent
SDR lithology table 0 to 816 feet 2
Clay Compressibility Estimated based on lithology Hard Clay 1
Aquifer Lithology (Kelley and others, 2004) Unconsolidated
Clastic 4
Preconsolidation Characterization
Lowest water level from transient model simulations (Kelley and
others, 2004)
118 to 582 feet mean sea level
3
Predicted Water Level Decline based on Trend
Trend in simulated water levels from transient model simulations
(Kelley and others, 2004)
Less than 1-foot decline
2
Predicted DFC Water Level Decline
Difference in head from final Modeled Available Groundwater simulations (Oliver, 2012; Wade,
2017a; Wade, 2017b)
Average 3 feet decline
2
Results of the assessment suggest that the Queen City Aquifer has a medium risk for future subsidence due to pumping with the southern portion of the aquifer having the greatest risk characteristics. Figure 4.122 illustrates the subsidence risk factor throughout the aquifer.
Final Report: Identification of the Vulnerability of the Major and Minor Aquifers of Texas to Subsidence with Regard to Groundwater Pumping – TWDB Contract Number 1648302062
4-193
Figure 4.122. Queen City Aquifer subsidence risk vulnerability at well locations. Results shown beyond aquifer boundary reflect extent of the groundwater availability model.
Final Report: Identification of the Vulnerability of the Major and Minor Aquifers of Texas to Subsidence with Regard to Groundwater Pumping – TWDB Contract Number 1648302062
4-194
4.3.16 Rita Blanca
The Rita Blanca Aquifer is found in the northwest Texas Panhandle underlying the Ogallala and overlying the Dockum. Production from the aquifer is primarily for irrigation from the coarse-grained sediments of the formations that comprise the aquifer (George and others, 2011). Figure 4.123 illustrates the extent of the aquifer in Texas.
Figure 4.123. Rita Blanca Aquifer extent.
Final Report: Identification of the Vulnerability of the Major and Minor Aquifers of Texas to Subsidence with Regard to Groundwater Pumping – TWDB Contract Number 1648302062
4-195
Hydrostratigraphy
Interbedded sandstones and shales make up the Rita Blanca Aquifer. The aquifer is thickest along the New Mexico border and thins toward the east. Sands of the Exeter Formation form the primary water bearing intervals of the aquifer (Deeds and others, 2015). The Rita Blanca Aquifer overlies the Dockum and underlies the Ogallala. Figure 4.124 is a cross-section from Deeds and others (2015) illustrating the relationship of the Rita Blanca and other area aquifers.
Figure 4.124. Cross-section illustrating the configuration of aquifers associated with the Rita Blanca Aquifer (Deeds and others, 2015).
Hydraulic Properties
The Rita Blanca Aquifer is hydraulically connected to the Ogallala. Hydraulic properties are likely similar to the overlying aquifer suggesting the geometric mean of hydraulic conductivity would be approximately 14 feet per day. However, as discussed by Deeds and others (2015), the sand percentage of the Rita Blanca is not as great as that in the Ogallala and the hydraulic conductivity is likely lower.
Hydraulic Heads
Pre-development water levels in the aquifer generally followed land surface topography with flow from the northwest to the southeast. While there are local declines associated with pumping in western Dallam County, the general direction of flow has remained from northwest to the southeast (Deeds and others, 2015).
Rita Blanca
Final Report: Identification of the Vulnerability of the Major and Minor Aquifers of Texas to Subsidence with Regard to Groundwater Pumping – TWDB Contract Number 1648302062
4-196
Groundwater Pumping
Most of the water wells pumping from the Rita Blanca Aquifer are for irrigation purposes. Figure 4.125 provides a graph of the historic pumping volumes from the Rita Blanca Aquifer in the municipal, manufacturing, mining, and steam/electricity production, irrigation, and livestock sectors from 1980 to 2015. Generally, the pumping demand is consistent from year to year except for the large increase from 2003 to 2004. Deeds and others (2015) report that the increase in pumping observed from 2003 to 2004 is due to a change in Texas Water Development Board methodology for estimating the amount of pumping from the Ogallala and the Rita Blanca.
Figure 4.125. Historic pumping volumes from the Rita Blanca Aquifer in the municipal, manufacturing, mining, and steam/electricity production, irrigation, and livestock sectors from 1980 to 2015 (TWDB, 2017b).
Final Report: Identification of the Vulnerability of the Major and Minor Aquifers of Texas to Subsidence with Regard to Groundwater Pumping – TWDB Contract Number 1648302062
4-197
Subsidence Vulnerability
Clay thicknesses generally increase from east to west in the Rita Blanca Aquifer. There are several wells with clay thicknesses exceeding 100 feet near the New Mexico border. Overall the average SRV for the clay thickness and extent is 2.1 with the third quartile of 3. Figure 4.126 illustrates the saturated clay thickness at SDR well locations and regional distribution of the thicknesses. The lithology of the Rita Blanca is sand and gravel that is typically consolidated (George and others, 2011). Based on the lithology of the aquifer, we categorized the clay as hard (SRV = 1).
Figure 4.126. Calculated Rita Blanca Aquifer clay thickness at well locations.
Final Report: Identification of the Vulnerability of the Major and Minor Aquifers of Texas to Subsidence with Regard to Groundwater Pumping – TWDB Contract Number 1648302062
4-198
For evaluation purposes, we assumed a preconsolidation and static water level in the aquifer equivalent to the results for 2017 from the MAG simulations (Goswami, 2017a; Shi, 2017a) resulting in a SRV of 3 throughout the aquifer. We determined the water level trend using the simulated water levels from 1980 through 2012 from the calibrated High Plains Aquifer System GAM (Deeds and Jigmond, 2015) and the predicted DFC water level decline as the difference in head for 2062 from initial head from final MAG simulations (Goswami, 2017a; Shi, 2017a). Table 4.53 summarizes the data sources and values for each subsidence risk factor.
Table 4.53. Rita Blanca subsidence risk factor data sources and summary.
Subsidence Risk Factor Variable Data Source Value
3rd Quartile SRV
Clay Layer Thickness and Extent
SDR lithology table 0 to 270 feet 3
Clay Compressibility Estimated based on lithology Hard Clay 1
Aquifer Lithology George and others (2011) Consolidated
Clastic 3
Preconsolidation Characterization
Preconsolidation and static water level: Head for 2017 from final
Modeled Available Groundwater simulation
3,797 to 4,505 feet mean sea level
3
Predicted Water Level Decline based on Trend
Trend in simulated water levels from 1980 through 2012 from calibrated High Plains Aquifer
System GAM
Less than 1-foot decline
2
Predicted DFC Water Level Decline
Difference in head for 2062 from initial head from final Modeled
Available Groundwater simulation
Average 50 feet decline
3
Results of the assessment suggest that the Rita Blanca has a low to medium risk for future subsidence due to pumping with the risk increasing from east to west. Figure 4.127 illustrates the subsidence risk factor throughout the aquifer.
Final Report: Identification of the Vulnerability of the Major and Minor Aquifers of Texas to Subsidence with Regard to Groundwater Pumping – TWDB Contract Number 1648302062
4-199
Figure 4.127. Rita Blanca Aquifer subsidence risk vulnerability at well locations.
Final Report: Identification of the Vulnerability of the Major and Minor Aquifers of Texas to Subsidence with Regard to Groundwater Pumping – TWDB Contract Number 1648302062
4-200
4.3.17 Rustler
The Rustler Aquifer is located in west Texas. The aquifer outcrops primarily in Culberson County and dips toward the southeast. The aquifer is composed of carbonates and evaporites of Permian age (George and others, 2011). Figure 4.128 illustrates the extent of the aquifer in Texas.
Figure 4.128. Rustler Aquifer extent.
Final Report: Identification of the Vulnerability of the Major and Minor Aquifers of Texas to Subsidence with Regard to Groundwater Pumping – TWDB Contract Number 1648302062
4-201
Hydrostratigraphy
The limestones and evaporites of the Rustler Formation were deposited in the Paleozoic when the deposition of the underlying Capitan Reef Complex formed an inland sea. The sediments that form the Rustler Aquifer were the last deposits as the inland sea evaporated. The Rustler Aquifer unconformably overlies the Salado Formation in the Central Basin Platform and Delaware Basin. The Rustler Aquifer unconformably overlies the Capitan Reef Complex along the western margin of the Central Basin Platform where the Salado Formation is absent (Ewing and others, 2012).
Table 4.54 from Ewing and others (2012) provides a summary of the units which make up the Rustler Aquifer and bounding units. Table 4.54 also illustrates how the stratigraphy of the Rustler Aquifer varies from west to east. In general, the aquifer is composed of 250 to 670 feet of dolomite, limestone, breccia, gypsum, and mudstone. The Rustler Aquifer outcrops at the surface along the western edge of the aquifer. The aquifer is overlain in various places by the Dewey Lake Formation, Dockum Aquifer, Edwards-Trinity (Plateau) Aquifer, and Pecos Valley Aquifer. An east-west cross section is presented on Figure 4.129 which demonstrates the changes in stratigraphy across the aquifer (Ewing and others, 2012).
Table 4.54. Stratigraphic column of the Rustler illustrating the hydrogeologic units (Ewing and others, 2012).
System Culberson and Reeves Counties Pecos County/Glass Mountains
Quaternary/Tertiary Pecos Alluvium Alluvium
Volcanics
Cretaceous Edwards-Trinity (Plateau)
Triassic Dockum
Permian
Dewey Lake
Ru
stle
r
Forty-Niner
Ru
stle
r
Upper Member
Tessey Limestone
Magenta Dolomite
Tamrisk Middle
Member Culebra Dolomite
Lower Gypsum & Mud Lower
Member Siltstone
Salado
Final Report: Identification of the Vulnerability of the Major and Minor Aquifers of Texas to Subsidence with Regard to Groundwater Pumping – TWDB Contract Number 1648302062
4-202
Figure 4.129. Generalized cross-section of the Rustler Formation and associated geologic units (Ewing and others, 2012).
Hydraulic Properties
There is little available data to characterize the hydraulic properties of the Rustler Aquifer, but the properties are known to vary significantly primarily due to karst features and variations in extent of rock fracturing. Estimates of hydraulic conductivity in productive areas of the aquifer vary between 1.2 feet per day and 568 feet per day. The hydraulic conductivity is likely significantly lower in areas where the rock is tight and karst features do not exist. In the GAM of the Rustler Aquifer, the aquifer was modeled to have a horizontal hydraulic conductivity that varies between 0.01 feet per day and 5 feet per day. The aquifer was simulated assuming an anisotropic hydraulic conductivity ratio of 1,000:1 (that is, the horizontal hydraulic conductivity was 1,000 times greater than the vertical hydraulic conductivity). The specific storage of the aquifer was modeled as 1.0 x 10⁻⁶ (Ewing and others, 2012).
Hydraulic Heads
The Rustler Aquifer generally acts as a confined aquifer, except in areas along the western margin of the aquifer were the aquifer is exposed at the surface and is unconfined. Groundwater flow in the aquifer is generally directed from west to east. The gradient is driven by high water levels in the west due to recharge in the exposed areas of the aquifer.
Final Report: Identification of the Vulnerability of the Major and Minor Aquifers of Texas to Subsidence with Regard to Groundwater Pumping – TWDB Contract Number 1648302062
4-203
Due to limited water level data in the Rustler Aquifer, it is difficult to determine the inter aquifer, or vertical, gradient (Ewing and others, 2012).
Groundwater Pumping
The primary use of groundwater from the Rustler Aquifer is irrigation with minor uses for livestock, mining, and oil and gas operations. The aquifer is not heavily pumped because the overlying aquifers are more attractive water sources due to their shallower depths and better water quality. Figure 4.130 provides a graph of the historic pumping volumes from the Rustler Aquifer in the municipal, manufacturing, mining, and steam/electricity production, irrigation, and livestock sectors from 1980 to 2015.
Prior to 1980 there was significantly more water being used for mining, but since then the mining use has been insignificant relative to irrigation use (Ewing and others, 2012). Generally, the pumping demand has been relatively consistent since 2009.
Figure 4.130. Historic pumping volumes from the Rustler Aquifer in the municipal, manufacturing, mining, and steam/electricity production, irrigation, and livestock sectors from 1980 to 2015 (TWDB, 2017b).
Final Report: Identification of the Vulnerability of the Major and Minor Aquifers of Texas to Subsidence with Regard to Groundwater Pumping – TWDB Contract Number 1648302062
4-204
Subsidence Vulnerability
There is a limited amount of data for the Rustler, yet clay thickness from available lithology logs averages about 80 feet. The maximum clay thickness measured over 450 feet resulting in an average SRV of 2.2 and a third quartile of 3. Figure 4.131 provides the clay thickness at well locations and the regional distribution of the thicknesses. The lithology of the Rustler is described as consolidated clastic and carbonate material (Boghici and Van Broekhoven, 2011). The clay is categorized as hard clay.
Figure 4.131. Calculated Rustler Aquifer clay thickness at well locations.
Final Report: Identification of the Vulnerability of the Major and Minor Aquifers of Texas to Subsidence with Regard to Groundwater Pumping – TWDB Contract Number 1648302062
4-205
For evaluation purposes, we extended the Rustler GAM transient model through 2070 with no changes to future pumping (Ewing and others, 2012). We assumed a preconsolidation and static water level in the aquifer as the minimum transient GAM water level from the calibration period and predictive model equivalent to the year 2017, respectively. Water level trends were determined using the simulated water levels from the transient calibration period for the GAM. For DFC levels, we used the simulated water levels for 2010 and 2070 rather than the aquifer assessment performed by Wuerch and Backhouse (2011). Table 4.55 summarizes the data sources and values for each subsidence risk factor.
Table 4.55. Rustler subsidence risk factor data sources and summary.
Subsidence Risk Factor Variable Data Source Value
3rd Quartile SRV
Clay Layer Thickness and Extent
SDR lithology table 0 to 455 feet 3
Clay Compressibility Estimated based on lithology Hard Clay 1
Aquifer Lithology Boghici and Van Broekhoven
(2011)
Carbonate and Consolidated
Clastic 3
Preconsolidation Characterization
Minimum water level from transient model simulations (Ewing
and others, 2012)
2,418 to 4,012 feet mean sea level
3
Predicted Water Level Decline based on Trend
Trend in simulated water levels from transient model simulations
(Ewing and others, 2012)
Less than 1-foot decline
2
Predicted DFC Water Level Decline
Ewing and others (2012) Average 8 feet
decline 2
Results of the assessment suggest that the Rustler has a low to medium risk for future subsidence due to pumping. Figure 4.132 illustrates the subsidence risk factor throughout the aquifer.
Final Report: Identification of the Vulnerability of the Major and Minor Aquifers of Texas to Subsidence with Regard to Groundwater Pumping – TWDB Contract Number 1648302062
4-206
Figure 4.132. Rustler Aquifer subsidence risk vulnerability at well locations.
Final Report: Identification of the Vulnerability of the Major and Minor Aquifers of Texas to Subsidence with Regard to Groundwater Pumping – TWDB Contract Number 1648302062
4-207
4.3.18 Sparta
The Sparta is a minor aquifer that occurs in a band approximately parallel to the Texas Gulf coastline. Groundwater is contained within the Sparta Formation which is primarily sand interbedded with silt and clay layers. The thickness of the formation changes gradually from more than 700 feet in northeast Texas to about 200 feet in South Texas. Water from the aquifer is predominantly used for domestic and livestock purposes (George and others, 2011). Figure 4.133 illustrates the extent of the aquifer in Texas.
Figure 4.133. Sparta Aquifer extent.
Final Report: Identification of the Vulnerability of the Major and Minor Aquifers of Texas to Subsidence with Regard to Groundwater Pumping – TWDB Contract Number 1648302062
4-208
Hydrostratigraphy
The Sparta Aquifer is part of a larger aquifer system that includes the Sparta, Queen City, and Carrizo-Wilcox aquifers. The Sparta Sand is confined by the Weches Formation below and the Cook Mountain Formation above. Table 4.56 illustrates the general stratigraphy of the formations associated with the Sparta. Except in some parts of northeast Texas, the Sparta formation follows the dip of other formations toward the Gulf of Mexico. The aquifer outcrops in western portions of the aquifer and dips below the overlying Cook Mountain Formation.
Table 4.56. Stratigraphic column of the Sparta illustrating the hydrogeologic units (Kelley and others, 2004).
Series North Texas Central Texas South Texas
Ter
tiar
y Eocene
U Jackson Group
M
Cla
ibo
rne
Gro
up
Yegua Formation
Cook Mountain Formation Laredo
Formation Sparta Sand
Weches Formation El Pico Clay
Queen City Sand
Reklaw Formation Bigford Formation
Carrizo Sand
Upper Wilcox Calvert Bluff Formation Upper Wilcox
L
Wil
cox
Gro
up
Middle Wilcox Simboro Formation Middle Wilcox
Paleocene U Lower Wilcox Hooper Formation Lower Wilcox
L Midway Formation
Hydraulic Properties
The aquifer dips to the southeast 100 to 150 feet per mile in the south to 15 feet per mile in the north. The maximum thickness of the Sparta Formation is more than 700 feet in areas near the Louisiana border. However, in south Texas the Sparta thickness decreases to approximately 200 feet in the subsurface. Net sand thickness for the aquifer is approximately 200 to 300 feet (Kelley and others, 2004). Table 4.57 shows a summary of hydraulic properties for the Sparta Aquifer.
Final Report: Identification of the Vulnerability of the Major and Minor Aquifers of Texas to Subsidence with Regard to Groundwater Pumping – TWDB Contract Number 1648302062
4-209
Table 4.57. Hydraulic properties for the Sparta Aquifer.
Aquifer Properties Range References
Hydraulic conductivity (ft/d) 3.0 x 10⁻² – 100 1 Storativity 1.0 x 10⁻⁴ – 5.2 x 10⁻³ 1
References: (1) Kelley and others (2004)
Hydraulic Heads
George and others (2011) state that there are no significant water level declines in the Sparta Aquifer based on measurements in wells measured by the TWDB. In general, groundwater flow is primarily from outcrop areas, where recharge occurs, to downdip portions of the aquifer following the dip of the formations toward the Gulf of Mexico. In the outcrop areas, the groundwater flow tends to follow the general topography, but as water enters the confined portions it follows the dip of the aquifer units (Kelley and others, 2004).
Groundwater Pumping
Muller and Price (1979) estimated that recharge in the Queen City Aquifer in Texas is approximately 164,000 acre-feet per year. Reported pumping from the Sparta Aquifer has been relatively small compared to the estimated annual recharge rate. Figure 4.134 provides a graph of the historic pumping volumes from the Sparta Aquifer in the municipal, manufacturing, mining, and steam/electricity production, irrigation, and livestock sectors from 1980 to 2015. Since 1988, pumping rates have been generally increasing. Municipal water pumpage is the main use in the Sparta Aquifer.
Subsidence Vulnerability
Clay thickness within the Sparta Aquifer is generally less than 30 feet with thicker clays observed in the northern portion of the aquifer. Maximum calculated clay thickness is 281 feet and the average SRV for the clay thickness and extent is 1.7 with a third quartile of 2. Figure 4.135 provides the clay thickness at well locations and the regional distribution of the thicknesses. The lithology of the Sparta is described as unconsolidated clastic material consisting of sequences of sand layers with interbedded clays. The clay is categorized as hard clay.
Water levels throughout the aquifer have been generally stable. For evaluation purposes we assumed a preconsolidation equal to the lowest water level from the transient models (Kelley and others, 2004) and static water level in the aquifer equivalent to the results for 2017 from the Modeled Available Groundwater simulations (Oliver, 2012; Wade, 2017a; Wade, 2017b) resulting in an average and third quartile SRV of 3 throughout the aquifer. We determined the water level trend using the simulated water levels from transient calibration period for the GAM (Kelley and others, 2004) and the predicted DFC water levels from final MAG simulations (Oliver, 2012; Wade, 2017a; Wade, 2017b). Predicted water level changes due to the DFC are highly variable, but average six feet of decline. Table 4.58 summarizes the data sources and values for each subsidence risk factor.
Final Report: Identification of the Vulnerability of the Major and Minor Aquifers of Texas to Subsidence with Regard to Groundwater Pumping – TWDB Contract Number 1648302062
4-210
Figure 4.134. Historic pumping volumes from the Sparta Aquifer in the municipal, manufacturing, mining, and steam/electricity production, irrigation, and livestock sectors from 1980 to 2015 (TWDB, 2017b).
Final Report: Identification of the Vulnerability of the Major and Minor Aquifers of Texas to Subsidence with Regard to Groundwater Pumping – TWDB Contract Number 1648302062
4-211
Figure 4.135. Calculated Sparta Aquifer clay thickness at well locations. Results shown beyond aquifer boundary reflect extent of the groundwater availability model.
Final Report: Identification of the Vulnerability of the Major and Minor Aquifers of Texas to Subsidence with Regard to Groundwater Pumping – TWDB Contract Number 1648302062
4-212
Table 4.58. Sparta Aquifer subsidence risk factor data sources and summary.
Subsidence Risk Factor Variable Data Source Value
3rd Quartile SRV
Clay Layer Thickness and Extent
SDR lithology table 0 to 281 feet 2
Clay Compressibility Estimated based on lithology Hard Clay 1
Aquifer Lithology (Kelley and others, 2004) Unconsolidated
Clastic 4
Preconsolidation Characterization
Lowest water level from transient model simulations (Kelley and
others, 2004)
119 to 534 feet mean sea level
3
Predicted Water Level Decline based on Trend
Trend in simulated water levels from transient model simulations
(Kelley and others, 2004)
Less than 1-foot decline
2
Predicted DFC Water Level Decline
Difference in head from final Modeled Available Groundwater simulations (Oliver, 2012; Wade,
2017a; Wade, 2017b)
Average 6 feet decline
2
Results of the assessment suggest that the Sparta Aquifer has a low to medium risk for future subsidence due to pumping with the northern portion of the aquifer having the greatest risk characteristics. Figure 4.136 illustrates the subsidence risk factor throughout the aquifer.
Final Report: Identification of the Vulnerability of the Major and Minor Aquifers of Texas to Subsidence with Regard to Groundwater Pumping – TWDB Contract Number 1648302062
4-213
Figure 4.136. Sparta Aquifer subsidence risk vulnerability at well locations. Results shown beyond aquifer boundary reflect extent of the groundwater availability model.
Final Report: Identification of the Vulnerability of the Major and Minor Aquifers of Texas to Subsidence with Regard to Groundwater Pumping – TWDB Contract Number 1648302062
4-214
4.3.19 West Texas Bolsons
The West Texas Bolsons Aquifer is classified as a minor aquifer in west Texas. It is a basin fill aquifer that is up to 3,000 feet thick. The aquifer is composed of unconsolidated and consolidated basin fill clay, silt, sand, and gravel in several basins (George and others, 2011). Figure 4.137 illustrates the extent of the aquifer in Texas and identifies the basins, or bolsons, that make up the aquifer.
Figure 4.137. West Texas Bolsons Aquifer extent.
Eagle Flat
Red Light Draw
Green River Valley
Presidio Bolson
Redford Bolson
Salt Basin Bolson
Final Report: Identification of the Vulnerability of the Major and Minor Aquifers of Texas to Subsidence with Regard to Groundwater Pumping – TWDB Contract Number 1648302062
4-215
Hydrostratigraphy
The deposition of the thick basin fill deposits forming the aquifer is directly caused by the Rio Grande Rift and corresponding series of normal block faulting resulting in down dropped basins or grabens. Tertiary aged igneous rocks form the base and lateral bounds of the West Texas Bolson basins. These boundaries are the source of the sediments which form the basin fill deposits (Wade and others, 2011).
The West Texas Bolson Aquifer is composed of up to 3,000 feet of Neogene and Quaternary basin fill deposits. The composition of the fill is similar to that of the surrounding basin walls which were eroded away to generate the fill (George and others, 2011). The deposits at the margins of the basin are higher energy sands and gravels. The deposits in the middle and lower parts of the basin are lower energy deposits composed of silt and clay. The degree of consolidation of the deposits vary from consolidated to un-consolidated. Quaternary aged Rio Grande River and other river alluvial deposits composed of clay, silt, sand, and gravel overlays the aquifer in areas (Wade and others, 2011). Table 4.59 provides the general stratigraphy of the aquifer. Figure 4.138 provides cross-sections illustrating the West Texas Bolsons Aquifer and associated geologic units.
Table 4.59. Generalized stratigraphic column of the West Texas Bolsons illustrating the hydrogeologic units (Wade and others, 2011).
System Stratigraphy Hydrostratigraphy
Quaternary
Channel gravel and sand Flood plain sand and mud
Alluvium aquifers
Bolson fill: conglomerate, sandstone, claystone, and
mudstone Bolson aquifers
Tertiary Undifferentiated volcanic rocks,
lava, welded tuffs, tuff, and tuffaceous sedimentary rocks,
intrusive igneous rocks
Igneous Aquifer
Hydraulic Properties
Wade and others (2011) estimated the hydraulic conductivity of the Presidio and Redford Bolsons from six pumping tests. The geometric mean and average of the hydraulic conductivity estimated was 2.3 feet per day and 7.8 feet per day, respectively. The estimated hydraulic conductivity ranged from 0.5 to 30 feet per day. Vertical hydraulic conductivity was estimated from calibration of the groundwater availability model by Wade and Jigmond (2013). They found the calibrated ratio of average horizontal hydraulic conductivity to vertical hydraulic conductivity to range from 6.7 to 6,600. The storage coefficient of the aquifer was also estimated through model calibration to be 5x10⁻³ (Wade and Jigmond, 2013).
Final Report: Identification of the Vulnerability of the Major and Minor Aquifers of Texas to Subsidence with Regard to Groundwater Pumping – TWDB Contract Number 1648302062
4-216
Figure 4.138. Cross-sections illustrating the West Texas Bolsons Aquifer and associated geologic units (George and others, 2011).
Final Report: Identification of the Vulnerability of the Major and Minor Aquifers of Texas to Subsidence with Regard to Groundwater Pumping – TWDB Contract Number 1648302062
4-217
Beach and others (2008) estimated hydraulic conductivity for the Red Light Draw, Green River Valley, and Eagle Flat basins of the West Texas Bolsons from 11 tests. Results of their analysis indicated hydraulic conductivity ranged from 0.01 to 279 feet per day with transmissivity ranging from 2 to 5,013 square feet per day. Data from a single pumping test indicated a storage coefficient of 0.004.
Angle (2001) reports an estimated transmissivity of the Salt Basin Bolson ranges from 10 to 9,900 square feet per day. Beach and others (2004a) indicate the hydraulic conductivity ranges from 2 to more than 100 feet per day.
Hydraulic Heads
The West Texas Bolson Aquifer generally acts as an unconfined or a leaky confined aquifer. Non-continuous clay layers act as localized confining beds. The depth to groundwater in the West Texas Bolson is typically under 250 feet. Gradients in the aquifer are controlled primarily by recharge and surface water features
Groundwater Pumping
Most of the water wells pumping from the West Texas Bolsons Aquifer are for irrigation purposes. Figure 4.139 provides a graph of the historic pumping volumes from the West Texas Bolsons Aquifer in the municipal, manufacturing, mining, and steam/electricity production, irrigation, and livestock sectors from 1980 to 2015. Except for the estimated pumping in 1980, the pumping demand is relatively consistent from year to year with a slightly increasing trend since the mid-1990s.
Subsidence Vulnerability
There is typically no clay identified on logs for wells completed in the West Texas Bolsons Aquifer. There is a single well with a calculated clay thickness in excess of 100 feet, based on the driller’s log. However, due to most of the wells having zero clay thickness the average SRV is 1.0 with the third quartile of 1. Figure 4.140 provides the clay thickness at well locations and the regional distribution of the thicknesses. George and others (2011) indicate the lithology of the West Texas Bolsons Aquifer is quite variable ranging from clays and silts to coarse-grained clastic material which we categorized as unconsolidated clastic lithology with plastic clay similar to the Hueco-Mesilla Bolsons Aquifer.
For our evaluation we used measured water level data from the Texas Water Development Board Groundwater Database (2017a) instead of the local flow model. For wells without any measurements, the nearest measurement was used with water level trends based upon available measurements. Preconsolidation and static water levels were based upon the minimum water level and the most recent water level, respectively. Table 4.60 summarizes the data sources and values for each subsidence risk factor.
Results of the assessment suggest that the West Texas Bolson Aquifer generally has a low to medium risk for future subsidence due to pumping. However, there are a few locations that suggest the aquifer may have a higher risk. Figure 4.141 illustrates the subsidence risk factor throughout the aquifer.
Final Report: Identification of the Vulnerability of the Major and Minor Aquifers of Texas to Subsidence with Regard to Groundwater Pumping – TWDB Contract Number 1648302062
4-218
Figure 4.139. Historic pumping volumes from the West Texas Bolsons Aquifer in the municipal, manufacturing, mining, and steam/electricity production, irrigation, and livestock sectors from 1980 to 2015 (TWDB, 2017b). Pumping in 1980 is an estimated rather than measured quantity.
Final Report: Identification of the Vulnerability of the Major and Minor Aquifers of Texas to Subsidence with Regard to Groundwater Pumping – TWDB Contract Number 1648302062
4-219
Figure 4.140. Calculated West Texas Bolsons Aquifer clay thickness at well locations.
Final Report: Identification of the Vulnerability of the Major and Minor Aquifers of Texas to Subsidence with Regard to Groundwater Pumping – TWDB Contract Number 1648302062
4-220
Table 4.60. West Texas Bolsons subsidence risk factor data sources and summary.
Subsidence Risk Factor Variable Data Source Value
3rd Quartile SRV
Clay Layer Thickness and Extent
SDR lithology table 0 to 278 feet 1
Clay Compressibility George and others (2011) Plastic Clay 1
Aquifer Lithology George and others (2011) Unconsolidated
Clastic 4
Preconsolidation Characterization
Water level from measured data (TWDB, 2017a)
2,381 to 4,530 feet mean sea level
3
Predicted Water Level Decline based on Trend
Trend from measured water levels (TWDB, 2017a)
No change 1
Predicted DFC Water Level Decline
Oliver (2011b) Average 74 feet
decline 3
Final Report: Identification of the Vulnerability of the Major and Minor Aquifers of Texas to Subsidence with Regard to Groundwater Pumping – TWDB Contract Number 1648302062
4-221
Figure 4.141. West Texas Bolsons Aquifer subsidence risk vulnerability at well locations.
Final Report: Identification of the Vulnerability of the Major and Minor Aquifers of Texas to Subsidence with Regard to Groundwater Pumping – TWDB Contract Number 1648302062
4-222
4.3.20 Woodbine
The Woodbine Aquifer is a minor aquifer that extends across northeastern Texas. Figure 4.142 provides a map showing the aquifer extent. The aquifer is separated from the underlying Trinity Aquifer by the Washita and Fredericksburg Groups. The aquifer is primarily used to provide municipal groundwater supplies.
Figure 4.142. Woodbine Aquifer extent.
Final Report: Identification of the Vulnerability of the Major and Minor Aquifers of Texas to Subsidence with Regard to Groundwater Pumping – TWDB Contract Number 1648302062
4-223
Hydrostratigraphy
The Woodbine Aquifer is predominantly sandstone. Net sandstone thickness is greatest where the outcrop trends northeast being more than 300 feet thick in areas. The sandstone layers are concentrated in the lower portion of the Woodbine Aquifer with individual layers averaging 20 feet in thickness (Kelley and others, 2014). Figure 4.143 illustrates the stratigraphic relationship between the Woodbine and the northern portion of the Trinity Aquifer.
Hydraulic Properties
Based on evaluations by Kelley and others (2014), the hydraulic conductivity of the Woodbine Aquifer is fairly uniform between 0.1 and 4.4 feet per day. Table 4.61 provides a summary of the hydraulic properties calculated for the Woodbine Aquifer.
Hydraulic Heads
Generally, groundwater will flow from the outcrop areas of the aquifer to the west and north where recharge occurs toward the downdip portions of the aquifer. Kelley and others (2014) indicate recharge to the Woodbine Aquifer based on chloride mass balance calculations ranges from 0.04 to 1.6 inches per year. In the past, municipal and industrial pumping Grayson County caused large water level declines creating groundwater flow gradients toward the pumping center; however, these declines have moderated in the past decade as pumping rates have slowed (George and others, 2011).
Groundwater Pumping
Figure 4.144 provides a graph of the historic pumping volumes from the Woodbine Aquifer in the municipal, manufacturing, mining, and steam/electricity production, irrigation, and livestock sectors from 1980 to 2015. Overall, the pumping demand has generally increased since 1980, with spikes in pumping occurring in 2011 and 2012. Municipal production accounts for most of the production from the Woodbine Aquifer.
Subsidence Vulnerability
Clay thickness in the Woodbine is greatest in the downdip portion of the aquifer with values in much of the area exceeding 300 feet. The maximum reported total clay thickness in the aquifer is more than 600 feet. The average SRV based on clay thickness and extent is 2.3 with a third quartile of 3. Figure 4.145 illustrates the clay thickness and regional distribution of the thicknesses. The lithology of the Woodbine is primarily consolidated clastic material (SRV = 3).
For the evaluation, we assumed a preconsolidation equal to the water level from the end of the transient calibration period for the GAMs (Kelley and others, 2014). We also assumed a static water level in the aquifer equivalent to the results for 2017 from the adopted DFC model run for GMA 8 (Beach and others, 2016). The preconsolidation and static water levels resulted in an average and third quartile SRV of 3.0 for the aquifer.
Final Report: Identification of the Vulnerability of the Major and Minor Aquifers of Texas to Subsidence with Regard to Groundwater Pumping – TWDB Contract Number 1648302062
4-224
Figure 4.143. Conceptualized cross-section of the geologic sequence of the northern portion of the Woodbine Aquifer (Kelley and others, 2014).
Final Report: Identification of the Vulnerability of the Major and Minor Aquifers of Texas to Subsidence with Regard to Groundwater Pumping – TWDB Contract Number 1648302062
4-225
Table 4.61. Hydraulic properties for the Woodbine Aquifer.
Storativity 1.0 x 10⁻⁴ – 3.0 x 10⁻³ 1 References: (1) Kelley and others (2014)
Figure 4.144. Historic pumping volumes from the Woodbine Aquifer in the municipal, manufacturing, mining, and steam/electricity production, irrigation, and livestock sectors from 1980 to 2015 (TWDB, 2017b).
Final Report: Identification of the Vulnerability of the Major and Minor Aquifers of Texas to Subsidence with Regard to Groundwater Pumping – TWDB Contract Number 1648302062
4-226
Figure 4.145. Calculated Woodbine Aquifer clay thickness at well locations.
We determined the water level trend using the simulated water levels for 1992 through 2012 from the transient calibration period for the GAM (Kelley and others, 2014). DFC water levels are from the adopted DFCs for GMA 8 (Beach and others, 2016). Table 4.62 summarizes the data sources and values for each subsidence risk factor.
Final Report: Identification of the Vulnerability of the Major and Minor Aquifers of Texas to Subsidence with Regard to Groundwater Pumping – TWDB Contract Number 1648302062
4-227
Table 4.62. Woodbine Aquifer subsidence risk factor data sources and summary.
Subsidence Risk Factor Variable Data Source Value
3rd Quartile SRV
Clay Layer Thickness and Extent
SDR lithology table 0 to 862 feet 3
Clay Compressibility Estimated based on lithology Hard Clay 1
Aquifer Lithology Kelley and others (2014) Consolidated
Clastic 3
Preconsolidation Characterization
Water level from end of transient model simulations (Kelley and
others, 2014)
-216 to 830 feet mean sea level
3
Predicted 50-Year Water Level Decline based on
Trend
Trend in simulated water levels from transient and MAG model simulations (Kelley and others, 2014; Beach and others, 2016)
Average 39 feet decline
2
Predicted DFC Water Level Decline
Difference in head from final DFC and MAG simulations (Beach and
others, 2016)
Average 45 feet decline
2
Results of the assessment indicate the downdip (eastern) portions of the aquifer have the greatest risk for future subsidence due to pumping. Figure 4.146 illustrates the subsidence risk factor throughout the aquifer.
Final Report: Identification of the Vulnerability of the Major and Minor Aquifers of Texas to Subsidence with Regard to Groundwater Pumping – TWDB Contract Number 1648302062
4-228
Figure 4.146. Woodbine Aquifer subsidence risk vulnerability at well locations.
Final Report: Identification of the Vulnerability of the Major and Minor Aquifers of Texas to Subsidence with Regard to Groundwater Pumping – TWDB Contract Number 1648302062
4-229
4.3.21 Yegua-Jackson
The Yegua-Jackson Aquifer stretches in a relatively thin band approximately parallel to the coastline from Mexico to Louisiana. The width of this outcrop varies from less than 10 miles to nearly 40 miles with an area of approximately 11,000 square miles. Figure 4.147 provides a map of the aquifer extent. Groundwater is utilized almost exclusively from the unconfined portion of the aquifer for domestic and livestock purposes. Water is also used for some municipal, industrial, and irrigation purposes. The thickness ranges from the 1,800 feet in Central Texas to over 3,000 feet in the eastern and southern portions of the aquifer.
Figure 4.147. Yegua-Jackson Aquifer extent.
Final Report: Identification of the Vulnerability of the Major and Minor Aquifers of Texas to Subsidence with Regard to Groundwater Pumping – TWDB Contract Number 1648302062
4-230
Hydrostratigraphy
Groundwater in the Yegua-Jackson Aquifer is most abundant and potable in the Yegua Formation and Jackson Group (Preston, 2006). The aquifer consists of four units, from youngest to oldest, the Upper Jackson Unit, the Lower Jackson Unit, the Upper Yegua Unit, and the Lower Yegua Unit (Knox and others, 2007). Table 4.63 provides a geologic and hydrostratigraphic column for the Yegua-Jackson Aquifer and Figure 4.148 provides cross-sections of the aquifer in eastern and southern Texas.
Table 4.63. Stratigraphic column of the Yegua-Jackson illustrating the hydrogeologic units (Rogers, 1967; Preston, 2006; Deeds and others, 2010).
Era System Series Group Geologic Unit Hydrogeologic Unit
Cenozoic
Quaternary Pleistocene to Recent floodplain
(alluvium and fluviatile terrace deposits) Localized Alluvium Aquifers
Tertiary
Oligocene
Catahoula Sandstone
Confining Units Frio Clay
Eocene-Oligocene
Jackson
Whitsett
Yegua-Jackson Aquifer
Eocene
Manning
Wellborn
Caddell
Upper Claiborne
Yegua
Cook Mountain Confining Unit
The Yegua-Jackson Aquifer units dip toward the modern coastline and were deposited as part of the progressive filling of the ancient Gulf of Mexico basin by sand, silt, and clay carried from the mountains of northern Mexico and the Rocky Mountains. Due to the depositional environments of fluvial channel and deltaic sands, the most productive portions of the aquifer exist near rivers (Jackson and Garner, 1982). The oldest water-bearing formation of the Yegua-Jackson Aquifer lies within the Upper Claiborne Group of the Yegua Formation. The Yegua Formation consists of a gray to brown sandstone along with dark brown to gray shale. This formation varies in thickness from the thinnest section being 400 feet out in east Texas to 1,000 feet in the southeastern portion of the aquifer. The oldest formation of the Claiborne Group is the Cook Mountain Formation underlying the Yegua Formation. This formation is dominated by shale beds in between the sand dominated Yegua and Sparta Formations and acts as a confining unit for the Yegua-Jackson Aquifer (Deeds and others, 2010).
Final Report: Identification of the Vulnerability of the Major and Minor Aquifers of Texas to Subsidence with Regard to Groundwater Pumping – TWDB Contract Number 1648302062
4-231
Figure 4.148. Cross-sections of the Yegua-Jackson Aquifer (Knox and others, 2007).
Final Report: Identification of the Vulnerability of the Major and Minor Aquifers of Texas to Subsidence with Regard to Groundwater Pumping – TWDB Contract Number 1648302062
4-232
The Jackson Group is the additional water-bearing unit of the Yegua-Jackson Aquifer. The formations that compose this group from oldest to youngest are the Caddell, Wellborn, Manning, and Whitsett. The Caddell Formation is described as a combination of siltstone and sandstone with an approximated thickness of 50 to 150 feet. The overlying Wellborn Formation is a very-fine to coarse-grained sandstone with interspersed clay. Thickness of the Wellborn is generally 150 feet but has been noted to thin out to less than 50 feet in the east Texas area. The succeeding layer is the Manning Formation comprised of brown lignitic clay, sandstone, and tuff (Barnes, 1968). The youngest Whitsett Formation is a fine to medium-grained sandstone with tuff and lignitic composition.
The Jackson Group is confined by the overlying Catahoula and Vicksburg formations. The Vicksburg and Jackson Group both are mapped as a single unit, as the thickness of the Vicksburg is unknown since it cannot be distinguished from the Whitsett Formation (Deeds and others, 2010). The Vicksburg is made up of a fine-to medium-grained sandstone and interbedded silt and clay. The Catahoula Formation is composed of quartz-rich fluvial material mixed with distal rhyolitic air-fall ash from coeval volcanic source areas in the Trans-Pecos region of Texas and northern Mexico (Ledger, 1988). The Catahoula Formation is overlain by sediments that represent the start of a major transgressive cycle (Galloway and others, 1979).
Hydraulic Properties
Data for the hydraulic properties of the Yegua-Jackson Aquifer are limited; however, there have been estimates of transmissivity, hydraulic conductivity, and storativity from several aquifer tests. Table 4.64 provides a summary of the hydraulic properties calculated for the Yegua-Jackson Aquifer. Transmissivity for the aquifer has been noted to be higher in the upper portions of the outcrop and decrease down-dip (Deeds and others, 2010).
Table 4.64. Hydraulic properties for the Yegua-Jackson Aquifer.
Storativity 5 x 10⁻⁷ – 5 x 10⁻⁵ 3 References: (1) Seni and Choh (1994); (2) Hamilton (1994); (3) Deeds and others (2010)
Hydraulic Heads
Groundwater in the Yegua-Jackson Aquifer is found under water-table conditions in the shallow outcrop compared to confined conditions that are in the down-dip areas. In some confined areas, the potentiometric surface is known to at or near land surface due to artesian pressure. The general groundwater flow direction follows topographically high areas to low areas in shallow or unconfined zones. Groundwater in confined zones travels horizontally along the down-dip orientation of the formations towards the Gulf of Mexico in a southeastern direction.
Water level data for the Yegua-Jackson is differential for all four of the formations within the aquifer. The four formations of the Yegua-Jackson Aquifer show water level increases
Final Report: Identification of the Vulnerability of the Major and Minor Aquifers of Texas to Subsidence with Regard to Groundwater Pumping – TWDB Contract Number 1648302062
4-233
ranging from 10 to 20 feet. However, there was an increase in water level by 70 feet in a well located in the Upper Jackson unit. Large water level declines have been observed in both the Upper Jackson Yegua units of the aquifer. Due to the general lack of water level data, no conclusions can be drawn regarding the net decline or increase in water levels within the Yegua-Jackson Aquifer.
Groundwater Pumping
Figure 4.149 provides a graph of the historic pumping volumes from the Yegua-Jackson Aquifer in the municipal, manufacturing, mining, and steam/electricity production, irrigation, and livestock sectors from 2000 to 2015. Municipal use did not become the main source of pumping until 2006. Pumping rates increased steadily from 2000 to 2010. The average pumping rate of the Yegua-Jackson Aquifer is over 8,000 acre-feet per year during the reported period.
Figure 4.149. Historic pumping volumes from the Yegua-Jackson Aquifer in the municipal, manufacturing, mining, and steam/electricity production, irrigation, and livestock sectors from 2000 to 2015 (TWDB, 2017b).
Final Report: Identification of the Vulnerability of the Major and Minor Aquifers of Texas to Subsidence with Regard to Groundwater Pumping – TWDB Contract Number 1648302062
4-234
Subsidence Vulnerability
Clay thickness within the Yegua-Jackson Aquifer is, for the majority of wells, less than 15 feet. However, clay thicknesses in excess of 200 and 300 feet have been observed within the middle and downdip limit of the aquifer where wells are drilled to deeper depths in the aquifer. Figure 4.150 provides the clay thickness at well locations and the regional distribution of the thicknesses. The lithology of the Yegua-Jackson is described as unconsolidated clastic material consisting of sequences of sand layers interspersed with clay and silt. The clay is categorized as stiff clay.
Figure 4.150. Calculated Yegua-Jackson Aquifer clay thickness at well locations.
Final Report: Identification of the Vulnerability of the Major and Minor Aquifers of Texas to Subsidence with Regard to Groundwater Pumping – TWDB Contract Number 1648302062
4-235
Most of the water level data is located within or near the unconfined zone of the aquifer; water levels have been generally stable through time with localized areas experiencing increases and decreases in water level.
For our evaluation, we set the preconsolidation level at the well sites to the minimum water level from the transient calibration period of the Yegua-Jackson Aquifer GAM (Deeds and others, 2010). For the static water level, we used the simulated water level for 2017 from a predictive model run (Oliver, 2010). We calculated the water level trend using the simulated water levels from 1991 through 2017 from the predictive model run (Oliver, 2010). For the DFC levels, we extended the simulation conducted by Oliver (2010) through 2070 with no changes to input parameters and used the simulated water levels for 2010 and 2070 as the base and predicted DFC water levels. Table 4.65 summarizes the data sources and values for each subsidence risk factor.
Table 4.65. Yegua-Jackson subsidence risk factor data sources and summary.
Subsidence Risk Factor Variable Data Source Value
3rd Quartile SRV
Clay Layer Thickness and Extent
SDR lithology table 0 to 1,338 feet 3
Clay Compressibility Estimated based on lithology Stiff Clay 2
Aquifer Lithology Deeds and others (2010) Unconsolidated
Clastic 4
Preconsolidation Characterization
Minimum water level from transient model simulations
(Deeds and others, 2010)
16 to 453 feet mean sea level
3
Predicted Water Level Decline based on Trend
Trend in simulated water levels from transient and predictive
model simulations (Oliver, 2010)
Less than 1-foot decline
2
Predicted DFC Water Level Decline
Simulated water levels from predictive model simulations
(Oliver, 2010) Average 1-foot rise 2
Results of the assessment suggest that the Yegua-Jackson Aquifer has a medium to high risk for future subsidence due to pumping. Figure 4.151 illustrates the subsidence risk factor throughout the aquifer.
Final Report: Identification of the Vulnerability of the Major and Minor Aquifers of Texas to Subsidence with Regard to Groundwater Pumping – TWDB Contract Number 1648302062
4-236
Figure 4.151. Yegua-Jackson Aquifer subsidence risk vulnerability at well locations.
Final Report: Identification of the Vulnerability of the Major and Minor Aquifers of Texas to Subsidence with Regard to Groundwater Pumping – TWDB Contract Number 1648302062
5-1
5 Discussion A total of 344,564 wells were analyzed for subsidence risk in this project. Table 5.1 presents the average subsidence related properties for the major aquifers of Texas. Table 5.2 presents the average subsidence related properties for the minor aquifers of Texas. The values shown in these tables indicate that there is a large variation among several important aquifer properties that influence aquifer subsidence, including clay and aquifer thicknesses. For clay thicknesses, the average value presented reflects the average of thicknesses calculated using the methods described in Section 3.4.1.
We defined the aquifer subsidence risks by statistics for the total weighted risk (TWR) calculated per the method discussed in Section 3.4.4 Aquifer Subsidence Risk Matrix. A TWR value was calculated for each well within an aquifer. As might be expected, there is often significant spatial variability in the calculated TWR values. Figure 5.1 and Figure 5.2 illustrate the calculated TWR values at well locations for the major and minor aquifers, respectively.
Using the values for each well, we then we calculated aggregate statistics for TWR for all wells in each aquifer. These statistics are shown in Table 5.3 and include the mean, standard deviation, minimum, first through third quartile cutoff values, and maximum TWR values. The first and third quartile TWR cutoffs split the data into the lowest 25 percent and highest 25 percent, respectively, while the second quartile cutoff represents the median value for the aquifer.
In Table 5.3, we sorted the aquifers by the cutoff value for the third quartile TWR. We used the third quartile cutoff values because it places more emphasis on the upper end of the TWR for each aquifer and will somewhat correct for issues associated with data uncertainty (such as, partial penetration of wells). We considered aquifers with a TWR third quartile cutoff value of 4.7 or above at high risk for subsidence. Aquifers with third quartile values between 3.8 and 4.5 are considered at medium risk for aquifer subsidence. In general, these aquifers lack at least one major subsidence risk factor (lithology type that is not considered for high risk or no significant predicted decline in water levels). Aquifers with third quartile values at 3.1 or below are not considered at significant subsidence risk outside of certain localized areas.
Figure 5.3 and Figure 5.4 provide histograms of each major and minor aquifer’s distribution of the well TWR data, respectively. These histograms show that the aquifer risk distribution for some aquifers follows an approximately normal distribution with most wells clustering around the mean (for example, the Carrizo-Wilcox or Seymour). Some aquifers follow bi-modal (Gulf Coast, Chicot, or Hueco-Mesilla Bolson) distributions while others (Igneous or Marathon) follow a distribution clustered at the low end of the TWR range. Finally, some aquifers (Yegua-Jackson, Woodbine, and Gulf Coast) show a significant fraction of wells with a TWR above 5 indicating large areas where subsidence risk is high.
Final Report: Identification of the Vulnerability of the Major and Minor Aquifers of Texas to Subsidence with Regard to Groundwater Pumping – TWDB Contract Number 1648302062
5-2
Table 5.1. Average subsidence related properties for the major aquifers of Texas.
Aquifer
Pre
do
min
an
t A
qu
ife
r L
ith
olo
gy
Aq
uif
er
Th
ick
ne
ss
(fe
et)
Cla
y T
hic
kn
ess
wit
hin
A
qu
ife
r (f
ee
t)
Pre
do
min
an
t A
qu
ife
r C
lay
Ty
pe
Min
imu
m C
lay
C
om
pre
ssib
ilit
y (
psi
-1)
Ma
xim
um
Cla
y
Co
mp
ress
ibil
ity
(p
si-1
)
50
-Ye
ar
Wa
ter
Le
ve
l T
ren
d
(ne
ga
tiv
e f
or
de
clin
e)
(fe
et)
DF
C W
ate
r L
ev
el
Ch
an
ge
(n
eg
ati
ve
fo
r d
ecl
ine
) (f
ee
t)
Carrizo-Wilcox UC 401 66 H 4.8E-04 9.0E-04 -17 -19 Edwards (BFZ) C 436 4 H 4.8E-04 9.0E-04 0 0
Edwards-Trinity (Plateau) C 388 11 H 4.8E-04 9.0E-04 -9 -7 Gulf Coast UC 650 66 P 1.8E-03 1.4E-02 0 -28
Hueco-Mesilla Bolson UC 810 23 P 1.8E-03 1.4E-02 0 0 Ogallala UC 223 17 S 9.0E-04 1.8E-03 -43 -35
Pecos Valley UC 549 36 P 1.8E-03 1.4E-02 -13 -50 Seymour UC 44 5 H 4.8E-04 9.0E-04 0 7 Trinity CC 259 82 H 4.8E-04 9.0E-04 -38 -50
Predominant aquifer lithology codes: UC = Unconsolidated Clastic, CC = Consolidated Clastic, C = Carbonate, I = Igneous Predominant aquifer clay type codes: H = Hard Clay, S = Stiff Clay, P = Plastic Clay
Final Report: Identification of the Vulnerability of the Major and Minor Aquifers of Texas to Subsidence with Regard to Groundwater Pumping – TWDB Contract Number 1648302062
5-3
Table 5.2. Average subsidence related properties for the minor aquifers of Texas.
Aquifer
Pre
do
min
an
t A
qu
ife
r L
ith
olo
gy
Aq
uif
er
Th
ick
ne
ss
(fe
et)
Cla
y T
hic
kn
ess
wit
hin
A
qu
ife
r (f
ee
t)
Pre
do
min
an
t A
qu
ife
r C
lay
Ty
pe
Min
imu
m C
lay
C
om
pre
ssib
ilit
y (
psi
-1)
Ma
xim
um
Cla
y
Co
mp
ress
ibil
ity
(p
si-1
)
50
-Ye
ar
Wa
ter
Le
ve
l T
ren
d
(ne
ga
tiv
e f
or
de
clin
e)
(fe
et)
DF
C W
ate
r L
ev
el
Ch
an
ge
(n
eg
ati
ve
fo
r d
ecl
ine
) (f
ee
t)
Blaine C 389 24 H 4.8E-04 9.0E-04 0 -6 Blossom CC 271 17 H 4.8E-04 9.0E-04 -1 0
Bone Spring-Victorio Peak C 557 3 H 4.8E-04 9.0E-04 -2 0 Brazos River Alluvium UC 54 1 P 1.8E-03 1.4E-02 0 0 Capitan Reef Complex C 1,033 3 H 4.8E-04 9.0E-04 1 -3
Dockum CC 923 96 H 4.8E-04 9.0E-04 0 -78 Edwards-Trinity (High Plains) C 111 20 H 4.8E-04 9.0E-04 0 -87
Ellenburger-San Saba C 494 26 H 4.8E-04 9.0E-04 0 -2 Hickory CC 203 17 H 4.8E-04 9.0E-04 0 0 Igneous I 2,210 11 H 4.8E-04 9.0E-04 0 -27
Lipan UC 107 12 S 9.0E-04 1.8E-03 0 0 Marathon C 215 0 H 4.8E-04 9.0E-04 1 0
Marble Falls C 139 7 H 4.8E-04 9.0E-04 0 -1 Nacatoch CC 199 16 H 4.8E-04 9.0E-04 7 1
Queen City UC 425 42 H 4.8E-04 9.0E-04 1 -3 Rita Blanca CC 184 83 H 4.8E-04 9.0E-04 0 -50
Rustler CC 335 79 H 4.8E-04 9.0E-04 0 -8 Sparta UC 176 28 H 4.8E-04 9.0E-04 2 -6
West Texas Bolsons UC 1,294 2 P 1.8E-03 1.4E-02 0 -74 Woodbine CC 256 104 H 4.8E-04 9.0E-04 -39 -45
Yegua-Jackson UC 828 110 S 9.0E-04 1.8E-03 0 1 Predominant aquifer lithology codes: UC = Unconsolidated Clastic, CC = Consolidated Clastic, C = Carbonate, I = Igneous Predominant aquifer clay type codes: H = Hard Clay, S = Stiff Clay, P = Plastic Clay
Final Report: Identification of the Vulnerability of the Major and Minor Aquifers of Texas to Subsidence with Regard to Groundwater Pumping – TWDB Contract Number 1648302062
5-4
Figure 5.1. Calculated total weighted risk for the major aquifers in Texas.
Final Report: Identification of the Vulnerability of the Major and Minor Aquifers of Texas to Subsidence with Regard to Groundwater Pumping – TWDB Contract Number 1648302062
5-5
Figure 5.2. Calculated total weighted risk for the minor aquifers in Texas.
Final Report: Identification of the Vulnerability of the Major and Minor Aquifers of Texas to Subsidence with Regard to Groundwater Pumping – TWDB Contract Number 1648302062
5-6
Table 5.3. Total Weighted Risk statistics by aquifer (ranked by third-quartile cutoff on TWR).
Aquifer Name Number of Wells
Analyzed
Mean Weighted
Risk
Standard Deviation
of Risk
Minimum Risk
First Quartile
Risk
Median Risk
Third Quartile
Risk
Maximum Risk
Weighted Subsidence
Risk Category
Gulf Coast 105,292 4.9 1.8 1.9 3.3 5.8 5.9 9.1 High: Subsidence Risk is high with high
Final Report: Identification of the Vulnerability of the Major and Minor Aquifers of Texas to Subsidence with Regard to Groundwater Pumping – TWDB Contract Number 1648302062
5-7
Figure 5.3. Histograms of total weighted risk for each major aquifer.
Final Report: Identification of the Vulnerability of the Major and Minor Aquifers of Texas to Subsidence with Regard to Groundwater Pumping – TWDB Contract Number 1648302062
5-8
Figure 5.3. Histograms of total weighted risk for each major aquifer (continued).
Final Report: Identification of the Vulnerability of the Major and Minor Aquifers of Texas to Subsidence with Regard to Groundwater Pumping – TWDB Contract Number 1648302062
5-9
Figure 5.3. Histograms of total weighted risk for each major aquifer (continued).
Final Report: Identification of the Vulnerability of the Major and Minor Aquifers of Texas to Subsidence with Regard to Groundwater Pumping – TWDB Contract Number 1648302062
5-10
Figure 5.4. Histograms of total weighted risk for each minor aquifer.
Final Report: Identification of the Vulnerability of the Major and Minor Aquifers of Texas to Subsidence with Regard to Groundwater Pumping – TWDB Contract Number 1648302062
5-11
Figure 5.4. Histograms of total weighted risk for each minor aquifer (continued).
Final Report: Identification of the Vulnerability of the Major and Minor Aquifers of Texas to Subsidence with Regard to Groundwater Pumping – TWDB Contract Number 1648302062
5-12
Figure 5.4. Histograms of total weighted risk for each minor aquifer (continued).
Final Report: Identification of the Vulnerability of the Major and Minor Aquifers of Texas to Subsidence with Regard to Groundwater Pumping – TWDB Contract Number 1648302062
5-13
Figure 5.4. Histograms of total weighted risk for each minor aquifer (continued).
Final Report: Identification of the Vulnerability of the Major and Minor Aquifers of Texas to Subsidence with Regard to Groundwater Pumping – TWDB Contract Number 1648302062
5-14
Figure 5.4. Histograms of total weighted risk for each minor aquifer (continued).
Final Report: Identification of the Vulnerability of the Major and Minor Aquifers of Texas to Subsidence with Regard to Groundwater Pumping – TWDB Contract Number 1648302062
5-15
Figure 5.4. Histograms of total weighted risk for each minor aquifer (continued).
Final Report: Identification of the Vulnerability of the Major and Minor Aquifers of Texas to Subsidence with Regard to Groundwater Pumping – TWDB Contract Number 1648302062
5-16
We also created box plots of the TWR distribution for each well. Figure 5.5 presents a legend for the important values shown on the box plots. Note that Figure 5.5 presents actual data for the Ogallala Aquifer, as this is a useful aquifer for discussion purposes. Box plots for the aquifers are shown in Figure 5.6 (major aquifers) and Figure 5.7 (minor aquifers). Box plots show a rectangular box with the top and bottom of the box at the third and first quartile cutoff values, and a horizontal line at the median value for the aquifer. The top and bottom of the “whiskers” extend to actual data points within 1.5 times the Inter-Quartile Range of all wells in the dataset. The aquifers have been sorted and colored from left to right according to the third quartile on aquifer subsidence risk.
Violin plots were also created to display the variation of the datasets within the aquifers and are shown in Figure 5.8 (major aquifers) and Figure 5.9 (minor aquifers). The legend for interpreting the violin plots is shown compared to a box plot in Figure 5.5. Violin plots are similar to box plots, however, the width of the bounding curves on the violin plots corresponds to the density of data points along the vertical axis. Therefore, the width of the violin plot is greatest where there are the most wells at certain TWR levels and is thinner where there are fewer data points at a given TWR level. A miniature box plot is also shown inside each of the violin plots.
The common characteristic between the seven aquifers identified as having high subsidence risk is that they are unconsolidated clastic aquifers. Clay types, storage coefficients, and water level trends varied among these aquifers indicating that there is no single subsidence risk factor other than the broad aquifer lithology types that is responsible for an aquifer being classified as having high subsidence risk.
Final Report: Identification of the Vulnerability of the Major and Minor Aquifers of Texas to Subsidence with Regard to Groundwater Pumping – TWDB Contract Number 1648302062
5-17
Figure 5.5. Box Plot and Violin Plot legend.
Final Report: Identification of the Vulnerability of the Major and Minor Aquifers of Texas to Subsidence with Regard to Groundwater Pumping – TWDB Contract Number 1648302062
5-18
Figure 5.6. Major aquifer Box Plot of the total weighted risk.
Final Report: Identification of the Vulnerability of the Major and Minor Aquifers of Texas to Subsidence with Regard to Groundwater Pumping – TWDB Contract Number 1648302062
5-19
Figure 5.7. Minor aquifer Box Plot of the total weighted risk.
Final Report: Identification of the Vulnerability of the Major and Minor Aquifers of Texas to Subsidence with Regard to Groundwater Pumping – TWDB Contract Number 1648302062
5-20
Figure 5.8. Major aquifer Violin Plot of the total weighted risk.
Final Report: Identification of the Vulnerability of the Major and Minor Aquifers of Texas to Subsidence with Regard to Groundwater Pumping – TWDB Contract Number 1648302062
5-21
Figure 5.9. Minor aquifer Violin Plot of the total weighted risk.
Final Report: Identification of the Vulnerability of the Major and Minor Aquifers of Texas to Subsidence with Regard to Groundwater Pumping – TWDB Contract Number 1648302062
6-1
6 Subsidence Prediction
6.1 Subsidence Prediction Methodology
In Section 3.4 we discussed the three primary variables that determine the magnitude, location, and timing of subsidence related to groundwater pumping. Compaction of the aquifer materials, and associated land surface subsidence, occurs when there is an increase in the effective stress. We considered several subsidence prediction methods including Depth porosity, Yamaguchi, Geertsma, and Simple skeletal storage (American Geophysical Union, 1984). We also considered the use of one dimensional MODFLOW models with subsidence packages (Hoffman and others, 2003; Leake and Galloway, 2007). Ultimately, we selected the skeletal storage method implemented in the MODFLOW SUB-WT package (Leake and Galloway, 2007) because the results are more precise, make better use of the data types available, have input variables that can be improved through data collection, and will be more consistent with GAMs that might be updated with MODFLOW subsidence packages. To predict the potential subsidence, we applied the relation developed by Terzaghi (1925) and used in the MODFLOW subsidence packages (Hoffman and others, 2003; Leake and Galloway, 2007) to calculate the change in effective stress within the aquifer due to the changes in water level.
According to Terzaghi’s relation, the effective stress within aquifer may be simplified into two components, namely, geostatic stress and hydrostatic stress (Leake and Galloway, 2007):
𝜎′ = 𝜎 − 𝑢 (1)
where
𝜎′ = 𝑒𝑓𝑓𝑒𝑐𝑡𝑖𝑣𝑒 𝑠𝑡𝑟𝑒𝑠𝑠 (𝑝𝑠𝑖)
𝜎 = 𝑔𝑒𝑜𝑠𝑡𝑎𝑡𝑖𝑐 𝑠𝑡𝑟𝑒𝑠𝑠 (𝑝𝑠𝑖)
𝑢 = ℎ𝑦𝑑𝑟𝑜𝑠𝑡𝑎𝑡𝑖𝑐 𝑠𝑡𝑟𝑒𝑠𝑠 (𝑝𝑠𝑖)
Poland and Davis (1969) express the geostatic stress as:
𝜎 = 𝑑𝑚𝛾𝑚 + 𝑑𝑠𝛾𝑠 (2)
with
𝛾𝑚 = 𝛾𝑔(1 − 𝑛) + 𝑛𝑤𝛾𝑤, and (3)
𝛾𝑠 = 𝛾𝑔 − 𝑛(𝛾𝑔 − 𝛾𝑤) (4)
and hydrostatic stress as:
𝑢 = 𝑑𝑠𝛾𝑤 (5)
Final Report: Identification of the Vulnerability of the Major and Minor Aquifers of Texas to Subsidence with Regard to Groundwater Pumping – TWDB Contract Number 1648302062
Calculation of the unit weight (γ) requires the density (ρ) of the material in question which is multiplied by gravity (g). For the density of sediments, we used a constant value of 9.65x10⁻² lb/in3 (2.67 g/cm3; from Morris and Johnson, 1967). For water, we calculated the density based on the salinity, temperature (t), and aquifer depth using slightly modified forms of the equations described by Gill (1982) that are provided in Appendix 6.
For each aquifer, we applied an estimate of porosity based on the lithology of the aquifer. For the moisture content of sediments in the unsaturated zone, we used a retention factor of 25 percent of the estimated aquifer porosity. Using these values, along with the density of water and the sediments, we calculated the effective stress under the various water level conditions.
Using the methods described by Leake and Galloway (2007), we related the calculated changes in effective stress to compaction using a one-dimensional soil-mechanics approach where the void ratio (e) decreases linearly with an increase in the logarithm of effective stress:
∆𝑒 = −𝐶𝑐∆ log10 𝜎′ 𝜎′ > 𝜎𝑐′ (6)
∆𝑒 = −𝐶𝑟∆ log10 𝜎′ 𝜎′ ≤ 𝜎𝑐′ (7)
where
𝐶𝑐 = 𝑐𝑜𝑚𝑝𝑟𝑒𝑠𝑠𝑖𝑜𝑛 𝑖𝑛𝑑𝑒𝑥 (𝑖𝑛−1)
𝐶𝑟 = 𝑟𝑒𝑐𝑜𝑚𝑝𝑟𝑒𝑠𝑠𝑖𝑜𝑛 𝑖𝑛𝑑𝑒𝑥 (𝑖𝑛−1)
𝜎𝑐′ = 𝑝𝑟𝑒𝑐𝑜𝑛𝑠𝑜𝑙𝑖𝑑𝑎𝑡𝑖𝑜𝑛 𝑠𝑡𝑟𝑒𝑠𝑠 (𝑝𝑠𝑖)
Final Report: Identification of the Vulnerability of the Major and Minor Aquifers of Texas to Subsidence with Regard to Groundwater Pumping – TWDB Contract Number 1648302062
6-3
When 𝜎′ > 𝜎𝑐′, the resulting reductions in the void ratio (e) are permanent and is the result
of inelastic compaction. However, the changes in e when 𝜎′ ≤ 𝜎𝑐′ result from elastic
compaction or expansion. Changes due to elastic compaction or expansion are much smaller than inelastic changes as the recompression index is much smaller than the compression index (Leake and Galloway, 2007).
The specific storage (Ss) of aquifer sediments is the volume of water released from or added to storage in a unit volume of aquifer per unit decline or rise in water level (Bear, 1979). The specific storage value may be further defined as the sum of the elastic (Sske) and inelastic (Sskv) components (Hoffman and others, 2003) with the inelastic component being approximately 100 times greater than the elastic component (Leake and Prudic, 1991; Young and others, 2006). Leake and Galloway (2007) provide equations relating the components of specific storage to the compression and recompression indices as (Note: equation is valid only for metric (SI) units):
𝑆𝑠𝑘𝑣 =0.434𝐶𝑐𝛾𝑤
𝜎′(1+𝑒0), and 𝑆𝑠𝑘𝑒 =
0.434𝐶𝑟𝛾𝑤
𝜎′(1+𝑒0) (8)
where
𝑆𝑠𝑘𝑣 = 𝑖𝑛𝑒𝑙𝑎𝑠𝑡𝑖𝑐 𝑠𝑝𝑒𝑐𝑖𝑓𝑖𝑐 𝑠𝑡𝑜𝑟𝑎𝑔𝑒 (𝑚−1) – multiply by 0.3048 to get per foot (ft-1)
𝑆𝑠𝑘𝑒 = 𝑒𝑙𝑎𝑠𝑡𝑖𝑐 𝑠𝑝𝑒𝑐𝑖𝑓𝑖𝑐 𝑠𝑡𝑜𝑟𝑎𝑔𝑒 (𝑚−1) – multiply by 0.3048 to get per foot (ft-1)
𝑒0 = 𝑖𝑛𝑖𝑡𝑖𝑎𝑙 𝑣𝑜𝑖𝑑 𝑟𝑎𝑡𝑖𝑜 (%)
By first calculating the specific storage values, we are able to then solve for the compression and recompression indices. Assuming a constant relationship of inelastic specific storage being 100 times greater than elastic specific storage, we first calculated the elastic specific storage using an approach to account for the depth and lithology (Kelley and others, 2004; Young and others, 2006):
Final Report: Identification of the Vulnerability of the Major and Minor Aquifers of Texas to Subsidence with Regard to Groundwater Pumping – TWDB Contract Number 1648302062
For porosity of the materials, we used an estimated value based on published ranges for the type of aquifer deposits (Freeze and Cherry, 1979). To simplify the estimates, we applied a porosity of 50 percent to clay, 10 percent to fractured igneous rock, 20 percent to carbonate rock, 25 percent to consolidated clastic sediments, and 35 percent to unconsolidated sediments. Like density, the compressibility of water is also dependent on temperature and pressure. To incorporate compressibility into our equations, we used Kell’s (1975) equation for the isothermal compressibility of water (Note: equation is valid only for metric (SI) units):
𝛽 = 𝑖𝑠𝑜𝑡ℎ𝑒𝑟𝑚𝑎𝑙 𝑐𝑜𝑚𝑝𝑟𝑒𝑠𝑠𝑖𝑏𝑖𝑙𝑖𝑡𝑦 (𝑃𝑎−1) – multiply by 6894.745 to get (psi-1)
𝑡 = 𝑡𝑒𝑚𝑝𝑒𝑟𝑎𝑡𝑢𝑟𝑒 (℃)
Rearranging the equations from Leake and Galloway (2007) relating the components of specific storage to the compression and recompression then allows us to solve for the coefficients needed to calculate potential compaction:
𝐶𝑐 =𝜎′(1+𝑒0)𝑆𝑠𝑘𝑣
0.434𝛾𝑤 (14)
𝐶𝑟 =𝜎′(1+𝑒0)𝑆𝑠𝑘𝑒
0.434𝛾𝑤 (15)
Final Report: Identification of the Vulnerability of the Major and Minor Aquifers of Texas to Subsidence with Regard to Groundwater Pumping – TWDB Contract Number 1648302062
6-5
We then calculated the potential change in aquifer material thickness as (Leake and Galloway, 2007):
∆𝑏 =0.434𝑏0
(1+𝑒0)𝜎′ [𝐶𝑛(𝜎𝑛′ − 𝜎𝑐,𝑛−1
′ ) + 𝐶𝑟(𝜎𝑐,𝑛−1′ − 𝜎𝑛−1
′ )]; 𝐶𝑛 = {𝐶𝑐, 𝜎𝑛
′ > 𝜎𝑐,𝑛−1′
𝐶𝑟 , 𝜎𝑛′ ≤ 𝜎𝑐,𝑛−1
′ (16)
where
∆𝑏 = 𝑐𝑜𝑚𝑝𝑎𝑐𝑡𝑖𝑜𝑛 𝑜𝑟 𝑒𝑥𝑝𝑎𝑛𝑠𝑖𝑜𝑛 𝑜𝑓 𝑠𝑒𝑑𝑖𝑚𝑒𝑛𝑡𝑠 (𝑚) – multiply by 0.3048 to get per foot (ft-1)
Final Report: Identification of the Vulnerability of the Major and Minor Aquifers of Texas to Subsidence with Regard to Groundwater Pumping – TWDB Contract Number 1648302062
6-6
6.2 Subsidence Prediction Screening Tool Development
As part of our investigation of the vulnerability of the major and minor aquifers of Texas to subsidence with regard to groundwater pumping, we developed a tool to provide a screening-level analysis of subsidence potential. For ease of use by potential users, we developed the tool using Microsoft Excel 2016 (Version 1802, Build 9029.2167 Click-to-Run). The tool estimates land-surface subsidence, using the general expression for compaction or expansion of aquifer sediments based on user input and typical values for various parameters. We designed the tool to express subsidence potential as a table and graph of the numerical estimate of predicted subsidence based on given aquifer properties. For the input location, the tool also considers the weighted aquifer subsidence vulnerability value per the method described in Section 3.4.
6.2.1 Subsidence Prediction Tool File Description
We saved the original file as an Excel Binary Workbook (*.xlsb file extension). Some calculations in the workbook use custom functions written in Visual Basic for Applications (VBA). In addition, the tool populates some variables using macros. To effectively use the tool, users will need to allow macros to run within the application. To enable macros in Excel, click Developer > Macro Security and select the Enable all macros button. If the “Developer” tab is not visible, click File > Options > Customize Ribbon and select the Developer check box.
We applied several options to prevent accidental changes to the subsidence prediction tool. First, we made the calculation worksheet tab invisible. To view the tab, click File > Options > Advanced and under Display options for this workbook select the Show sheet tabs check box.
We also set password protection on the worksheets and VBA project. The password for all items in the application is Water4Texas. To unprotect a worksheet, click Review > Unprotect Sheet and enter the password. Alternatively, users can unprotect all of the worksheets at one time by clicking Developer > Macros, selecting ThisWorkbook.unProtectSheets, then clicking Run (see Figure 6.1). Listed in the Macro dialog box are a total of four macros that perform the following functions:
• ThisWorkbook.hideReferenceSheets hides all the worksheets in the tool except for the sheet on which the calculations are performed.
• ThisWorkbook.protectSheets applies password protection to all worksheets in the workbook.
• ThisWorkbook.unhideReferenceSheets makes all the worksheets visible to the user. • ThisWorkbook.unprotectSheets removes protection from all worksheets in the
workbook.
Final Report: Identification of the Vulnerability of the Major and Minor Aquifers of Texas to Subsidence with Regard to Groundwater Pumping – TWDB Contract Number 1648302062
6-7
Figure 6.1. Microsoft Excel macro dialog box.
As stated above, we applied the protection to prevent accidental changes to the subsidence prediction tool. However, the user will need to unprotect the worksheet to make intentional changes, such as formatting the charts created by the tool (the charts are described in Section 2). For example, to adjust the scale of the axis on the charts, the user should run the macro for unprotecting the sheets, make the desired changes, then run the macro to protect the sheets.
We set the subsidence prediction tool to populate with default or suggested values each time the user opens the workbook. Upon opening the workbook, the tool will set the Aquifer to General Calculation, the Well Name to Well, and the Water Levels to Use for Predictions to Current and Trend (see Figure 6.2). Upon setting these initial values, the tool clears several of the User Input Values and recalculates the predicted water levels. However, if a user wishes to save a workbook with the entries for a particular well, the user should uncheck the box next to Reset Subsidence Prediction Tool on Open.
Figure 6.2. General information input section from the subsidence prediction tool.
Final Report: Identification of the Vulnerability of the Major and Minor Aquifers of Texas to Subsidence with Regard to Groundwater Pumping – TWDB Contract Number 1648302062
We recommend saving a copy of the workbook prior to making changes to input variables. Light blue shading indicates manual input variables for the subsidence calculation. Orange shading indicates calculated and other automatically populated fields. Light gray shading indicates drop-down boxes with available selections. The following provides a brief description of each input variable and its associated units:
• Aquifer: A drop-down menu for each major and minor aquifer where upon selection the aquifer properties are populated with the average values for that aquifer. Note that this drop-down menu also contains a “General Calculation” aquifer where the aquifer properties are left blank for the user to input the appropriate information.
• Report Generated by: a “Name” field intended to contain the identity of the tool user. • Well Name: if applicable, the well identification where the user is calculating
potential subsidence. • Water Levels to Use for Predictions: A drop-down box that allows the user to base
potential subsidence predictions on the current water level and the water level trend or the base and future water levels.
• Land Surface (feet mean sea level): The surface elevation. • Aquifer Top (feet mean sea level): The elevation of the top of the aquifer. • Aquifer Thickness (feet): The aquifer thickness. • Clay Thickness (feet): Clay thickness in the aquifer. • Groundwater temperature (Degrees Celsius): The temperature of the water within
the aquifer. Used in conjunction with the TDS value to calculate the density of the water within the aquifer.
• Groundwater Total Dissolved Solids (TDS in milligrams per liter): The TDS value of the groundwater within the aquifer.
• Predevelopment Water Level (feet mean sea level): The water level within the aquifer prior to any historical pumping.
• Current Water Level (feet mean sea level): The current water level within the aquifer.
• Unsaturated Thickness (feet mean sea level): Estimate of the unsaturated thickness below land surface above the water table. For a confined aquifer, the value represents the estimated depth from land surface to the water level in the aquifer or formation closest to land surface.
• Preconsolidation Water Level (feet mean sea level): The deepest measured water level within the aquifer.
• Base Water Level (feet mean sea level): The starting water level for subsidence prediction. For example, this value could be the base year desired future condition water level.
• Future Water Level (feet mean sea level): The ending water level for subsidence prediction. For example, this value could be the ending year desired future condition water level.
• Beginning Year for Subsidence Evaluation: The first year for the Water Level Prediction chart and aquifer Drawdown and Subsidence Prediction chart.
Final Report: Identification of the Vulnerability of the Major and Minor Aquifers of Texas to Subsidence with Regard to Groundwater Pumping – TWDB Contract Number 1648302062
6-9
• Ending Year for Subsidence Evaluation: The final year for the Water Level Prediction chart and aquifer Drawdown and Subsidence Prediction chart.
Based on the above variables the tool populates the following default or suggested values (Note: blue shaded cells may be manually changed/overwritten):
• Water Level Trend (feet per year): The average water level trend for the aquifer. Negative values indicate declining water levels and positive values indicate rising water levels.
• Predominant Aquifer Lithology: The broad lithology classification for the aquifer. Classifications as shown in Table 3.4. A drop-down menu provides the four available options.
• Aquifer Storage Coefficient (dimensionless): The storage coefficient for the aquifer, describing how much water is released per foot decline in aquifer water level.
• Aquifer Porosity (percent): The aquifer porosity entered as a number between 0 and 100. For example, 35 percent is entered as 35 and not as 0.35.
• Predominant Aquifer Clay Type: The predominant clay type within the aquifer. A drop-down menu provides the three available options.
• Aquifer Clay Porosity: The porosity of the clay within the aquifer based on the predominant aquifer clay type entered as a number between 0 and 100. For example, 35 percent is entered as 35 and not as 0.35.
• Minimum and Maximum Aquifer Compressibility (psi-1): The minimum and maximum values of the compressibility of the aquifer based on the predominant aquifer lithology. Table 3.3 presents the minimum and maximum aquifer compressibility values by aquifer type. The values will automatically update to typical minimum and maximum values based on the selected Predominant Aquifer Lithology.
• Minimum and Maximum Clay Compressibility (psi-1): The minimum and maximum values of the compressibility of the clay within the aquifer based on the clay type. Values for each clay type are presented in Table 3.3. The values will automatically update to typical minimum and maximum values based on the selected Predominant Aquifer Clay Type.
• Minimum and maximum aquifer elastic specific storage (foot-1): The minimum and maximum values of the elastic component of specific storage (Sske). The equation used to calculate these values is described in additional detail in Section 6.1 (see Equation 9).
• Minimum and maximum aquifer inelastic specific storage (foot-1): The minimum and maximum values of the inelastic component of specific storage (Sskv).The equation used to calculate these values is described in additional detail in Section 6.1(see Equation 10).
• Total Weighted Risk for Well: The weighted total estimated weighted subsidence risk for the well according to the input parameters. This value is calculated according to the method described in Section 3.4.
Final Report: Identification of the Vulnerability of the Major and Minor Aquifers of Texas to Subsidence with Regard to Groundwater Pumping – TWDB Contract Number 1648302062
6-10
6.2.3 Calculating Subsidence Predictions
Upon opening the subsidence prediction tool, the user will see the information similar to Figure 6.3 and Figure 6.4 (actual display will vary depending on screen size). As shown in Figure 6.3, the tool opens with a General Calculation specification for the Aquifer, where the input variables are blank and the parameters shown in Figure 6.4 are populated with default values. The user will input values for each of the blank parameters to calculate a Total Weighted Risk for the well. Within the tool, blue cells indicate user input parameters, orange cells indicate calculated parameters, and gray cells indicate a drop-down menu.
To populate the User Input Values with the average values for a specific aquifer, the user may select the aquifer on interest from the drop-down menu (see Figure 6.5). Figure 6.6 illustrates the population of the User Input Values with the average values for the Pecos Valley Aquifer when the user selects Pecos Valley for the Aquifer. If the user is uncertain of the specific information for a particular well location, these default values will provide an initial estimate of the subsidence risk which for the Pecos Valley Aquifer is 5.78 (see Figure 6.6).
The user may refine the User Input Values by entering specific information for a well while leaving the default suggested values for unknown parameters. For example, if a user is investigating the subsidence potential for the well completed in the Pecos Valley Aquifer with Tracking Number 417430 in the SDR database, the user could enter the aquifer information at the well site (see Figure 6.7). The subsidence tool will use the entered values along with the default suggested values to calculate a Total Weighted Risk for Well of 6.72 indicating high subsidence risk at the location (see Figure 6.8).
The Total Weighted Risk for Well is one of the primary outputs for the tool. The calculated value allows the user to quickly assess the potential risk for subsidence at the location using a scale from 0 (lowest potential subsidence risk) to 10 (highest potential subsidence risk). Users are referred to Section 3.4 for a detailed discussion regarding the calculation of the subsidence risk value.
Scrolling down the worksheet, the user will see two charts. The Water Level Prediction chart illustrates the predicted water level change relative to land surface, the preconsolidation water level, and the aquifer top and bottom. The tool calculates the predicted water level using the Water Levels to Use for Predictions selection. For either possible selection the tool calculates estimates from the Beginning Year for Subsidence Evaluation. If the user selects Current and Trend, then the tool calculates the predicted water level using the Water Level Trend and Current Water Level; if the user selects Base and Future, then the tool calculates the predicted water level using the Base Water Level and Future Water Level assuming a linear trend between the Beginning Year for Subsidence Evaluation and Ending Year for Subsidence Evaluation. The starting and ending years on the chart are based on the Beginning Year for Subsidence Evaluation and Ending Year for Subsidence Evaluation values. Figure 6.9 illustrates the Water Level Prediction chart for the well completed in the Pecos Valley Aquifer with Tracking Number 417430 described above.
Final Report: Identification of the Vulnerability of the Major and Minor Aquifers of Texas to Subsidence with Regard to Groundwater Pumping – TWDB Contract Number 1648302062
Final Report: Identification of the Vulnerability of the Major and Minor Aquifers of Texas to Subsidence with Regard to Groundwater Pumping – TWDB Contract Number 1648302062
Final Report: Identification of the Vulnerability of the Major and Minor Aquifers of Texas to Subsidence with Regard to Groundwater Pumping – TWDB Contract Number 1648302062
6-13
Figure 6.6. Subsidence prediction tool Pecos Valley Aquifer average values.
Final Report: Identification of the Vulnerability of the Major and Minor Aquifers of Texas to Subsidence with Regard to Groundwater Pumping – TWDB Contract Number 1648302062
6-14
Figure 6.6. Subsidence prediction tool Pecos Valley Aquifer average values (continued).
Final Report: Identification of the Vulnerability of the Major and Minor Aquifers of Texas to Subsidence with Regard to Groundwater Pumping – TWDB Contract Number 1648302062
6-15
Figure 6.7. Subsidence prediction tool Pecos Valley Aquifer input values for Tracking Number 417430 in the Submitted Drillers Report database.
Final Report: Identification of the Vulnerability of the Major and Minor Aquifers of Texas to Subsidence with Regard to Groundwater Pumping – TWDB Contract Number 1648302062
6-16
Figure 6.8. Subsidence prediction tool Pecos Valley Aquifer input and calculated values for Tracking Number 417430 in the Submitted Drillers Report database.
Final Report: Identification of the Vulnerability of the Major and Minor Aquifers of Texas to Subsidence with Regard to Groundwater Pumping – TWDB Contract Number 1648302062
6-17
Figure 6.9. Subsidence prediction tool predicted water level chart based on the Current and Trend Water Levels to Use for Predictions for Tracking Number 417430 in the Submitted Drillers Report database.
The Drawdown and Subsidence Prediction chart illustrates the change in water level per the Water Levels to Use for Predictions selection along with the minimum and maximum subsidence predictions based on the water level change. The tool calculates the compaction of aquifer material based on the change in stress associated with changing water levels (see Equation 16 in Section 6.1). Figure 6.10 illustrates the Drawdown and Subsidence Prediction chart for the well completed in the Pecos Valley Aquifer with Tracking Number 417430 described above.
As described in Section 3.4.4, the tool uses both options for predicting water level changes when calculating the Total Weighted Risk for Well. Since the tool uses both options, the risk value is not affected by the Water Levels to Use for Predictions selection. However, the Water Level Prediction chart and Drawdown and Subsidence Prediction chart can be affected by the user’s selection. Figure 6.11 illustrates the Water Level Prediction chart and Figure 6.12 illustrates the Drawdown and Subsidence Prediction chart for the well completed in the Pecos Valley Aquifer with Tracking Number 417430 described above when the user selects Base and Future as the Water Levels to Use for Predictions.
Below the two charts, the tool also provides a table of the water level, drawdown, and subsidence estimates that the tool references to create the charts discussed above. Table 6.1 is an excerpt of the table in the subsidence prediction tool. Depending on the Water Levels to Use for Predictions selection, the tool calculates water level values using either the Current Water Level and the Water Level Trend or the Base Water Level and Future Water Level assuming a linear trend between the Beginning Year for Subsidence
Final Report: Identification of the Vulnerability of the Major and Minor Aquifers of Texas to Subsidence with Regard to Groundwater Pumping – TWDB Contract Number 1648302062
6-18
Evaluation and Ending Year for Subsidence Evaluation. However, users may overwrite the formulas in these cells to allow for predictions other than a simple linear trend. Building upon the example provided previously, suppose the user wished to show an abrupt decline in 2030, followed by continued decline of two feet per year, and subsequent recovery of one foot per year, then the user could enter these values into the table and the tool would predict potential subsidence based on the entries. Figure 6.13 illustrates the predicted drawdown and subsidence based on this hypothetical user scenario. To reset the predicted water levels to the calculated values, the user simply needs to reselect the Water Levels to Use for Predictions.
Figure 6.10. Subsidence prediction tool predicted drawdown and potential subsidence chart based on the Current and Trend Water Levels to Use for Predictions for Tracking Number 417430 in the Submitted Drillers Report database.
Final Report: Identification of the Vulnerability of the Major and Minor Aquifers of Texas to Subsidence with Regard to Groundwater Pumping – TWDB Contract Number 1648302062
6-19
Figure 6.11. Subsidence prediction tool predicted water level chart based on the Base and Future Water Levels to Use for Predictions for Tracking Number 417430 in the Submitted Drillers Report database.
Final Report: Identification of the Vulnerability of the Major and Minor Aquifers of Texas to Subsidence with Regard to Groundwater Pumping – TWDB Contract Number 1648302062
6-20
Figure 6.12. Subsidence prediction tool predicted drawdown and potential subsidence chart based on the Base and Future Water Levels to Use for Predictions for Tracking Number 417430 in the Submitted Drillers Report database.
Final Report: Identification of the Vulnerability of the Major and Minor Aquifers of Texas to Subsidence with Regard to Groundwater Pumping – TWDB Contract Number 1648302062
6-21
Table 6.1. Excerpt of the subsidence prediction tool table of predicted water level, drawdown, and potential subsidence for Tracking Number 417430 in the Submitted Drillers Report database.
Water Level and Subsidence Estimates based on Aquifer Trend
Year Water Level (ft
MSL)
Drawdown Compared to
Starting Water Level (ft)
Minimum Predicted
Subsidence (ft)
Maximum Predicted
Subsidence (ft)
2010 2,467 0.00 0.00 0.00
2011 2,467 0.27 0.00 0.02
2012 2,466 0.53 0.01 0.04
2013 2,466 0.80 0.01 0.07
2014 2,466 1.06 0.01 0.09
2015 2,466 1.33 0.02 0.11
2016 2,465 1.60 0.02 0.13
2017 2,465 1.86 0.02 0.15
2018 2,465 2.13 0.03 0.17
2019 2,465 2.39 0.03 0.20
2020 2,464 2.66 0.03 0.22
2021 2,464 2.93 0.04 0.24
2022 2,464 3.19 0.04 0.26
2023 2,464 3.46 0.04 0.28
2024 2,463 3.72 0.05 0.31
2025 2,463 3.99 0.05 0.33
2026 2,463 4.26 0.05 0.35
2027 2,462 4.52 0.06 0.37
2028 2,462 4.79 0.06 0.39
2029 2,462 5.05 0.06 0.41
2030 2,462 5.32 0.07 0.44
Final Report: Identification of the Vulnerability of the Major and Minor Aquifers of Texas to Subsidence with Regard to Groundwater Pumping – TWDB Contract Number 1648302062
6-22
Figure 6.13. Subsidence prediction tool predicted drawdown and potential subsidence chart based on the Base and Future Water Levels to Use for Predictions for Tracking Number 417430 in the Submitted Drillers Report database with manual modifications to the predicted water levels.
Final Report: Identification of the Vulnerability of the Major and Minor Aquifers of Texas to Subsidence with Regard to Groundwater Pumping – TWDB Contract Number 1648302062
6-23
6.3 Subsidence Prediction Tool Recommendations for Aquifers at Risk
The subsidence risk matrix for each major and minor aquifer is presented in Section 5. As described in that section, we are identifying those aquifers having a Total Weighted Risk (TWR) third quartile cutoff greater than 4.7 as having a high risk of subsidence due to groundwater pumping. Based on this criterion, there are a total of seven high subsidence risk aquifers (five major aquifers and two minor aquifers).
For the aquifers we identified to have a high subsidence risk, a higher level of subsidence prediction analysis than the Excel-based tool developed for this project may be warranted. A next step in the analysis may be to apply an analytical model such as the PRESS model used by the Fort Bend and Harris-Galveston Subsidence Districts. The PRESS model allows for detailed input of specific storage for various depth intervals that may improve site-specific predictions of subsidence.
Aside from analytical models such as PRESS, the next higher-complexity level of analysis would be the incorporation of a subsidence package (Hoffman and others, 2003; Leake and Galloway, 2007) into a MODFLOW model of the aquifer. The TWDB has adopted a GAM for each of the aquifers identified to have high subsidence risk. Of these models, only the Houston Area Groundwater Model (Kasmarek, 2013) currently includes a subsidence package. As these models are updated, the updated projects could include the incorporation of a subsidence package. Incorporation of the subsidence package should also include a robust uncertainty analysis that clearly communicates the range and timing of potential subsidence associated with projected water level changes.
6.3.1 Gulf Coast
The Gulf Coast Aquifer System has the highest TWR third quartile cutoff, along with the Yegua-Jackson Aquifer. The occurrence of several laterally extensive, thick, compressible clay layers combined with high pumping rates and associated water-level declines leads to high risk. The TWDB is currently creating a GAM that covers all of GMA 15 and GMA 16, and we anticipate the TWDB will incorporate subsidence into the GAM. For the northern portion of the Gulf Coast Aquifer System, the current GAM was released in 2013 and incorporates subsidence using the SUB package (Kasmarek, 2013).
To improve subsidence predictions, during GAM updates we recommend increased discretization of the aquifer units that comprise the Gulf Coast Aquifer System by incorporating recent hydrostratigraphic research (for example, Young and others (2010) and Young and others (2016)). We also recommend using the SUB-WT package (Leake and Galloway, 2007) with MODFLOW-NWT (Niswonger and others, 2011), or a future version of MODFLOW 6 (Langevin and others, 2017) that supports the SUB-WT or similar package, for the GAM updates. The improved discretization of the hydrostratigraphy and simulation of the shallow water table would help improve prediction of the subsidence associated with pumping in the Gulf Coast Aquifer System.
Final Report: Identification of the Vulnerability of the Major and Minor Aquifers of Texas to Subsidence with Regard to Groundwater Pumping – TWDB Contract Number 1648302062
6-24
6.3.2 Yegua-Jackson
The Yegua-Jackson Aquifer is adjacent to the Gulf Coast Aquifer System and has a narrow band of medium to high subsidence risk along areas where wells are pumping from deeper, down-dip areas of the aquifer. The GAM for the Yegua-Jackson Aquifer was completed in 2010 and includes simulation of the shallow portion of the aquifer (Deeds and others, 2010). The highest risk factors for the Yegua-Jackson Aquifer are the aquifer lithology, clay thickness, and preconsolidation level. High levels of pumping and associated water-level decline will likely be isolated and do not warrant updating the regional GAM to include subsidence prediction. However, during the next GAM update we recommend incorporating the SUB-WT (Leake and Galloway, 2007) or other similar package.
6.3.3 Pecos Valley
The Pecos Valley Aquifer has several occurrences of historical subsidence observations that provide insight into the types and nature of subsidence risk. The Wink Sinks represent an extreme example of solution-based subsidence risk in the Pecos Valley Aquifer. However, the lithology of the aquifer, preconsolidation levels, and anticipated water-level declines also indicate risk associated with compaction of the aquifer sediments.
The adopted GAM for the Pecos Valley Aquifer was adopted in 2004 as part of the much larger Edwards-Trinity (Plateau) GAM (Anaya and Jones, 2009) with an alternative model (Hutchison and others, 2011) adopted for planning use in 2011. We recommend updating the GAM for the aquifer as a separate model incorporating the work conducted by the BRACS program (Meyer and others, 2012) and the SUB-WT (Leake and Galloway, 2007) or other similar package. One objective of the update could be to have useful predictions of how pumping may affect subsidence which could in turn cause issues with roads or oil and gas pipelines crossing the aquifer.
6.3.4 Hueco-Mesilla Bolsons
The measured subsidence in the Hueco-Mesilla Bolsons Aquifer is the best indicator of the high subsidence risk associated with pumping. However, future water-level declines are anticipated to be relatively small which limits the subsidence risk. With no groundwater conservation district managing the Hueco-Mesilla Bolsons Aquifer, updating the GAM is not a high priority. When the Hueco-Mesilla Bolsons Aquifer GAM is updated, we recommend incorporating the SUB-WT (Leake and Galloway, 2007) or other similar package.
6.3.5 Brazos River Alluvium
The high subsidence risk for the Brazos River Alluvium Aquifer is due to the aquifer lithology and clay type. The GAM for this relatively shallow and narrow alluvial aquifer was completed in 2016 using the MODFLOW-USG code (Ewing and Jigmond, 2016). Due to the shallowness of the aquifer and anticipated minimal clay compaction within the aquifer, analytical tools are sufficient to predict potential subsidence associated with pumping.
Final Report: Identification of the Vulnerability of the Major and Minor Aquifers of Texas to Subsidence with Regard to Groundwater Pumping – TWDB Contract Number 1648302062
6-25
6.3.6 Ogallala
The subsidence risk for the Ogallala is medium across much of the aquifer and some isolated areas of high risk north of the Canadian River. The GAM for the Ogallala Aquifer was recently updated as part of the High Plains Aquifer System GAM (Deeds and Jigmond, 2015). Risk factors for the Ogallala are primarily aquifer lithology, preconsolidation level, and anticipated water-level declines. Due to the recentness of the GAM update, we recommend incorporating the SUB-WT (Leake and Galloway, 2007) into the existing model.
6.3.7 Carrizo-Wilcox
Aquifer lithology, clay thickness, and preconsolidation level are the primary risk factors for the Carrizo-Wilcox aquifer. The GAMs for the central and northern portions of the aquifer are currently being updated and present opportunity for incorporating the SUB-WT package (Leake and Galloway, 2007) as part of the update, in particular for the northern portion of the aquifer which is still in the early stages of being updated. The GAM for the southern portion of the aquifer was adopted in 2005 (Kelley and others, 2004). We recommend updating the GAM for the southern portion of the aquifer incorporating the work being conducted by the BRACS program anticipated for completion in 2018 and the SUB-WT (Leake and Galloway, 2007) or other similar package.
Final Report: Identification of the Vulnerability of the Major and Minor Aquifers of Texas to Subsidence with Regard to Groundwater Pumping – TWDB Contract Number 1648302062
7-1
7 Subsidence Monitoring and Investigation Subsidence monitoring and investigation is complicated by the fact that subsidence due to groundwater pumping occurs at a relatively slow rate and can yield only small amounts of land surface elevation change from year to year. These characteristics require accurate land surface elevation measurements over long periods of time. Investigation and monitoring techniques vary in accuracy, temporal and spatial coverage, and cost.
The aquifer subsidence risk analyses covered in Section 4 may indicate that additional subsidence investigation and/or monitoring may be warranted in areas of high risk with infrastructure that cannot tolerate ground surface elevation changes. Local stakeholders will ultimately need to decide what subsidence investigation and/or monitoring costs are reasonable. The sections below provide descriptions of subsidence investigation and monitoring methods that may prove useful to local stakeholders in areas that we are identifying as having a higher risk of subsidence.
It is important to note that most of the methods below are focused on vertical land subsidence due to water level declines in areas with compressible clay layers. These are the most likely occurrences of subsidence due to groundwater pumping in Texas aquifers. Unless applied at a broad scale (with associated high costs), the methods presented below are unlikely to help in predicting solution type subsidence. However, in places where solution related subsidence is already known to be happening, these investigation and monitoring methods may help in planning mitigation responses. Similarly, in areas where subsidence is already known to be happening and fissures are observable, horizontal land surface movement monitoring methods may be appropriate for tracking fissure growth.
We are presenting costs only in relative terms because they are very dependent on the scale of subsidence investigation and monitoring.
7.1 Subsidence Investigation Methods
Subsidence investigation may be appropriate in areas where our preliminary review of available data indicates that the risk of subsidence is high. Additional investigation may be appropriate for areas identified as medium or high risk with critical infrastructure that would be sensitive to land surface elevation changes and/or land surface fissures. The objective of investigating subsurface characteristics that lead to subsidence is to provide data that can inform a more accurate evaluation of subsidence risk or that can contribute to more accurate subsidence predictions.
Table 7.1 presents some of the subsidence risk investigation methods. Many of these methods are highly specialized and would require specialized consulting or training to implement.
Final Report: Identification of the Vulnerability of the Major and Minor Aquifers of Texas to Subsidence with Regard to Groundwater Pumping – TWDB Contract Number 1648302062
Identification of areas of historical subsidence can be coupled with other data (e.g.
water levels, pumping, lithology) to understand the local empirical relationships that lead to subsidence. Also, areas of historical subsidence
are often at higher risk of future subsidence.
RESULT: improved local understanding of the factors
that lead to subsidence
Line
Repeat measurements dependent on available data
Low to medium
7.1.1 Lithologic/Geotechnical/Geophysical Borings
Drilling exploratory boreholes is a good way to collect site specific information about compressible clay (or soluble) layers. Detailed lithologic logging can also provide accurate information on thickness and depth of compressible or soluble layers. Geotechnical core samples can be collected and submitted to a laboratory for testing. Laboratory tests may include particle size distribution, permeability, unit weight, specific gravity, porosity, moisture content, Atterberg limits, and most importantly consolidation (American Geophysical Union, 1984). The results of these tests provide site specific inputs for subsidence prediction tools and will yield much more confident predictive results. Downhole geophysical surveys can provide information on depth, thickness, and geotechnical characteristics of compressible or soluble layers.
Final Report: Identification of the Vulnerability of the Major and Minor Aquifers of Texas to Subsidence with Regard to Groundwater Pumping – TWDB Contract Number 1648302062
7-3
Using exploratory boreholes to more accurately characterize compressible or soluble layers, their thickness, and their depth will provide much more confident risk analysis and subsidence predictions. Although they provide highly accurate information in one location, exploratory boreholes are relatively expensive, particularly if a broad area of investigation is needed.
7.1.2 Geophysical Surveys
Geophysical surveys provide a cost-effective way to evaluate subsurface conditions over wide areas. Depending on the area of interest, aerial or surface methods can be deployed. The broad geophysical categories of electrical, electromagnetic, and seismic geophysical methods have various advantages and disadvantages, depending on the area of investigation and geologic conditions. Geophysical investigation can help to identify the thickness, depth, and extent of compressible layers. Geophysics can also help identify fractures and cavities that might contribute to solution type subsidence (Zohdy and others, 1974).
Although they can cover much wider areas, geophysical surveys are less accurate than exploratory boreholes. It is also usually advisable to drill exploratory boreholes to provide validation or calibration data for geophysical results.
7.1.3 Re-leveling Survey Benchmark Data
Many subsidence studies have used re-leveling of survey benchmark data to estimate subsidence by determining the change in the elevation of benchmarks in subsiding areas from successive surveys. The subsiding benchmarks from surveys taken at different times (level line or spirit leveling) must be referenced to a common, highly stable benchmark in a non-subsiding area (American Geophysical Union, 1984). Survey benchmark re-leveling typically has a vertical resolution of less than 0.04 inches (Bawden and others, 2003). In areas where re-leveling survey benchmark data indicate subsidence, empirical relationships can be established between ground surface elevation changes and contributing factors (water level declines, clay thickness/depth, etc.).
Survey benchmark data are available through the National Geodetic Survey (NGS) and could be used for historical subsidence evaluation or as benchmarks for future subsidence monitoring networks. The NGS provides historic records of these survey marks (including common highly stable benchmarks). These survey marks can be queried and downloaded from the NGS web page (https://www.ngs.noaa.gov/), where the data can be retrieved as either data sheets (text files with 80 columns of rigorously formatted metadata) or ArcGIS shapefiles. The website provides detailed instructions for retrieval including an interactive map of the most recent survey marks.
Regardless of where the data is collected, care must be taken to ensure all observations are corrected for any changes in equipment or reference frames are not interpreted as motion. The NGS converts all records to the North American Datum 1983 (NAD83) and provides the original datum used before the conversion along with the original elevation source of
Final Report: Identification of the Vulnerability of the Major and Minor Aquifers of Texas to Subsidence with Regard to Groundwater Pumping – TWDB Contract Number 1648302062
7-4
the data. The NGS also classifies the vertical tolerance of each measurement by order and class, as defined in the Federal Geodetic Control Committee’s Standards and Specifications for Geodetic Control Networks (Federal Geodetic Control Committee, 1984). Once the data is collected and checked for accuracy, time series ground surface elevation data can be collected and spatial analyses can be performed to develop an understanding of historical and future subsidence (Land and Armstrong, 1985).
7.2 Monitoring Methods
Much like subsidence investigation methods, monitoring methods may be appropriate for locations of high risk and/or where subsidence has already been observed. The susceptibility of local infrastructure to land surface elevation changes and/or land surface fissures will be an important consideration for local stakeholders considering subsidence monitoring. Table 7.2 presents some of the available subsidence monitoring methods. As with the investigation methods, many of these methods are complex and would require specialized training to implement.
There are additional monitoring methods that measure horizontal land surface changes. Compared to vertical measurements, horizontal measurement methods are more complicated, expensive, less accurate, and harder to incorporate into subsidence prediction tools. For these reasons, the methods we present below are focused only on vertical land surface elevation changes.
7.2.1 Borehole Extensometers
Borehole extensometers are essentially wells that terminate in stable bedrock and have a slip joint that allows the stable inner casing to extend to the surface while the outer casing moves downward when subsurface layers above the slip joint compress. The inner casing remains at a constant elevation while the outer casing drops with the subsiding land surface. Borehole extensometers provide a continuous, 0.01-inch accuracy, measurement of vertical subsidence (American Geophysical Union, 1984). As they require borehole drilling, they can be combined with exploratory borehole lithologic, geotechnical, and geophysical logging. They can also be completed as monitoring wells for water level measurement. The USGS extensometers installed near El Paso (Heywood, 2003) and Houston (Kasmarek and Ramage, 2017) serve as a good example of the construction, operation, and results of extensometers.
Although they collect very accurate, detailed, and comprehensive subsidence data at one location, extensometers are very expensive to construct and maintain, relative to other monitoring methods.
Final Report: Identification of the Vulnerability of the Major and Minor Aquifers of Texas to Subsidence with Regard to Groundwater Pumping – TWDB Contract Number 1648302062
elevation changes; can be combined with geotechnical borings and monitoring well
installation
RESULT: continuous and accurate measurement of subsidence at a specific
location
Point Continuous future
subsidence measurement
High
InSAR Data Collection
Accurate measurement of vertical land movements
RESULT: broad area of subsidence measurement,
limited to undisturbed land
Area
Repeat future vertical land movement
measurement
Low to medium (freely
available data may require specialized
data processing)
High Accuracy GPS Network
Measurement of vertical and horizontal ground
movement
RESULT: area or point specific subsidence
monitoring
Point
Continuous or repeat future land
movement measurement
Medium to high (dependent on
accuracy, frequency, and
number of locations)
Survey Benchmark Re-leveling
Accurate measurement of vertical ground movement
RESULT: subsidence monitoring along roadways
Line Repeat future land
movement measurement
Low to medium
Final Report: Identification of the Vulnerability of the Major and Minor Aquifers of Texas to Subsidence with Regard to Groundwater Pumping – TWDB Contract Number 1648302062
7-6
7.2.2 Interferometric Synthetic Aperture Radar
Interferometric Synthetic Aperture Radar (InSAR) is a satellite remote sensing method that can monitor small changes in land surface elevation. InSAR uses a pair of ground surface scans to generate digital surface elevation change maps by measuring the difference in the phases of waves that deflect off the ground surface and return to the source. One of the primary applications of InSAR is measuring ground deformations and is directly applicable to monitoring subsidence due to groundwater pumping (Bawden and others, 2003)
InSAR has been used in other subsidence studies in the Western United States, including extensive use in the Central Valley of California (Farr and others, 2016). InSAR typically has a vertical resolution of 0.2 to 0.4 inches (Bawden and others, 2003). Existing historical InSAR data are available for purchase throughout much of Texas. Bawden and others (2012) used such data to conduct additional subsidence investigations in the Houston area. For areas where historical subsidence investigation is desired, contacting specialized remote sensing consulting firms is recommended.
Although limited to recent time periods (post 2014), the European Space Agency also provides free InSAR data through their Sentinel 1 Mission. This project includes a pair of satellites that provide InSAR coverage with revisit periods of approximately 6 to 24 days (European Space Agency, 2013). Analysis of this data is a potentially cost-effective method to evaluate recent historical subsidence and to monitor at-risk aquifers of Texas identified in this report in the future. As the data and processing tools are freely available, the primary cost for use of this particular data set is related to the processing time. Although the tools to process the data (Sentinel 1 Toolbox as part of the SNAP computer software) are free and available online (Array Systems Computing, Inc., 2017), effectively using this data requires specialized training or consultant support.
The advantages to using the Sentinel 1 InSAR data to monitor groundwater subsidence in Texas are that: 1) the data and processing tools are free and readily available online; (2) data is collected across the entirety of the State of Texas on a frequent basis; (3) the resolution of the data is such that subsidence can be measured at high resolution (inches); and, (4) large areas of land can be evaluated for subsidence. The disadvantages include: (1) the raw InSAR data processing is complex; (2) good ground surface reflectors are needed to reduce error in measurement (that is, buildings or roads); and (3) atmospheric water vapor may cause error in ground deformation calculations. Noise factor errors, including atmospheric errors, topography-induced errors, temporal phase decorrelation and small-scale surface changes (for example, a plant blowing in the wind) must be addressed when processing the data. These challenges highlight the benefits of utilizing remote sensing professionals experienced in InSAR data processing to process the data (Farr and others, 2016).
7.2.3 High Accuracy Global Positioning System Networks
Global Positioning System (GPS) networks can be established to monitor vertical and horizontal land surface changes. Survey monuments can be established for repeat visits by
Final Report: Identification of the Vulnerability of the Major and Minor Aquifers of Texas to Subsidence with Regard to Groundwater Pumping – TWDB Contract Number 1648302062
7-7
a field survey crew or permanent high accuracy stations can be established for continuous monitoring. GPS elevation accuracy for these types of networks is typically +/- 0.1 feet or better (Sneed and Brandt, 2013).
In addition to the database of survey benchmarks, the NGS also manages a network of Continuously Operating GPS Reference Stations (CORS). These stations provide continuous GPS monitoring with very high temporal resolution. For example, the three CORS sampling locations near El Paso have a sampling rate of one sample every five seconds. These data can be accessed through the NGS website (https://www.ngs.noaa.gov/CORS/). If the stations are in an area identified as having high subsidence risk, the CORS data could be a very cost-effective way of continuously monitoring subsidence.
7.2.4 Survey Benchmark Releveling
As described above in the subsidence investigation section, survey benchmark re-leveling can provide cost effective future subsidence monitoring.
Final Report: Identification of the Vulnerability of the Major and Minor Aquifers of Texas to Subsidence with Regard to Groundwater Pumping – TWDB Contract Number 1648302062
7-8
7.3 Recommended Investigation and Monitoring Methods for Aquifers at Risk
The subsidence risk matrix for each major and minor aquifer is presented in Section 5. As described in that section, we are identifying those aquifers having a Total Weighted Risk (TWR) third quartile cutoff greater than 4.7 as having a high risk of subsidence due to groundwater pumping. Based on this criterion, there are a total of seven high subsidence risk aquifers as shown in Table 7.3.
Table 7.3. Aquifers Identified with High Risk of Subsidence
Aquifer Number of Wells Analyzed Aquifer Type Total Weighted Risk (TWR)
Gulf Coast 105,292 Major 5.9 Yegua-Jackson 3,373 Minor 5.9
Pecos Valley 1,952 Major 5.5 Hueco-Mesilla Bolson 2,360 Major 5.4 Brazos River Alluvium 985 Minor 5.3
Ogallala 63,522 Major 5.2 Carrizo-Wilcox 23,519 Major 4.7
When planning additional subsidence investigation in these high-risk aquifers, local stakeholders will need to consider the risks to specific infrastructure against the cost of subsidence investigation and monitoring. A phased investigation approach combined with subsidence prediction tools will limit costs while providing information with which to decide if additional investigation and/or monitoring costs are warranted. In most cases, the most cost-effective plans will also include refinement of the subsidence prediction tools using the newly available investigation and/or monitoring data. In areas where enough subsidence related data is available, updating the GAMs with subsidence prediction packages will be a powerful extension of additional investigation and monitoring data collection.
For any areas of high subsidence risk where critical infrastructure exists that would be sensitive to land surface changes or land fissures, additional localized investigation and monitoring may be warranted. Depending on the local concerns and costs of potential subsidence effects, stakeholders may want to consider any of the investigation and monitoring methods listed above combined with refined subsidence prediction tools.
Solution type subsidence risk is difficult to investigate and predict. Any areas where it is believed to be occurring should be investigated with a combination of InSAR and surface geophysical surveys similar to those methods used by the Bureau of Economic Geology at the Wink Sinks (Paine, 2016).
The following sections address unique considerations for those aquifers identified as having high risk. The investigation and monitoring comments above apply to all areas of high subsidence risk.
Final Report: Identification of the Vulnerability of the Major and Minor Aquifers of Texas to Subsidence with Regard to Groundwater Pumping – TWDB Contract Number 1648302062
7-9
7.3.1 Gulf Coast
The Gulf Coast Aquifer System has the highest TWR third quartile cutoff, along with the Yegua-Jackson Aquifer. The occurrence of several laterally extensive, thick, compressible clay layers combined with high pumping rates leads to high risk. We used over 100,000 wells in our risk analysis and have relatively dense data coverage. Even outside of the Houston-Galveston and Fort Bend Subsidence Districts exclusion areas, we have identified medium to high risk areas throughout most of the aquifer. The Gulf Coast Aquifer System has the most subsidence related data available and additional investigation may only be warranted in isolated areas of local concern.
Due to the widespread nature of the subsidence risk in the Gulf Coast Aquifer System, we recommend compiling and analyzing historical InSAR data using methods similar to Bawden and others (2012) to evaluate wide areas where historical subsidence may have occurred. In areas where the InSAR data is unavailable or unusable, survey benchmark re-leveling should be attempted. This approach may be challenging, however, due to difficulty in finding a stable reference benchmark. Localized areas of higher subsidence concern should consider any combination of the investigation and monitoring methods listed above.
7.3.2 Yegua-Jackson
The Yegua-Jackson Aquifer is adjacent to the Gulf Coast Aquifer System and has a narrow band of medium to high subsidence risk along areas where wells are pumping from deeper, down-dip areas of the aquifer (see Figure 4.151). Although declining recently, increased municipal pumping since 2010 may represent an increased risk in areas with more infrastructure susceptible to land surface elevation changes. In areas where local stakeholders are concerned, InSAR and survey benchmark re-leveling (historical combined with future monitoring of both methods) can provide wide areas of investigation/monitoring to identify localized areas that may warrant additional investigation.
7.3.3 Pecos Valley
The Pecos Valley Aquifer has several occurrences of historical subsidence observations that provide insight into the types and nature of subsidence risk (see Section 4.1). The Wink Sinks represent an extreme example of solution-based subsidence risk in the Pecos Valley Aquifer. As described above, a combination of InSAR data evaluation and surface geophysical surveys should be used in any areas of suspected solution type subsidence.
Our analysis also identified high subsidence risk near Monahans and in a concentrated area of wells in Kermit County (see Figure 4.38). In these locations, InSAR and survey benchmark re-leveling (historical combined with future monitoring of both methods) can provide broad areas of investigation/monitoring to identify localized areas that may warrant additional investigation.
Final Report: Identification of the Vulnerability of the Major and Minor Aquifers of Texas to Subsidence with Regard to Groundwater Pumping – TWDB Contract Number 1648302062
7-10
As much of the pumping in the Pecos Valley Aquifer is for irrigation in rural areas, it is likely that susceptible infrastructure in high risk areas may be limited to roads (Malewitz, 2017). In these areas, survey benchmark re-leveling will be a cost-effective investigation and monitoring approach.
7.3.4 Hueco-Mesilla Bolson
The El Paso subsidence observations described in Section 4.1.3 are within the Hueco-Mesilla Bolson Aquifer, which we have identified as having high subsidence risk. Almost all of the high subsidence risk is near El Paso, west of the Franklin Mountains. There have been several extensometers installed in the El Paso area (Heywood, 2003) that are used to differentiate subsidence occurring at two different depths. We recommend that these extensometers continue to be used or returned into service if they are no longer functional. Similarly, the historic USGS survey benchmark re-leveling should be updated to include any new data (Land and Armstrong, 1985). Both the extensometer and benchmark locations should be maintained for future subsidence observations. If other areas of high subsidence risk warrant additional investigation, we recommend collecting historical InSAR data that can be synthesized with the extensometer and releveling data to evaluate subsidence related characteristics in a broader area.
7.3.5 Brazos River Alluvium
The Brazos River Alluvium has areas of medium subsidence risk along nearly the entire length of this long, narrow aquifer. Because of the widespread nature of the risk, we recommend InSAR data acquisition and processing, if local stakeholders feel that additional investigation and/or monitoring is warranted.
7.3.6 Ogallala
The subsidence risk for the Ogallala has been mapped with medium risk across much of the aquifer and some isolated areas of high risk north of the Canadian River. Because of the large areas of risk, InSAR data acquisition and processing would be an appropriate investigation and monitoring approach, if it is deemed necessary by local stakeholders.
7.3.7 Carrizo-Wilcox
The Carrizo-Wilcox Aquifer has medium to high subsidence risk identified primarily in the central and northern portions of the aquifer. As with other aquifers with widespread subsidence risk, InSAR data acquisition and processing is going to provide the greatest spatial coverage, if local stakeholders desire additional subsidence investigation and monitoring.
Final Report: Identification of the Vulnerability of the Major and Minor Aquifers of Texas to Subsidence with Regard to Groundwater Pumping – TWDB Contract Number 1648302062
7-11
7.3.8 Areas of Insufficient Data
Each of the high-risk aquifers has significant areas of insufficient data as shown in the Section 4 subsidence risk vulnerability maps. These areas have little or no well data available and are less likely to be affected by significant water level declines that could cause subsidence. However, insufficient data areas near more dense well areas with high risk vulnerability may warrant additional subsidence investigation. If local stakeholders determine that additional subsidence investigation and/or monitoring is necessary, the following steps are recommended. Each step is progressively more-costly and potentially warranted if the previous step indicates a high subsidence risk or does not increase the confidence in risk assessment.
1. Re-leveling of benchmark survey data 2. Historic InSAR data processing (free data, followed by purchased data) 3. Future monitoring with InSAR and/or benchmark releveling data
For insufficient data areas where critical infrastructure is identified with high financial or human risks due to subsidence, additionally recommended investigation methods may include (in successive order): geophysical surveys, lithologic/geotechnical/geophysical borings, and/or extensometer construction.
Final Report: Identification of the Vulnerability of the Major and Minor Aquifers of Texas to Subsidence with Regard to Groundwater Pumping – TWDB Contract Number 1648302062
8-1
8 Recommendations and Limitations A common theme in subsidence studies is understanding and communicating the uncertainty related to subsidence data, methods, predictions, and risk assessments. Subsurface work has inherent uncertainty that is exacerbated in subsidence work where measurements and predictions are happening very close to the tolerance of our methods. The signal is often barely above the noise, and often within it. The recommendations and limitations of this project are geared towards understanding subsidence risk where necessary, while increasing our confidence through additional data collection and analysis.
8.1 Recommendations
The purpose of this report was to provide a preliminary evaluation of subsidence risk due to groundwater pumping in the major and minor aquifers of Texas outside of the Harris-Galveston and Fort Bend Subsidence Districts. We have identified seven aquifers that have a higher risk of subsidence due to groundwater pumping. Section 7.3 provides our recommendations for additional subsidence investigation, monitoring, and prediction in those aquifers.
There may be additional locations throughout the state where additional subsidence investigation, monitoring, and prediction is warranted. Such locations are likely to include critical infrastructure where the subsidence risk may be lower or uncertain, but would have high financial costs or human implications if subsidence were to occur. For these areas, we recommend that local stakeholders review the methods presented in Section 7 Subsidence Monitoring and Investigation. Stakeholders will need to weigh their specific risks against the cost of additional subsidence study to determine what is best for their situation.
For those areas where we have identified higher subsidence risk, and for other areas where additional subsidence studies are justified, we recommend that local stakeholders develop strategies specific to their local areas that are informed by specialized subsidence training or consultation.
We also recommend the TWDB develop a program for monitoring subsidence on a statewide level using InSAR methods. As data are gathered over several years, the program would allow the TWDB to identify areas of land subsidence and improve the assessment of risk. An example of such a program is the one developed by the Arizona Department of Water Resources in cooperation with the University of Texas at Austin and the Vexcal Corporation (ADWR, 2017). With the ability to use InSAR to evaluate land deformation at a vertical scale of approximately one-half inch, the technique is a cost-effective way monitoring potential subsidence across Texas.
Texas has excellent local groundwater management, with the TWDB’s GAM program providing vital support for that management. The groundwater availability models represent an excellent opportunity to incorporate subsidence considerations into
Final Report: Identification of the Vulnerability of the Major and Minor Aquifers of Texas to Subsidence with Regard to Groundwater Pumping – TWDB Contract Number 1648302062
8-2
groundwater management and planning. For those areas where moderate to high subsidence risk is widespread, we recommend consideration of subsidence during future model updates. Even if the available subsidence related data make subsidence predictions inappropriate, the models can be adapted to guide future subsidence data collection. If subsidence predictions are deemed appropriate, we recommend that they be presented with an uncertainty analysis that communicates where/what prediction uncertainty stems from and how it can be reduced by identifying what, where, and when data should be collected.
The Excel-based tool developed as part of this project uses aquifer wide subsidence risk characteristics determined from analysis of aquifer characteristics at well locations. A next step for evaluation would be the development of a web-based user-friendly tool that allows stakeholders to more easily investigate subsidence potential at specific locations. We recommend creation of a tool that incorporates the geographical changes in lithologic and water level properties to provide more localized predictions of subsidence potential. We also envision the development of a web-based geospatial interface allowing GCDs and other interested parties the ability to assess subsidence risk for their specific geographical areas of interest. Such a web-based interface could be similar to interfaces developed by TWDB to showcase various datasets already collected and analyzed by agency staff.
8.2 Limitations
This project is a statewide analysis of subsidence related data (subsidence districts excluded) and as such, presents regional results. Although we used well specific data for risk analysis, these results were aggregated at the aquifer level and generally represent subsidence risk at the aquifer scale. The results of this study may provide a qualitative indication of local risk (county scale or smaller), but greater data uncertainty at the local level increases the uncertainty of the results. For example, clay thickness data from partially penetrating wells may skew results at a local scale, but are more easily accounted for in an aquifer-wide statistical summary. Also, there are many areas of our analyses where there was insufficient information to analyze subsidence risk. Conditions in these areas could change our understanding of subsidence risk, even at the aquifer scale.
This study concentrated on subsidence due to groundwater pumping and largely focused on compressible layer subsidence. Our characterization of solution type subsidence was limited by the local and unpredictable nature of its causes. Subsidence can also be caused by many other things, including oil extraction, mining, increased ground surface loads, and water management practices. We did not investigate any other causes of subsidence and they did not factor into our risk assessments.
As stated frequently throughout this document, subsidence has inherent data uncertainty that results in limitations as to how risk analyses and predictions can be used. Subsidence related data are sometimes sparse (for example, geotechnical laboratory compressibility tests), of low quality (for example, accuracy of lithology descriptions in drillers logs), or may only represent a portion of the aquifer thickness (that is, partially penetrating wells).
Final Report: Identification of the Vulnerability of the Major and Minor Aquifers of Texas to Subsidence with Regard to Groundwater Pumping – TWDB Contract Number 1648302062
8-3
These data deficiencies can sometimes be remedied with local investigations, which would greatly increase confidence in subsidence risk assessments and predictions.
The stakeholder outreach portion of this project helped us obtain the best available information on which to base our risk analyses. However, some of our information was obtained from planning documents (for example, modeled available groundwater reports or adopted desired future conditions) that are based on recent groundwater management decisions. Changes in groundwater management and usage will affect risk of subsidence.
The focus of our study has been on investigating, monitoring, and predicting vertical land surface elevation changes and subsidence risk. Subsidence causes three-dimensional subsurface deformation and the horizontal components of land movement can represent significant risks, including the development of land surface fissures. Horizontal land movements due to subsidence are important considerations at the local scale, but outside of the scope of this study.
Final Report: Identification of the Vulnerability of the Major and Minor Aquifers of Texas to Subsidence with Regard to Groundwater Pumping – TWDB Contract Number 1648302062
9-1
9 Acknowledgements In addition to all of the GCD staff members who assisted us in our data collection efforts, the LRE Water Team expresses our sincere appreciation to the following individuals that provided invaluable assistance to our stakeholder outreach efforts on this project:
Texas Alliance of Groundwater Districts (TAGD)
Sarah Roundtree Schlessinger, Executive Director Elizabeth Hood, Program Manager
Texas Water Conservation Association (TWCA)
Stacey Allison Steinbach, Assistant General Manager Adeline Fox, Director of Communications
We are also grateful for the assistance of numerous staff members of the Texas Water Development Board for their insight and guidance through this project. Staff provided input during multiple meetings, and were always quick to respond to inquiries. Specific thanks are offered to:
Final Report: Identification of the Vulnerability of the Major and Minor Aquifers of Texas to Subsidence with Regard to Groundwater Pumping – TWDB Contract Number 1648302062
10-1
10 References
American Geophysical Union, 1984, Guidebook to studies of land subsidence due to ground-water withdrawal: Chelsea, Michigan, UNESCO, 305 p.
Anaya, R. and Jones, I., 2009, Groundwater Availability Model for the Edwards-Trinity (Plateau) and Pecos Valley Aquifers of Texas: Texas Water Develoment Board Report 373, 103 p.
Angle, E.S., 2001, Hydrogeology of the Salt Basin, in Mace, R.E., Mullican III, W.F., and Angle, E.S., eds.: Aquifers of West Texas, Texas Water Development Board Report 356, 241-256 p.
Arizona Department of Water Resources, 2017, Interferometric Synthetic Aperture Radar (InSAR), http://www.azwater.gov/AzDWR/Hydrology/Geophysics/documents/ADWRInSARProgramFactSheet.pdf, accessed Novemeber 2017.
Array Systems Computing, Inc., 2017, Sentinel-1 Toolbox Version 5.0.2, http://step.esa.int/main/, accessed November 2017.
Ashworth, J.B., 1983, Ground-water availability of the Lower Cretaceous Formations in the Hill Country of south central Texas: Texas Department of Water Resources Report 273, 173 p.
Ashworth, J.B., 1988, Ground-Water Resources of the Nacatoch Aquifer: Texas Water Development Board Report 305, 149 p.
Ashworth, J.B., 1990, Evaluation of Ground-Water Resources in El Paso County, Texas: Texas Water Development Board Report 324, 25 p.
Ashworth, J.B., 2001, Bone Spring-Victorio Peak Aquifer of the Dell Valley Region of Texas, in Mace, R.E., Mullican III, W.F., and Angle, E.S., eds.: Aquifers of West Texas, Texas Water Development Board Report 356, 135-152 p.
Ashworth, J.B. and Hopkins, J., 1995, Aquifers of Texas: Texas Water Development Board Report 345, 69 p.
Baker, Jr., E.T., 1979, Stratigraphic and hydrogeologic framework of part of the Coastal Plain of Texas: Texas Department of Water Resources Report 236, 43 p.
Final Report: Identification of the Vulnerability of the Major and Minor Aquifers of Texas to Subsidence with Regard to Groundwater Pumping – TWDB Contract Number 1648302062
10-2
Baker, Jr., E.T., Slade, Jr., R.M., Dorsey, M.E., Ruiz, L.M., and Duffin, G.L., 1986, Geohydrology of the Edwards Aquifer in the Austin Area, Texas: Texas Water Develoment Board Report 293, 215 p.
Barker, R.A. and Ardis, A.F., 1996, Hydrogeologic Framework of the Edwards-Trinity Aquifer System, West-Central Texas: U.S. Geological Survey Professional Paper 1421-B, 61 p.
Barnes, V.E., 1968, Beaumont Sheet Scale 1:250,000: University of Texas at Austin Bureau of Economic Geology Geologic Atlas of Texas, 1 p.
Barnes, V.E., 1974, Big Spring Sheet Scale 1:250,000: University of Texas at Austin Bureau of Economic Geology Geologic Atlas of Texas, 1 p.
Barnes, V.E. and Bell, W.C., 1977, The Moore Hollow Group of Central Texas: The University of Texas at Austin, Bureau of Economic Geology, Report of Investigations No. 88, 169 p.
Batu, V., 1998, Aquifer Hydraulics: A Comprehensive Guide to Hydrogeologic Data Analysis: New York, John Wiley & Sons, Inc.,
Bawden, G.W., Johnson, M.R., Kasmarek, M.C., Brandt, J., and Middleton, C.S., 2012, Investigation of Land Subsidence in the Houston-Galveston Region of Texas By Using the Global Positioning System and Interferometric Synthetic Aperture Radar, 1993–2000: U.S. Geological Survey Scientific Investigations Report 2012–5211, 88 p.
Bawden, G.W., Sneed, M., and Stork, S.V..G.D.L., 2003, Measuring Human-Induced Land Subsidence from Space: U.S. Geological Survey Fact Sheet 069-03, 4 p.
Beach, J.A., Ashworth, J.A., Finch Jr., S.T., Chastain-Howley, A., Calhoun, K., Urbanczyk, K.M., Sharp, J.M., and Olson, J., 2004a, Groundwater Availability Model for the Igneous and parts of the West Texas Bolsons (Wild Horse Flat, Michigan Flat, Ryan Flat and Lobo Flat) Aquifers: Contract Report for the Texas Water Development Board, 420 p.
Beach, J.A., Burton, S., and Kolarik, B., 2004b, Groundwater availability model for the Lipan Aquifer in Texas: Contract report to the Texas Water Development Board, 246 p.
Beach, J.A., Huang, Y., Symank, L., Ashworth, J.B., Davidson, T., Vreugdenhil, A.M., and Deeds, N.E., 2009, Nacatoch Aquifer Groundwater Availability Model: Contract report to the Texas Water Development Board, 304 p.
Final Report: Identification of the Vulnerability of the Major and Minor Aquifers of Texas to Subsidence with Regard to Groundwater Pumping – TWDB Contract Number 1648302062
10-3
Beach, J., Keester, M., and Konetchy, B., 2016, Results of Predictive Simulation in Support of GMA 8 Joint Planning – NTGCD GMA 8 Run 10: LBG-Guyton Associates Technical Memorandum, 5 p.
Beach, J.A., Symank, L., Huang, Y., Ashworth, J.B., Davidson, T., Collins, E.W., Hibbs, B.J., Darling, B.K., Urbancyk, K., Calhoun, K., and Finch, S., 2008, Final Report Groundwater Availability Model For the West Texas Bolsons (Red Light Draw, Green River Valley and Eagle Flat) Aquifer in Texas: Contract Report for the Texas Water Development Board, 320 p.
Bear, J., 1979, Hydraulics of Groundwater: Mineola, New York, Dover Publications, Inc., 569 p.
Bezanson, J., Edelman, A., Karpinski, S., and Shah, V.B., 2017, Julia: A Fresh Approach to Numerical Computing: SIAM Review, v. 59, no. 1, p. 65-98.
Bluntzer, R.L., 1992, Evaluation of the Ground-Water Resources of the Paleozoic and Cretaceous aquifers in the Hill Country of Central Texas: Texas Water Development Board Report 339, 183 p.
Boghici, R., Jones, I.C., Bradley, R.G., Shi, J., Goswami, R.R., Thorkildsen, D., and Backhouse, S., 2014, Total Estimated Recoverable Storage for Aquifers in Groundwater Management Area 4: GAM Task 13-028, 33 p.
Boghici, R. and Van Broekhoven, N.G., 2011, Hydrogeology of the Rustler Aquifer, Trans-Pecos Texas, in Mace, R.E., Mullican III, W.F., and Angle, E.S., eds.: Aquifers of West Texas, Texas Water Development Board Report 356, 207-225 p.
Bradley, R.G., 2011, Groundwater Management Area 7, Capitan Reef Complex Aquifer, Modeled Available Groundwater estimates: Texas Water Development Board GTA Aquifer Assessment 10-09 MAG, 8 p.
Bradley, R.G. and Kalaswad, S., 2001, The Dockum Aquifer in West Texas, in Mace, R.E., Mullican III, W.F., and Angle, E.S., eds.: Aquifers of West Texas, Texas Water Development Board Report 356, 167-174 p.
Brown, R.F. and Keys, W.S., 1985, Effects of artificial recharge on the Ogallala aquifer, Texas: U.S. Geological Survey water-supply paper 2251, 56 p.
Brune, G. and Duffin, G.L., 1983, Occurrence, availability, and quality of ground water in Travis County, Texas: Texas Department of Water Resources Report 276, 219 p.
Final Report: Identification of the Vulnerability of the Major and Minor Aquifers of Texas to Subsidence with Regard to Groundwater Pumping – TWDB Contract Number 1648302062
10-4
Carr, J.E., Meyer, W.R., Sandeen, W.M., and McLane, I.R., 1983, Digital models for simulation of groundwater hydrology of the Chicot and Evangeline aquifers along the Gulf Coast of Texas: Texas Department of Water Resources Report 289, 101 p.
CH2MHILL, 2002, Final Report Groundwater Modeling of the Cañutillo Wellfield: Prepared for El Paso Water Utilities Public Service Board, 208 p.
Chastain-Howley, A., 2001, Igneous Aquifers of Far West Texas, in Mace, R.E., Mullican III, W.F., and Angle, E.S., eds.: Aquifers of West Texas, Texas Water Development Board Report 356, 175-189 p.
Chowdhury, A.H. and Mace, R.E., 2003, A groundwater availability model for the Gulf Coast aquifer in the Lower Rio Grande Valley, Texas—Numerical simulations through 2050: Texas Water Development Board unpublished report, 171 p.
Chowdhury, A.H., Wade, S., Mace, R.E., and Ridgeway, C., 2004, Groundwater Availability Model of the Central Gulf Coast Aquifer System: Numerical Simulations through 1999: Texas Water Development Board Model Report, 108 p.
Cronin, J.G. and Wilson, C.A., 1967, Ground water in the flood-plain alluvium of the Brazos River, Whitney Dam to vicinity of Richmond, Texas: Texas Water Development Board Report 41, 78 p.
Dane, C.H., 1929, Upper Cretaceous formations of southwestern Arkansas: Arkansas Geological Survey Bulletin 1, 215 p.
DeCook, K.J., 1961, A reconnaissance of the ground-water resources of the Marathon area, Brewster County, Texas: Texas Board of Water Engineers Bulletin 6111, 51 p.
DeCook, K.J., 1963, Geology and ground-water resources of Hays County, Texas: U.S. Geological Survey Water-Supply Paper 1612, 72 p.
Deeds, N.E., Harding, J.J., Jones, T.L., Singh, A., Hamlin, S., Reedy, R.R., Yan, T., Jigmond, M., Lupton, D., Scanlon, B.R., Seni, S., and Dutton, A., 2015, Final Conceptual Model for the High Plains Aquifer System Groundwater Availability Model: 590 p.
Deeds, N.E. and Jigmond, M., 2015, Numerical Model Report for the High Plains Aquifer System Groundwater Availability Model: 640 p.
Deeds, N.E., Yan, T., Singh, A., Jones, T.L., Kelley, V.A., Knox, P.R., and Young, S.C., 2010, Groundwater availability model for the Yegua-Jackson Aquifer: Contract report for the Texas Water Development Board, 582 p.
Final Report: Identification of the Vulnerability of the Major and Minor Aquifers of Texas to Subsidence with Regard to Groundwater Pumping – TWDB Contract Number 1648302062
10-5
Domenico, P.A. and Mifflin, M.D., 1965, Water from low-permeability sediments and land subsidence: Water Resources Research, v. 1, no. 4, p. 563-576.
Duffin, G.L. and Beynon, B.E., 1992, Evaluation of Water Resources in Parts of the Rolling Prairies Region of North-Central Texas: Texas Water Development Board Report 337, 93 p.
Dutton, A.R., Harden, B., Nicot, J.P., and O'Rourke, D., 2002, Groundwater Availability Model for the Central Part of the Carrizo-Wilcox Aquifer in Texas: Contract Report for the Texas Water Development Board, 295 p.
Epps, L.W., 1973, A Geologic History of the Brazos River: Baylor Geological Studies Bulletin No. 24, 44 p.
European Space Agency, 2013, Sentinel-1 Mission Guide. Issue Draft. Revision 0: ESA Standard Document, 80 p.
Ewing, J.E., Harding, J.J., and Jones, T.L., 2016, Final Conceptual Model Report for the Brazos River Alluvium Aquifer Groundwater Availability Model: Contract Report for the Texas Water Development Board, 514 p.
Ewing, J.E. and Jigmond, M., 2016, Final Numerical Model Report for the Brazos River Alluvium Aquifer Groundwater Availability Model: Cointract Report for the Texas Water Development Board, 357 p.
Ewing, J.E., Jones, T.L., Pickens, J.F., Chastain-Howley, A., Dean, K.E., and Spear, A.A., 2004, Groundwater Availability Model for the Seymour Aquifer: Contract Report for the Texas Water Development Board, 533 p.
Ewing, J.E., Kelley, V.A., Jones, T.L., Yan, T., Singh, A., Powers, D.W., Holt, R.M., and Sharp, J.M., 2012, Final Groundwater Availability Model Report for the Rustler Aquifer: 460 p.
Far West Texas Regional Water Planning Group, 2010, Far West Texas Regional Water Plan: variously p.
Farr, T.G., Jones, C.E., and Liu, Z., 2016, Progress Report: Subsidence in California, March 2015- September 2016: California Institute of Technology Jet Propulsion Laboratory, 37 p.
Federal Geodetic Control Committee, 1984, Standards and Specifications for Geodetic Control Networks: Rockville, Maryland, Federal Geodetic Control Committee, 34 p.
Final Report: Identification of the Vulnerability of the Major and Minor Aquifers of Texas to Subsidence with Regard to Groundwater Pumping – TWDB Contract Number 1648302062
10-6
Finch, S.T., Standen, A.R., and Blandford, T.N., 2016, Brackish groundwater in the Blaine Aquifer System, north-central Texas: Contract Report to the Texas Water Development Board, 107 p.
Flores, R., 1990, Test well drilling investigation to delineate the downdip limits of usable-quality ground water in the Edwards aquifer, Texas: Texas Water Development Board Report 325, 70 p.
Fogg, G.E. and Kreitler, C.W., 1982, Ground-water hydraulics and hydrochemical facies in Eocene aquifers of the East Texas Basin: The University of Texas at Austin, Bureau of Economic Geology Report of Investigations No. 127, 75 p.
Fogg, G.E., Seni, S.J., and Kreitler, C.W.., 1983, Three-dimensional ground-water modeling in depositional systems, Wilcox Group, Oakwood salt dome area, East Texas: The University of Texas at Austin, Bureau of Economic Geology Report of Investigations No. 133, 55 p.
Follett, C.R., 1974, Ground-water resources of Brazos and Burleson counties, Texas: Texas Water Development Board Report 185, 193 p.
Freeze, R.A., 1969, The mechanism of natural ground-water recharge and discharge: 1. One-dimensional, vertical, unsteady, unsaturated flow above a recharging or discharging ground-water flow system: Water Resources Research, v. 5, no. 1, p. 153-171.
Freeze, R.A. and Cherry, J.A., 1979, Groundwater: Upper Saddle River, New Jersey, Prentice Hall, Inc., 604 p.
Gabrysch, R.K., 1979, Approximate altitude of water levels in wells in the Chicot and Evangeline aquifers in the Houston area, Texas, spring 1977 and spring 1978: U.S. Geological Survey Open File Report 79-334, 4 p.
Galloway, W.E., Finley, R.J., and Henry, C.D., 1979, South Texas uranium province – Geologic perspective: The University of Texas at Austin, Bureau of Economic Geology,Guidebook 18, 87 p.
Galloway, D., Jones, D.R., and Ingebritsen, S.E., 1999, Land Subsidence in the United States: U.S. Geological Survey Circular 1182, 177 p.
Garner, L.E. and Young, K.P., 1976, Environmental Geology of the Austin Area: An Aid to Urban Planning: University of Texas at Austin, Bureau of Economic Geology, Report of Investigations RI-86, 1 p.
Final Report: Identification of the Vulnerability of the Major and Minor Aquifers of Texas to Subsidence with Regard to Groundwater Pumping – TWDB Contract Number 1648302062
10-7
George, P., Mace, R.E., and Mullican III, W.F., 2005, The Hydrogeology of Hudspeth County, Texas: Texas Water Development Board Report 364, 95 p.
George, P.G., Mace, R.E., and Petrossian, R., 2011, Aquifers of Texas: Report 380, 172 p.
Gill, A.E., 1982, Appendix Three - Properties of Seawater, in Donn, W.L., ed.: Atmosphere-Ocean Dynamics, (1st) v. 30, San Diego, Academic Press, 662 p.
Goswami, R.R., 2017a, Modeled Available Groundwater for the aquifers in Groundwater Management Area 1: GAM Run 16-029 MAG, 17 p.
Goswami, R.R., 2017b, Modeled Available Groundwater for the Gulf Coast Aquifer System in Groundwater Management Area 15: Texas Water Development Board GAM Run 16-025 MAG, 16 p.
Goswami, R.R., 2017c, Modeled Available Groundwater for the Gulf Coast Aquifer System in Groundwater Management Area 16: Texas Water Development Board GAM Run 17-025 MAG, 17 p.
Gould, C.N., 1906, The geology and water resources of the eastern portion of the Panhandle of Texas: U.S. Geological Survey Water-Supply Paper 154, 64 p.
Granata, W.H., 1963, Cretaceous stratigraphy and structural development of the Sabine Uplift area, Texas and Louisiana, Report on selected north Louisiana and south Arkansas oil and gas fields and regional geology: Shreveport Geological Society, 201 p.
Groschen, G.E., 1996, Hydrogeologic factors that affect the flowpath of water in selected zones of the Edwards aquifer, San Antonio region, Texas: U.S. Geological Survey Water Resources Investigations Report 96–4046, 73 p.
Hamilton, D.S., 1994, Increased oil recovery potential from barrier/strand plain reservoirs, Jackson-Yegua trend, by geologically targeted infill drilling: examples form Seventy-Six West and Colmena Hill fields, South Texas: The University of Texas at Austin, Bureau of Economic Geology Report of Investigations no. 217, 52 p.
Hamlin, H.S., 2006, Salt domes in the Gulf Coast aquifer, in Mace, R.E., Davidson, S.C., Angle, E.S., and Mullican, W.F., eds.: Aquifers of the Gulf Coast of Texas, Austin, Texas Water Development Board Report 365, 217-230 p.
Harlan, S.K., 1990, Hydrogeologic assessment of the Brazos River Alluvium Aquifer, Waco to Marlin, Texas: Baylor University, Master’s thesis,
Final Report: Identification of the Vulnerability of the Major and Minor Aquifers of Texas to Subsidence with Regard to Groundwater Pumping – TWDB Contract Number 1648302062
10-8
Hassan, M.M., 2011, GAM Run 10-042 MAG Report: Texas Water Development Board GAM Run 10-042 MAG Report, 12 p.
Hawley, J.W., Kennedy, J.F., and Creel, B.J., 2001, The Mesilla Basin Aquifer System of New Mexico, West Texas and Chihuahua, in Mace, R.E., Mullican III, W.F., and Angle, E.S., eds.: Aquifers of West Texas, Texas Water Development Board Report 356, 76-99 p.
Heywood, C., 1995a, Investigation of aquifer-system compaction in the Hueco basin, El Paso, Texas, USA: Proceedings of the Fifth International Symposium on Land Subsidence, The Hague, October 1995, no. 234, p. 35-45.
Heywood, C.E., 1995b, Monitoring aquifer compaction and land subsidence due to ground-water withdrawal in the El Paso, Texas-Juarez, Chihuahua, area, in Prince, K.R., Galloway, D.L., and Leake, S.A., eds.: U.S. Geological Survey Subsidence Interest Group Conference, Edwards Air Force Base, Antelope Valley, California, November 18-19, 1992: Abstracts and Summary, U.S. Geological Survey Open-File Report 94-532, 14-17 p.
Heywood, C.E., 2003, Summary of Extensometric Measurements in El Paso, Texas: U.S. Geological Survey Water-Resources Investigations Report 03-4158, 11 p.
Heywood, C.E. and Yager, R.M., 2003, Simulated Ground-Water Flow in the Hueco Bolson, an Alluvial-Basin Aquifer System near El Paso, Texas: U.S. Geological Survey Water-Resources Investigation Report 2002-4108, 73 p.
Hoffman, J., Leake, S.A., Galloway, D.L., and Wilson, A.M., 2003, MODFLOW-2000 Ground-Water Model—User Guide to the Subsidence and Aquifer-System Compaction (SUB) Package: U.S. Geological Survey, Open-File Report 03—233, 46 p.
Hovorka, S.D., Mace, R.E., and Collins, E.W., 1998, Permeability structure of the Edwards aquifer, south Texas—Implications for aquifer management: University of Texas, Bureau of Economic Geology Report of Investigations 250, 55 p.
Hunt, B.B., Smith, B.A., Adams, M.T., Hiers, S.E., and Brown, N., 2013, Cover-Collapse Sinkhole Development in the Cretaceous Edwards Limestone, Central Texas: Proceedings of the Thirteenth Multidisciplinary Conference on Sinkholes and the Engineering and Environmental Impacts of Karst, no. Symposium 2, p. 89-102.
Hutchison, W.R., 2008, Preliminary Groundwater Flow Model, Dell City Area, Hudspeth and Culberson Counties, Texas: EPWU Hydrogeology Report 08-01, 435 p.
Hutchison, W.R., 2010, Draft GAM Run 09-035: GAM Run, 10 p.
Final Report: Identification of the Vulnerability of the Major and Minor Aquifers of Texas to Subsidence with Regard to Groundwater Pumping – TWDB Contract Number 1648302062
10-9
Hutchison, W.R., Jones, I.C., and Anaya, R., 2011, Update of the Groundwater Availability Model for the Edwards-Trinity (Plateau) and Pecos Valley Aquifers of Texas: 60 p.
Jackson, M.L.W. and Garner, L.E., 1982, Environmental geology of the Yegua-Jackson lignite belt, southeast Texas: The University of Texas at Austin, Bureau of Economic Geology Report of Investigations no. 129, 40 p.
Jigmond, M., Hutchison, W.R., and Shi, J., 2014, Final Report: Groundwater Availability Model of the Seymour Aquifer in Haskell, Knox, and Baylor Counties: Texas Water Development Board GAM Report, 185 p.
Johnson, K.S., 1978, Stratigraphy and mineral resources of Guadalupian and Ochoan rocks in the Texas Panhandle and western Oklahoma: New Mexico Bureau of Mines and Mineral Resources Circular, no. 159, p. 52-62.
Johnson, B., 2004, The Llano Uplift and associated Pennsylvanian-age faults: An overview and a field example of faults exposed at Hoover Point in the Backbone Ridge Graben, in Hoh, A. and Hunt, B., eds.: Tectonic history of southern Laurentia: A look at Mesoproterozoic, late-Paleozoic, and Cenozoic structures in central Texas, Austin Geological Society Field Trip Guidebook 24, 62-91 p.
Johnston, R.H., 1999, Hydrologic budgets of regional aquifer systems of the United States for predevelopment and development conditions: U.S. Geological Survey Professional Paper 1425, 34 p.
Jones, I.C., 2003, Groundwater Availability Modeling: Northern Segment of the Edwards Aquifer, Texas: Texas Water Development Board 358, 75 p.
Jones, I.C., 2016a, Conceptual Model: Capitan Reef Complex Aquifer of Texas: Texas Water Development Board GAM Report, 174 p.
Jones, I.C., 2016b, Groundwater Availability Model: Eastern Arm of the Capitan Reef Complex Aquifer of Texas: Texas Water Development Board GAM Report, 494 p.
Jones, I.C., 2017, GAM Run 16-023 MAG: Modeled Available Groundwater for the Aquifers in Groundwater Management Area 9: Texas Water Development Board GAM Run 16-023 MAG, 26 p.
Jones, I.C., Anaya, R., and Wade, S., 2011, Groundwater Availability Model for the Hill Country Portion of the Trinity Aquifer, Texas: Texas Water Development Board Report 377, 165 p.
Final Report: Identification of the Vulnerability of the Major and Minor Aquifers of Texas to Subsidence with Regard to Groundwater Pumping – TWDB Contract Number 1648302062
10-10
Jones, T.L., Ewing, J.E., Yan, T., Pickens, J.F., Scanlon, B.R., Olyphant, J., and Chastain-Howley, A., 2012, Final Report Conceptual model for the refined Seymour aquifer groundwater availability model: Haskell, Knox, and Baylor counties: Contract Report to the Texas Water Development Board, 274 p.
Jorgensen, D.G., 1980, Relationships between Basic Soils-Engineering Equations and Basic Ground-Water Flow Equations: U.S. Geological Survey, Water-Supply Paper 2064, 40 p.
Ju, D.H., 2014, Aquifer Framework Restoration (AFR) in an Alluvial Aquifer, Central Texas: Baylor University, Master’s thesis,
Kasmarek, M.C., 2013, Hydrogeology and Simulation of Groundwater Flow and Land-Surface Subsidence in the Northern Part of the Gulf Coast Aquifer System, Texas, 1891-2009: U.S. Geological Survey Scientific Investigations Report 2012-5154, Version 1.1, 55 p.
Kasmarek, M.C. and Ramage, J.K., 2017, Water-level altitudes 2017 and water-level changes in the Chicot, Evangeline, and Jasper Aquifers and compaction 1973–2016 in the Chicot and Evangeline Aquifers, Houston-Galveston region, Texas: U.S. Geological Survey Scientific Investigations Report 2017-5080, 32 p.
Kasmarek, M.C. and Robinson, J.L., 2004, Hydrogeology and Simulation of Ground-Water Flow and Land-Surface Subsidence in the Northern Part of the Gulf Coast Aquifer System, Texas: U.S. Geological Survey Scientific Investigations Report 2004-5102, 111 p.
Kell, G.S., 1975, Density, Thermal Expansivity, and Compressibility of Liquid Water from 0° to 150°C: Correlations and Tables for Atmospheric Pressure and Saturation Reviewed and Expressed on 1968 Temperature Scale: Journal of Chemical and Engineering Data, v. 20, no. 1, p. 97-105.
Kelley, V.A., Deeds, N.E., Fryar, D.G., and Nicot, J.P., 2004, Final Report: Groundwater Availability Models for the Queen City and Sparta Aquifers: Contract report for the Texas Water Development Board, 867 p.
Kelley, V.A., Ewing, J., Jones, T.L., Young, S.C., Deeds, N., and Hamlin, S., eds., 2014, Updated Groundwater Availability Model of the Northern Trinity and Woodbine Aquifers: Vol 1, Austin, Texas, Intera, 990 p.
Knox, P.R., Kelly, V.A., Vreugdenhil, A., Deeds, N., and Seni, S., 2007, Structure of the Yegua-Jackson Aquifer of the Texas Gulf Coastal Plain: Contract Report for the Texas Water Development Board, 174 p.
Final Report: Identification of the Vulnerability of the Major and Minor Aquifers of Texas to Subsidence with Regard to Groundwater Pumping – TWDB Contract Number 1648302062
10-11
Land, L.F. and Armstrong, C.A., 1985, A Preliminary Assessment of Land-Surface Subsidence in the El Paso Area, Texas.: U.S. Geological Survey Water-Resources Investigations Report 85-4155, 96 p.
Langevin, C.D., Hughes, J.D., Banta, E.R., Niswonger, R.G., Panday, S., and Provost, A.M., 2017, Documentation for the MODFLOW 6 Groundwater Flow Model: U.S. Geological Survey Techniques and Methods, book 6, chap. A55, 197 p.
LBG-Guyton Associates, 2003, Brackish Groundwater Manual for Texas Regional Water Planning Groups: Contract Report to the Texas Water Development Board, 224 p.
Leake, S.A. and Galloway, D.L., 2007, MODFLOW Ground-Water Model—User Guide to the Subsidence and Aquifer-System Compaction Package (SUB-WT) for Water-Table Aquifers: U.S. Geological Survey, Techniques and Methods 6–A23, 42 p.
Leake, S.A. and Prudic, D.E., 1991, Documentation of a Computer Program to Simulate Aquifer-System Compaction Using the Modular Finite-Difference Ground-Water Flow Model: U.S. Geological Survey, Techniques of Water-Resources Investigations 06-A2, 68 p.
Ledger, E.B., 1988, The Catahoula Formation: A volcanoclastic unit in East Texas: Geological Society of America Centennial Field Guide—South-Central Section, 383-385 p.
Lee, J.N., 1986, Shallow ground-water conditions, Tom Green County, Texas: U.S. Geological Survey Water-Resources Investigations Report 86-4177, 88 p.
Lindgren, R.J., Dutton, A.R., Hovorka, S.D., Worthington, S.R.H., and Painter, S., 2004, Conceptualization and Simulation of the Edwards Aquifer, San Antonio Region, Texas: U.S. Geological Survey Scientific Investigations Report 2004–5277, 143 p.
Mace, R.E., 2001, Estimating Transmissivity Using Specific-Capacity Data: University of Texas at Austin, Bureau of Economic Geology, Geological Circular 01-2, 44 p.
Mace, R.E., Dutton, A.R., and Nance, H.S., 1994, Water-Level Declines in the Woodbine, Paluxy, and Trinity Aquifers of North-Central Texas: Transactions Of The Gulf Coast Association Of Geological Societies, v. 44, p. 413-420.
Maclay, R.W., 1995, Geology and hydrology of the Edwards aquifer in the San Antonio area, Texas: U.S. Geological Survey Water-Resources Investigations Report 95–4186, 64 p.
Final Report: Identification of the Vulnerability of the Major and Minor Aquifers of Texas to Subsidence with Regard to Groundwater Pumping – TWDB Contract Number 1648302062
10-12
Maclay, R.W. and Land, L.F., 1988, Simulation of flow in the Edwards aquifer, San Antonio region, Texas, and refinements of storage and flow concepts: U.S. Geological Survey Report Water-Supply Paper 2336–A, 48 p.
Maclay, R.W. and Small, T.A., 1986, Carbonate Geology and Hydrology of the Edwards Aquifer in the San Antonio Area: Texas Water Development Board Report 296, 90 p.
Maderak, M.L., 1972, Ground-water resources of Hardeman County, Texas: Texas Water Development Board Report 161, 45 p.
Malewitz, J., 2017, In West Texas, abandoned well sinks land, sucks tax dollars., https://www.texastribune.org/2017/01/22/west-texas-abandoned-well-sinks-land-sucks-tax-dol/, accessed November 2017.
McLaurin, C., 1988, Occurrence, Availability, and Chemical Quality of Ground Water in the Blossom Sand Aquifer: Texas Water Development Board Report 307, 32 p.
Meyer, J.E., Wise, M.R., and Kalaswad, S., 2012, Pecos Valley Aquifer, West Texas: Structure and Brackish Groundwater: Texas Water Development Board Report 382, 86 p.
Morris, D.A. and Johnson, A.I., 1967, Summary of Hydrogeologic and Physical Properties of Rock and Soil Materials, as Analyzed by the Hydrologic Laboratory of the U.S. Geological Survey 1948-60: U.S. Geological Survey, Water-Supply Paper 1839-D, 42 p.
Muller, D.A. and Price, R.D., 1979, Ground-Water Availability in Texas - Estimates and Projections Through 2030: Texas Water Development Board Report 238, 77 p.
Munster, C., Mathewson, C., and Wrobelski, C., 1996, The Texas A&M University Brazos River Hydrogeologic Field Site: Environmental and Engineering Geoscience, v. II, no. 4, p. 517-530.
Murray, G.E., 1961, Geology of the Atlantic and Gulf Coastal Province of North America: New York, Harpers, 692 p.
Myers, B.N., 1969, Compilation of Results of aquifer tests in Texas: Texas Water Development Board Report 98, 533 p.
Niswonger, R.G., Panday, S., and Ibaraki, M., 2011, MODFLOW-NWT, A Newton formulation for MODFLOW-2005: U.S. Geological Survey Techniques and Methods 6-A37, 44 p.
Final Report: Identification of the Vulnerability of the Major and Minor Aquifers of Texas to Subsidence with Regard to Groundwater Pumping – TWDB Contract Number 1648302062
10-13
Nordstrom, P.L., 1982, Occurrence, availability, and chemical quality of ground water in the Cretaceous aquifers of north-central Texas: Texas Department of Water Resources Report 269, 496 p.
Nordstrom, P.L., 1991, Joint Ground-Water Quality Project with the Texas Department of Agriculture in Parts of Haskell, Knox, and Stonewall Counties: Texas Water Development Board Report 333, 85 p.
Ogilbee, W. and Osborne Jr., F.L., 1962, Ground-Water Resources of Haskell and Knox Counties, Texas: Texas Water Development Board Bulletin 6209, 174 p.
Oliver, W., 2010, GAM Task 10-012 Model Run Report: Texas Water Development Board GAM Task, 48 p.
Oliver, W., 2011a, GAM Run 10-036 MAG Report: Texas Water Development Board GAM Run 10-036 MAG Report, 11 p.
Oliver, W., 2011b, GAM Run 10-037 MAG Report: Texas Water Development Board GAM Run 10-037 MAG Report, 10 p.
Oliver, W., 2012, GAM Run 10-044 MAG: Texas Water Development Board GAM Run 10-044 MAG, 20 p.
Paine, J.G., 2016, Wink Sink, http://www.beg.utexas.edu/research/programs/near-surface-observatory/wink-sink, accessed November 2017.
Poland, J.F. and Davis, G.H., 1969, Land Subsidence Due to Withdrawals of Fluids, in Varnes, D.J. and Kiersch, G., eds.: Geological Society of America Reviews in Engineering Geology, v. 2, 187-269 p.
Presley, M.W., 1981, Middle and Upper Permian salt-bearing strata of the Texas Panhandle: lithologic and facies cross sections: University of Texas at Austin Bureau of Economic Geology publication prepared for the U.S. Department of Energy Office of Waste Isolation under contract no. DE-AC97-80ET46615, 10 p.
Preston, R.D., 1978, Occurrence and Quality of Ground Water in Baylor County, Texas: Texas Department of Water Resources Report 218, 101 p.
Preston, R.D., 2006, The Yegua-Jackson Aquifer, in Mace, R.E., Davidson, S.C., Angle, E.S., and Mullican III, W.F., eds.: Aquifers of the Gulf Coast of Texas, Texas Water Development Board Report 365, 51-59 p.
Final Report: Identification of the Vulnerability of the Major and Minor Aquifers of Texas to Subsidence with Regard to Groundwater Pumping – TWDB Contract Number 1648302062
10-14
Preston, R.D., Pavilcek, D.J., Bluntzer, R.L., and Derton, J., 1996, The Paleozoic and Related Aquifers of Central Texas: Texas Water Development Board Report 346, 77 p.
Price, R.D., 1978, Occurrence, Quality, and Availability of Ground Water in Jones County, Texas: Texas Department of Water Resources Report 215, 224 p.
Price, R.D., 1979, Occurrence, Quality, and Quantity of Ground Water in Wilbarger County, Texas: Texas Department of Water Resources Report 240, 229 p.
R.W. Harden & Associates, 1978, The Seymour Aquifer: Ground-Water Quality and Availability in Haskell and Knox Counties, Texas Volume I and Volume II: Texas Department of Water Resources Report 226, 309 p.
Ratzlaff, K.W., 1980, Land-Surface Subsidence in the Texas Coastal Region: U.S. Geological Survey Open File Report 80-969, 19 p.
Ratzlaff, K.W., 1982, Land-Surface Subsidence in the Texas Coastal Region: Report 272, 26 p.
Reese, J.S., Mosher, S., Connelly, J., and Roback, R., 2000, Mesoproterozoic chronostratigraphy of the southeastern Llano Uplift, central Texas: Geological Society of America Bulletin, v. 112, no. 2, p. 278-291.
Rio Grande Regional Water Planning Group, 2015, 2016 Rio Grande Regional Water Plan: Region M 2016 RWP, 553 p.
Rogers, L.T., 1967, Availability and Quality of Ground Water in Fayette County, Texas: Texas Water Development Board Report No. 56, 117 p.
Rose, P.R., 1972, Edwards Group, surface and subsurface, central Texas: University of Texas at Austin, Bureau of Economic Geology Report of Investigations 74, 198 p.
Rosepiler, M.J. and Reilinger, R., 1977, Land subsidence due to water withdrawal in the vicinity of Pecos, Texas.: Engineering Geology, v. 11, no. 4, p. 295-304.
Ryder, P.D., 1988, Hydrogeology and pre-development flow in the Texas Gulf Coast aquifer systems: U.S. Geological Survey Water Resources Investigation Report 87-4248, 109 p.
Scanlon, B.R., Mace, R.E., Smith, B., Hovorka, S., Dutton, A.R., and Reedy, R., 2001, Groundwater Availability of the Barton Springs Segment of the Edwards Aquifer, Texas: Numerical Simulations Through 2050: Contract Report for the Texas Water Development Board, 99 p.
Final Report: Identification of the Vulnerability of the Major and Minor Aquifers of Texas to Subsidence with Regard to Groundwater Pumping – TWDB Contract Number 1648302062
10-15
Sellards, E.H., Adkins, W.S., and Plummer, F.B., 1932, The Geology of Texas, Volume I, Stratigraphy: (1981st) Austin, Texas, Bureau of Economic Geology, The University of Texas at Austin, 1007 p.
Seni, S.J. and Choh, S.J., 1994, Targeted secondary recovery of hydrocarbons from barrier-bar and tidal channel facies, Jackson Group, Prado Field, South Texas: Bureau of Economic Geology Geological Circular 94-2, 47 p.
Shah, S.D., Houston, N.A., and Braun, C.L., 2007, Hydrogeologic characterization of the Brazos River Alluvium Aquifer, Bosque County to Fort Bend county, Texas: U.S. Geological Survey Scientific Investigations Map 2989, 5 p.
Sheng, Z., Mace, R.E., and Fahy, M.P., 2001, The Hueco Bolson: An Aquifer at the Crossroads, in Mace, R.E., Mullican III, W.F., and Angle, E.S., eds.: Aquifers of West Texas, Texas Water Development Board Report 356, 66-75 p.
Shi, J., 2012, Modeled Available Groundwater for the Edwards-Trinity (Plateau), Trinity, and Pecos Valley aquifers in Groundwater Management Area 7: Texas Water Development Board GAM Run 10-043 MAG (Version 2), 15 p.
Shi, J., 2017a, Modeled Available Groundwater for the Ogallala, Edwards-Trinity (High Plains), and Dockum Aquifers in Groundwater Management Area 2: GAM Run 16-028 MAG, 19 p.
Shi, J., 2017b, Modeled Available Groundwater for the Seymour, Blaine, Ogallala, and Dockum Aquifers in Groundwater Management Area 6: Texas Water Development Board GAM Run 16-031 MAG, 37 p.
Shi, J., Boghici, R., Kohlrenken, W., and Hutchinson, W., 2016a, Conceptual Model Report: Minor Aquifers in Lllano Uplift Region of Texas: Texas Water development Board Report, 291 p.
Shi, J., Boghici, R., Kohlrenken, W., and Hutchison, W., 2016b, Numerical Model Report: Minor Aquifers of the Llano Uplift Region of Texas (Marble Falls, Ellenburger-San Saba, and Hickory): Texas Water Development Board GAM Report, 435 p.
Smith, J.T., 1970, Ground-water resources of Collingsworth County, Texas: Texas Water Development Board Report 119, 116 p.
Smith, J.T., 1973, Ground-water resources of Motley and northern Floyd counties, Texas: Texas Water Development Board Report 165, 66 p.
Final Report: Identification of the Vulnerability of the Major and Minor Aquifers of Texas to Subsidence with Regard to Groundwater Pumping – TWDB Contract Number 1648302062
10-16
Smith, R., 2001, Hydrogeology of the Marathon Basin Brewster County, Texas, in Mace, R.E., Mullican III, W.F., and Angle, E.S., eds.: Aquifers of West Texas, Texas Water Development Board Report 356, 190-206 p.
Sneed, M. and Brandt, J.T., 2013, Detection and Measurement of Land Subsidence Using Global Positioning System Surveying and Interferometric Synthetic Aperture Radar, Coachella Valley, California, 1996–2005: U.S. Geological Survey Scientific Investigations Report 2007-5251, 31 p.
Standen, A., Finch, S., Williams, R., and Lee-Brand, B., 2009, Capitan Reef Complex Structure and Stratigraphy: Contract Report for the Texas Water Development Board,
Standen, A. and Ruggiero, R., 2007, Llano Uplift Aquifers Structure and Stratigraphy: Contract Report for the Texas Water Development Board, 28 p.
Strom, E., Houston, N., and Garcia, A., 2003, Selected hydrogeologic datasets for the Jasper Aquifer, Texas: United States Geological Survey, Open File Report 2003-299,
Terzaghi, K., 1925, Erdbaumechanik auf bodenphysikalisher Grundlage: Vienna, Austria, Deuticke, 399 p.
Texas Alliance of Groundwater Districts, 2017, Texas Alliance of Groundwater Districts Membership List, Austin: Texas Alliance of Groundwater Districts.
Texas Alliance of Groundwater Districts, 2017, What We Do - Texas Alliance of Groundwater Districts, https://texasgroundwater.org/what-we-do, accessed September 2017.
Texas Commission on Environmental Quality, 2015, https://www.tceq.texas.gov/assets/public/gis/metadata/TCEQ_GCD.pdf, accessed November 2017.
Texas Water Conservation Association, 2017, About Us: Texas Water Conservation Association, https://www.twca.org/Public/About_Us/About_TWCA/Public/About.aspx, accessed September 2017.
Texas Water Development Board, 2015, Regional Water Planning Areas Data Download, http://www.twdb.texas.gov/mapping/gisdata.asp, accessed May 2017.
Texas Water Development Board, 2017a, Groundwater Database Reports, http://www.twdb.texas.gov/groundwater/data/gwdbrpt.asp, accessed May 2017.
Final Report: Identification of the Vulnerability of the Major and Minor Aquifers of Texas to Subsidence with Regard to Groundwater Pumping – TWDB Contract Number 1648302062
10-17
Texas Water Development Board, 2017b, Historical Groundwater Pumpage - SumFinal_CountySumPumpage, http://www.twdb.texas.gov/waterplanning/waterusesurvey/historical-pumpage.asp, accessed September 2017.
Texas Water Development Board, 2017c, Regional Water Planning in Texas, http://www.twdb.texas.gov/publications/shells/RegionalWaterPlanning.pdf, accessed September 2017.
Texas Water Development Board, 2017d, Submitted Drillers Reports Database Download, http://www.twdb.state.tx.us/groundwater/data/drillersdb.asp, accessed May 2017.
Texas Water Development Board, 2018, Blossom Aquifer, http://www.twdb.texas.gov/groundwater/aquifer/minors/blossom.asp, accessed March 2018.
Thompson, G.L., 1966, Ground-Water Resources of Lee County, Texas: Texas Water Development Board Report 20, 131 p.
Thorkildsen, D. and Price, R.D., 1991, Ground-Water Resources of the Carrizo-Wilcox Aquifer in the Central Texas Region: Texas Water Development Board Report 332, 46 p.
U.S. Geological Survey, 2017, Texas Gulf Coast Groundwater and Land Subsidence, https://txpub.usgs.gov/houston_subsidence/home/, accessed November 2017.
Ulery, R.L., Meyer, J.E., Andren, R.W., and Newson, J.K., 2011, Source-water susceptibility assessment in Texas—Approach and methodology: U.S. Geological Survey Scientific Investigations Report 2011–5197, 64 p.
Uliana, M.M., 2001, The Geology and Hydrogeology of the Capitan Aquifer: A Brief Overview, in Mace, R.E., Mullican III, W.F., and Angle, E.S., eds.: Aquifers of West Texas, Texas Water Development Board Report 356, 153-166 p.
Wade, S., 2016, Modeled Available Groundwater for the Gulf Coast Aquifer System in Groundwater Management Area 14: Texas Water Development Board GAM Run 16-024 MAG, 30 p.
Wade, S., 2017a, Modeled Available Groundwater for the Carrizo-Wilcox, Queen City, and Sparta aquifers in Groundwater Management Area 11: Texas Water Development Board GAM Run 17-024 MAG, 24 p.
Final Report: Identification of the Vulnerability of the Major and Minor Aquifers of Texas to Subsidence with Regard to Groundwater Pumping – TWDB Contract Number 1648302062
10-18
Wade, S., 2017b, Modeled Available Groundwater for the Carrizo-Wilcox, Queen City, Sparta, and Yegua-Jackson aquifers in Groundwater Management Area 13: Texas Water Development Board GAM Run 17-027 MAG, 36 p.
Wade, S.C., Hutchison, W.R., Chowdhury, A.H., and Coker, D., 2011, A Conceptual Model of Groundwater Flow in the Presidio and Redford Bolsons Aquifers: Texas Water Development Board GAM Report, 98 p.
Wade, S.C. and Jigmond, M., 2013, Groundwater Availability Model of West Texas Bolsons (Presidio and Redford) Aquifer: Texas Water Development Board GAM Report, 100 p.
Watermark Numerical Computing, 2015, Groundwater Data Utilities - Part B: Program Descriptions: Watermark Numerical Computing, 378 p.
Waters, J.A., McFarland, P.W., and Lea, J.W., 1955, Geologic framework of the Gulf Coastal Plain of Texas: American Association of Geological Societies Bulletin, v. 39, p. 1821-1850.
Waters, M.R. and Nordt, L.C., 1995, Late Quaternary Floodplain History of the Brazos River in East-Central Texas: Quaternary Research, v. 43, p. 311-319.
Wesselman, J.B., 1967, Ground-water resources of Jasper and Newton Counties, Texas: Texas Water Development Board Report 59, 177 p.
Williams, C.R., 2009, Re-defined Desired Future Condition of Blossom Aquifer: Memorandum to Cheryl Maxwell, Groundwater Management Area 8, 12 p.
Wilson, C.A., 1967, Ground-Water Resources of Austin and Waller Counties, Texas: Texas Water Development Board Report 68, 231 p.
Wong, S.S., 2012, Developing a geospatial model for analysis of a dynamic, heterogeneous aquifer: the Brazos River Alluvium Aquifer, Central Texas: Baylor University, Master’s thesis, 79 p.
Wood, D.H. and Guevara, E.H., 1981, Regional structural cross sections and general stratigraphy, East Texas basin: The University of Texas at Austin, Bureau of Economic Geology, 21 p.
Wrobelski, C.L., 1996, An aquifer characterization at the Texas A&M University Brazos River Hydrologic Field Site, Burleson County, Texas: Texas A&M University, Master’s thesis,
Final Report: Identification of the Vulnerability of the Major and Minor Aquifers of Texas to Subsidence with Regard to Groundwater Pumping – TWDB Contract Number 1648302062
10-19
Wuerch, D. and Backhouse, S., 2011, Groundwater Management Area 4, Rustler Aquifer, Managed Available Groundwater estimates: Texas Water Development Board GTA Aquifer Assessment 10-25 MAG, 10 p.
Yelderman Jr., J.C., 2008, The Brazos River Alluvium Aquifer Flow System in McLennan County, Texas - Technical Memo 11-1-08: Southern Trinity Groundwater Conservation District 2015 Management Plan Appendix 4,
Young, S.C., Budge, T., Knox, P.R., Kalbouss, R., Baker, E., Hamlin, S., Galloway, B., and Deeds, N., 2010, Hydrostratigraphy of the Gulf Coast Aquifer from the Brazos River to the Rio Grande: Contract report for the Texas Water Development Board, 203 p.
Young, S.C., Jigmond, M., Deeds, N., Blainey, J., Ewing, T.E., Banerj, D., Piemonti, D., Jones, T., Griffith, C., Lupton, D., et al., 2016, FINAL REPORT: Identification of Potential Brackish Groundwater Production Areas – Gulf Coast Aquifer System: Contract report to the Texas Water Development Board, 636 p.
Young, S.C., Kelley, V., Deeds, N., Knox, P., Budge, T., Baker, E., Galloway, B., and Dutton, A., 2006, A Site Conceptual Model to Support the Development of a Detailed Groundwater Model for Colorado, Wharton, and Matagorda Counties: Prepared for LCRA, 304 p.
Zohdy, A.A.R., Eaton, G.P., and Mabey, D.R., 1974, Application of Surface Geophysics to Ground-Water Investigations: U.S. Geological Survey Techniques of Water-Resources Investigations 02-D1, 116 p.
Final Report: Identification of the Vulnerability of the Major and Minor Aquifers of Texas to Subsidence with Regard to Groundwater Pumping – TWDB Contract Number 1648302062
11 Appendices
Final Report: Identification of the Vulnerability of the Major and Minor Aquifers of Texas to Subsidence with Regard to Groundwater Pumping – TWDB Contract Number 1648302062
Appendix 1 Summary: Stakeholder Outreach and Groundwater
Conservation District Data
Groundwater Conservation DistrictApril 17, 2017
EmailMay 1, 2017
EmailMay 24, 2017
Email
Phone CallMay 24, 2017 - June 15, 2017
Types of Data Submitted by
GCDs
Bandera County River Authority and Groundwater District Yes Yes No No Well logs
Barton Springs/Edwards Aquifer Conservation District Yes Yes No No
Water level data, lithologic
data,annual
pumping data
Bee Groundwater Conservation District Yes Yes No YesNo additional
data
Blanco-Pedernales Groundwater Conservation District Yes Yes No NoNo additional
data
Bluebonnet Groundwater Conservation District Yes Yes No No
Annualpumping data and simulated-
measured drawdown comparison
data
Brazos Valley Groundwater Conservation District Yes Yes No No
Annual pumping data
and water level data
Brewster County Groundwater Conservation District Yes Yes No NoNo additional
data
Brush Country Groundwater Conservation District Yes Yes No YesAnnual
pumping data
Central Texas Groundwater Conservation District Yes Yes No YesAnnual
pumping data and well logs
Clear Fork Groundwater Conservation District Yes Yes No NoNo additional
data
Clearwater Underground Water Conservation District Yes Yes No NoWell logs and
water level data
Groundwater Conservation Districts - Members of Texas Aliiance of Groundwater Districts
TWDB Aquifer Subsidence Vulnerability StudySummary: Stakeholder Outreach and Groundwater Conservation District Data
LRE Water TeamNovember 1, 2017
TDWB Aquifer Subsidence Vulnerability Study - Summary: Stakeholder Outreach and Groundwater Conservation District DataLRE Water Team - November 1, 2017 Page 1 of 8
Groundwater Conservation DistrictApril 17, 2017
EmailMay 1, 2017
EmailMay 24, 2017
Email
Phone CallMay 24, 2017 - June 15, 2017
Types of Data Submitted by
GCDs
TWDB Aquifer Subsidence Vulnerability StudySummary: Stakeholder Outreach and Groundwater Conservation District Data
LRE Water TeamNovember 1, 2017
Coastal Bend Groundwater Conservation District Yes Yes No NoWell logs and
water level data
Coastal Plains Groundwater Conservation District Yes Yes No NoWell logs and
water level data
Coke County Underground Water Conservation District Yes Yes No NoNo additional
data
Colorado County Groundwater Conservation District Yes Yes No Yes
Annual pumping data
and water level data
Comal Trinty Groundwater Conservation District Yes Yes No YesAnnual
pumping data
Cow Creek Groundwater Conservation District Yes Yes No NoNo additional
data
Crockett County Groundwater Conservation District Yes Yes No YesNo additional
data
Culberson County Groundwater Conservation District Yes Yes No NoNo additional
data
Duval County Groundwater Conservation District Yes Yes No YesNo additional
data
Edwards Aquifer Authority Yes Yes No No
Water level data, annual
pumping data, and well logs
Evergreen Underground Water Conservation District Yes Yes No NoAnnual
pumping data
Fayette County Groundwater Conservation District Yes Yes No Yes
Annual pumping data
and water level data
Gateway Groundwater Conservation District Yes Yes No NoNo additional
data
TDWB Aquifer Subsidence Vulnerability Study - Summary: Stakeholder Outreach and Groundwater Conservation District DataLRE Water Team - November 1, 2017 Page 2 of 8
Groundwater Conservation DistrictApril 17, 2017
EmailMay 1, 2017
EmailMay 24, 2017
Email
Phone CallMay 24, 2017 - June 15, 2017
Types of Data Submitted by
GCDs
TWDB Aquifer Subsidence Vulnerability StudySummary: Stakeholder Outreach and Groundwater Conservation District Data
LRE Water TeamNovember 1, 2017
Glasscock Groundwater Conservation District Yes Yes No YesNo additional
data
Gonzales County Underground Water Conservation District Yes Yes No NoAnnual
pumping data summary
Guadalupe County Groundwater Conservation District Yes Yes No NoAnnual
pumping data
Hays Trinity Groundwater Conservation District Yes Yes No YesAnnual
pumping data and well logs
Headwaters Groundwater Conservation District Yes Yes No NoNo additional
data
Hemphill County Underground Water Conservation District Yes Yes No No
Wellinformation,
annual pumping data, and water level
data
High Plains Underground Water Conservation District No. 1 Yes Yes No NoWater well
permit applications
Hill Country Underground Water Conservation District Yes Yes No NoNo additional
data
Hudspeth County Underground Water Conservation District Yes Yes No NoNo additional
data
Irion County Water Conservation District Yes Yes No NoNo additional
data
Jeff Davis County Underground Water Conservation District Yes Yes No YesAnnual
pumping data
Kenedy County Groundwater Conservation District Yes Yes No YesNo additional
data
Kimble County Groundwater Conservation District Yes Yes No NoNo additional
data
Kinney County Groundwater Conservation District Yes Yes No NoNo additional
dataTDWB Aquifer Subsidence Vulnerability Study - Summary: Stakeholder Outreach and Groundwater Conservation District DataLRE Water Team - November 1, 2017 Page 3 of 8
Groundwater Conservation DistrictApril 17, 2017
EmailMay 1, 2017
EmailMay 24, 2017
Email
Phone CallMay 24, 2017 - June 15, 2017
Types of Data Submitted by
GCDs
TWDB Aquifer Subsidence Vulnerability StudySummary: Stakeholder Outreach and Groundwater Conservation District Data
LRE Water TeamNovember 1, 2017
Live Oak Underground Water Conservation District Yes Yes No YesNo additional
data
Llano Estacado Underground Water Conservation District Yes Yes No NoWater level
data and well information
Lone Star Groundwater Conservation District Yes Yes No No
Water level data, annual
pumping data, and well logs
Lone Wolf Groundwater Conservation District Yes Yes No NoNo additional
data
Lost Pines Groundwater Conservation District Yes Yes No YesNo additional
data
Lower Trinity Groundwater Conservation District Yes Yes No YesNo additional
data
McMullen Groundwater Conservation District Yes Yes No YesNo additional
data
Medina County Groundwater Conservation District Yes Yes No Yes
Annual pumping data
and water level data
Menard County Underground Water District Yes Yes No NoNo additional
data
Mesa Underground Water Conservation District Yes Yes No YesNo additional
data
Mesquite Groundwater Conservation District Yes Yes No NoWell logs and
water level data
Middle Pecos Groundwater Conservation District Yes Yes No YesNo additional
data
Middle Trinity Groundwater Conservation District Yes Yes No YesNo additional
data
Mid-East Texas Groundwater Conservation District Yes Yes No NoNo additional
data
TDWB Aquifer Subsidence Vulnerability Study - Summary: Stakeholder Outreach and Groundwater Conservation District DataLRE Water Team - November 1, 2017 Page 4 of 8
Groundwater Conservation DistrictApril 17, 2017
EmailMay 1, 2017
EmailMay 24, 2017
Email
Phone CallMay 24, 2017 - June 15, 2017
Types of Data Submitted by
GCDs
TWDB Aquifer Subsidence Vulnerability StudySummary: Stakeholder Outreach and Groundwater Conservation District Data
LRE Water TeamNovember 1, 2017
Neches and Trinity Valleys Groundwater Conservation District Yes Yes No YesNo additional
data
North Plains Groundwater Conservation District Yes Yes No NoAnnual
pumping data
North Texas Groundwater Conservation District Yes Yes No YesAnnual
pumping data
Northern Trinity Groundwater Conservation District Yes Yes No NoNo additional
data
Panhandle Groundwater Conservation District Yes Yes No NoWater level
data and well logs
Panola County Groundwater Conservation District Yes Yes No Yes
Water level data, annual
pumping data, and well logs
Pecan Valley Groundwater Conservation District Yes Yes No NoWater level and
annual pumping data
Permian Basin Underground Water Conservation District Yes Yes No No Well log data
Pineywoods Groundwater Conservation District Yes Yes No NoNo additional
data
Plateau Underground Water Conservation and Supply District Yes Yes No NoNo additional
data
Plum Creek Conservation District Yes Yes No YesWater level and
annual pumping data
Post Oak Savannah Groundwater Conservation District Yes Yes No YesNo additional
data
Prairielands Groundwater Conservation District Yes Yes No NoNo additional
data
Real-Edwards Conservation and Reclamation District Yes Yes No NoNo additional
data
Red River Groundwater Conservation District Yes Yes No YesAnnual
pumping data
TDWB Aquifer Subsidence Vulnerability Study - Summary: Stakeholder Outreach and Groundwater Conservation District DataLRE Water Team - November 1, 2017 Page 5 of 8
Groundwater Conservation DistrictApril 17, 2017
EmailMay 1, 2017
EmailMay 24, 2017
Email
Phone CallMay 24, 2017 - June 15, 2017
Types of Data Submitted by
GCDs
TWDB Aquifer Subsidence Vulnerability StudySummary: Stakeholder Outreach and Groundwater Conservation District Data
LRE Water TeamNovember 1, 2017
Rolling Plains Groundwater Conservation District Yes Yes No NoNo additional
data
Rusk County Groundwater Conservation District Yes Yes No YesWater level
data and well logs
Sandy Land Underground Water Conservation District Yes Yes No NoWater level
data and well information
Santa Rita Underground Water Conservation District Yes Yes No NoNo additional
data
Saratoga Underground Water Conservation District Yes Yes No YesNo additional
data
South Plains Underground Water Conservation District Yes Yes No NoWater level
data and well information
Southeast Texas Groundwater Conservation District Yes Yes No No Well logs
Southern Trinity Groundwater Conservation District Yes Yes No NoWater level
data
Sterling County Underground Water Conservation District Yes Yes No NoNo additional
data
Sutton County Underground Water Conservation District Yes Yes No NoNo additional
data
Trinity Glen Rose Groundwater Conservation District Yes Yes No YesAnnual
pumping data
Upper Trinity Groundwater Conservation District Yes Yes No No
Water level data and annual
pumping data
Uvalde County Underground Water Conservation District Yes Yes No NoNo additional
data
Wes-Tex Groundwater Conservation District Yes Yes No NoNo additional
data
Wintergarden Groundwater Conservation District Yes Yes No YesWater level
data
TDWB Aquifer Subsidence Vulnerability Study - Summary: Stakeholder Outreach and Groundwater Conservation District DataLRE Water Team - November 1, 2017 Page 6 of 8
Groundwater Conservation DistrictApril 17, 2017
EmailMay 1, 2017
EmailMay 24, 2017
Email
Phone CallMay 24, 2017 - June 15, 2017
Types of Data Submitted by
GCDs
TWDB Aquifer Subsidence Vulnerability StudySummary: Stakeholder Outreach and Groundwater Conservation District Data
LRE Water TeamNovember 1, 2017
Brazoria County Groundwater Conservation District No No Yes Yes
Annualpumping data,
water level data, and time series elevation
dataCalhoun County Groundwater Conservation District No No Yes Yes
No additional data
Corpus Christi Aquifer Storage and Recovery Conservation District No No Yes YesNo additional
data
Garza County Underground Water Conservation District No No Yes YesWell logs and
water level data
Goliad County Groundwater Conservation District No No Yes YesNo additional
data
Hickory Underground Water Conservation District No. 1 No No Yes YesNo additional
data
Lipan-Kickapoo Water Conservation District No No Yes NoNo additional
data
Presidio County Underground Water Conservation District No No Yes NoNo additional
data
Red Sands Groundwater Conservation District No No Yes YesNo additional
data
Reeves County Groundwater Conservation District No No Yes NoNo additional
data
Refugio Groundwater Conservation District No No Yes Yes
Water level data and annual
pumping data
San Patricio County Groundwater Conservation District No No Yes YesNo additional
data
Starr County Groundwater Conservation District No No Yes YesNo additional
data
Groundwater Conservation Districts - Non-Members of Texas Aliiance of Groundwater Districts
TDWB Aquifer Subsidence Vulnerability Study - Summary: Stakeholder Outreach and Groundwater Conservation District DataLRE Water Team - November 1, 2017 Page 7 of 8
Groundwater Conservation DistrictApril 17, 2017
EmailMay 1, 2017
EmailMay 24, 2017
Email
Phone CallMay 24, 2017 - June 15, 2017
Types of Data Submitted by
GCDs
TWDB Aquifer Subsidence Vulnerability StudySummary: Stakeholder Outreach and Groundwater Conservation District Data
LRE Water TeamNovember 1, 2017
Terrell County Groundwater Conservation District No No Yes NoNo additional
data
Texana Groundwater Conservation District No No Yes Yes
Water level data and annual
pumping data
Victoria County Groundwater Conservation District No No Yes Yes
Water level data and annual
pumping data
TDWB Aquifer Subsidence Vulnerability Study - Summary: Stakeholder Outreach and Groundwater Conservation District DataLRE Water Team - November 1, 2017 Page 8 of 8
Final Report: Identification of the Vulnerability of the Major and Minor Aquifers of Texas to Subsidence with Regard to Groundwater Pumping – TWDB Contract Number 1648302062
Appendix 2 Summary: Aquifer Geodatabases Compiled From
Existing TWDB GAM Data
Feature Dataset Feature Class Description Blaine Blossom
Boundary Aquifer Aquifer boundary x x x x x x x x x x x x x x x x x x x x x x x x x x x x x x
Aq_Top; Aq_Base; Aq_Thick; Aq_Extent
Contours, points, or polygons describing the aquifer base, top,
and thickness, and coverage area
x x x x North only x x x x x x x x x x x x x x x x x x x
Extent(s) Upper/lower/other aquifer boundaries x x x x x x x x x x x x x x x x
Net-Sand Net sand w/in aquifer x x x x x x x x x x x x x x x x
Geology Grids Geology Grids
Raster catalog of geologic layers
including aquifer top, base, thickness
x x x x x x x x x x x x x x x x x x x x x x
Geomorphology Geomorphology DEM DEM x x x x x x x x x x x x x x x x x x x x x x
Geophysics Borehole Geophysical logs x North only x
TWDB Wells Well locations x x x x x x x x x x x x x x x x x x x x x x x x x x x x x xWater Levels Water levels x x x x x x x x x x x x x x x x x x x x x x x x x
Subsurface Hydro Grids Subsurface Hydro Grids
Raster catalog of hydro layers
including historic water levels
x x x x x x x x x x x x x x x x x
Not in GAM data
TWDB Aquifer Subsidence Vulnerability Study
LRE Water Team November 1, 2017
Subsurface Hydro
GAM data not available or incomplete
Geology
Summary: Aquifer Geodatabases Compiled From Existing TWDB GAM Data
Final Report: Identification of the Vulnerability of the Major and Minor Aquifers of Texas to Subsidence with Regard to Groundwater Pumping – TWDB Contract Number 1648302062
Appendix 3 Summary: Statewide GeoDatabase - Statewide Well Data
and Mapping Reference Datasets
TWDB Aquifer Subsidence Vulnerability Study TWDB Aquifer Subsidence Vulnerability Study
Feature Dataset Feature Class Description SourceCities_2017 Municipal Boundaries TNRIS, 2017
Counties 1:24,000 County Boundaries TNRIS, 2010Five_States_Mexico Surrounding States and Mexico Boundaries ESRI, 2010
GCDs Groundwater Conservation District Boundaries TWDB, 2017Houston_Galveston_Exclude Exclusion area for the Houston Galveston area TWDB, 2017
Major_Aquifers Major Aquifers TWDB, 2006Minor_Aquifers Minor Aquifers TWDB, 2006
RWPGs Regional Water Planning Groups TWDB, 2014Texas 1:24,000 Texas Boundary TNRIS, 2010
Texas_25mi_buffer 25-mile buffer of Texas Boundary B&A, 2017
GWDB_TDS_2017 Groundwater database well locations with total dissolved solids TWDB, 2017
SDR_WellsSubmitted driller report well locations. Estimated
clay thicknesses from lithology descriptions compiled by LRE Water, LLC.
LRE Water, LLC; TWDB, 2017
TWDB_Wells Well locations TWDB, 2017SurfaceHydro GulfofMexico 1:24,000 Gulf of Mexico Boundary TNRIS, 2010Transportation TxDOT_Roadways Texas highways and other roadways TxDOT, 2015
land_surf_ft 1-km land surface elevation grid ?temp_gradient 1/4mi aquifer temperature gradient grid ?
SDR_clay_thickness_intervals Clay thickness intervals table for SDR Wells LRE Water, LLCSDR_clay_thicknesses Clay thickness table for SDR Wells LRE Water, LLC
SubSurfaceHydro
Boundary
Summary: Statewide GeoDatabase - Statewide Well Data and Mapping Reference DatasetsLRE Water Team
November 1, 2017
Final Report: Identification of the Vulnerability of the Major and Minor Aquifers of Texas to Subsidence with Regard to Groundwater Pumping – TWDB Contract Number 1648302062
Appendix 4 GCD Email Communications
1
Roberta Becker
From: Velma DanielsonSent: Monday, April 17, 2017 6:25 PMSubject: Request for GCD Data - TWDB Aquifer Subsidence Vulnerability StudyAttachments: 041717 Aquifer Subsidence Vulnerabiltiy Project Summary.pdf
Greetings!
As announced at the January 2017 Regular Texas Alliance of Groundwater District’s Business Meeting, the LRE Team was retained by the Texas Water Development Board (TWDB) to identify the vulnerability of major/minor aquifers of Texas to subsidence due to groundwater pumping. For more information on this project, please refer to the attached project summary.
To conduct this statewide assessment, the LRE Team will use groundwater data resources that include the TWDB
Groundwater Database (GWDB), Texas Department of Licensing and Regulation’s (TDLR) Submitted Driller’s Report
Database (SDR), TWDB water level data, and TWDB’s Brackish Resources Aquifer Characterization System (BRACS)
Database.
The LRE Team is collecting these data from the TWDB, U.S. Geological Survey (USGS), Groundwater Conservation
Districts (GCDs), and other sources such as the Regional Water Planning Groups (RWPGs).
Because the LRE Team understands the critical importance of local GCD input and data to this overall assessment, we are respectfully asking for help from all GCDs to share their data that might not be included in the data sets listed above. The types of data we would be interested in would include the following data for major and minor aquifers:
Well logs
Pumping data
Water‐level data
Time‐series elevation data (subsidence observations)
While the following is a list of preferred formats for the data, please feel free to share any data that you believe may be important to this assessment for your GCD and aquifers:
ESRI Geodatabase
ESRI Shapefiles
Database formats (MS Access, SQL, SQL Express)
EXCEL Spreadsheet
Plain Text
The following is a discussion of three options for GCDs to use to send the LRE Team your GCD data.
Upload Data to Share File Link
This option allows GCDs to upload large amounts of data onto a remote internet server very easily and quickly. Please use the following link to upload your GCD’s data and follow the instructions below the link:
2
TWDB Aquifer Subsidence Vulnerability Study Data Upload Link
Instructions to use the Share File Link:
1. Click “Continue” after entering the following information email address, first name, last name and company.
2. Follow the instructions “Drag files here” to drag and drop files into the window for upload or click “Browse files”
to browse to the files on your computer or network for upload.
3. Review the files selected for upload and click “Upload” to upload the files.
Send Data by Email
Using this option may limit the amount of data or sizes of data files that can be transmitted through email. Use of this option may require GCDs to divide up the files, and send multiple emails.
If you choose to send your data via email, please email it to TWDB_Aquifer_Subsidence_Vulnerability_Study@blantonassociates.com.
Send Data by U.S. Mail
Data files can also be downloaded onto electronic media (e.g. flash drives, CDs, etc.), and sent by U.S. Mail to:
Blanton & Associates, Inc. c/o TWDB Aquifer Subsidence Vulnerability Study 5 Lakeway Centre Court, Suite 200 Austin, Texas 78734
The LRE Team deadline to compile all the data that will be used to perform this assessment is Wednesday, May 31, 2017. We kindly ask that each GCD provide their data as soon as they can, but no later than May 31st to be included as part of this assessment. Data submitted after this date will not be evaluated, but will be compiled and submitted to the TWDB for future consideration.
If you have any questions about the project or this data request, please contact the LRE Team Project Manager Dr. Jordan Furnans, Vice President and Manager of Texas Operations for LRE Water, at [email protected] or at (512) 736‐6485, or Ms. Velma R. Danielson, Senior Project Manager, Blanton & Associates., Inc. at [email protected] or at (210) 854‐9374. More information is also available from the project’s primary contact at the TWDB, Mr. Robert Bradley, at [email protected].
We very much appreciate your consideration and assistance, and look forward to working with you!
Velma R. Danielson
300 Convent Street 5 Lakeway Centre Court Suite 1330 Suite 200 San Antonio, Texas 78205 Austin, Texas 78734
Please consider the environment before printing this e-mail.
3
This communication, including attachments, is for the exclusive use of addressee and may contain proprietary, confidential or privileged information. If you are not the intended recipient, please notify the sender immediately by return e‐mail and delete this communication and destroy all copies
1000 Heritage Center Circle | Suite #141Round Rock, Texas 78664
SUMMARY: IDENTIFYING THE VULNERABILITY OF THE MAJOR AND MINOR AQUIFERS OF TEXAS TO SUBSIDENCE WITH REGARD TO GROUNDWATER PUMPING
OVERVIEW
The team of LRE Water, LLC, GLS Solutions, Inc., Wet Rock Groundwater Services, LLC, and Blanton & Associates, Inc. (LRE Team) was retained by the Texas Water Development Board (TWDB) to identify the vulnerability of the major and minor aquifers of Texas to subsidence due to groundwater pumping (Project).
PROJECT SUMMARY
The Project will assist with managing groundwater resources by identifying areas at risk of aquifer subsidence. The Project does not include evaluating subsidence risk in the areas covered by the Harris-Galveston Subsidence District or the Fort Bend Subsidence District.
Through comprehensive data collection and analysis, the LRE Team will prepare a report on the subsidence risk of each major and minor aquifer in Texas. We will present the results on a qualitative risk matrix as well as in map form.
Where technically feasible, the LRE Team will produce subsidence prediction tools for the aquifers identified to be at risk of possible subsidence due to pumping. We will design these tools to be compatible with and eventually work in conjunction with the adopted Groundwater Availability Models (GAMs). In identified subsidence risk areas, these tools will allow the Groundwater Management Areas to use the GAMs to correlate projected pumping and drawdown to estimate subsidence in support of the Desired Future Conditions process. The final report will also provide recommendations on data collection and appropriate subsidence monitoring methods for each aquifer with the potential for subsidence.
To conduct this statewide assessment, the LRE Team will use groundwater data resources that include the TWDB Groundwater Database (GWDB), Texas Department of Licensing and Regulation’s (TDLR) Submitted Driller’s Report Database (SDR), TWDB water level data, and TWDB’s Brackish Resources Aquifer Characterization System (BRACS) Database.
The data types to be considered include geotechnical, downhole/surface/airborne geophysics, remote sensing, and well logs. In
Additional Data Search: The LRE Team is looking to
supplement State and Federal public data sets with less
commonly known geologic data sets regarding layers that are
compressible (clays) or soluble. We are also searching for time-series elevation data that could indicate
land surface drop (subsidence).
1000 Heritage Center Circle | Suite #141 Round Rock, Texas 78664
addition, water-level and pumping data will be important for evaluating empirical subsidence relationships.
The LRE Team is collecting these data from the TWDB, U.S. Geological Survey (USGS), Groundwater Conservation Districts (GCDs), and other sources such as the Regional Water Planning Groups (RWPGs). PROJECT PERIOD
The LRE Team began work on the Project in April 2017, and will complete their work by April 11, 2018, when the team submit its final report to the TWDB.
PROJECT BACKGROUND
As stated in Section 36.0015 of the Texas Water Code, one of the purposes for the creation of GCDs is to control land subsidence. Land subsidence may occur due to natural compaction, drainage of organic soils, sinkholes, mining and other causes. However, aquifer-system compaction due to depressurization caused by groundwater pumping is one of the primary causes of land subsidence.
Extensive research has not been conducted on the possibility of subsidence in various regions of Texas with respect to groundwater pumping (other than in the areas of the Harris-Galveston and Fort Bend Subsidence districts). When surface water resources are restricted, due to drought or water use, reliance on groundwater increases. Therefore, land subsidence caused by aquifer system compaction may be initiated or re-initiated in areas vulnerable to subsidence. Identifying areas at risk and careful monitoring of those areas is crucial for predicting and managing land subsidence.
For more information about this project, please contact our Project Manager Dr. Jordan Furnans, Vice President and Manager of Texas Operations for LRE Water, at [email protected] or at (512) 736-6485, or Ms. Velma R. Danielson, Senior Project Manager, Blanton & Associates., Inc. at velma.danielson@ blantonassociates.com or at (210) 854-9374. More information is also available from the project’s primary contact at the TWDB, Mr. Robert Bradley, at robert.bradley@ twdb.texas.gov.
From: Velma DanielsonSent: Monday, May 01, 2017 4:38 PM
Subject: Update and Request for GCD Data - TWDB Aquifer Subsidence Vulnerability Study
Hello!
The LRE Team extends our sincere appreciation to the many GCDs that responded to our April 17th request for data and information to support our efforts to identify the vulnerability of major/minor aquifers of Texas to subsidence due to groundwater pumping. We have received very useful information from the GCDs that have contacted us.
For those GCDs that have not yet had the opportunity to respond, please keep in mind that we will need your data by May 31, 2017, to be included as part of this initial subsidence assessment being conducted for the Texas Water Development Board (TWDB). We kindly ask that each GCD provide their data as soon as they can, but no later than May 31st to be included as part of this assessment. Data submitted after this date will not be evaluated, but will be compiled and submitted to the TWDB for future consideration.
Because this assessment is the first‐ever state‐wide effort to evaluate land subsidence in Texas that may be impacted by groundwater pumping, it is important that we include and evaluate data for those aquifers and areas in Texas where subsidence is not an issue. In those cases, data to support the absence or lack of subsidence is important to evaluate and consider as part of our final report to the TWDB.
As you prepare your GCD’s information, the LRE Team would encourage you not to duplicate your efforts. If your GCD has previously submitted wells logs, pumping data, or water level data to either the TWDB or the U.S. Geological Survey, please let us know and we will follow‐up. However, if there is related data (e.g. recently collected data) that has not yet been sent to either of these agencies, please send that data to us. We would like to receive complete data sets that cover your GCD’s most historic data, up to the most current data. Again, time‐series elevation data (subsidence observations) are also extremely beneficial to this study, and we ask that you please send this data to us if your GCD has any data to share.
Once again, while the following is a list of preferred formats for the data, please feel free to share any data that you believe may be important to this assessment for your GCD and aquifers:
ESRI Geodatabase
ESRI Shapefiles
Database formats (MS Access, SQL, SQL Express)
EXCEL Spreadsheet
Plain Text
The following three options are available for GCDs to use to send the LRE Team your GCD data.
A. Upload Data to Share File Link
This option allows GCDs to upload large amounts of data onto a remote internet server very easily and quickly. Please use the following link to upload your GCD’s data and follow the instructions below the link:
TWDB Aquifer Subsidence Vulnerability Study Data Upload Link
2
Instructions to use the Share File Link:
1. Click “Continue” after entering the following information email address, first name, last name and company.
2. Follow the instructions “Drag files here” to drag and drop files into the window for upload or click “Browse files”to browse to the files on your computer or network for upload.
If your data is organized in folders, please zip the folder and upload the zip file.
3. Review the files selected for upload and click “Upload” to upload the files.
B. Send Data by Email
Using this option may limit the amount of data or sizes of data files that can be transmitted through email. Use of this option may require GCDs to divide up the files, and send multiple emails.
If you choose to send your data via email, please email it to:
Data files can also be downloaded onto electronic media (e.g. flash drives, CDs, etc.), and sent by U.S. Mail to:
Blanton & Associates, Inc. c/o TWDB Aquifer Subsidence Vulnerability Study 5 Lakeway Centre Court, Suite 200 Austin, Texas 78734
If you have any questions about the project or this data request, please contact the LRE Team Project Manager Dr. Jordan Furnans, Vice President and Manager of Texas Operations for LRE Water, at [email protected] or at (512) 736‐6485, or Ms. Velma R. Danielson, Senior Project Manager, Blanton & Associates., Inc. at [email protected] or at (210) 854‐9374. More information is also available from the project’s primary contact at the TWDB, Mr. Robert Bradley, at [email protected].
Once again, we thank you for your consideration and assistance!
Velma R. Danielson
5 Lakeway Centre Court Suite 200
Austin, Texas 78734
300 Convent Street Suite 1330 San Antonio, Texas 78205
Please consider the environment before printing this e-mail.
This communication, including attachments, is for the exclusive use of addressee and may contain proprietary, confidential or privileged information. If you are not the intended recipient, please notify the sender immediately by return e‐mail and delete this communication and destroy all copies
1
Roberta Becker
From: Velma DanielsonSent: Wednesday, May 24, 2017 3:01 PMSubject: Request for GCD Data - TWDB Aquifer Subsidence Vulnerability StudyAttachments: 041717 Aquifer Subsidence Vulnerabiltiy Project Summary.pdf
Greetings!
The LRE Team was retained by the Texas Water Development Board (TWDB) to identify the vulnerability of major/minor aquifers of Texas to subsidence due to groundwater pumping. For more information on this project, please refer to the attached project summary.
To conduct this statewide assessment, the LRE Team will use groundwater data resources that include the TWDB Groundwater Database (GWDB), Texas Department of Licensing and Regulation’s (TDLR) Submitted Driller’s Report Database (SDR), TWDB water level data, and TWDB’s Brackish Resources Aquifer Characterization System (BRACS) Database.
The LRE Team is collecting these data from the TWDB, U.S. Geological Survey (USGS), Groundwater Conservation Districts (GCDs), and other sources such as the Regional Water Planning Groups (RWPGs).
Because this assessment is the first‐ever state‐wide effort to evaluate land subsidence in Texas that may be impacted by groundwater pumping, it is important that we include and evaluate data for those aquifers and areas in Texas where subsidence is not an issue. In those cases, data to support the absence or lack of subsidence is important to evaluate and consider as part of our final report to the TWDB.
Because the LRE Team understands the critical importance of local GCD input and data to this overall assessment, we are respectfully asking for help from all GCDs to share their data that might not be included in the data sets listed above. The types of data we would be interested in would include the following data for major and minor aquifers:
Well logs
Pumping data
Water‐level data
Time‐series elevation data (subsidence observations)
As you prepare your GCD’s information, the LRE Team would encourage you not to duplicate your efforts. If your GCD has previously submitted wells logs, pumping data, or water level data to either the TWDB or the USGS, please let us know and we will follow‐up. However, if there is related data (e.g. recently collected data) that has not yet been sent to either of these agencies, please send that data to us. We would like to receive complete data sets that cover your GCD’s most historic data, up to the most current data. Again, time‐series elevation data (subsidence observations) are also extremely beneficial to this study, and we asking that you please send this data to us if your GCD has any data to share.
While the following is a list of preferred formats for the data, please feel free to share any data that you believe may be important to this assessment for your GCD and aquifers:
ESRI Geodatabase
ESRI Shapefiles
Database formats (MS Access, SQL, SQL Express)
2
EXCEL Spreadsheet
Plain Text
The following is a discussion of three options for GCDs to use to send the LRE Team your GCD data.
Upload Data to Share File Link
This option allows GCDs to upload large amounts of data onto a remote internet server very easily and quickly. Please use the following link to upload your GCD’s data and follow the instructions below the link:
1. Click “Continue” after entering the following information email address, first name, last name and company.
2. Follow the instructions “Drag files here” to drag and drop files into the window for upload or click “Browse files”to browse to the files on your computer or network for upload.
If your data is organized in folders, please zip the folder and upload the zip file.
3. Review the files selected for upload and click “Upload” to upload the files.
Send Data by Email
Using this option may limit the amount of data or sizes of data files that can be transmitted through email. Use of this option may require GCDs to divide up the files, and send multiple emails.
If you choose to send your data via email, please email it to:
Data files can also be downloaded onto electronic media (e.g. flash drives, CDs, etc.), and sent by U.S. Mail to:
Blanton & Associates, Inc. c/o TWDB Aquifer Subsidence Vulnerability Study 5 Lakeway Centre Court, Suite 200 Austin, Texas 78734
The LRE Team deadline to compile all the data that will be used to perform this assessment is Monday, June 15, 2017. We kindly ask that you provide your data as soon as you can, but no later than June 15th to be included as part of this assessment. Data submitted after this date will not be evaluated, but will be compiled and submitted to the TWDB for future consideration.
If you have any questions about the project or this data request, please contact the LRE Team Project Manager Dr. Jordan Furnans, Vice President and Manager of Texas Operations for LRE Water, at [email protected] or at (512) 736‐6485, or Ms. Velma R. Danielson, Senior Project Manager, Blanton & Associates., Inc. at [email protected] or at (210) 854‐9374. More information is also available from the project’s primary contact at the TWDB, Mr. Robert Bradley, at [email protected].
3
We very much appreciate your consideration and assistance, and look forward to working with you! Velma R. Danielson
300 Convent Street 5 Lakeway Centre Court Suite 1330 Suite 200 San Antonio, Texas 78205 Austin, Texas 78734
Please consider the environment before printing this e-mail.
This communication, including attachments, is for the exclusive use of addressee and may contain proprietary, confidential or privileged information. If you are not the intended recipient, please notify the sender immediately by return e‐mail and delete this communication and destroy all copies
1000 Heritage Center Circle | Suite #141Round Rock, Texas 78664
SUMMARY: IDENTIFYING THE VULNERABILITY OF THE MAJOR AND MINOR AQUIFERS OF TEXAS TO SUBSIDENCE WITH REGARD TO GROUNDWATER PUMPING
OVERVIEW
The team of LRE Water, LLC, GLS Solutions, Inc., Wet Rock Groundwater Services, LLC, and Blanton & Associates, Inc. (LRE Team) was retained by the Texas Water Development Board (TWDB) to identify the vulnerability of the major and minor aquifers of Texas to subsidence due to groundwater pumping (Project).
PROJECT SUMMARY
The Project will assist with managing groundwater resources by identifying areas at risk of aquifer subsidence. The Project does not include evaluating subsidence risk in the areas covered by the Harris-Galveston Subsidence District or the Fort Bend Subsidence District.
Through comprehensive data collection and analysis, the LRE Team will prepare a report on the subsidence risk of each major and minor aquifer in Texas. We will present the results on a qualitative risk matrix as well as in map form.
Where technically feasible, the LRE Team will produce subsidence prediction tools for the aquifers identified to be at risk of possible subsidence due to pumping. We will design these tools to be compatible with and eventually work in conjunction with the adopted Groundwater Availability Models (GAMs). In identified subsidence risk areas, these tools will allow the Groundwater Management Areas to use the GAMs to correlate projected pumping and drawdown to estimate subsidence in support of the Desired Future Conditions process. The final report will also provide recommendations on data collection and appropriate subsidence monitoring methods for each aquifer with the potential for subsidence.
To conduct this statewide assessment, the LRE Team will use groundwater data resources that include the TWDB Groundwater Database (GWDB), Texas Department of Licensing and Regulation’s (TDLR) Submitted Driller’s Report Database (SDR), TWDB water level data, and TWDB’s Brackish Resources Aquifer Characterization System (BRACS) Database.
The data types to be considered include geotechnical, downhole/surface/airborne geophysics, remote sensing, and well logs. In
Additional Data Search: The LRE Team is looking to
supplement State and Federal public data sets with less
commonly known geologic data sets regarding layers that are
compressible (clays) or soluble. We are also searching for time-series elevation data that could indicate
land surface drop (subsidence).
1000 Heritage Center Circle | Suite #141Round Rock, Texas 78664
addition, water-level and pumping data will be important for evaluating empirical subsidence relationships.
The LRE Team is collecting these data from the TWDB, U.S. Geological Survey (USGS), Groundwater Conservation Districts (GCDs), and other sources such as the Regional Water Planning Groups (RWPGs).
PROJECT PERIOD
The LRE Team began work on the Project in April 2017, and will complete their work by April 11, 2018, when the team submit its final report to the TWDB.
PROJECT BACKGROUND
As stated in Section 36.0015 of the Texas Water Code, one of the purposes for the creation of GCDs is to control land subsidence. Land subsidence may occur due to natural compaction, drainage of organic soils, sinkholes, mining and other causes. However, aquifer-system compaction due to depressurization caused by groundwater pumping is one of the primary causes of land subsidence.
Extensive research has not been conducted on the possibility of subsidence in various regions of Texas with respect to groundwater pumping (other than in the areas of the Harris-Galveston and Fort Bend Subsidence districts). When surface water resources are restricted, due to drought or water use, reliance on groundwater increases. Therefore, land subsidence caused by aquifer system compaction may be initiated or re-initiated in areas vulnerable to subsidence. Identifying areas at risk and careful monitoring of those areas is crucial for predicting and managing land subsidence.
For more information about this project, please contact our Project Manager Dr. Jordan Furnans, Vice President and Manager of Texas Operations for LRE Water, at [email protected] or at (512) 736-6485, or Ms. Velma R. Danielson, Senior Project Manager, Blanton & Associates., Inc. at velma.danielson@ blantonassociates.com or at (210) 854-9374. More information is also available from the project’s primary contact at the TWDB, Mr. Robert Bradley, at robert.bradley@ twdb.texas.gov.
From: Mike Keester <[email protected]>Sent: Tuesday, May 23, 2017 2:53 PMTo: Jordan Furnans; Velma DanielsonSubject: Request for Data - TWDB Aquifer Subsidence Vulnerability StudyAttachments: Aquifer Subsidence Vulnerabiltiy Project Summary.pdf
Dear RWPG Chair:
The LRE Water Consultant Team was retained by the Texas Water Development Board (TWDB) to identify the vulnerability of major/minor aquifers of Texas to subsidence due to groundwater pumping. For more information on this project, please refer to the attached project summary.
To conduct this statewide assessment, the LRE Team will use groundwater data resources that include the TWDB Groundwater Database, Texas Department of Licensing and Regulation’s Submitted Driller’s Report Database, TWDB water level data, and TWDB’s Brackish Resources Aquifer Characterization System Database.
The LRE Team is currently collecting these data primarily from the Groundwater Conservation Districts, TWDB, and U.S. Geological Survey. Because this is the first statewide assessment being conducted, we also wanted to raise awareness of the project with the Regional Water Planning Groups so that if any entity, group, or individual involved with the RWPGs has data that would be important to this effort they would know about the project and could send the relevant data our way.
The LRE Team deadline to compile all the data that will be used to perform this assessment is Monday, June 15, 2017. We kindly ask that you provide your data as soon as you can, but no later than June 15th to be included as part of this assessment. Data submitted after this date will not be evaluated, but will be compiled and submitted to the TWDB for future consideration. Instructions for methods to share data are provided below.
If you have any questions about the project, please contact the LRE Team Project Manager Dr. Jordan Furnans, Vice President and Manager of Texas Operations for LRE Water, at [email protected] or at (512) 736-6485, or Ms. Velma R. Danielson, Senior Project Manager, Blanton & Associates., Inc. at [email protected] or at (210) 854-9374. More information is also available from the project’s primary contact at the TWDB, Mr. Robert Bradley, at [email protected].
We very much appreciate your consideration and assistance, and look forward to working with you!
2
Sincerely,
Michael R. Keester, PG Project Manager/Hydrogeologist
LRE Water, LLC
1000 Heritage Center Circle, Suite 141 Round Rock, TX 78664 Phone 512-962-7660 Email [email protected]
Web www.lrewater.com Click to find us on Facebook, LinkedIn and Google+
**CONFIDENTIALITY NOTICE: This email message is for the sole use of the intended recipient(s) and may contain confidential and privileged information. Any unauthorized review, use, disclosure or distribution is prohibited. If you are not the intended recipient, please contact the sender by reply email and destroy all copies of the original message. Thank you.
The following is a discussion of options for RWPGs to use to send the LRE Team your data.
Upload Data to Share File Link
This option allows RWPG members to upload large amounts of data onto a remote internet server very easily and quickly. Please use the following link to upload your data and follow the instructions below the link:
TWDB Aquifer Subsidence Vulnerability Study Data Upload Link
Instructions to use the Share File Link:
1. Click “Continue” after entering the following information email address, first name, last name and company.
2. Follow the instructions “Drag files here” to drag and drop files into the window for upload or click “Browse files” to browse to the files on your computer or network for upload.
3. Review the files selected for upload and click “Upload” to upload the files.
Send Data by Email
3
Using this option may limit the amount of data or sizes of data files that can be transmitted through email. Use of this option may require you to divide up the files, and send multiple emails. If you choose to send your data via email, please email it to Velma Danielson at [email protected] or Robert Ryan at [email protected].
1000 Heritage Center Circle | Suite #141Round Rock, Texas 78664
SUMMARY: IDENTIFYING THE VULNERABILITY OF THE MAJOR AND MINOR AQUIFERS OF TEXAS TO SUBSIDENCE WITH REGARD TO GROUNDWATER PUMPING
OVERVIEW
The team of LRE Water, LLC, GLS Solutions, Inc., Wet Rock Groundwater Services, LLC, and Blanton & Associates, Inc. (LRE Team) was retained by the Texas Water Development Board (TWDB) to identify the vulnerability of the major and minor aquifers of Texas to subsidence due to groundwater pumping (Project).
PROJECT SUMMARY
The Project will assist with managing groundwater resources by identifying areas at risk of aquifer subsidence. The Project does not include evaluating subsidence risk in the areas covered by the Harris-Galveston Subsidence District or the Fort Bend Subsidence District.
Through comprehensive data collection and analysis, the LRE Team will prepare a report on the subsidence risk of each major and minor aquifer in Texas. We will present the results on a qualitative risk matrix as well as in map form.
Where technically feasible, the LRE Team will produce subsidence prediction tools for the aquifers identified to be at risk of possible subsidence due to pumping. We will design these tools to be compatible with and eventually work in conjunction with the adopted Groundwater Availability Models (GAMs). In identified subsidence risk areas, these tools will allow the Groundwater Management Areas to use the GAMs to correlate projected pumping and drawdown to estimate subsidence in support of the Desired Future Conditions process. The final report will also provide recommendations on data collection and appropriate subsidence monitoring methods for each aquifer with the potential for subsidence.
To conduct this statewide assessment, the LRE Team will use groundwater data resources that include the TWDB Groundwater Database (GWDB), Texas Department of Licensing and Regulation’s (TDLR) Submitted Driller’s Report Database (SDR), TWDB water level data, and TWDB’s Brackish Resources Aquifer Characterization System (BRACS) Database.
The data types to be considered include geotechnical, downhole/surface/airborne geophysics, remote sensing, and well logs. In
Additional Data Search: The LRE Team is looking to
supplement State and Federal public data sets with less
commonly known geologic data sets regarding layers that are
compressible (clays) or soluble. We are also searching for time-series elevation data that could indicate
land surface drop (subsidence).
1000 Heritage Center Circle | Suite #141Round Rock, Texas 78664
addition, water-level and pumping data will be important for evaluating empirical subsidence relationships.
The LRE Team is collecting these data from the TWDB, U.S. Geological Survey (USGS), Groundwater Conservation Districts (GCDs), and other sources such as the Regional Water Planning Groups (RWPGs).
PROJECT PERIOD
The LRE Team began work on the Project in April 2017, and will complete their work by April 11, 2018, when the team submit its final report to the TWDB.
PROJECT BACKGROUND
As stated in Section 36.0015 of the Texas Water Code, one of the purposes for the creation of GCDs is to control land subsidence. Land subsidence may occur due to natural compaction, drainage of organic soils, sinkholes, mining and other causes. However, aquifer-system compaction due to depressurization caused by groundwater pumping is one of the primary causes of land subsidence.
Extensive research has not been conducted on the possibility of subsidence in various regions of Texas with respect to groundwater pumping (other than in the areas of the Harris-Galveston and Fort Bend Subsidence districts). When surface water resources are restricted, due to drought or water use, reliance on groundwater increases. Therefore, land subsidence caused by aquifer system compaction may be initiated or re-initiated in areas vulnerable to subsidence. Identifying areas at risk and careful monitoring of those areas is crucial for predicting and managing land subsidence.
For more information about this project, please contact our Project Manager Dr. Jordan Furnans, Vice President and Manager of Texas Operations for LRE Water, at [email protected] or at (512) 736-6485, or Ms. Velma R. Danielson, Senior Project Manager, Blanton & Associates., Inc. at velma.danielson@ blantonassociates.com or at (210) 854-9374. More information is also available from the project’s primary contact at the TWDB, Mr. Robert Bradley, at robert.bradley@ twdb.texas.gov.
Final Report: Identification of the Vulnerability of the Major and Minor Aquifers of Texas to Subsidence with Regard to Groundwater Pumping – TWDB Contract Number 1648302062
Final Report: Identification of the Vulnerability of the Major and Minor Aquifers of Texas to Subsidence with Regard to Groundwater Pumping – TWDB Contract Number 1648302062
Appendix 6 Groundwater Density Calculation Methodology
We calculated the density of the groundwater based on the salinity (S), temperature (t), and aquifer depth using slightly modified forms of the equations described by Gill (1982). The following presents the applicable equations along with any modifications applied for this project (note: equations are valid only for metric (SI) units).
Determine density of the water at a certain pressure:
𝜌(𝑆, 𝑡, 𝑝) =𝜌(𝑆, 𝑡, 0)
[(1 − 𝑝)
𝐾(𝑆, 𝑡, 𝑝)]
where
𝑝 = 𝑝𝑟𝑒𝑠𝑠𝑢𝑟𝑒 (𝑏𝑎𝑟𝑠 [1 𝑏𝑎𝑟 = 100,000 𝑃𝑎𝑠𝑐𝑎𝑙])
𝐾 = 𝑠𝑒𝑐𝑎𝑛𝑡 𝑏𝑢𝑙𝑘 𝑚𝑜𝑑𝑢𝑙𝑢𝑠 (𝑏𝑎𝑟𝑠)
(1)
(2)
(3)
Final Report: Identification of the Vulnerability of the Major and Minor Aquifers of Texas to Subsidence with Regard to Groundwater Pumping – TWDB Contract Number 1648302062
Final Report: Identification of the Vulnerability of the Major and Minor Aquifers of Texas to Subsidence with Regard to Groundwater Pumping – TWDB Contract Number 1648302062
Appendix 7 Project Scope of Work
CONTENT ITEM 6: TECHNICAL APPROACH
PROJECT UNDERSTANDINGSubsidence due to groundwater pumping can have disastrous impacts on infrastructure and can lead to increased flood susceptibility. Subsidence is a slow and subtle process that is difficult to measure and predict. Across Texas, data availability/quality and geologic conditions vary widely. These variations will require different methods to evaluate subsidence risk and to provide mathematical predictive tools. The areas in Texas with the most subsidence-related data and studies are the Subsidence Districts. Because they have been previously investigated, the Harris-Galveston and Fort Bend Subsidence District areas will be excluded from the study.
Methodology
Our team of experts has experience applying the best available subsidence predictive methods in a wide variety of geologic conditions. We are experienced at tackling complex processes,such as subsidence; by efficiently organizing and analyzing the varied data, and clearly presenting the results in an understandable and useful manner.
The LRE Water Team will provide the TWDB an analysis of the major and minor Texas aquifers for the potential to experience subsidence due to groundwater pumping. This subsidence potential will be presented as an Aquifer Subsidence Risk Matrix and associated maps. The LRE Water team will develop mathematical tools for the prediction of subsidence in each aquifer identified to be at-risk. The analysis methods will be tailored to the type, amount and quality of available subsidence-related data. In addition, we will recommend appropriate subsidence monitoring approaches for at-risk aquifers. Depending on data availability, we will recommend an appropriate predictive tool, including empirical relationships, analytical methods, or numerical models.
CONTENT ITEM 6: TECHNICAL APPROACH
Outreach
Our approach includes an outreach campaign to gather lesser known data. Our team’s aquifer characterization experience across Texas will fortify the available data we will use to evaluate subsidence vulnerability.
Table 1 - Example Aquifer Subsidence Risk Matrix
Criteria Weight -> 4 4 1 1
AquiferClay Layer
Thickness and Extent
Clay Layer Compressibility
Preconsolidation Depth
Predicted Future Water Level
Decline
Total Subsidence Risk Factor
(High # = High Risk)Rank
Subsidence Risk?
Recommended Mathematical
Tool
Recommended Subsidence
Monitoring Approach
1 1 1 2 3 13 2 No NA NA
2 4 4 1 1 34 2 Yes EmpiricalInSAR and GPS
Network3 2 2 1 1 18 4 No NA NA4 1 1 1 1 10 6 No NA NA
SUBSIDENCE PRIMERLand subsidence due to groundwater pumping has both vertical and horizontal land movement components. Our approach focuses on the potential for vertical land subsidence because the study of horizontal land movement is more complicated than vertical land subsidence, and requires more varied and detailed data. In addition, with the exception of earth fissures, vertical land subsidence has the most significant and widespread impacts.
The aquifer matrix response to decreased head from groundwater pumping occurs through elastic and inelastic compression. Compression occurs preferentially in clay layers as a result of irrecoverable, inelastic compaction. Sand and gravel layers undergo less compression, most of which is elastic and recoverable if water levels increase again.
Assuming other factors are constant, a higher percentage of clay in aquifer materials generally results in higher land subsidence risk. The thicker the clay layers, the longer the time for subsidence to be realized (years or decades). Because of the time lag for hydraulic pressures to propagate through compressible clay layers, subsidence often continues even after aquifer pressures stabilize or increase. This lagged response must be considered when correlating water-level data to subsidence.
PROJECT APPROACHThe LRE Water Team will approach the project in two phases:
Phase 1 -Aquifer Subsidence Risk Analysis
Collect, and analyze the data necessary to evaluate each aquifer’s subsidence vulnerability, and create an Aquifer Subsidence Risk Matrix with associated maps.
Produce predictive mathematical tools and recommended monitoring methods for aquifers identified as at-risk or vulnerable to subsidence.
RESULTS
THIS PROJECT WILL RESULT IN AN AQUIFER SUBSIDENCE RISK MATRIX AND RELATED MAPS. THE RISK RATING WILL BE BASED ON A CONSISTENT STATEWIDE SCALE (INDEX) THAT CAN BE USED TO FOCUS FUTURE SUBSIDENCE WORK ON THE MOST VULNERABLE AQUIFERS. FOR THOSE AQUIFERS IDENTIFIED AS VULNERABLE TO SUBSIDENCE, WE WILL RECOMMEND AND PRODUCE MATHEMATICAL SUBSIDENCE
PREDICTION TOOLS AND MONITORING PROCEDURES.
41
CONTENT ITEM 6: TECHNICAL APPROACH
Figure 2 - InSAR Subsidence Observations
Phase 1 - Aquifer Subsidence Risk Analysis
Task 1.1 Data Compilation
The LRE Water Team will compile and review the available aquifer characterization data relevant to the subsidence evaluation. We will leverage the significant work done previously to characterize the major and minor aquifers of Texas. We will focus on collecting data needed to evaluate aquifer subsidence risk, and that can be used as the basis for selecting and implementing a subsidence prediction methodology.
Our team has extensive aquifer characterization field experience in a wide variety of geologic environments across Texas and the western US. This field experience is advantageous for understanding and properly utilizing other publicly available data. Our experience in data compilation and field investigation includes coastal subsidence prone areas and basin-fill subsidence risk projects.
There are three primary variables that determine the magnitude, location, and timing of subsidence:
1) distribution, thickness, and compressibility of clay layers;
2) amount and timing of water-level changes; and,
3) lowest historical water level.
The related data types we will focus on collecting include:
Some of the statewide groundwater data resources we utilize include the TWDB Groundwater Database (GWDB), Texas Department of Licensing and Regulation’s (TDLR) Submitted Driller’s Report Database (SDR), TWDB water level data, and TWDB’s Brackish Resources Aquifer Characterization System (BRACS) Database.
LRE TEAM EXPERIENCE
OUR TECHNICAL ADVISORS, GRANT SNYDER, PG, AND KAVEH KHORZAD, PG, HAVE OVER 40 YEARS OF COMBINED TEXAS
GROUNDWATER EXPERIENCE FOCUSING IN SIX OF THE MAJOR AQUIFERS AND MANY OF THE MINOR AQUIFERS. IN ADDITION,
THEY HAVE BOTH WORKED ON GULF COAST SUBSIDENCE STUDIES.
42
CONTENT ITEM 6: TECHNICAL APPROACH
Figure 3 - Three Dimensional Modeling of Compressible Materials Interpreted from Well Logs
The data types we will consider for this project include geotechnical, downhole/surface/airborne geophysics, remote sensing, and well logs. The SDR is particularly useful to identify lithologic layers that may be susceptible to compaction. We will also utilize the BRACS database to interpret lithologic layers through downhole geophysical data.
In addition, water-level and pumping data will be important for evaluating empirical subsidence relationships. We will collect these data from the TWDB, USGS, GCDs, GMAs, and other identified sources.
Land surface elevation change measurements are probably the most obscure type of data that we will compile. These data are limited and have various spatial coverage scales and vertical resolution. We will collect and evaluate (where available) spirit leveling (or level lines), geodetic surveys, high accuracy GPS data, extensometers, and Interferometric Synthetic Aperture Radar (InSAR).
These data will be organized into an Environmental Systems Research Institute, Inc. (ESRI®) ArcGIS file geodatabase to facilitate three-dimensional aquifer conceptualization. Where possible, we will structure the geodatabase according to the data model for the Groundwater Availability Model Geodatabase. This will aid in their integration with other TWDB groundwater data and GAM projects in the future.
Task 1.2 – Stakeholder Outreach
Subsidence studies are typically constrained by data availability. We propose to conduct an outreach program to raise awareness of this project in the Texas groundwater community and to gather other lesser-known subsidence-related data.
Our outreach program will target groups typically involved in Groundwater Availability Modeling (GAM), including regional water planning groups, groundwater conservation districts, groundwater management areas, Texas Commission on Environmental Quality, Texas Parks and Wildlife, Texas Department of Agriculture, Texas Department of Transportation, US Geological Survey, subsidence districts, water utilities, educational groups, agricultural interests, environmental interests, private landowners, industry, and consultants.
The LRE Water Team will engage these groups through direct communication, and other methods such as publishing articles and presenting at conferences for water-related organizations such as the Texas Alliance of Groundwater Districts (TAGD) and the Texas Water Conservation Association (TWCA).
LRE TEAM EXPERIENCE
OUR OUTREACH COORDINATOR, VELMA DANIELSON, HAS FACILITATED STAKEHOLDER AND PUBLIC PARTNERSHIPS FOR SEVERAL LARGE ENTITIES INCLUDING THE EDWARDS AQUIFER AUTHORITY, GROUNDWATER MANAGEMENT AREA 9, AND THE
Figure 5 - Geotechnical Lab Analysis With Skeletal Specific Storage Calculation (Sskv)
Task 1.3 - Historical Subsidence Evaluation
Historical subsidence is an important indicator of subsidence risk. Subsidence observations come in many forms and can be used to evaluate the empirical relationships between groundwater pumping and subsidence. These empirical relationships provide a first order approach to predicting future subsidence when the available data quantity or quality are insufficient as inut for analytical and/or numerical predictive methods. In many areas, there are land surface elevation change data that can be used to assess subsidence, even if they were not originally collected for that purpose.
Task 1.4 – Analysis of Aquifer Subsidence Potential
Data collected in Tasks 1.1 and 1.2 will be used to characterize the nature and extent of compressible materials in each major and minor aquifer.
The LRE Team will first evaluate each aquifer’s compressibility layer using indicators such as the occurrence of fine-grained lake bed or coastal sediments that are not fully consolidated. If available, we will review lithologic information from well logs and/or geophysical data (downhole, surface, or airborne) for additional indications of compressible materials. We will also evaluate geotechnical data on the presence and compressibility of fine-grained materials.
Another factor in considering subsidence risk is the predicted/expected amount of water-level declines. We will review the Desired Future Conditions (DFCs) and Modeled Available Groundwater (MAG) for each aquifer to catalog the expected amount of water-level decline in the Aquifer Subsidence Risk Matrix.
44
CONTENT ITEM 6: TECHNICAL APPROACH
The LRE Team will organize aquifer subsidence risk data in the GIS data management system, identify data gaps and recommend opportunities to fill them. The aquifer subsidence risk data will be compiled into a risk factor that can be applied consistently across all of the major and minor aquifers in Texas. This risk factor will be presented in map form and in the Aquifer Subsidence Risk Matrix.
We propose to provide the TWDB with an Interim Aquifer Subsidence Risk Assessment Technical Memorandum. This Memorandum would present the preliminary Aquifer Subsidence Risk Matrix and associated maps. We also propose to conduct a workshop with the TWDB and LRE Water Team to identify the aquifer subsidence risk factor and at-risk aquifers for mathematical tool development (Phase 2).
Subsidence prediction tools need to be selected appropriately given the amount and quality of data available. In order of complexity and reliability, the types of tools are generally characterized as empirical, analytical, and numerical. The LRE Water team has employed each method to predict subsidence potential in a variety of hydrogeologic conditions.
We will evaluate the data availability and quality to recommend the most appropriate subsidence prediction mathematical tool for each aquifer identified as at-risk to subsidence. These predictive tools will be produced in a way that integrate with TWDB GAMs, Desired Future Conditions (DFCs), and Modeled Available Groundwater (MAG) projects. When appropriate, integrated numerical methods will be recommended so that they can run within the GAMs. Otherwise, we will produce tools that can use GAM, DFC, and MAG results as inputs.
LRE TEAM EXPERIENCE
OUR TECHNICAL LEADER, DAVE COLVIN, PG, HAS EXTENSIVE
EXPERIENCE GAINED FROM AN ARIZONA STATEWIDE SUBSIDENCE EVALUATION. HIS WORK INCLUDED
AQUIFER SUBSIDENCE RISK ANALYSIS AND PREDICTIVE TOOL
DEVELOPMENT.
EMPIRICAL
ANALYTICAL
NUMERICAL
45
CONTENT ITEM 6: TECHNICAL APPROACH
Empirical Relationships
The LRE Water Team will examine the empirical relationships between various aquifer data and land subsidence. We will use the empirical relationships to generate calibration ranges to improve the accuracy of, and to test the reasonableness of, analytical and numerical predictive models.
The variables determined to be strongly correlated with subsidence and their regression functions could be used to predict future subsidence. These relationships will likely be aquifer-specific and not recommended for use in other aquifers. Empirical predictive tools will be useful in situations where subsidence data are available, but insufficient aquifer property data for analytical or numerical modeling. We will identify aquifers where empirical methods can be applied in the Aquifer Subsidence Risk Matrix.
Analytical Modeling
Analytical models are useful for evaluation of sensitive subsidence parameters and the range of total subsidence. They are appropriate for use in aquifers where subsidence data are unavailable or empirical relationships are not well defined. Subsidence is most often estimated analytically using some form of the Terzaghi equation, which relates stress (feet of water level decline), versus strain (i.e., compaction or subsidence).
LRE will evaluate several analytical models for appropriateness in predicting subsidence, including:
• Depth Porosity: Uses drawdown and compressible layer depth to predict subsidence.This model has limited application, because it relates depth to skeletal specific storagebased on published curves that are not appropriate in all geologic environments.
• Yamaguchi: Uses subsidence rate and drawdown data to predict ultimate subsidence.It is an improvement on empirical methods, but it can only be used in areas wheresubsidence has already been observed.
• Geertsma: Uses drawdown, layer thickness/depth, and geotechnical properties ofcompressible layers to predict subsidence. It requires site-specific geotechnical fielddata.
• Simple Skeletal Storage: Inputs include drawdown, layer thickness and inelasticskeletal specific storage. This is a relatively easy and accurate analytical approach butis highly dependent on inelastic skeletal specific storage, which is often unavailable ordifficult to estimate precisely.
When appropriate, we will recommend an analytical subsidence prediction method for those aquifers identified as at-risk to subsidence in the Aquifer Subsidence Risk Matrix.
We propose to produce an Excel®-based spreadsheet tool that includes a tab for each of the recommended analytical methods. It will be formatted to facilitate user input of location-specific aquifer property data and water-level data to make analytical subsidence predictions. The tool will clearly present the subsidence prediction results and any method-specific limitations or notes.
46
CONTENT ITEM 6: TECHNICAL APPROACH
Figure 6 - MODFLOW Model with Drawdown and SUB-WT Subsidence Predictions
MODFLOW Numerical Models
For the numerical methods of predicting subsidence, we will use the MODFLOW subsidence packages. These packages use the head output from groundwater flow models as input. Changes in water levels between layers create changes in effective stress that drives consolidation of clay layers in the numerical subsidence model.
Many of the major and minor aquifers across Texas have MODFLOW models (GAMs) currently available or under development. Using MODFLOW subsidence packages will facilitate integration of these models and will be familiar to modelers already using the GAMs.
There are three software packages for MODFLOW:
• Subsidence and Aquifer-System CompactionPackage (SUB-WT)
• Subsidence Package (SUB)
• Interbed Storage Package (IBS)
IBS has been superseded by the SUB-WT and SUB packages, and IBS is mostly used with older versions of MODFLOW.
Similar to the analytical models discussed above, the MODFLOW SUB-WT and SUB packages rely on the Terzaghi theory of one-dimensional consolidation to calculate subsidence. Both packages calculate elastic or inelastic consolidation when a preconsolidation stress (lowest historical water level) is surpassed. Using the SUB-WT and SUB packages provides more accurate subsidence predictions than empirical relationships or analytical methods, because MODFLOW packages consider complicated subsurface properties, boundary conditions, and spatial/temporal variability.
One-dimensional MODFLOW subsidence models can be constructed when there is limited subsidence related aquifer property data available across the domain of an existing flow model. They can also be useful where detailed lithology and water-level data are available at a single location. These models can give more accurate predictions than analytical methods. We will evaluate the
appropriateness of 1-D MODFLOW subsidence models. If recommended for any aquifer, we will produce a numerical tool that can be used with GAM head output and modified for specific aquifer conditions. Although SUB and SUB-WT subsidence calculations are based in the vertical dimension, our experience shows that use of these packages can impact the water balance and subsequent results of groundwater flow models. When possible, integration of subsidence modeling into a three-dimensional flow model should be considered, particularly if a flow model already exists.
47
CONTENT ITEM 6: TECHNICAL APPROACH
Table 2 - Comparison of MODFLOW SUB and SUB-WT Packages
Package Characteristic SUB Package SUB-WT PackageAssumes confined conditions XAssumes laterally extensive compressible layers XCalculates lagged compression of clay layers XCalculates reduced geostatic load due to dewatering XCalculates time variable skeletal-specific storage due to compression XCalculates compressible layer thickness reduction due to dewatering X
The SUB and SUB-WT packages are appropriate for different hydrogeologic conditions, as shown in Table 2. We will evaluate when a 3-D MODFLOW subsidence model is recommended and which subsidence package is most appropriate for specific aquifers in the Aquifer Subsidence Risk Matrix. While we do not anticipate updating any of the existing GAMs with subsidence packages as part of this project, we will provide guidance on doing so. If the budget and schedule allow, the LRE Team has the capability to update one or more GAMs with subsidence prediction capabilities.
Task 2.2 - Recommended Subsidence Monitoring
The LRE Water Team will recommend a subsidence monitoring approach for each aquifer identified to be at-risk. The methods included are described in Task 1.3 above and will be recommended based on the aquifer subsidence risk analysis and predictions.
Task 2.3 - Project Summary Report
The LRE Water Team will provide a project summary report describing the data compilation, stakeholder outreach, historical subsidence analysis, aquifer risk evaluation, documentation for the production of mathematical subsidence prediction tools, and the recommended subsidence monitoring approach. We will identify data sources, data gaps, and opportunities to collect additional subsidence-related data. The summary report will include subsidence risk maps and the Aquifer Subsidence Risk Matrix with each of the major and minor aquifers in Texas assigned a subsidence risk factor based on a consistent, statewide scale. Additional material includes an electronic delivery of mathematical subsidence prediction tools and an ESRI geodatabase that contains the compiled subsidence-related data and interpretations.
The subsidence prediction tools produced in this project will be described in the summary report so that future users will know where to obtain input data, how to implement the tools, and how results can be interpreted. We will detail simplifying assumptions, limitations, and opportunities to collect subsidence-related data. The TWDB will receive a draft report 90 days prior to the end of the contract. TWDB revisions will be incorporated into a final report delivered by the contract completion date.
Task 2.4 – Monthly Updates
We will provide the TWDB with monthly project update memos that include scope, schedule, budget, and other information detailed in our project management approach below.
48
CONTENT ITEM 6: TECHNICAL APPROACH
PROJECT MANAGEMENTChanges often occur during project execution, but a well-conceived plan and diligent monitoring enables proactive identification and resolution of issues. We use a combination of internal project management tools and best practices endorsed by the Project Management Institute (PMI). Although we maintain certain standards on all projects, our project management approach is customized to fit the needs and circumstances of your project.
For this effort, excellent and experienced project coordination will be of the utmost importance. Dr. Jordan Furnans, PE, PG will serve as project manager and primary point of contact, and will coordinate all team efforts and all meetings with TWDB and stakeholders. Dr. Furnans has experience managing large and diverse projects, including an ongoing 2-year, $315K project for the US Bureau of Reclamation and the Gulf Coast Water Authority. Throughout this project, Dr. Furnans will function much like a head coach, directing and managing all project efforts, yet letting this team of subject-matter experts undertake technical work under his direction.
Following PMI principles and TWDB project requirements, our team will develop and execute a “Project Management Plan (PMP)” for successful project completion. The PMP will be submitted to TWDB for review and approval early-on during the project, and is anticipated to contain the following components:
1. Scope of Work / Work Breakdown Structure (WBS)• Defined deliverables, assumptions, research items/tasks• Defines team member responsibilities for each task
2. Schedule Control• Baseline schedule in Gantt chart format• Update monthly & Report Progress monthly to TWDB (on the 10th of each month)• Scheduled in-person meetings between LRE & TWDB
3. Budget Control• Baseline budget and projected monthly cash flow• Track and monitor budget, by Task, on at least a monthly basis• Prepare an estimate to complete (ETC) at 50% spent stage and update monthly
4. Communication Plan (internal and external)• Project-specific communications plan for team members and with TWDB• Prepare minutes/summary of each meeting and distribute for review
5. Document and Data Management• Utilize Google Docs & Dropbox for internal collaboration and version control• Ensure all data meets TWDB meta-data requirements.
49
Final Report: Identification of the Vulnerability of the Major and Minor Aquifers of Texas to Subsidence with Regard to Groundwater Pumping – TWDB Contract Number 1648302062
Appendix 8 Draft Report: Identification of the Vulnerability of the Major and Minor Aquifers of Texas to Subsidence with
Regard to Groundwater Pumping Comments and Responses
General Comments
Overall the draft report is well written and very informative. There are a few specific comments listed below and several items mentioned in the Technical Approach do not seem to have been fully addressed (also discussed below).
1. According to the CONTRACT, Section II, Page 3 of 15, state that the final digital copywill comply with accessibility requirements and standards. Please update the digitalcopies to comply with alternate text requirements for all figures.
Alternate text added to all figures.
2. According to the CONTRACT, Exhibit D, Page 1 of 8, font should be Cambria. Pleasechange font to Cambria.
Done
3. According to the CONTRACT, Exhibit D, Page 1 of 8: First level headings should be 18point. Please make all first level headings 18 point.
Done
4. According to the CONTRACT, Exhibit D, Page 2 of 8: Please review Section 2.2 Figuresand photographs for graphic requirements.
All Figures revisited and corrected where necessary.
5. Please capitalize “Aquifer” everywhere in the report where it follows a major or minoraquifer name (for example: Dockum Aquifer).
Done
Final Report: Identification of the Vulnerability of the Major and Minor Aquifers of Texas to Subsidence with Regard to Groundwater Pumping – TWDB Contract Number 1648302062
Specific Comments for Draft Report
6. Section 1.0, page 1‐1, first paragraph, last line: Please delete the stray “o”, at the beginning of the line.
Done
7. Section 1.1, page 1‐1, second paragraph, last sentence; page 3‐4, last line on page; and Appendix 1: Please replace “lithographic” with “lithologic”.
Corrected
8. Section 2.0, page 2‐1, paragraph 3, last sentence: Please add “States” after United, it should be “…prone areas of the United States…”
Done
9. Section 2.0, page 2‐1, paragraph four, Brownwood, Texas should be the Brownwood Subdivision of Baytown, Texas (see reference of Galloway and others, 1999).
Corrected
10. Section 2.0, page 2‐1, paragraph 4, last sentence; please remove “an” before upscale, it should be “The once upscale…”
Corrected
11. Section 2.0, page 2‐2, paragraph three, correct the reference to Texas Water Code from §36.108 to §36.0015 (purpose of groundwater conservation districts).
Corrected
12. Section 3.0, page 3‐4, Figure 3.1: in addition to the citation in the text, please note in legend or caption the source of the data and the date downloaded.
Done
13. Section 3.2.2, page 3‐6, paragraph two, suggest replacing “of about 20 members” with “members”.
Revised
14. Section 3.4.1, page 3‐14, paragraph 4, sentence 4: Please add “to” in this phrase “…..due to an inability to effectively parse”
Corrected
Final Report: Identification of the Vulnerability of the Major and Minor Aquifers of Texas to Subsidence with Regard to Groundwater Pumping – TWDB Contract Number 1648302062
15. Section 4.1, pages 4‐1 to 4‐2: please consider expanding examples to include historical subsidence in the Gulf Coast Aquifer System outside the Subsidence Districts, such as 1.5 feet of subsidence in Jackson and Matagorda counties from 1943 to 1973 as documented in USGS Open File Report 80‐969 (Ratzlaff: https://pubs.er.usgs.gov/ publication/ofr80969 ), and from examples from TWDB Report 272, (http://www.twdb.texas.gov/publications/reports/numbered_reports/doc/R272/ Report272.asp)
Revised
16. Section 4.1, page 4‐1, second paragraph, sentence 1, and third paragraph, first sentence: “State” should be lowercase “state”.
Corrected
17. Section 4.2.1, page 4‐4: Figure 4.2 is not cited in text. Please provide a citation for Figure 4.2 in this section.
Done
18. Section 4.2.1, page 4‐7, Table 4.1: for the “Rock Type” for Calvert Bluff, please clarify if “Light fray to pale brown…” should read, “Light gray to pale brown…” and update text as applicable.
Corrected
19. Section 4.2.1, Page 4‐7, paragraph one, sentence two: Please consider revising “However, only a small portion of the recharge reaches the water table” to “However only a small portion of the infiltration reaches the water table”. Generally infiltration is not considered recharge until it reaches the water table.
21. Section 4.2.2, page 4‐19, paragraph one, sentence 4: “The general flow direction of water is from the recharge zone towards the unconfined zone”. Was the sentence supposed to be “…. towards the confined zone”? Please verify and revise if applicable.
Revised
Final Report: Identification of the Vulnerability of the Major and Minor Aquifers of Texas to Subsidence with Regard to Groundwater Pumping – TWDB Contract Number 1648302062
22. Section 4.2.3, page 4‐25, paragraph one, sentences five and six: please correct capitalization on “Limestone”, “Dolomite”, “Aquifer”, “South to North”, “North‐West” and “South‐East” to lowercase.
Corrected
23. Section 4.2.3, page 4‐26, paragraph one, sentence one: please correct “Carment” to “Carmen” and “Alena” to “Elena”.
Corrected
24. Section 4.2.3, page 4‐26, paragraph two, sentence one: please correct “Capitan Reef Complex and Rustler Aquifers” to “Capitan Reef Complex and Rustler aquifers”
26. Section 4.2.3, page4‐27, paragraph 3: Correct font size for citation of Anaya and Jones to match the rest of the text.
Done
27. Section 4.2.4, page 4‐36, paragraph 4: Please consider removing apostrophes in decade notations, for example that 1900’s will change to 1900s.
Done
28. Section 4.2.4, page 4‐38, paragraph 4: To make this explanation easier to understand, please include years in addition to the stress periods and time steps. Also, please explain on how the data were combined into one grid, this would add clarity, for the reason that each grid has a different orientation.
Added years.
Added a description regarding the combination of the MODFLOW results.
29. Section 4.2.4, pages 4‐32 to 4‐41: please update nomenclature of the Gulf Coast Aquifer to the Gulf Coast Aquifer System because of the sub‐aquifer units discussed.
Done
Final Report: Identification of the Vulnerability of the Major and Minor Aquifers of Texas to Subsidence with Regard to Groundwater Pumping – TWDB Contract Number 1648302062
30. Section 4.2.4, page 4‐33, paragraph three, last sentence: please note in the text that the Burkeville Confining Unit acts as the basal confining unit for the Evangeline and Chicot aquifers. In addition, the Burkeville is also a source of water where it is more sand rich near where it outcrops.
Noted
31. Section 4.2.4, Page4‐36, paragraph one, last sentence: Please update reference from Table 4‐4 to Table 4‐7 and please update caption for Table 4‐7 from “Edwards (BFZ) Aquifer” to “Gulf Coast Aquifer System”.
Corrected
32. Section 4.2.4, page 4‐38, paragraph two, sentence two: A space needed after “clays,” and before “silts” in first sentence.
Corrected
33. Section 4.2.5, page 4‐44, Figure 4.27: The index map indicates there is a cross‐section BB’, but this cross‐section is not shown in the figure.
Corrected
34. Section 4.2.5, pages 4‐44 and 4‐45, Figure 4.28: Please consider including information on pumping around Juarez, Mexico, because this pumping contributes to the lowering of water levels in the United States.
It is accurate that pumping outside Texas affects water levels in the aquifer. However, pumping outside of Texas is less well documented and cannot be managed through local GCDs. We limited our evaluations to the aquifer as defined by the TWDB and addressing potential subsidence impacts from pumping within New Mexico and Mexico were beyond the scope of this project.
35. Section 4.2.6, page 4‐50, Figure 4.32: An index map showing the location of this crosssection is not shown in this figure.
Added
36. Section 4.2.7, page 4‐55, paragraph one: Please revise “North‐West” to “north‐west” (two instances), and “South‐East” to “south‐east”. Note these three occurrences are not proper nouns.
Corrected throughout
37. Section 4.2.9, page 4‐74, first paragraph, third sentence: Please correct “dued” to “due”.
Corrected
Final Report: Identification of the Vulnerability of the Major and Minor Aquifers of Texas to Subsidence with Regard to Groundwater Pumping – TWDB Contract Number 1648302062
38. Section 4.3.1, page 4‐81, first paragraph, sentence four and page 4‐82, first and last paragraph: Please spell out all reference citations. For example, “LGA”, should be “LBGGuyton Associates”, matching the report references.
Updated throughout
39. Section 4.3.1, Groundwater Pumping, page 4‐83, paragraph one, sentence two: please clarify if “was” should be “has” and update the sentence for clarity.
Corrected
40. Section 4.3.2, page 4‐91, Figure 4.60: Please re‐examine the reported irrigation pumping for the Blossom Aquifer; this pumping may be from the Red River Alluvium and have been incorrectly assigned to the Blossom Aquifer.
We understand that the alluvial pumping may have been incorrectly assigned to the Blossom Aquifer. Data shown is unaltered from the TWDB historical pumping estimates.
41. Section 4.3.4, pages 4‐102 to 4‐103: Please correct by deleting “and” in this sentence to make it grammatically correct.
Corrected
42. Section 4.3.4, page 4‐105, second paragraph: The text discusses water level declines in southern Brazos County; please reference either Figure 4‐68 or Figure 4‐7, because you mention this location.
Added
43. Section 4.3.4, page 4‐106, Figure 4.70: Please add county names to this figure.
Added
44. Section 4.3.4, page 4‐107, Figure 4.71: Please add county names to this figure.
Added
45. Section 4.3.5, page 4‐108, Figure 4.72: Correct “Capitan Reef Complex aquifer” to “Capitan Reef Complex Aquifer” in figure caption.
Corrected
46. Section 4.3.5, page 4‐109 and Figure 4.73, page 4‐110: Please re‐visit this section, the text discusses various geologic units that underlie the Capitan Reef Complex Aquifer; however, Figure 4.73 does not list these units. Please update figure so that the text and figure are consistent.
Updated
Final Report: Identification of the Vulnerability of the Major and Minor Aquifers of Texas to Subsidence with Regard to Groundwater Pumping – TWDB Contract Number 1648302062
47. Section 4.3.5, page 4‐109, entire page: Please capitalize “Aquifer” everywhere on the page where it follows a major or minor aquifer name (for example: Dockum Aquifer).
51. Section 4.3.5, page 4‐109, paragraph two, sentence five: Because the Capitan Reef Complex Aquifer is exposed at land surface in the Glass Mountains (as indicated by the red areas on Figure 4.74) please reexamine the text that states “in the Glass Mountains, the Capitan Reef Complex is directly…”
Clarified
52. Section 4.3.5, page 4‐109, paragraph three, sentence five: correct spelling of “Deleware” to “Delaware”.
Corrected
53. Section 4.3.5, page 4‐109, paragraph five, sentence one: correct spelling of “Quarternary” to “Quaternary”.
Corrected
54. Section 4.3.5, page 4‐112, paragraph two, sentence 2: please correct spelling of “Boarder” to border”. Please also consider adding a figure that shows groundwater flow directions, the location of groundwater divides, and the location of the Pecos River to provide visual support of the text in this section.
Corrected
55. Sec. 4.3.5, p.4‐112, paragraph two: Please change capitalization of “South‐South‐East” and “North‐East” to “south‐south‐east” and “north‐east”
Corrected
Final Report: Identification of the Vulnerability of the Major and Minor Aquifers of Texas to Subsidence with Regard to Groundwater Pumping – TWDB Contract Number 1648302062
56. Section 4.3.5, page 4‐114: In the Subsidence Vulnerability section, please clarify whether the Capitan Reef Complex has a risk of subsidence due to dissolution of evaporate deposits in the surrounding area.
Clarified
57. Section 4.3.6, page 4‐121, paragraph 4, sentence 2: please clarify if “… the northern Ogallala tend to show a medium to high …” should read “… the northern Dockum tend to show a medium to high …”. Please review and update text as applicable.
Corrected
58. Section 4.3.8, page 4‐133, Table 4.29: please consider duplicating Table 4.32 (page 4141) here, because text in Section 4.3.8 discusses underlying Pre‐Cambrian units that are missing in Table 4.29
Done
59. Section 4.3.8, page 4‐134, Table 4.30: Please investigate to see if the GAM properties would be better than those from Bluntzer (1992).
No change to the values in the table was needed. Added the reference to the GAM conceptual model report.
60. Sections 4.3.8, 4.3.9, and 4.3.13, pages 4‐136, 4.‐144 and 4‐172, paragraph two (all three): please expand discussion in each section to include reasoning for just using the MAG run for GMA 9, because the aquifers are split between GMAs 7, 8, and 9.
Clarified
61. Section 4.3.10, page 4‐147, paragraph one, sentence one: please consider rephrasing this sentence because most of the West Texas Bolsons overlie the Igneous Aquifer.
Clarified
62. Section 4.3.10, paragraph one, page 4‐147, sentences one, two and three: Please capitalize “Aquifer”, when it refers to a singular major or minor aquifer name.
Corrected
Final Report: Identification of the Vulnerability of the Major and Minor Aquifers of Texas to Subsidence with Regard to Groundwater Pumping – TWDB Contract Number 1648302062
63. Section 4.3.11, page 4.55, Table 4.36: This table infers that the Lipan Aquifer is composed only of the Permian units above the Wichita Group. Please revise to the original from Lee, 1986, or the revised hydrostratigraphic column from Beach, J.A., Burton, S., and Kolarik, B., 2004, Groundwater availability model for the Lipan Aquifer in Texas: Contract report to the Texas Water Development Board, 246 p, Table 2.3.1 on page 2‐20. Both of these tables use aquifer names for the Permian units along with the Leona Aquifer.
Updated table
64. Section 4.3.11, page 4‐156, paragraph two, first sentence: Please clarify “…deduced by potentiometric surfaces through lateral introduction of water‐bearing units…” Please consider re‐writing this sentence.
Revised
65. Section 4.3.11, page 4‐158, Table 4.38: The value of aquifer lithology is listed as carbonate, and the 3rd quartile SRV is listed as 4; however, according to Table 3.4 carbonates have an SRV of 2. Also, clay layer thickness is listed as “0 feet”; however, according to Table 3 the SRV should be 1. In addition, text defines the clay as stiff; however, table lists the clay as hard. Please review table and consider changing descriptions if necessary to better match text above.
Corrected table
66. Section 4.3.12, page 4‐165, paragraph one: The text references Figure 4.108(which is for the Lipan Aquifer) please check to see if this should reference Figure 4.112 and update text as applicable.
Updated
67. Section 4.3.13, page 4‐169, and page 4‐170, Table 4.42: the text discusses the Ellenburger and other underlying geologic units; however, Table 4.42 does not list these units. Please consider referencing or repeating Table 4.32 since that has a more comprehensive stratigraphic column and agrees more with the text on page 4‐169.
Final Report: Identification of the Vulnerability of the Major and Minor Aquifers of Texas to Subsidence with Regard to Groundwater Pumping – TWDB Contract Number 1648302062
69. Section 4.3.14, Page 4‐176, Paragraph 2, Sentence 5 : States that the “Net sand thickness is greatest along the state line in eastern Bowie and Cass Counties.”, however according to Figure 4.118, the Nacatoch Aquifer is not present in Cass County. Please review and revise text as applicable.
71. Section 4.3.17, page 4‐196, paragraph one: Please correct the spelling of “Salide Formation” in two places to the “Salado Formation” and please update text as applicable.
Corrected
72. Section 4.3.17, page 4‐199, paragraph 2, sentence five: Table 4.46 is referenced in the text, should this reference Table 4.52 instead?
Corrected
73. Section 4.3.19, page 4‐209, paragraph three, sentence one: Please correct the spelling of “Presido” to “Presidio”.
Corrected
74. Section 4.3.21, page 4‐224, paragraph two, sentence six: This sentence mentions “Cook Formation”. In Table 4.60 and the discussion elsewhere in this section, the formation is called the “Cook Mountain Formation. Please update this text for consistency.
76. Section 4.3.21, page 4‐227, paragraph one, sentence two: Suggest that you rewrite this sentence from groundwater is known to be at the land surface” to read “potentiometric surface known to be near or at the land surface”.
Revised
Final Report: Identification of the Vulnerability of the Major and Minor Aquifers of Texas to Subsidence with Regard to Groundwater Pumping – TWDB Contract Number 1648302062
77. Section 4.3.21, page 4‐229, paragraph one and page 4‐231, Figure 4.154: The text states that the risk is medium low; however, the color distribution in the figure seems closer to medium to medium high (or more orange than blue). Please review the assessment and update if applicable.
Revised
78. Section 5, pages 5‐2 and 5‐3, Tables 5.1 and 5.2: Although, aquifer compressibility is listed in Tables 5.1 and 5.2, there is no mention or discussion of aquifer compressibility until Section 6.2.1. Please discuss aquifer compressibility and how it is related to clay compressibility either in Section 3.4.2 or Section 5. Also, units of clay compressibility listed in Table 3.3 are inverse pascals (Pa‐1) but other tables list compressibility in units of inverse psi (psi‐1). In Table 3.3 please also list the values in units of (psi‐1).
Corrected Table 3.3.
Aquifer compressibility is not used in subsidence evaluation. We removed the values that were not part of the subsidence evaluation from the tables in Section 5.
79. Section 5, page 5‐1, paragraph five, sentence three: Please correct the spelling of “Messilla” to “Mesilla”.
Corrected
80. Section 5, page 5‐6, Table 5.3: Please check spelling and correct as applicable in “Weighted Subsidence Risk Category” for “esxists” with “exists” and “significant” with “significant”.
Corrected
81. Section 5, page 5‐12, Figure 5.6: Please adjust the size of figure so that the x‐axis aquifer names are not truncated.
Corrected
82. Section 6, Subsidence Prediction: According to the CONTRACT, Exhibit A Technical Approach, Page 55, Fourth Paragraph, “LRE will evaluate several analytical models for appropriateness in predicting subsidence including: Depth porosity, Yamaguchi, Geertsma, Simple skeletal storage”. The evaluation of those methods was not discussed in the draft report. Please discuss the evaluation or explain why the evaluation was not completed.
Discussion and clarification added in Section 1.3 and Section 6.1 of the report.
Final Report: Identification of the Vulnerability of the Major and Minor Aquifers of Texas to Subsidence with Regard to Groundwater Pumping – TWDB Contract Number 1648302062
83. Section 6.1, page 6‐2, paragraph one: suggest removing “that are provided in Appendix 7”. See Comment on Appendix 7 below.
Revised Appendix
84. Section 6.1, Page 6‐2, Line 5: Referring to the formula for geostatic stress, the variable, ds, is defined as the “depth below land surface to the zone of interest in the saturated zone”. Should this be the “depth below the water table to the zone of interest in the saturated zone” instead? Please verify and correct the definition if applicable.
Corrected
85. Section 6.1, pages 6‐1 through 6‐3: Please number the individual equations listed on these pages and then in Section 6.2, include this equation number used for the subsidence calculations in the prediction screening tool, to indicate the equations used.
Equation numbers added and referenced
86. Section 7.2.2, page 7‐5, paragraph four, first sentence: change “state of Texas” to “State of Texas”
88. Section 8.1, Page 8‐1, Paragraph 2, Sentence 2:”…financial costs or human implications if subsidence where to occur.” Please replace where with were.
91. Section 10: If there is more than one reference for an author per year, please identify them as a, b, or c., for example, Shi, 2017a, Shi, 2017b; Wade, 2017a, Wade, 2017b; and Oliver, 2011a, Oliver 2011b.
Corrected
Final Report: Identification of the Vulnerability of the Major and Minor Aquifers of Texas to Subsidence with Regard to Groundwater Pumping – TWDB Contract Number 1648302062
92. Section 10, page 10‐13, reference four: Please correct second reference for Shi andothers (2017) and remove “(.”
Corrected
93. Appendix 1: Please remove the contact information from the summary stakeholderand outreach table; these columns should be removed: Contact First Name, ContactLast Name, Email Address, and Phone Number.
Done
94. Appendix 4: Redact any names of groundwater conservation district staff if listed inthe referenced emails.
Done
95. Appendix 5: This appendix can be deleted. It is important to remove the stakeholderlist with the regional water planning group chairs; this is not required by theCONTRACT and should be removed for security/privacy reasons.
Done
96. Appendix 7: Remove this appendix and see reference to section 6, p. 6‐2. Thisrecommended change is to prevent including copyrighted material in the final report.An alternative is to list the pertinent equations in Appendix 7.
Revised Appendix
97. According to the CONTRACT, Exhibit A Technical Approach, page 52, paragraph 1:“The data types we will consider for this project include geotechnical,downhole/surface/airborne geophysics, remote sensing, and well logs.” Were all ofthese data sources used? If so please discuss, if not please discuss why they were notused.
We added clarifying text in Section 3.1.
Final Report: Identification of the Vulnerability of the Major and Minor Aquifers of Texas to Subsidence with Regard to Groundwater Pumping – TWDB Contract Number 1648302062
98. According to the CONTRACT, Exhibit A Technical Approach, page 53, paragraph 3: “Ifavailable we will review lithologic information from well logs and/or geophysical datafor additional indications of compressible materials. We will also evaluategeotechnical data on the presence and compressibility of fine‐grained materials.” Wasgeophysical or geotechnical data reviewed for the analysis? If so please discuss, if notplease discuss why this data was not reviewed.
We did not obtain geophysical or geotechnical data during our stakeholder outreach.We did not use geophysical data because we focused on lithologic logs for characterizingthe depth and thickness of compressible layers. Since we did not obtain site-specificgeotechnical data, we applied general geotechnical properties to subsurface materialsdescribed in lithologic logs. We added clarifying text in Section 3.1.
99. According to the CONTRACT, Exhibit A, Technical Approach, page 56, paragraph 4:“We will evaluate the appropriateness of 1‐D MODFLOW subsidence models.” Wasthis evaluation completed? If so please document. If not, please discuss why this wasnot done.
We considered the use of 1-D MODFLOW subsidence models and used the calculationsfrom MODFLOW subsidence packages in our Subsidence Prediction Screening Tool.Clarifying language has been added to Sections 1.3 and 6.1.
100. According to the CONTRACT, Exhibit A, page 57, paragraph 1: “We will evaluate when a 3‐D MODFLOW subsidence model is recommended and which subsidence package is most appropriate for specific aquifers in the Aquifer Subsidence Risk Matrix” Section6.3 of the model report provides a very general discussion of implementing subsidence in MODFLOW; however, there is not a detailed discussion for specific at‐risk‐aquifers. Please either include that discussion or include an explanation in the text about why this was not done.
Discussion added to Section 6.3
Specific Comments for Subsidence Tool
101. Subsidence_Prediction_Tool.xlsb, screening tool application, General Aquifer Calculations worksheet: Predominant Aquifer Lithology and Predominant Aquifer Clay Type boxes are shaded as orange for calculated values; however, these worksheet cells have only text and not formula references. Please review this worksheet and verify that the shading is correct for all cells. If not please update. (Note review completed with Excel 2010).
Corrected to reflect user selection of variables.
Final Report: Identification of the Vulnerability of the Major and Minor Aquifers of Texas to Subsidence with Regard to Groundwater Pumping – TWDB Contract Number 1648302062
102. According to the CONTRACT, Exhibit A Technical Approach, Page 55, Last Paragraph:"We propose to produce an Excel‐based spreadsheet tool that includes a tab for each recommended (subsidence) method.” The subsidence tool seems to include only one method to estimate subsidence (final equation of page 6‐4; Leake and Galloway, 2007). Is that one of the proposed methods? Please discuss why other methods were not evaluated or considered if they were not.
We considered several subsidence prediction methods including Depth porosity, Yamaguchi, Geertsma, and Simple skeletal storage. We also considered the use of one dimensional MODFLOW models with subsidence packages. Ultimately, we selected the skeletal storage method implemented in the MODFLOW SUB-WT package because the results are more precise, make better use of the data types available, have input variables that can be improved through data collection, and will be more consistent with GAMs that might be updated with MODFLOW subsidence packages. Discussion and clarification added in Section 1.3 and Section 6.1 of the report.
103. According to the CONTRACT, Exhibit B Scope of Work, Page 2, Item D. Documentation and Deliverables: d. “If tools are provided as standalone deliverables, a manual noting construction and directions for use shall be submitted along with the tools.” Please provide a manual for use with the Excel Subsidence Tool which is more detailed than the readme file. Include information on which version of Excel should be used in this manual.
Manual prepared
104. Correct the spelling for “Aquifer Storage Coefficent” to “Aquifer Storage Coefficient”.
Corrected
Specific Comments for Geodatabases
105. Blaine DEM: Please clip to aquifer area and note in metadata the resolution of this DEM, for example 30 meter.
Geodatabase updated
106. Brazos River Alluvium gdb: Please remove all feature data sets not related to this project.
Geodatabase updated
107. CapitanReef_Complex gdb: Please remove all feature data sets not related to this project.
Geodatabase updated
Final Report: Identification of the Vulnerability of the Major and Minor Aquifers of Texas to Subsidence with Regard to Groundwater Pumping – TWDB Contract Number 1648302062
108. Dockum gdb: Please verify whether all feature sets are related to this project and remove those that are not.
Geodatabase updated
109. EdwardsTrinity_HighPlains gdb: Please verify whether all feature sets are related to this project and remove those that are not, for example MasterPumpingWells table.
Geodatabase updated
110. EdwardsTrinity_Plateau gdb: Please verify whether all feature sets are related to this project and remove those that are not, for example et_springs.
Geodatabase updated
111. Ellenburger_SanSaba gdb: Please verify whether all feature sets are related to this project and remove those that are not, for example RechargeGrids.
Geodatabase updated
112. GulfCoast gdb: Please verify whether all feature sets are related to this project and remove those that are not. A lot of these datasets seemed to be data for model development and not directly related to the subsidence project.
Geodatabase updated
113. Hickory gdb: Please verify whether all feature sets are related to this project and remove those that are not, for example Target_wells and RechargeGrids.
Geodatabase updated
114. Mapping gdb: Please add metadata or remove this dataset. It is not clear what it is for.
Geodatabase updated
115. MarbleFalls gdb: Please verify whether all feature sets are related to this project and remove those that are not, for example Target_wells and RechargeGrids.
Geodatabase updated
116. Nacatoch gdb: Please verify whether all feature sets are related to this project and remove those that are not, for example pumping tables and RechargeGrids.
Geodatabase updated
Final Report: Identification of the Vulnerability of the Major and Minor Aquifers of Texas to Subsidence with Regard to Groundwater Pumping – TWDB Contract Number 1648302062
117. Ogallala gdb: Please verify whether all feature sets are related to this project and remove those that are not, for example pumping tables, recharge data, springs data.
Geodatabase updated
118. PecosValley gdb: Please verify whether all feature sets are related to this project and remove those that are not, for example Geology Grids are for development of the High Plains Aquifer model.
Geodatabase updated
119. Rustler gdb: Please verify whether all feature sets are related to this project and remove those that are not, for example pumping tables, and recharge data.
Geodatabase updated
120. Seymour gdb: Please verify whether all feature sets are related to this project and remove those that are not, for example pumping tables, evaporation data, and recharge data.
Geodatabase updated
121. Trinity gdb: Please verify whether all feature sets are related to this project and remove those that are not, for example pumping tables, and recharge data.
Geodatabase updated
122. WestTexasBolsons gdb: Please verify whether all feature sets are related to this project and remove those that are not, for example pumping tables, and recharge data.
Geodatabase updated
123. Woodbine gdb: Please verify whether all feature sets are related to this project and remove those that are not, for example pumping tables, and recharge data.
Geodatabase updated
124. YeguaJackson gdb: Please verify whether all feature sets are related to this project and remove those that are not, for example pumping tables, and recharge data.
Geodatabase updated
Final Report: Identification of the Vulnerability of the Major and Minor Aquifers of Texas to Subsidence with Regard to Groundwater Pumping – TWDB Contract Number 1648302062
125. The map files provided have broken links to data. Suggest making all of the ArcGIS ArcMap Document (.mxd) files with relative instead of absolute paths to make these files usable.
Relative file paths and folder structure updated. All ArcMap Document (.mxd) files saved using ArcGIS Desktop 10.5.