Identification, Selection, and Appraisal within the North Carolina Geospatial Data Archiving Project (NCGDAP) NCSU Libraries Steve Morris Head of Digital Library Initiatives Digital Preservation in State Government: Best Practices Exchange 2006
Transcript
Identification, Selection, and Appraisal within the North Carolina Geospatial Data Archiving Project (NCGDAP)
NCSU Libraries
Steve Morris Head of Digital Library Initiatives
Digital Preservation in State Government: Best Practices Exchange 2006
Note: Percentages based on the actual number of respondents to each question 2
NC Geospatial Data Archiving Project
Partnership between university library (NCSU) and state agency (NCCGIA), with Library of Congress under the National Digital Information Infrastructure and Preservation Program (NDIIPP)One of 8 initial NDIIPP partnerships (only state project)Focus on state and local geospatial content in North Carolina (state demonstration)Tied to NC OneMap initiative, which provides for seamless access to data, metadata, and inventoriesObjective: engage existing state/federal geospatial data infrastructures in preservation
Note: Percentages based on the actual number of respondents to each question 3
Targeted Content: Vector Data
Note: Percentages based on the actual number of respondents to each question 4
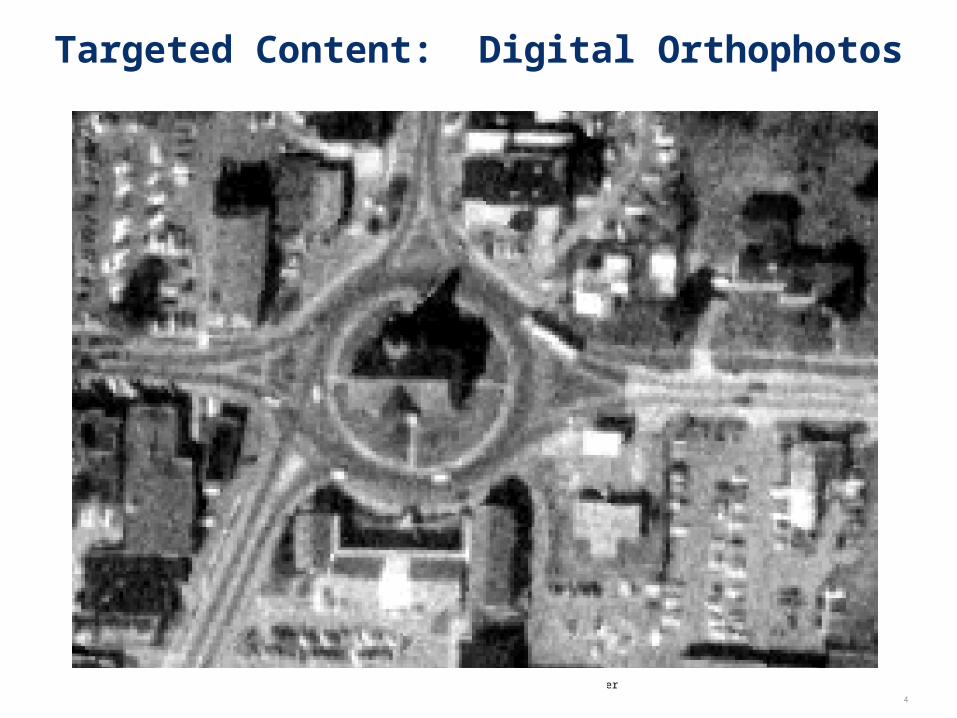
Targeted Content: Digital Orthophotos
Note: Percentages based on the actual number of respondents to each question 5
Targeted Content: Digital Orthophotos
Note: Percentages based on the actual number of respondents to each question 6
Targeted Content: Digital Orthophotos
Note: Percentages based on the actual number of respondents to each question 7
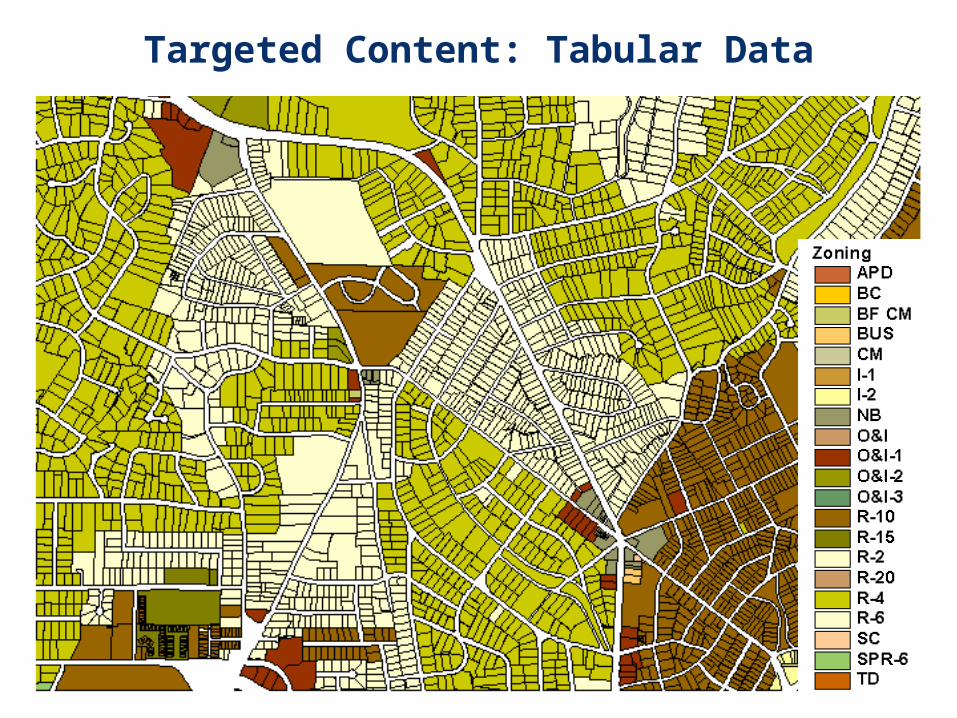
Targeted Content: Tabular Data
Note: Percentages based on the actual number of respondents to each question 8
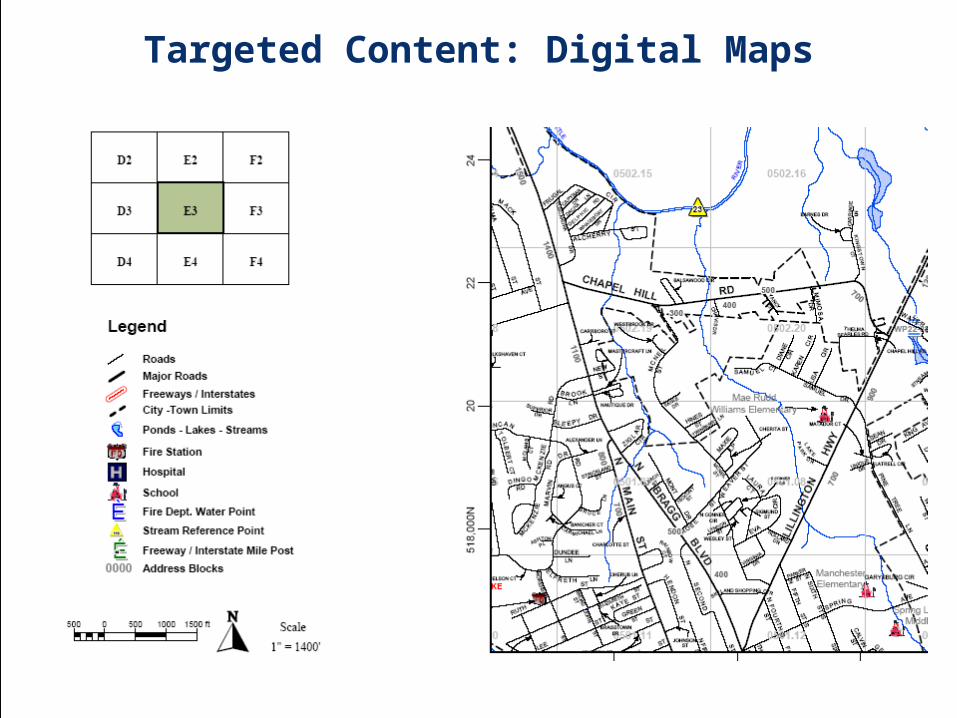
Targeted Content: Digital Maps
Note: Percentages based on the actual number of respondents to each question 9
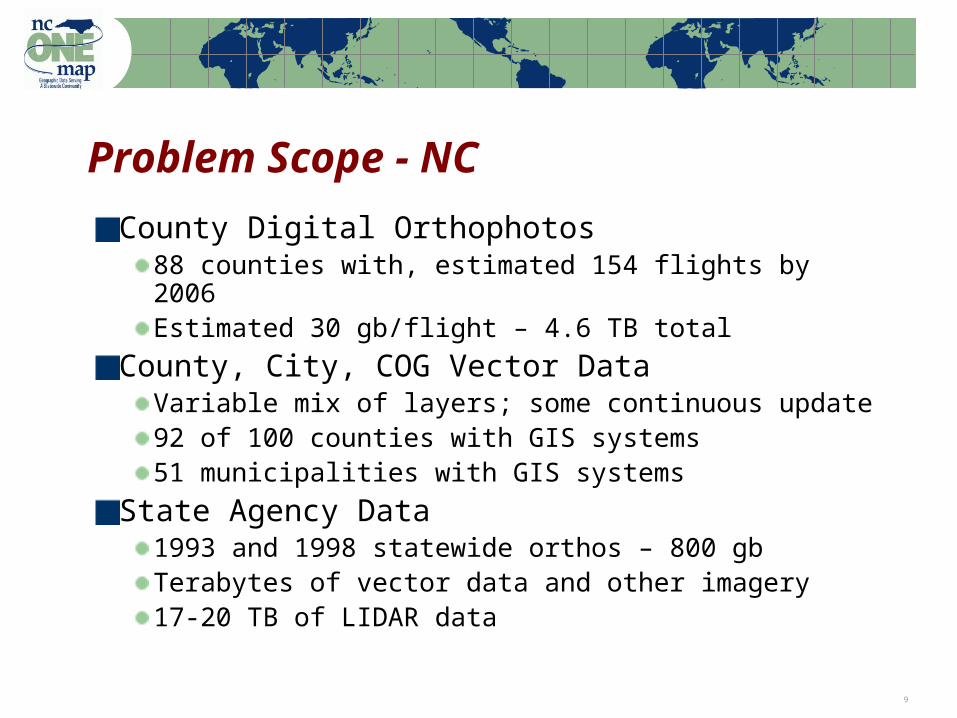
Problem Scope - NC
County Digital Orthophotos88 counties with, estimated 154 flights by 2006Estimated 30 gb/flight – 4.6 TB total
County, City, COG Vector DataVariable mix of layers; some continuous update92 of 100 counties with GIS systems51 municipalities with GIS systems
State Agency Data1993 and 1998 statewide orthos – 800 gbTerabytes of vector data and other imagery17-20 TB of LIDAR data
Note: Percentages based on the actual number of respondents to each question 10
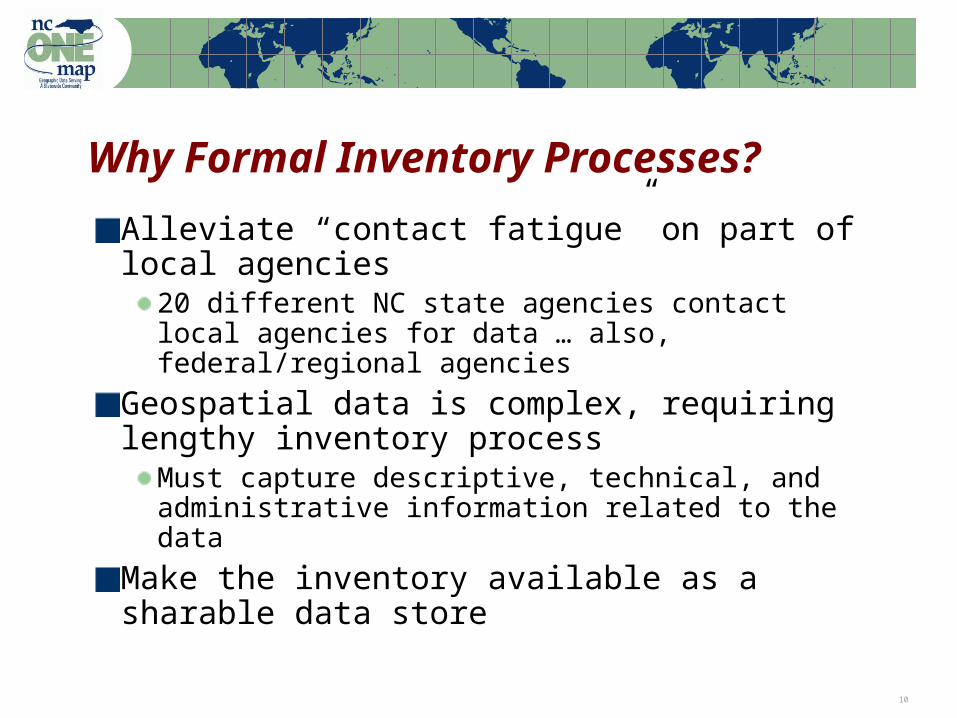
Why Formal Inventory Processes?
Alleviate “contact fatigue” on part of local agencies
20 different NC state agencies contact local agencies for data … also, federal/regional agencies
Geospatial data is complex, requiring lengthy inventory process
Must capture descriptive, technical, and administrative information related to the data
Make the inventory available as a sharable data store
Note: Percentages based on the actual number of respondents to each question 11
History of GIS Inventories (NC & US)
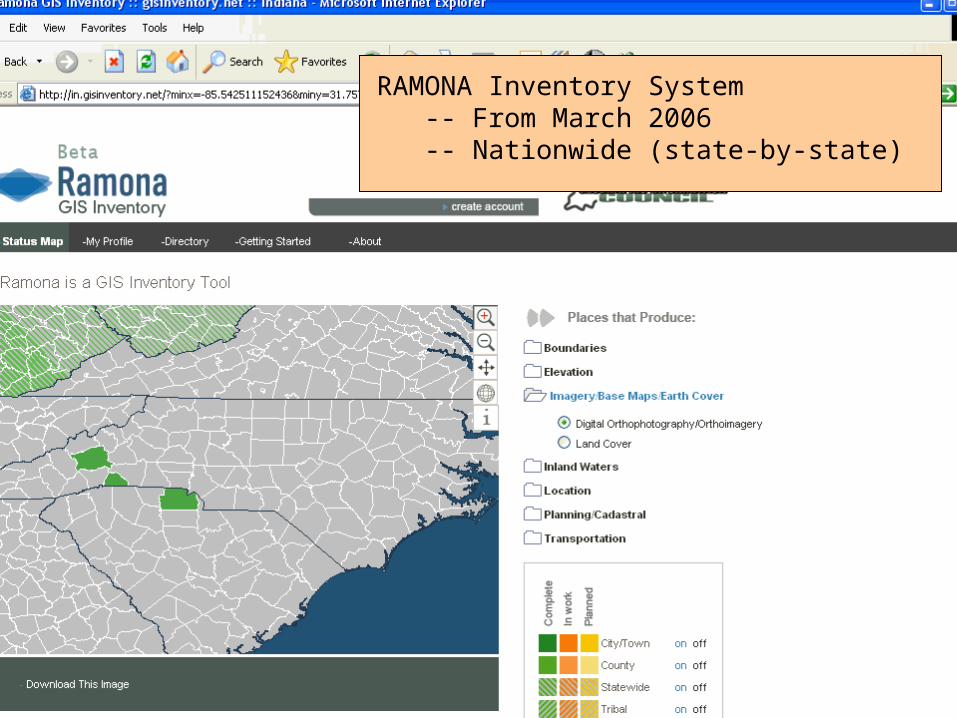
1997 National Geospatial Data Framework Survey 1997 Survey of GIS Data Availability for NC CountiesNC Flood Mapping Program, 2000-2001NC OneMap Data Inventory, 2003RAMONA (Random Access Metadata Tool for Online National Assessment), from March 2006
Note: Percentages based on the actual number of respondents to each question 12
RAMONA Inventory System-- From March 2006-- Nationwide (state-by-state)
Note: Percentages based on the actual number of respondents to each question 13
What do Inventories Offer?
Data Availability InformationDetailed information by data layer
Contact InformationMinimal Metadata
Descriptive, technical, administrative
Rights InformationDocument Technical Environment
Software used, formats, transfer methods
Future Data Development Plans
Note: Percentages based on the actual number of respondents to each question 14
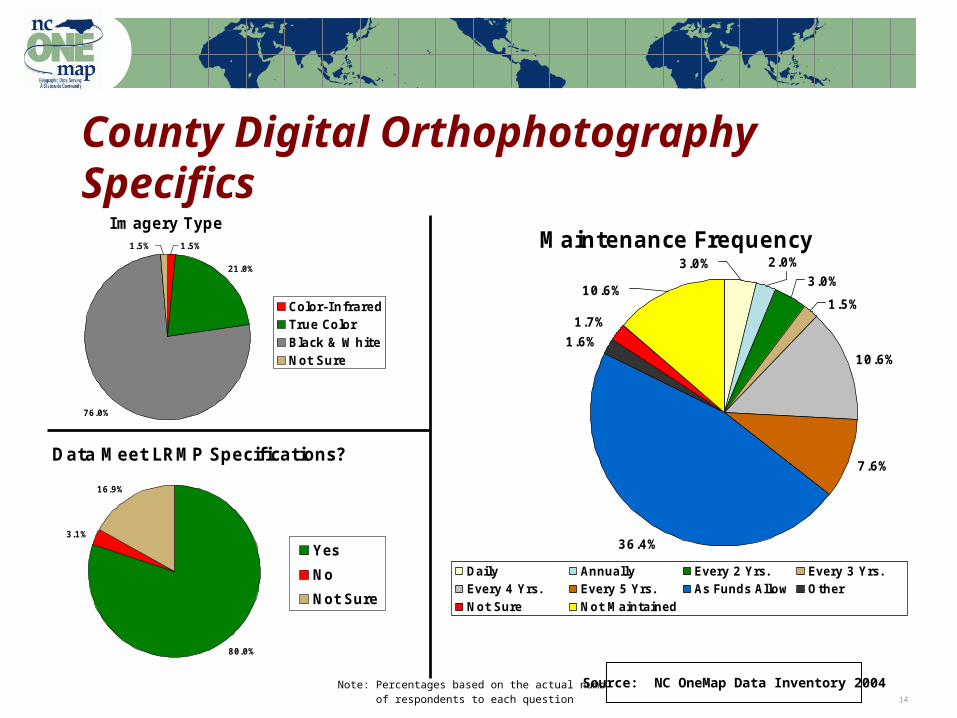
County Digital Orthophotography Specifics
Imagery Type
21.0%
76.0%
1.5% 1.5%
Color-InfraredTrue ColorBlack & WhiteNot Sure
Maintenance Frequency
3.0%
1.5%
10.6%
7.6%
1.6%
36.4%
2.0%3.0%
10.6%
1.7%
Daily Annually Every 2 Yrs. Every 3 Yrs.Every 4 Yrs. Every 5 Yrs. As Funds Allow OtherNot Sure Not Maintained
Data Meet LRMP Specifications?
80.0%
3.1%
16.9%
Yes
No
Not Sure
Source: NC OneMap Data Inventory 2004
Note: Percentages based on the actual number of respondents to each question 15
Inventories as Source of MetadataExample: Surface Water
Stream Name Stream ClassStream Order Stream TypeOther Not SureNone
Note: Percentages based on the actual number of respondents to each question 16
Inventories as Archive Items
Data inventories as archive items:e.g., 1997 federal survey data no longer available on FGDC website
Note: Percentages based on the actual number of respondents to each question 17
Selection Issues
Targeting data produced within the stateMost content is already at risk
Exceptions: LIDAR, county-level numeric, …
Early-Middle-Late Stage issuesMiddle stage is usually the “sweet spot”, e.g. TIFF orthophotos vs. raw images or compressed images
Also added-value products: digital maps, cartographic representation
Digital maps: extent of coverage and propensity for use in GIS factored into selection
Frequency
Note: Percentages based on the actual number of respondents to each question 18
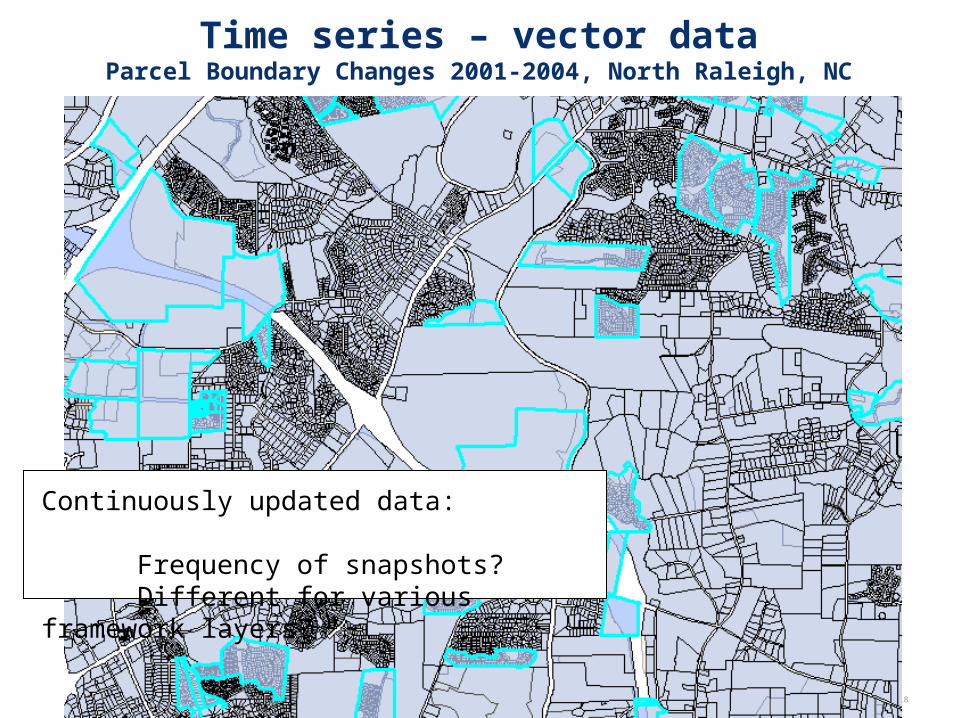
Time series – vector dataParcel Boundary Changes 2001-2004, North Raleigh, NC
Continuously updated data: Frequency of snapshots?Different for various framework
layers?
Note: Percentages based on the actual number of respondents to each question 19
Problem:Multiple choice for: format type, coordinate system, tiling scheme
Note: Percentages based on the actual number of respondents to each question 20
Conclusion
Formal inventory processes of spatial data infrastructure help with identifying contentInventories provide data for preservation analysis (format trends, etc.)Need to select from among different formats, coordinate systems, etc.Frequency of capture for time-versioned content is a tricky issue
Note: Percentages based on the actual number of respondents to each question 21