32
Identify the opportunities provided by developments in earth observation and remote sensing for national scale monitoring of soil quality

Identify the opportunities
provided by developments in
earth observation and remote
sensing for national scale
monitoring of soil quality


BRITISH GEOLOGICAL SURVEY
Bibliographical reference
NICOLE ARCHER ,
BARRY RAWLINS,
STEPHEN GREBBY,
BEN MARCHANT
AND BRIDGET
EMMETT. 2014.
Identify the
opportunities provided
by developments in
earth observation and
remote sensing for
national scale
monitoring of soil
quality. British
Geological Survey
Internal Report,
SP1316_C. 32pp.
Identify the opportunities provided by
developments in earth observation and
remote sensing for national scale
monitoring of soil quality
Nicole Archer 1 , Barry Rawlins 1, Stephen Grebby 1, Ben
Marchant 1 and Bridget Emmett 2
1 British Geological Survey, NERC, UK
2 Centre or Ecology and Hydrology, NERC, UK
Keyworth, Nottingham British Geological Survey 2014

i
Foreword
This report was commissioned by the Department for Environment, Food and Rural Affairs
(Defra) under project reference SP1316 sub-project C. The report was largely prepared by staff
from the British Geological Survey (BGS; NERC), with contributions from the Centre for
Ecology and Hydrology (CEH) and ADAS.
Acknowledgements
The authors would like to thank Brendan Roth, Judith Stuart, Luke Spadavecchia (Defra) and
Matthew Shepherd (Natural England) and Richard Turner (UK Space Agency) for helpful
suggestions in preparing the report.
Glossary DEM – digital elevtion model of the landscape
EO - Earth Observation using sensors above the ground surface
InSAR – Interferometric synthetic aperture radar – a type of radar-based remote sensing
IsBAS – a processing technique, called intermittent small baseline subset, applied to InSAR data
MIR – mid infra-red referring to the wavelengths of light between 2.5 and 25 microns
RS - remote sensing
SAR – synthetic aperture radar – a radar-based technique used in remote sensing
SLED - soil Euclidean distance; a method for computing a soil property index from remotely
sensed images
UAV – un-manned aerial vehicle
VNIR - visible and near infra-red reflectance spectra which is a measurement of reflected light at
different wavelengths from surfaces – in this case soil. The range of VNIR wavelengths is 0.35
to 2.5 microns.

ii
Contents
1 Introduction ............................................................................................................................ 6
1.1 Background ..................................................................................................................... 6
1.2 Sensor platforms ............................................................................................................. 7
1.3 The challenges of remote sensing of soil properties....................................................... 8
1.4 Measuring state and change of soil indicators ................................................................ 9
1.5 National scale soil monitoring and incoporation of remote methods ........................... 10
2 Methodology ......................................................................................................................... 11
2.1 Published Literature search .......................................................................................... 11
2.2 Internet search ............................................................................................................... 12
2.3 Global expert survey ..................................................................................................... 12
2.4 Structuring and assimilation of information ................................................................. 13
3 Results and their interpretation .......................................................................................... 13
3.1 Tagged database summary ............................................................................................ 14
3.2 Soil organic carbon (SOC) and Total nitrogen (N) ...................................................... 15
3.3 Bulk density and compaction ....................................................................................... 18
3.4 Soil depth and soil erosion............................................................................................ 18
3.5 Metals ........................................................................................................................... 20
3.6 Extractable nutrients ..................................................................................................... 20
3.7 Olsen P, extractable Mg, extractable K ........................................................................ 20
3.8 Soil pH .......................................................................................................................... 22
3.9 Summary ....................................................................................................................... 23
References .................................................................................................................................... 25
Appendix 1 Published literature search criteria ................................................................ 26
Appendix 2 Expert survey questions ................................................................................... 28
FIGURES
Figure 1 Summary of the approach used in this review study - Flow diagram of the literature
review process to create a database of relevant literature and information (OUTPUT 1),
which was then used to write OUTPUT 2: a review report of the most relevant findings of
remote sensing and soil physical properties. .......................................................................... 11
Figure 2 The number of soil monitoring and remote sensing studies which refer to or utilise the
specified a) soil indicators, and b) sensors/platforms (based on a total of 185 references
selected from peer-reviewed published literature) ................................................................. 14
TABLES
Table 1 Summary of most promising remote sensing techniques for a range of soil indicators .. 24

iii

iv
Summary
Defra wish to establish to what extent national-scale soil monitoring (both state and change) of a
series of soil indicators might be undertaken by the application of remote sensing methods.
Current soil monitoring activities rely on the field-based collection and laboratory analysis of
soil samples from across the landscape according to different sampling designs. The use of
remote sensing offers the potential to encompass a larger proportion of the landscape, but the
signal detected by the remote sensor has to be converted into a meaningful soil measurement
which may have considerable uncertainty associated with it. The eleven soil indicators which
were considered in this report are pH, organic carbon, bulk density, phosphorus (Olsen P),
nitrogen (total N), magnesium (extractable), potassium (extractable), copper (aqua regia
extractable), cadmium (aqua regia extractable), zinc (aqua regia extractable) and nickel
(aqua regia extractable). However, we also comment on the potential use of remote sensing for
monitoring of soil depth and (in particular) peat depth, plus soil erosion and compaction.
In assessing the potential of remote sensing methods for soil monitoring of state and change, we
addressed the following questions:
1. When will these be ready for use and what level of further development is required?
2. Could remote sensing of any of these indicators replace and/or complement traditional
field based national scale soil monitoring?
3. Can meaningful measures of change be derived?
4. How could remote soil monitoring of individual indicators be incorporated into national
scale soil monitoring schemes?
To address these questions, we undertook a comprehensive literature and internet search and also
wrote to a range of international experts in remote sensing. It is important to note that the
monitoring of the status of soil indicators, and the monitoring of their change, are two quite
different challenges; they are different variables and their variability is likely to differ. There are
particular challenges to the application of remote sensing of soil in northern temperate regions
(such as England and Wales), including the presence of year-round vegetation cover which
means that soil spectral reflectance cannot be captured by airborne or satellite observations, and
long-periods of cloud cover which limits the application of satellite-based spectroscopy.
We summarise the potential for each of the indicators, grouped where appropriate. Unless
otherwise stated, the remote sensing methods would need to be combined with ground-based
sampling and analysis to make a contribution to detection of state or change in soil indicators.
Soil metals (copper (Cu), cadmium (Cd), zinc (Zn), nickel (Ni)): there is no technical basis
for applying current remote sensing approaches to monitor either state or change of these
indicators and there are no published studies which have shown how this might be achieved.
Soil nutrients: the most promising remote sensing technique to improve estimates of the status
of extractable potassium (K) is the collection and application of airborne radiometric survey
(detection of gamma radiation by low-flying aircraft) but this should be investigated further.
This is unlikely to assist in monitoring change. Based on published literature, it may be possible
to enhance mapping the state of extractable magnesium (Mg), but not to monitor change, using
hyperspectral (satellite or airborne) remote sensing in cultivated areas. This needs to be
investigated further. There are no current remote sensing methods for detecting state or change
of Olsen (extractable) phosphorus (P).
Organic carbon and total nitrogen: Based on published literature, it may be possible to
enhance mapping the state of organic carbon and total nitrogen (but not to monitor change),
using hyperspectral (satellite or airborne) remote sensing in cultivated areas only. In applying
this approach the satellite data are applied using a statistical model which is trained using
ground-based sampling and analysis of soil.

v
Soil pH: Based on published literature, it may be possible to enhance mapping the state of soil
pH (but not to monitor change), using hyperspectral (satellite or airborne) remote sensing in
cultivated areas only. In applying this approach the satellite data are applied using a statistical
model which is trained using ground-based sampling and analysis of soil.
Soil (peat) depth, erosion and compaction: based on some recent research, it may be possible
using a new processing technique for InSAR (interferometric synthetic aperture radar) satellite
data to monitor the change in surface elevation of peat soils (and overlying vegetation) as a
proxy for change in depth. Further research is required to determine whether this approach could
be applied to other (non-peat) soils. This approach is based on radar reflection from the Earth’s
surface and it cannot be used to quantify soil depth (status). However, this approach does not
require field-based measurement of elevation to ground-truth the remotely sensed data. This
technique can detect changes in surface elevation of as little as 1 millimetre over areas as small
as one hundred square metres, so it may be possible to use it to monitor soil erosion in cultivated
areas. This approach needs to be tested further and applied over large scales. Soil compaction
also leads to small reductions in soil surface elevation so it may also be possible to detect
compaction-induced changes through remote monitoring. Monitoring based on application of
InSAR data needs thorough testing.
Bulk density: there are currently no remote sensing technologies which can contribute to
improving measurement of status or change of soil bulk density.

6
1 Introduction
1.1 BACKGROUND
Defra last reviewed the opportunities for using remote sensing1 (RS) to monitor soils in 2004
(Wood et al., 2004). This found, for the most part, that remote sensing could be used to monitor
soil quantity and extent, but had only limited usefulness for those indicators that relate to soil
condition (quality). Since then remote sensors have developed significantly and there have been
a number of studies examining the potential use of remote sensing to measure the concentration
of soil organic carbon across the landscape, and also possibly to monitor it. Given the high costs
associated with soil monitoring, Defra wish to understand what the current opportunities to
monitor soils remotely are, and what the potential is for remote monitoring to replace traditional
field monitoring across England and Wales.
The UK Soil Indicators Consortium (UKSIC) identified the following eleven indicators for
inclusion in national scale soil monitoring: pH, organic carbon, bulk density, phosphorus
(Olsen P), nitrogen (total N), magnesium (extractable), potassium (extractable), copper
(aqua regia extractable), cadmium (aqua regia extractable), zinc (aqua regia extractable)
and nickel (aqua regia extractable). Since the UKSIC report (Black et al., 2008), soil depth
and, in particular, peat depth has been identified as an important requirement for soil
monitoring. There is also interest in the monitoring of soil erosion and compaction. However,
we are not explicitly considering soil erosion monitoring, as a pilot project to establish a soil
erosion network for England and Wales is currently underway. Combining the two sets of soil
indicators above gives a total of fourteen that we consider in this report.
Soil monitoring activity is still at a relatively early stage of development. Optimal approaches to
measuring state and change in soil may be quite different. The spatial variation of change in soil
properties should determine the resampling strategy for monitoring, and this may be quite
different from the baseline variation of that property’s state (Lark et al., 2006). There are many
examples of using remotely sensed data as covariates for reducing the uncertainty in predictions
of soil properties such as organic carbon in combination with traditional, ground-based
measurements (Rawlins et al., 2009). However, this, and other exploitation of remote sensor
data depends on statistical correlations between the remotely sensed measurement and the soil
property of interest. Such a correlation may have a direct physical basis (e.g. if the soil property
directly influences the radiative properties of the land surface), but may also arise through
secondary relationships (e.g. soil organic carbon may be correlated with clay content, which in
turn affects soil water content and so the radiometric measurement). When we are concerned
with measuring changes in the soil, a remote sensor variable that proves useful for predicting
landscape-scale variation of baseline values may prove rather less useful, if its value in the
former context is due to correlations with indirect rather than direct physical effects on the
radiometric properties of the landscape. Our review of technologies therefore considers evidence
for the relative importance of direct physical effects and indirect relationships in determining
correlations of predictive value.
The aims of this report are to address the following questions:
1. What are the current and potential future opportunities to monitor any of the listed set of
indicators using remote sensing? Defra wish to understand the potential to monitor both
state and change. 2. When will these be ready for use and what level of further development is required?
1 For the purpose of this study we consider remote sensing (RS) and earth observation [in relation to soil
monitoring] to encompass airborne and spaceborne (satellite) sensor technologies (by means of propagated signals
such as electromagnetic radiation) which can provide useful data or information for the purpose of soil monitoring.

7
3. Could remote sensing of any of these indicators replace and/or complement traditional
field based national scale soil monitoring?
4. Can meaningful measures of change be derived?
5. How could remote soil monitoring of individual indicators be incorporated into national
scale soil monitoring schemes (such as the Countryside Survey?)
In addressing these questions we have considered the full range of earth observation, satellite
navigation and telecommunications tools available.
1.2 SENSOR PLATFORMS
In the context of remote sensing, the different sensor types can generally be mounted on either
airborne or spaceborne platforms. Here, airborne platforms are differentiated according to
whether the aircraft is manned (i.e. airplane or helicopter) or unmanned (i.e. UAV – un-manned
aerial vehicle). The choice of sensor-platform combination is not only governed by the soil
property of interest, but by several additional factors including the associated cost and
practicality.
Irrespective of the application, the use of UAVs for remote sensing is somewhat restricted by the
size and mass of the sensor payload they are capable of carrying. As a result, UAVs have
traditionally been used as a platform for imaging systems for the acquisition of spectral
reflectance data (Honkavaara et al., 2013; Torres-Sánchez et al., 2013), thermal infrared imagery
(Berni et al., 2009; Zarco-Tejada et al., 2012), or for the derivation of photogrammetric digital
elevation models (DEMs) (d'Oleire-Oltmanns et al., 2012). However, with recent advances in
compact sensor technology, more potential UAV applications are emerging as some are now
capable of carrying RADAR sensor payloads (Koo et al., 2012; Remy et al., 2012). After the
initial outlay to purchase the UAV and any appropriate sensors, the cost of acquiring remotely
sensed data from an unmanned airborne platform generally consists of the staff-time for only a
single operator. Moreover, UAVs can be utilised to acquire very high spatial resolution data —
typically on the order of centimetres — because they can be operated at lower altitudes than
manned aircraft. However, imagery acquired at a very high spatial resolution usually covers a
small spatial extent on the ground. As a consequence, achieving national-scale coverage using
UAVs is likely to require considerable time and financial support. Accordingly, soil monitoring
through repeat UAV surveys is arguably better suited to detailed local monitoring programmes.
The acquisition of various remotely sensed datasets (e.g., multi- and hyperspectral imagery,
RADAR, LiDAR, radiometric, thermal) from manned airborne platforms is well established.
Although having a higher operating altitude than their unmanned counterparts, manned airborne
platforms can still be utilised to acquire high spatial resolution data — typically on the order of
metres. Data acquired from manned airborne platforms also has the added benefit of it covering a
larger spatial extent than that of UAV-acquired data, therefore providing a more practical means
of acquiring data at regional or even national-scale. However, despite the advantages, the
commissioning of manned airborne surveys is generally costly, particularly if considered for
repeat surveys for national-scale monitoring purposes.
With many relevant sensors already in operation, spaceborne platforms offer an attractive means
of monitoring soils at a national-scale, because image scenes typically cover large spatial extents
and can be acquired at either no cost or for a relatively small fee. Although only a handful of
scenes may be required for national coverage, spaceborne data do generally have a coarser
spatial resolution than airborne platforms — typically on the order of tens to hundreds of metres.
Nevertheless, with frequent revisit times, spaceborne platforms provide access to temporal
datasets that can be readily used for monitoring purposes.

8
1.3 THE CHALLENGES OF REMOTE SENSING OF SOIL PROPERTIES
A recent review by Croft et al. (2012) highlights the major challenges to remote sensing and
modelling of soil properties: “One of the greatest challenges facing the broad-scale adoption of
remote sensing methods in soil science and soil organic carbon [SOC] studies is the site-specific
nature of relationships between RS-measured variables and SOC.”
Site-specific relationships between remotely sensed variables and soil properties can occur for
various reasons:
1) Reported models are empirical in nature. These models are often only relevant for a
particular instrument at a point in time and space, as the complex relationship between
soil constituents and soil reflectance is not taken into account (Bartholomeus et al., 2011)
2) Sensor characteristics vary between sensors. The transfer of prediction models between
one sensor to another can be complex, due to differences in spectral resolution, sampled
wavelengths, location of spectral bands and the number of bands used (Bartholomeus et
al., 2011).
3) The use of different numerical methods and data pools can also cause difficulties when
comparing the statistical quality of mapped soil parameters (Selige et al., 2006).
4) Soil reflectance responds to temporally invariant factors (e.g. soil type, mineralogy,
geology) and temporally variant factors (e.g. tillage, moisture, soil roughness, crop
residue cover (Ladoni et al., 2010).
5) Inherent data accuracy of airborne and satellite data, which can be due to variations in
illumination, changes in terrain and atmospheric attenuation (Ben-Dor et al., 2002). This
can also cause problems particularly when, for example, SOC has low concentrations or a
small range of SOC values, and measurement uncertainly can exceed spatial and
temporal differences in SOC content (Stevens et al., 2008).
1.3.1 Challenges in northern temperate regions
In regions of northern latitudes, such as the UK (50-60 ºN), there are particular challenges for
remote sensing of non-vegetated soils to measure their properties. The window of opportunity
for remote sensors to measure soil surfaces is generally reduced because: 1) bare, or partially
bare, ground exists mainly during the autumn and winter months, due to tillage practices, where
soils are cultivated in the autumn and sown later that autumn; and in the case of grassland are
seldom bare. 2) Cloud cover during the winter is common in northern latitudes, preventing clear-
day skies, which are necessary for remote sensors to provide spectral reflectance data of soil
properties. 3) Soil moisture can cause variation to spectral response, which during the winter can
be very variable, including aspects of freeze/thaw and snow, which have a large effect on
spectral reflectance. 4) During the winter, the angle of the sun is low, which also affects spectral
response of remote sensors. To reduce spectral response variability in the visible and near infra-
red, it is best to have a small azimuth angle2.
Mulder et al. (2011) reviewed the use of remote sensing in soil and terrain mapping and
summarised the various ways remotely sensed data offered possibilities for extending existing
soil survey datasets. The suggested uses of remote sensing were:
1) Soil composition can be assessed by using remote sensing to segment the landscape into
approximately homogenous soil-landscape units, which then aids the assessment of soil
composition using classical or more advanced methods,
2) The spectral data measured by remote sensors can be analysed using physically-based or
empirical methods to derive soil properties,
3) Remotely sensed imagery can be used as a data source to support soil mapping as
described by (Grunwald et al., 2011), and (Minasny et al., 2013))
2 The azimuth angle is the angle between the line from which the remote sensing instrument detects its signal from
an observed point on the land surface and the line of shortest distance between the sensor and the land surface.

9
4) Remote sensing methods facilitate mapping of inaccessible areas, reducing the need for
extensive time-consuming and costly field surveys.
1.4 MEASURING STATE AND CHANGE OF SOIL INDICATORS
The monitoring of the status of soil indicators and the monitoring of change in these indicators
are two quite different challenges. Lark (2009) notes that the status and change of a soil indicator
are different variables and their variability is likely to differ. For example, Lark (2009)
considered the example of metal concentrations in the soil. The baseline status of a particular
metal is likely to be primarily related to the underlying geology, whereas the change might be
related to anthropogenic processes such as land use change and pollution. This example
illustrates that a soil monitoring network that is suitable to monitor the status of a soil indicator
might not be suitable to monitor the change in the property in two regards. First, the statistical
design of the network might not be able to estimate the change in the indicator with the same
precision as the status can be estimated. Second, a measurement method (e.g. a remote sensing
technology) that is suitable to infer the status of the indicator might not be suitable to infer
change in that property.
The design of a soil monitoring network refers to the configuration of locations and times at
which the soil indicator is measured. The precision of an estimate of the baseline status of a soil
indicator should improve with the sampling effort in space. This precision depends on the design
and the spatial variability of the measurements of the soil indicator. If the variability of a
particular indicator is well understood it is possible to estimate the precision with which a
particular design will estimate the baseline status. Such a process was conducted by Black et al.
(2008) when they considered the design of a UK soil monitoring network that would use
conventional measurement methods. They used previous surveys of soil properties (the National
Soil Inventory and Countryside Survey) to establish models of the spatial variability of key soil
indicators, such as soil organic carbon, pH, copper and zinc. They then tested the precision with
which different designs could estimate the means of these indicators. If the same process is to be
used to determine the precision with which a soil monitoring network could estimate the change
of a soil indicator, then it is necessary to quantify both the spatial and temporal variation of the
indicator. Information about the temporal variation of soil properties tends to be less plentiful
than spatial information, because of the expense of conducting a survey at multiple times and the
time that must elapse before meaningful changes can be observed. Therefore, it tends to be more
difficult to establish whether a monitoring network is suitable to monitor change with a specified
precision. Black et al. (2008) only considered the precision with which changes in soil organic
carbon could be estimated. Where temporal information about soil properties is not available it is
necessary to conduct reconnaissance surveys prior to designing a soil monitoring network.
The second point about whether a particular measurement method is suitable to infer both status
and change in a soil indicator is particularly pertinent for remote sensing technologies. Often
these technologies do not directly measure the soil indicator of interest. Instead, they measure a
property that is correlated to the indicator of interest and a statistical model is used to infer the
indicator. If we return to the example of soil metal concentrations, it might be possible to use a
radiometric sensor to identify variations in parent material and a statistical model calibrated to
relate these variations to the metal concentrations. However, if the radiometric sensor is used to
re-measure the soil at regular intervals then the information it gathers will still primarily relate to
the variation in geology. It will say less about pollution or the changes in land use which might
have caused changes to the soil metal concentrations.
One key question is “What is meant by a meaningful change in a soil property?” Meaningful
could refer to a statistically significant change i.e. a change that is sufficiently large that we
would not have expected it to occur by random chance. However, this is not always the most
useful definition. The magnitude required for a change to be statistically significant decreases
with sampling effort. If very intensive soil sampling is employed then it is possible that tiny

10
changes to soil indicators might be statistically significant. However, these changes might be too
small to cause a noticeable change to soil functionality. It is preferable to consider meaningful
changes in terms of soil functionality. For instance, there might be critical thresholds in the
concentrations of soil nutrients below which the soil is unsuitable to maintain production or
heavy metal concentrations above which plant toxicity may occur. A meaningful change in the
property could be said to have occurred if soil nutrient or heavy metal concentrations cross a
threshold. Black et al. (2008) reviewed critical thresholds or ‘action levels’ for 13 soil
indicators. A coupled question is how precisely the soil indicator and these action levels need to
be monitored. Black et al. (2008) suggested that the development of such quality measures was
urgently required, but to our knowledge, these have not been determined to date.
1.5 NATIONAL SCALE SOIL MONITORING AND INCOPORATION OF REMOTE
METHODS
To understand the potential for remote methods to enhance soil monitoring it is necessary to
clarify some terminology. We refer to ground-based soil sampling followed by laboratory
measurements of soil indicators at national survey sites as primary observation. If a remote
sensor makes a direct measurement of a soil indictor this is a secondary observation. Where we
can establish a statistical relationship between a series of remotely sensed observations at a large
number of sites where a series of primary observations have also been made, we refer to the
former as a secondary covariate. Such a secondary covariate may have an indirect relationship
with the soil indicator. For example, in their study on mapping soil organic carbon across
Northern Ireland, Rawlins et al. (2009) stated that the two dominant factors which explained the
negative correlation (indirect relationship) between SOC and gamma-radiation derived from
potassium (40
K) decay were: i) the variation in mineral-K content which decreased with
increasing quantities of soil organic matter, and ii) increased soil moisture resulting in greater
attenuation of the gamma signal from the soil. The secondary covariate can be included in
statistical approaches to predicting soil properties as a fixed effect.
To enhance soil monitoring, by contributing to the detection of a meaningful change in soil
indicators, preliminary approaches are likely to utilise remote sensing as a secondary covariate to
improve predictions of soil properties at unsampled locations. For example, in areas of
cultivated soils of England, it may be possible to use either airborne (Selige et al., 2006) or
satellite (Jaber et al., 2011) hyperspectral data as a fixed effect to predict SOC concentrations in
topsoil across large regions.
The CEH Countryside Survey soil sampled a total of 396 sites across England and Wales in
2007 (Emmett et al., 2010), but it would only be possible to capture vegetation-free, remotely
sensed data on soil reflectance for a subset of cultivated sites predominantly in southern and
eastern England. If it was possible to establish a strong statistical relationship between the
hyperspectral data for these sites and the primary measurements, this could be used as a fixed
effect to make predictions (with associated uncertainties) for other areas of cultivated land for
which hyperspectral data were available as a way of wider mapping of the status of soil
indicators.

11
2 Methodology
Figure 1 shows our approach to address the aims of the project.
Figure 1 Summary of the approach used in this review study - Flow diagram of the
literature review process to create a database of relevant literature and information
(OUTPUT 1), which was then used to write OUTPUT 2: a review report of the most
relevant findings of remote sensing and soil physical properties.
The literature review had three types of investigation to provide the relevant information and
data for an up-to-date assessment. The literature review was divided into three searches: 1)
Global Expert Survey, 2) Published literature search and 3) Internet search. These searches
provided relevant published literature, internet data and sources, and the most recent up-to-date
research from experts working in remote sensing. The data was compiled into a database to store
and categorise the relevant material and is shown as Output 1, in Figure 1. The database was
used to write the final review report (Output 2, in Figure 1).
2.1 PUBLISHED LITERATURE SEARCH
A literature search of published information was undertaken using the Thompson Reuters Web
of Science literature search engine. A systematic topic search was done, using a combination of
terms listed in Appendix 1 (Table 1), which provided 43 separate search criteria. The
combination of search terms was considered in four ‘fields’: the first ‘field’ always used the term
‘Soil’; the second ‘field’ was related to the terms ‘remote sensing’, ‘satellite’, or ‘airborne’ and
more specific search terms relating to remotely sensed sensors, such as ‘microwave’, ‘LiDAR’
‘hyperspectal’, ‘thermal’, ‘radar’ and ‘unmanned aerial vehicle’ and; the third field was related
to a physical soil property, such as ‘organic carbon’, ‘geochemistry’, ‘bulk density’, ‘soil depth’.
Each time a search was done using a combination of terms, the number of ‘hits’: i.e. references
found by the search engine were recorded (and are shown in Appendix 1, Table 1). If there were

12
too many ‘hits’ (above 600 articles), more defined search terms were used and the search was
run again. The search terms used in the published literature search are shown as grey rows in
Appendix 1. A total of 2,885 published citations and their abstracts were downloaded to
EndNote; a reference management software package, which manages bibliographies and
references. All duplicate references were discarded and the final reference list in EndNote was
2,031 published references.
This final reference list in EndNote was then divided into three EndNote reference libraries and
distributed to three experts, who then read through each reference and discarded those that were
not-relevant. The criteria for keeping a reference were that the remote sensing method used
monitored or measured one or more of the following:
1) SOC
2) Bulk density
3) pH
4) Soil depth
5) geochemical soil indicators: N, P, K, Mg, Cu, Zn, Ni and Cd
6) peat
Once all irrelevant published references were deleted, the three resulting libraries were merged
to create a final reference EndNote library. The final merged library contained 307 published
references.
2.2 INTERNET SEARCH
Two types of Internet searches were undertaken, using the Google Chrome browser to find
relevant published references, website references, sources and blog sites relating to remote
sensing of soil physical properties (shown in Appendix 1, Table 2). The first search was a
Google Web search and used two search criteria: 1) ‘remote sensing’ + ‘soil’ + ‘physical’ +
‘properties’ and 2) ‘remote sensing’ + ‘soil’ + ‘monitoring’. Theses searches gave an enormous
amount of hits (between 2 and 4 million), we therefore only searched the hits of the first 10
pages.
As the second search criteria provided only 1 useful reference, we only used the search criteria
‘remote sensing’ + ‘soil’ + ‘physical’ + ‘properties’ for a Google Blog search, which found 4
useful hits from the first 10 pages of the Blog Search.
In total, 44 useful references were found and added to EndNote. These references were added to
the final merged EndNote library, providing in total 351 references.
2.3 GLOBAL EXPERT SURVEY
Based on our knowledge of the soil remote sensing community, we selected and wrote to six
world experts (see list in Appendix 2, Table 1) to ask whether there were new techniques which
had not yet been published that may be worthy of consideration in this review. The letter sent to
these experts is also shown in Appendix 2. Where the experts provided new references relevant
to our review we included these in our reference database and where they provided relevant, new
insights we included these in our overall interpretation. We also undertook a telephone interview
with members of a project team based at the newly established company Rezatec, who are
currently undertaking a project to develop a peat spotter service, where the objective is enable
accurate, cost-effective and appropriate (in line with international standards) methods for
identifying the location of peatlands, quantifying their intactness and assessing their carbon
content.

13
2.4 STRUCTURING AND ASSIMILATION OF INFORMATION
All the new (n=15) references from the Global Expert Survey were added to the final merged
EndNote library (containing 351 references). This library was again divided into three smaller
libraries and given to three experts who again discarded irrelevant references which were
considered to be:
1) of no relevance in a UK environment (many of the references related to arid and semi-
arid environments).
2) related to the monitoring of irrelevant physical soil properties.
3) using inappropriate remotely sensed techniques; for example many references were
related to using spectral techniques proximally (at ground level) or in laboratory
conditions.
The remaining total number of references was 186. These final references were then categorised
using a ‘tagging’ procedure in EndNote. Each reference had a Keyword field which was ‘tagged’
using keywords, relating to the remote sensor and the physical soil property being measured.
These keywords were the following:
1) Hyperspectral
2) SAR
3) Microwave
4) UAV
5) Thermal
6) Radiometric
7) Spectral
8) Soil texture
9) Electrical conductivity
10) Bulk density
11) pH
12) Soil depth
13) SOC
14) Geochemistry
15) Erosion
By using tagged keywords, the references were then categorised quantitatively to understand
which remote sensor was mainly used to measure different soil properties and which physical
soil property had been researched the most.
3 Results and their interpretation
We have presented our findings by first summarising the counts of the tagged keywords in the
reference database through combining the information from the literature search, the internet
search and the expert survey. Secondly, we have assessed each of the indicators separately
through addressing the list of 5 key questions which were presented in the introduction. We
summarise the information in a table describing the most promising remote sensing approaches
which might be used for each indicator and the practicality of implementation. We chose to
combine some of the indicators into two groups: i) nutrients (extractable K, extractable Mg,
Olsen extractable P, total N) and ii) metals (Cd, Zn, Cu, Ni).

14
3.1 TAGGED DATABASE SUMMARY
Figure 2 The number of soil monitoring and remote sensing studies which refer to or utilise
the specified a) soil indicators, and b) sensors/platforms (based on a total of 185 references
selected from peer-reviewed published literature).
Figure 2a shows that overwhelmingly the most common soil indicator which has been measured
(or referred to) by soil remote sensing approaches is SOC (n=118 keyword citations). This
dominance is likely for two main reasons: i) the importance of soil organic carbon as a mediator
of global climate change and its general use as a soil quality indicator, ii) organic carbon
signatures can be detected using hyperspectral data because the frequency of the associated
bonds occur within the visible and near infra-red spectral range (0.35–2.5 µm).
so
il t
extu
re
ele
ctr
ica
l co
nd
uctivity
bu
lk d
en
sity
pH
so
il d
ep
th
SO
C
ge
och
em
istr
y
ero
sio
n
co
un
t
020406080
100120 a)
hyp
ers
pe
ctr
al
SA
R
mic
row
ave
UA
V
the
rma
l
rad
iom
etr
ic
sp
ectr
al
co
un
t
020406080
100120 b)

15
3.2 SOIL ORGANIC CARBON (SOC) AND TOTAL NITROGEN (N)
SOC: There are many published studies which show that remotely sensed reflectance data can
be used, via the construction of statistical models between the spectra and direct measurements
of SOC, to make predictions of the concentration of SOC (status) at sites where soils samples
have not been collected (Ladoni et al., 2010). The spectral reflectance (or spectral absorption)
data encompasses the ultra violet (UV), visible (VIS), near infrared (NIR) and mid infrared
(MIR) regions. However, there are currently few satellite-based observations that encompass the
MIR range which typically have stronger correlations with SOC than the NIR range (Ladoni et
al., 2010).
One of the problems of using spectral reflectance data is that mineral absorption features
typically overlap with organic compounds so statistical models must be developed for particular
regions and cannot necessarily be applied with the same confidence to other regions. Soil
spectral reflectance and SOC relationships are not universal, and therefore require new statistical
models to be constructed for each study area and field samples need to be collected and analysed
(Ladoni et al., 2010). Weak statistical correlations may be observed between SOC and soil
reflectance when soil samples are taken from large geographic areas with different parent
materials or different landscapes where reflectance response is dominated by soil factors other
than organic matter content (Henderson et al., 1992).
Gomez et al. (2008) used a combination of proximal spectrometer data and Hyperion
hyperspectral information to construct a statistical model and map SOC. In their study, Gomez et
al. (2008) concluded that predictions of SOC using ground-based spectrometer data were more
accurate than the Hyperion spectra, although the SOC map predicted using Hyperion data
showed similarity with field observations. Selige et al. (2006) showed that airborne
hyperspectral remotely sensed data could be used to accurately map SOC concentrations at field
scales,. In their study encompassing Europe, Stevens et al. found that the errors in predicting
SOC concentrations from visible and near infra-red (VNIR) spectra were 5 times greater than for
traditional soil sampling and laboratory analysis. The best spectral calibrations achieved a root
mean square error ranging from 4 to 15 g C kg-1
for mineral soils and 50 g C kg-1
for organic
soils.
A direct relationship between SOC and soil reflectance is only measurable when SOC is greater
than 2%, otherwise the SOC signal is concealed by the presence of other biochemical
components such as iron and manganese (Al-Abbas et al., 1972). Such low SOC concentrations
can cause difficulty in deriving absorption features through visual inspection alone, due to a
combination of overlapping absorption features. Consequently, more complex spectroscopic
modelling approaches are needed to derive mathematical relationships between soil spectra and
soil constituents (Croft et al., 2012).
Two reflectance bands (near infra-red and red) have been used from both airborne and remotely
sensed imaging based on the ‘soil line’ concept. For any un-vegetated soil surface, there is an
approximate linear relationship between the NIR and red reflectance bands referred to as the
‘soil line’ with which other soil properties are related. This shows bright soils are more
reflective in both the IR and red, whilst dark soils are the least reflective in both reflectance
bands (Richardson and Wiegand, 1977). As concluded by Baret et al. (1993) and Nanni and
Dematte (2006), experimental results show that a “global soil line” does not apply and that the
main factor of variation of ‘soil line’ parameters appears to be soil type. In their review, Ladoni
et al. (2010) indicate that more recent research has shown that ‘SOC is correlated to a pixel’s
location along the soil line’ using the soil Euclidean distance (SLED) technique (Fox and
Sabbagh, 2002). Soil sampling and measurement of these samples for SOC provide a descriptive
curve relating SLED and field SOC. This method has been shown to reduce field sampling and
was found to provide good correlations with SOC (R2 = 0.72 to 0.76) (Fox and Sabbagh, 2002).
Both NIR and red reflectance bands are available from airborne infra-red cameras and satellite

16
platforms that encompass the UK, but these data have not, to date, been combined with ground
based analyses for application to national scales in England and Wales.
Based on a combination of ground-based sampling and airborne radiometric survey, Rawlins et
al. (2009) showed that SOC concentration could be mapped with smaller prediction uncertainties
by including measurements of radiometric K data as a secondary covariate, along with elevation
data. This approach can only be applied from low-flying airborne or ground-based systems, so it
may have limited applicability to national-scale approaches. All the published studies have
demonstrated that remotely sensed data can contribute to improved mapping of SOC
concentration [status], but none have shown that remote methods can monitor change, either with
or without ground-based measurements. In their review, Ladoni et al. (2010) conclude that the
main advantage of remotely sensed data (suggested by most researchers) is that “they can be
used to design a sampling scheme for mapping SOC [status] with the smallest number of
samples, and with greater accuracy”. They also propose that:
1. Remotely sensed data should first be a guide for field soil sampling, rather than directly
predicting soil properties.
2. Satellite data should be used as secondary information as geostatistical analysis has
shown the potential to improve predictions of SOC.
Total N: There is a relatively restricted range of element ratios between total C (carbon) and
total N (nitrogen) in soil organic matter and it is possible to use pedo-transfer functions (PTFs) to
estimate total N on the basis of other measured soil properties, including soil carbon and bulk
density, with only modest prediction errors (Glendining et al., 2011). However, errors for
predicting total N based on the application of PTFs, using EO measurements of these soil
properties as predictors, would likely be too large for practical use. It has been shown that total
soil nitrogen can be predicted with reasonable accuracy based on statistical models of visible and
near infra-red (VNIR) laboratory spectra (Viscarra Rossel et al., 2006) and also using airborne,
hyperspectral remote sensing data in combination with ground-based measurements (Selige and
Schmidhalter, 2005). There were two studies in which remotely sensed data had been used to
enhance predictions of ground-based measurements of total nitrogen. First, a study by Wu et al.
(2009) applied this approach in Hengshan County, the northern Shanxi Province of China, using
Hyperion satellite data. Second, a study by Stamatiadis et al. (2013) applied the technique to
three, 10 hectare fields in Greece. They showed that the greatest negative correlation coefficient
(coefficient of determination R2 = 0.77) was obtained between satellite NIR reflectance (0.5
metre multi-spectral World View 2 image) and soil N content. In both cases, it was necessary to
develop statistical models for the prediction of total soil nitrogen, using primary field sampling
in combination with EO (hyperspectral) measurements. The prediction errors for total soil N
using the VNIR spectral range are typically somewhat larger than for total C (Viscarra Rossel et
al., 2006). Based on the published literature, airborne or spaceborne hyperspectral soil
reflectance measurement is the only current EO technique which is likely to provide reasonable
predictions of total soil N. However, because the remote sensor must be able to detect reflectance
directly from the soil surface, this approach requires non-vegetated soil which are most
effectively calibrated by ground-based soil sampling and direct laboratory measurements of soil
properties. Although we might expect statistically significant relationships between EO-derived
vegetation canopy productivity indices and total soil nitrogen, there were no published studies
which demonstrated that such relationships were sufficiently strong to accurately predict soil
total N under a range of vegetation types.
Our findings relating to the most effective EO technique for predicting state or change of total
soil N were very similar to those for SOC, the most promising technology is hyperspectral
remote sensing.
17
3.2.1 Opportunities
The strong relationships between reflectance spectra and both SOC and total N, using
multivariate statistical techniques, particularly laboratory and proximal (ground-based)
approaches, illustrates their potential for improved mapping of their concentrations [state] (Croft
et al., 2012). The larger uncertainties in statistical models developed to predict SOC and total N,
using remotely sensed spectral information by comparison to ground-based (proximal or
laboratory) methods, reflects: i) the site-specific nature of relationships between remotely sensed
measured variables and target properties, and ii) atmospheric interference effects. However, the
uncertainties in the prediction of soil properties such as SOC can be substantially reduced by
combining digital mapping using combinations of spectral information and other data sources,
such as soil and vegetation maps. Such an improvement in SOC prediction is shown in the use of
digital mapping of SOC, which has quickly moved from a research stage to being operational,
with maps of carbon concentration and carbon stock from field to regional scale (Minasny et al.,
2013).
The review of Ladoni et al. (2010) suggests that given the uncertainty of direct measurements of
SOC by remote sensing, there is a far greater possibility to use remotely sensed data to guide
sampling schemes, rather than for direct measurement. Obtaining representative soil samples is
useful for the application of geostatistical models, and remotely sensed data has been found to be
advantageous in designing a sampling scheme for mapping SOC, with the smallest number of
samples and with greater accuracy, at lower costs (Ladoni et al., 2010).
3.2.2 Can Earth Observation replace field sampling?
Based on current sensor technology, EO cannot replace field sampling but can complement it by:
i) helping to improve sampling schemes, and ii) providing an exhaustive covariate (available
across large parts of the landscape) that if used in a statistical model can substantially reduce the
uncertainty in predictions of total concentrations. For mapping the state of these properties it
would be possible to devise efficient sampling schemes to achieve a specified accuracy based on
the analysis of a specified number of ground-based samples with associated analyses, thus
reducing survey costs. In addition to spectral reflectance data, there are other environmental
covariates which can reduce the prediction uncertainties of SOC and total N, such as terrain
indices.
3.2.3 Can change be measured?
There have been no published studies to date which have demonstrated that a change in SOC or
total N can be measured [at national scale], using only remotely sensed methods. We noted in
the introduction that the challenge of monitoring change is quite different to mapping the state of
soil properties. The errors associated with predicting SOC and total N concentrations by
remotely sensed methods are substantially larger than for direct soil sampling and analysis, and it
is therefore not practical to apply this approach to monitoring change for those areas where
vegetation is sufficiently sparse for periods of the year for reflectance measurements to be made.
3.2.4 Integration with National Surveys?
The most promising technique for applying remote sensing of both SOC and total N is
combining the use of hyperspectral satellite data with ground-based sampling and analysis of
topsoils from a national survey (such as the National Soil Inventory or Countryside Survey) to
improve predictions of SOC concentrations [state] at un-sampled locations. However,
reflectance data will only be available for a subset of those sites which are cultivated annually,
limited largely to eastern and southern parts of England. Without first testing this approach, it is
not possible to state the magnitude of the improvement in prediction accuracy through using
remotely sensed data. A number of other factors would likely influence this; the quality of the

18
remotely sensed data (e.g. the extent of atmospheric interferences) and soil-dependent
interferences between mineral and organic carbon and nitrogen absorption bands.
3.3 BULK DENSITY AND COMPACTION
The bulk density (of topsoil) is the mass of soil material per unit volume and is strongly related
to the soil organic carbon concentration (and thus land cover type), land management and to a
lesser extent soil texture (Hollis et al., 2012). Soils which have been subject to compaction have
larger bulk densities than those which have not and so we consider compaction in this section.
There were no published papers in the scientific literature (nor was there evidence elsewhere)
which showed that soil bulk density or compaction could be predicted on a defined scale with a
specified accuracy using remotely sensed signals. In their study on prediction of soil physical
properties using spectral approaches, Minasny et al. (2008) state that “soil physical properties
that are based on pore-space relationships such as bulk density, water retention and hydraulic
conductivity cannot be predicted well using [MIR] spectroscopy”. The soil property which
accounts for the greatest (typically around 65%) proportion of variation in bulk density is SOC
concentration (Hollis et al., 2012). Hence, it may be possible to use pedo-transfer functions
based on SOC concentration to predict bulk density with errors somewhat larger 0.17 gm cm-3
(Hollis et al., 2012) However, such large errors would mean that monitoring change by remote
sensing would be impractical, and therefore it is advisable to use field-based sampling and
analysis to monitor this property.
Given the current absence of effective techniques for measuring bulk density by remote methods,
and no immediate prospect of this being addressed in the short-term by new technologies, we
have not addressed the set of five questions relating to this indicator, but summarise them in
Table 1. Soil compaction leads to small reductions in soil surface elevation so it may also be
possible to detect compaction-induced changes through remote monitoring of elevation using the
InSAR methods described in the study by Rawlins et al., (2014), however such an approach
would need considerable research and testing before it could be deployed.
3.4 SOIL DEPTH AND SOIL EROSION
Soil/peat depth: In a recent study funded by the Welsh Government, interferometric synthetic
aperture radar (InSAR) remote sensing data was used to monitor changes in the surface elevation
of vegetated peat over an area of 10 km2 (and other land cover types across a wider area) over a
period of seven years (1993-2000; (Rawlins et al., 2014). This study involved the application of
a new InSAR processing technique which considers pixels within the input radar stack that are
only coherent for subsets of the total period of processing. The authors found that variations in
the change in peat surface elevation across the study area were similar over shorter (24 hours)
and longer periods (>100 days); the longer periods included periods of prolonged wet and dry
weather. The standard deviation of the peat surface elevation change was around 5.5 cm, in both
cases highlighting considerable movement which the authors consider may be caused by gas
generation and loss in peat soil. The standard deviation in elevation change for other soil types
with differing vegetation (grassland, forest, heather) was substantially smaller (1.7-3.2 cm). The
mean elevation of peatland (and its vegetation canopy) did not appear to change markedly over
the seven year period, but there was clearly a considerable amount of short-term variation.
These data suggest that it would be possible to monitor peat canopy elevation over many years to
detect change, as a proxy for measuring changes in peat thickness, assuming there were limited
changes in vegetation canopy height. A substantial period of monitoring (>20 years) would
likely be required to detect a statistically significant change in elevation of blanket peats, given
the long timescales over which these soils respond to changes in local conditions.
The approach described by Rezatec (see expert survey) to develop a peat spotter service will be
based on a combination of satellite-based interferometry and LiDAR techniques to quantify
tropical peat depths and volumes, in combination with ground-based measurements using field

19
sites in Indonesia. Based on the findings of this work, which are in the early stage, it is hoped
that the methodologies might be transferable to temperate zones such as the UK.
Soil erosion: The current, Defra-funded pilot of a soil erosion monitoring network for England
and Wales (project SP 1311), will utilise a fixed-wing UAV at a series of selected sites as a
means of identifying the extent of erosion features, but there are no plans currently to process the
captured images to quantify erosion losses. A fixed-wing UAV was used by d'Oleire-Oltmanns
et al. (2012) to quantify gully and rill erosion in 2D and 3D for a region of Morocco, based on
the creation of high-resolution Digital Terrain Models. In their review paper on monitoring, soil
degradation by remote sensing, Shoshany et al. (2013) identified three RS technologies which
were most likely to be effective: InSAR, LiDAR and close-range photogrammetry. For national
scale erosion monitoring we suggest that deployment of direct approaches to detect either gully
erosion features or overall lowering of parts of the landscape (with associated accumulation
downslope) is the most promising approach.
3.4.1 Opportunities
InSAR methods applied to satellite data may be able to detect a lowering of surface elevation by
millimetres or centimetres. This is a similar approach to that used by Rawlins et al. (2014) in
their assessment of changes in peat elevation. After processing, the ERS satellite data used by
Rawlins et al. (2014) had a support (ground footprint) of a square, with side length 100 metres.
Although these data are costly, more recent satellites (TerraSAR-X and RADAR-SAT) have the
potential for finer resolution imagery (square of side length 1 or 10 metres) which may offer
greater potential for detecting changes within particular fields or identifying gully erosion
features. The SAR data from ESA’s soon-to-launch (Spring 2014) Sentinel-1 satellite will be
freely available at resolutions of 10 metres making this a practical means of obtaining the
relevant data to assess the InSAR technique. One of the limitations of applying InSAR methods
to the assessment of soil erosion/soil depth is the need to have a consistent (or preferably absent)
vegetation canopy. The method could be applied effectively to cultivated land when crops have
been removed, but it may be problematic to apply it in areas of grassland where sward heights
change by season and between years. Another study also used a combination of LiDAR data,
InSAR and air photographs for detecting landslides and erosional features evolving at rates
similar to those represented by water erosion of soil (Roering et al., 2009). The approach was of
sufficient resolution for the authors to compute downslope motion rates and also to estimate
denudation rates.
3.4.2 Timing and further development
There are no current technical barriers to testing the use of a combination of InSAR with IsBAS
processing for assessing changes in surface elevation as a means of estimating soil erosion in
cultivated areas. To access the most appropriate data it would be necessary to make a scientific
application to those responsible for satellite data capture to ensure the relevant scenes were
acquired on a regular basis. It would also be necessary to ensure that areas where the technique
is deployed are not subject to subsidence which could confound predictions of erosion loss or
overall changes in surface elevation (Sowter et al., 2013).
3.4.3 Can Earth Observation replace field sampling?
Based on the evidence presented, we believe that a combination of InSAR with IsBAS
processing for assessing changes in surface elevation, as a means of estimating soil erosion or
change in soil depth, could replace field-based measurements such as terrestrial LiDAR.
However, the method would need to be rigorously tested in areas where cultivated soils were
known to have eroded to demonstrate that the method was fit for purpose.

20
3.4.4 Can change be measured?
Assuming there were no technical difficulties with access to and processing of the data, it should
be possible to measure changes in the elevation of cultivated land, which could be attributed to
erosion processes or changes in soil depth. However, this approach/technology would need
thorough testing with ground-based validation before it could be implemented.
3.4.5 Integration with National Surveys?
There is currently no established national-scale soil erosion monitoring scheme, although a pilot
is currently being undertaken (Defra SP1311). It may be possible to integrate earth observation
with such a survey, although the InSAR technique is likely to be limited to vegetation-free,
cultivated areas initially.
3.5 METALS
There is currently no technical basis for estimating the four total heavy metal soil indicators
directly from remotely sensed data. Quantitative assessments of soil properties from remote
sensing largely rely on the correlation of particular soil properties with infra-red spectroscopic
reflectance measurements (Mulder et al., 2011) which relate to the chemical bonds within
organic and inorganic compounds in the soil. The bonds that respond markedly to infra-red
spectroscopy are predominantly between carbon, nitrogen, hydrogen and oxygen, which are
present in substantial quantities in certain soil phases. The four heavy metal soil indicators (Cu,
Zn, Ni and Cd) either do not exhibit diagnostic spectral features in the infra-red wavelength
region, or in the case of extractable components, the relationships between the bonds and
extracted phases are too complex to be resolved in a quantitative measurement. Nor do these
indicators typically have simple relationships with common soil properties that can be identified
by their infra-red spectral characteristics (Viscarra-Rossel et al., 2006). One study on soil heavy
metals refered to the application of remotely sensed data (Chen et al., 2012), however, the
hyperspectral imagery was used as a means of classifying land use, not as the basis for
measuring or improving the prediction of heavy metal concentrations in the soil.
Due to a lack of appropriate methods, we do not consider it appropriate to separately address the
five questions posed in our introduction. To summarise, there is no current or medium-term
potential earth observation technique which could be deployed to monitor total (aqua regia
extractable) soil heavy metal concentrations. It is likely that the only realistic approach is field
based sampling and laboratory analysis, likely based on existing monitoring networks.
3.6 EXTRACTABLE NUTRIENTS
The three extractable nutrients (and the forms they are present in extracted solutions that concern
us are: phosphorus (Olsen P), magnesium (extractable), potassium (extractable).
3.7 OLSEN P, EXTRACTABLE MG, EXTRACTABLE K
The extractable concentrations of these three nutrients inform us about the fertility of the soil.
Extractable concentrations are quite different from total concentrations, because the former are
held in ‘exchangeable’ forms associated with the surfaces of soil minerals and organic matter.
The concentrations of extractable nutrients do not have such strong relationships with bulk soil
properties, because they can reflect recent applications of manufactured fertilisers and organic
materials or transitory soil hydrological conditions (e.g. wetting and drying cycles). The basis of
predicting soil properties based on VNIR spectroscopy relies on the overall reflectance
properties of the dominant soil mineral and organic phase composition, not the composition of
‘exchangeable’ elements on their surfaces. A review study by Ge et al. (2011) summarised
approaches to estimate a range of soil properties by use of remote sensing including total P, total
K and Mg, but not extractable concentrations. The bonds that respond to infra-red spectroscopy

21
are predominantly between carbon, nitrogen, hydrogen and oxygen which are present in
substantial quantities in certain soil phases, whilst bonds for P, K and Mg are much less
responsive.
3.7.1 Olsen P
There were no published studies which showed that Olsen P could be measured using any remote
sensing technique. Nor had any study shown that Olsen P could be predicted accurately from
soil based spectroscopic measurements. A study by Baojuan (2008) in the USA showed that
total soil P could be predicted using Hyperion hyperspectral, remote sensing imagery; the
statistical model based on the spectra accounted for 67% of the variation in laboratory measured
total P from field based sampling. However, although there are typically positive correlations
between total P and Olsen P in soil (Owens et al., 2008), the uncertainties associated with
predicting the latter based on the former are far too large for this approach to be practical.
3.7.2 Extractable Mg
Hyperspectral VNIR data have been used to construct statistical models to predict extractable
Mg in soil. In a study using 750 diverse soils from South Africa, (Shepherd and Walsh, 2002)
accounted for 81% of the variance in extractable Mg using VNIR spectra, suggesting this
approach had potential for wider application. However, no studies have confirmed this
relationship in temperate environments such as the UK. None of the other remote sensing
technologies have been shown to have sufficiently strong statistical relationships with extractable
Mg for practical deployment in predicting state or change.
3.7.3 Extractable K
The only study to have demonstrated that extractable K could be measured based on the VNIR
spectra of soil samples was published by Daniel et al. (2003) based on 41 samples collected from
a region of Thailand. In their study, Daniel et al. (2003) found that soil spectra accounted for
80% of the variance in extractable K; there was no attempt to relate the ground-based spectra to
remotely sensed sources such as hyperspectral satellite data. A total sample size of 41 is a
relatively small number upon which to develop and independently validate predictions of
extractable soil K. It is somewhat surprising that, if there was a general relationship between soil
VNIR spectra and extractable K, it has not been reported more widely given its potential
importance for soil fertility and agricultural production. We believe that the relationship
reported by Daniel et al, (2003) was unusual (confined to these local soils) and that if tested
more widely, the relationship could not be deployed to accurately predict extractable K in soils
across broad landscapes. Furthermore, the relationship with hyperspectral satellite data and
extractable K would likely be even more tenuous.
By contrast, it is possible to accurately predict total K based on airborne radiometric survey data
which relies on the detection of gamma radiation from 40
K emitted from the ground surface.
Airborne radiometric survey data have been used to determine the distribution of plant available
K at farm-scale (Pracilio et al., 2006); gamma-K concentrations accounted for 60% of the
variation in bicarbonate-extractable K across three farms in Australia. Specific regions of
England and Wales have been flown by airborne radiometric survey by the British Geological
Survey, including parts of the Midlands (Rawlins et al., 2007) and Wales, the Isle of Wight, and
in 2013 south-west England. However, the relationships between total and extractable potassium
have not, to date, been investigated across England and Wales using these data. Such an
investigation could be undertaken by combining the data from the original National Soil
Inventory of England and Wales (McGrath and Loveland, 1992) with the airborne survey data
held by BGS. This would establish if radiometric K is an effective predictor of extractable K at
the landscape scale (i.e. to predict its state for mapping), and/or to infer change in this property.

22
3.7.3.1 OPPORTUNITIES
In general, there are limited opportunities to implement national scale RS techniques to
contribute to monitoring changes in the three soil nutrients (Olsen P, extractable K, extractable
Mg). In the case of Olsen P, there is currently no technical basis for successful application of
remote sensing of this soil property. In the case of extractable Mg, there is some evidence that
hyperspectral RS data might contribute to indirect mapping of this property (state), but there is
no evidence to suggest it could be used to monitor change even in combination with a ground-
based survey. In the case of extractable K, the most promising technology for mapping this
property, in combination with ground-based sampling, is airborne radiometric survey. However,
further investigation is required to establish the strength of statistical relationships between
radiometric K and extractable K across the landscape; data are available to do this.
3.7.3.2 TIMING AND FURTHER DEVELOPMENT
There do not appear to be any major development opportunities or timelines for radical advances
in the detection of the three extractable soil nutrients (P, Mg and K). One potential development
is the investigation of whether radiometric K has a strong correlation with extractable K, which
could be used to enhance the prediction of extractable K across the landscape.
3.7.3.3 CAN EARTH OBSERVATION REPLACE FIELD SAMPLING?
Based on the literature survey, it is very unlikely that earth observation could replace field
sampling for the three soil nutrient indicators; it is possible that with further development the
hyperspectral and radiometric RS approaches might be able to complement field sampling.
3.7.3.4 CAN CHANGE BE MEASURED?
Based on the available information it is very unlikely that change in these three soil properties
could be measured directly using RS approaches.
3.7.3.5 INTEGRATION WITH NATIONAL SURVEYS?
There are technical and practical barriers which would limit the extent to which RS approaches
could be integrated with national surveys to monitor soil nutrients. First, with the possible
exception of extractable Mg, there is uncertainty over the strength of direct or indirect
relationships between these soil properties and their (hyperspectral) remote sensing signal; this is
likely to be insufficient for practical monitoring in combination with ground based
measurements. The practical limitations of applying hyperspectral remote sensing are that for
much of the year vegetation prevents direct reflectance from the soil surface which would
severely hamper any attempt to apply these approaches to much of the landscape.
3.8 SOIL PH
Soil pH is a critical soil property which has importance for a wide range of soil processes
concerning fertility and soil nutrients, water quality (acid deposition and buffering capacity), soil
biology. Soil pH is controlled by a combination of soil mineralogy and land management
(liming) and organic matter composition. Soil pH is typically measured using wet laboratory-
based methods but there are strong relationships between VNIR spectra and soil pH.
3.8.1 Opportunities
The most promising approach for quantifying the state of soil pH using remote sensed methods is
the application of hyperspectral remote sensing in combination with ground-based measurements
(Lu et al., 2013). In their study, Lu et al. (2013) showed that using Hyperion imagery, 60% of
the variation on pH was accounted for by a statistical model fitted between the measured pH of
the field samples and the remote sensing data from the VNIR region. To robustly detect a
change in soil pH, the method for its measurement would need to have a significantly smaller

23
error than that which would be associated with spectral approaches that relay in ground-based
calibration of remote sensed data which could have RMSE values as large as 0.3 pH units (Lu et
al., 2013). So it is unlikely that hyperspectral imagery (in combination with field sampling) could
be used to measure change of soil pH. Based on our literature survey, only one study has
demonstrated that remote sensed data can improve the prediction of soil pH (state) and further
studies are required across a range of soil types to prove that this approach is more generally
applicable.
3.8.2 Can Earth Observation replace field sampling?
It will be necessary to use field sampling to develop the statistical model based on the remote
sensing data for the prediction of soil pH.
3.8.3 Can change be measured?
It is unlikely that change can be measured based on current technology; there are no technologies
in the pipeline that are unlikely to mean that change can be measured by remote methods at
national scale.
3.8.4 Integration with National Surveys?
By capturing hyperspectral remote sensed imagery for periods when cultivated areas are largely
free of vegetation, it would be possible to make more accurate predictions of soil pH in these
areas, but only in regions where ground-based sampling has been undertaken. It would not be
possible to use this approach in year-round, vegetated areas.
3.9 SUMMARY
Table 1 below provides a summary of the most promising earth observation techniques for each
of the soil indicators.

24
Table 1 Summary of most promising remote sensing techniques for a range of soil
indicators.
Indicator Most
promising RS
technique (or
none
available)
Platform Can
detect
state
and/or
change
Will also
require
ground-
based soil
sampling
and analysis
at national
scale?
Further development
required? Practicality or
technical considerations to
be addressed
Organic
carbon and
total N
Hyperspectral Satellite * State
(not
change)
Yes Outcome: smaller errors in
predicting concentrations in
bare soil (partially vegetation
free regions). New satellites
(e.g. HySPIRI) may enhance
spectral signal-to-noise
ratios.
Bulk density None available NA NA NA NA
Soil depth
(and erosion)
InSAR (using
IsBAS)
Satellite Change No This technique needs further
testing before it could be
used to monitor either peat
depth or estimate the
magnitude and extent of soil
erosion.
Total metals
(Cu, Zn, Cd,
Ni)
None available NA NA NA NA
Extractable
K
Radiometric
survey
(gamma
radiation)
Airborne *State
(not
change)
Yes This technique would need
testing in a pilot study –
there are sufficient data
across England and Wales
for this to be undertaken.
Extractable
Mg
Hyperspectral Satellite *Maybe
state (not
change)
Yes This approach needs to be
explored further as there are
currently insufficient data
from England and Wales to
determine whether it could
be effective.
Soil pH Hyperspectral Satellite *State
(not
change)
Yes Smaller errors in predicting
pH values in bare soil (or
partially vegetation free
regions). New satellites (e.g.
HySPIRI) may enhance
spectral signal-to-noise
ratios.
Olsen P None available NA NA NA NA
*the remotely sensed data would most likely be used here as a secondary covariate to reduce the
uncertainty in the prediction of the primary indicator property (measured by ground-based sampling plus
analysis) at locations across the landscape where the remotely sensed data was available, but the primary
soil indicator had not been measured.
NA = Not applicable

25
References
AL-ABBAS, A., SWAIN, P. & BAUMGARD, M. 1972. Relating organic-matter and clay content to multispectral radiance of
soils Soil Science, 114, 477-485.
BAOJUAN, Z. 2008. Using satellite hyperspectral imagery to map soil organic matter, total nitrogen and total phosphorus.
Master of Sience, Indiana Univeristy.
BARET, F., JACQUEMOUD, S. & HANOCQ, J. F. 1993. About the soil line concept in remote-sensing. Advances in Space
Research, 13, 281-284.
BARTHOLOMEUS, H., KOOISTRA, L., STEVENS, A., VAN LEEUWEN, M., VAN WESEMAEL, B., BEN-DOR, E. &
TYCHON, B. 2011. Soil Organic Carbon mapping of partially vegetated agricultural fields with imaging spectroscopy.
International Journal of Applied Earth Observation and Geoinformation, 13, 81-88.
BEN-DOR, E., PATKIN, K., BANIN, A. & KARNIELI, A. 2002. Mapping of several soil properties using DAIS-7915
hyperspectral scanner data—a case study over clayey soils in Israel. International Journal of Remote Sensing, 23, 19.
BLACK, H., BELLAMY, P., CREAMER, R., ELSTON, D., EMMETT, B. A., FROGBROOK, Z., HUDSON, G., JORDAN, C.,
LARK, R. M., LILLY, A., MARCHANT, B., PLUM, S., POTTS, J., REYNOLDS, B., THOMPSON, R. & BOOTH,
P. 2008. Design and operation of a UK soil monitoring network. Science Report – SC060073 Bristol.
CHEN, Y. Y., LIU, Y. L., LIU, Y. F., LIN, A. W., KONG, X. S., LIU, D. F., LI, X. R., ZHANG, Y., GAO, Y. & WANG, D.
2012. Mapping of Cu and Pb Contaminations in Soil Using Combined Geochemistry, Topography, and Remote
Sensing: A Case Study in the Le'an River Floodplain, China. International Journal of Environmental Research and
Public Health, 9, 1874-1886.
CROFT, H., KUHN, N. J. & ANDERSON, K. 2012. On the use of remote sensing techniques for monitoring spatio-temporal soil
organic carbon dynamics in agricultural systems. Catena, 94, 64-74.
D'OLEIRE-OLTMANNS, S., MARZOLFF, I., PETER, K. D. & RIES, J. B. 2012. Unmanned Aerial Vehicle (UAV) for
Monitoring Soil Erosion in Morocco. Remote Sensing, 4, 3390-3416.
DANIEL, K. W., TRIPATHI, X. K. & HONDA, K. 2003. Artificial neural network analysis of laboratory and in situ spectra for
the estimation of macronutrients in soils of Lop Buri (Thailand). Australian Journal Of Soil Research, 41, 47-59.
EMMETT, B. A., REYNOLDS, B., CHAMBERLAIN, P. M., ROWE, E., SPURGEON, D., BRITTAIN, S. A., FROGBROOK,
Z., HUGHES, S., LAWLOR, A. J., POSKITT, J., POTTER, E., ROBINSON, D. A., SCOTT, A., WOOD, C. &
WOODS, C. 2010. Countryside Survey: Soils Report from 2007.: NERC/Centre for Ecology and Hydrology.
FOX, G. A. & SABBAGH, G. J. 2002. Estimation of Soil Organic Matter from Red and Near-Infrared Remotely Sensed Data
Using a Soil Line Euclidean Distance Technique. Soil Science Society of America Journal, 66, 1922-1929.
GE, Y., THOMASSON, J. A. & SUI, R. 2011. Remote sensing of soil properties in precision agriculture: A review. Frontiers of
Earth Science, 5, 229-238.
GLENDINING, M. J., DAILEY, A. G., POWLSON, D. S., RICHTER, G. M., CATT, J. A. & WHITMORE, A. P. 2011.
Pedotransfer functions for estimating total soil nitrogen up to the global scale. European Journal of Soil Science, 62,
13-22.
GOMEZ, C., ROSSEL, R. A. V. & MCBRATNEY, A. B. 2008. Soil organic carbon prediction by hyperspectral remote sensing
and field vis-NIR spectroscopy: An Australian case study. Geoderma, 146, 403-411.
GRUNWALD, S., THOMPSON, J. A. & BOETTINGER, J. L. 2011. Digital Soil Mapping and Modeling at Continental Scales:
Finding Solutions for Global Issues. Soil Science Society of America Journal, 75, 1201-1213.
HENDERSON, T. L., BAUMGARDNER, M. F., FRANZMEIER, D. P., STOTT, D. E. & COSTER, D. C. 1992. High
dimensional reflectance analysis of soil organic-matter. Soil Science Society of America Journal, 56, 865-872.
HOLLIS, J. M., HANNAM, J. & BELLAMY, P. H. 2012. Empirically-derived pedotransfer functions for predicting bulk density
in European soils. European Journal of Soil Science, 63, 96-109.
JABER, S. M., LANT, C. L. & AL-QINNA, M. I. 2011. Estimating spatial variations in soil organic carbon using satellite
hyperspectral data and map algebra. International Journal of Remote Sensing, 32, 5077-5103.
LADONI, M., BAHRAMI, H. A., ALAVIPANAH, S. K. & NOROUZI, A. A. 2010. Estimating soil organic carbon from soil
reflectance: a review. Precision Agriculture, 11, 82-99.
LARK, R. M. 2009. Estimating the regional mean status and change of soil properties: two distinct objectives for soil survey.
European Journal of Soil Science, 60, 748-756.
LU, P., WANG, L., NIU, Z., LI, L. H. & ZHANG, W. H. 2013. Prediction of soil properties using laboratory VIS-NIR
spectroscopy and Hyperion imagery. Journal of Geochemical Exploration, 132, 26-33.
MCGRATH, S. P. & LOVELAND, P. J. 1992. The Soil Geochemical Atlas of England and Wales, Glasgow, Blackie Academic
and Professional.
MINASNY, B., MCBRATNEY, A. B., MALONE, B. P. & WHEELER, I. 2013. Chapter One - Digital Mapping of Soil Carbon.
In: DONALD, L. S. (ed.) Advances in Agronomy. Academic Press.
MINASNY, B., MCBRATNEY, A. B., TRANTER, G. & MURPHY, B. W. 2008. Using soil knowledge for the evaluation of
mid-infrared diffuse reflectance spectroscopy for predicting soil physical and mechanical properties. European Journal
of Soil Science, 59, 960-971.
MULDER, V. L., DE BRUIN, S., SCHAEPMAN, M. E. & MAYR, T. R. 2011. The use of remote sensing in soil and terrain
mapping - A review. Geoderma, 162, 1-19.
NANNI, M. R. & DEMATTE, J. A. M. 2006. Soil line behavior obtained by laboratorial spectroradiometry for different soil
classes. Revista Brasileira De Ciencia Do Solo, 30, 1031-1038.
OWENS, P. N., DEEKS, L. K., WOOD, G. A., BETSON, M. J., LORD, E. I. & DAVISON, P. S. 2008. Variations in the depth
distribution of phosphorus in soil profiles and implications for model-based catchment-scale predictions of phosphorus
delivery to surface waters. Journal of Hydrology, 350, 317-328.
PRACILIO, G., ADAMS, M. L., SMETTEM, K. R. J. & HARPER, R. J. 2006. Determination of spatial distribution patterns of
clay and plant available potassium contents in surface soils at the farm scale using high resolution gamma ray
spectrometry. Plant and Soil, 282, 67-82.

26
RAWLINS, B. G., CIGNA, F., JORDAN, C. J., SOWTER, A., EVANS, C., ROBINSON, D. A. & TEAM, G. 2014. Monitoring
changes in surface elevation of blanket peat and other land cover types using a novel InSAR processing technique.
Geophysical Research Abstracts, Vol. 16, EGU2014-3047, 2014.
RAWLINS, B. G., LARK, R. M. & WEBSTER, R. 2007. Understanding airborne radiometric survey signals across part of
eastern England. Earth Surface Processes and Landforms, 32, 1503-1515.
RAWLINS, B. G., MARCHANT, B. P., SMYTH, D., SCHEIB, C., LARK, R. M. & JORDAN, C. 2009. Airborne radiometric
survey data and a DTM as covariates for regional scale mapping of soil organic carbon across Northern Ireland.
European Journal of Soil Science, 60, 44-54.
RICHARDSON, A. J. & WIEGAND, C. L. 1977. Distinguishing vegetation from soil background information. Photogrammetric
Engineering and Remote Sensing, 43, 1541-1552.
ROERING, J. J., STIMELY, L. L., MACKEY, B. H. & SCHMIDT, D. A. 2009. Using DInSAR, airborne LiDAR, and archival
air photos to quantify landsliding and sediment transport. Geophysical Research Letters, 36.
SELIGE, T., BOHNER, J. & SCHMIDHALTER, U. 2006. High resolution topsoil mapping using hyperspectral image and field
data in multivariate regression modeling procedures. Geoderma, 136, 235-244.
SELIGE, T. & SCHMIDHALTER, U. 2005. Topsoil mapping using hyperspectral airborne data and multivariate regression
modeling. Precision Agriculture 05, 537-545.
SHEPHERD, K. D. & WALSH, M. G. 2002. Development of reflectance spectral libraries for characterization of soil properties.
Soil Science Society of America Journal, 66, 988-998.
SHOSHANY, M., GOLDSHLEGER, N. & CHUDNOVSKY, A. 2013. Monitoring of agricultural soil degradation by remote-
sensing methods: a review. International Journal of Remote Sensing, 34, 6152-6181.
SOWTER, A., BATESON, L., STRANGE, P., AMBROSE, K. & SYAFIUDIN, M. F. 2013. DInSAR estimation of land motion
using intermittent coherence with application to the South Derbyshire and Leicestershire coalfields. Remote Sensing
Letters, 4, 979-987.
STAMATIADIS, S., EVANGELOU, L., BLANTA, A., TSADILAS, C., TSITOURAS, A., CHRONI, C., CHRISTOPHIDES,
C., TSANTILA, E., SAMARAS, V., DALEZIOS, N. & DIMOGIANNIS, D. 2013. Satellite Visible-Near Infrared
Reflectance Correlates to Soil Nitrogen and Carbon Content in Three Fields of the Thessaly Plain (Greece).
Communications in Soil Science and Plant Analysis, 44, 28-37.
STEVENS, A., VAN WESEMAEL, B., BARTHOLOMEUS, H., ROSILLON, D., TYCHON, B. & BEN-DOR, E. 2008.
Laboratory, field and airborne spectroscopy for monitoring organic carbon content in agricultural soils. Geoderma,
144, 395-404.
VISCARRA ROSSEL, R. A., WALVOORT, D. J. J., MCBRATNEY, A. B., JANIK, L. J. & SKJEMSTAD, J. O. 2006. Visible,
near infrared, mid infrared or combined diffuse reflectance spectroscopy for simultaneous assessment of various soil
properties. Geoderma, 131, 59.
WOOD, G. A., LOVELAND, P. J. & KIBBLEWHITE, M. G. 2004. The use of remote sensing to deliver soil monitoring.
London: Defra.
WU, J., LIU, Y. L., CHEN, D., WANG, J. & CHAI, X. 2009. Quantitative mapping of soil nitrogen content using field
spectrometer and hyperspectral remote sensing. 2009 International Conference on Environmental Science and
Information Application Technology, Vol II, Proceedings, 379-382.
Appendix 1
Published literature search criteria
The Excel spreadsheet of criteria used in the Web of Science search engine to search for
published articles related to remote sensing of physical soil properties is summarised in Table 1.
The number of ‘hits’ are the published references found by each search. The references found for
the Search terms shown as grey rows, were downloaded to Endnote to create a database of 3663
published references. If the search terms provided more than 1000 ‘hits’, this was considered too
many ‘hits’ and the search was run again using more defined search criteria

27
Table 1 Excel spreadsheet showing the number of references found using 43 different
search criteria (shown as ‘fields’).
The Excel spreadsheet showing the number of hits for two Web searches and 1 Blog search is
summarised in Table 2. The overall number of references considered to be of relevance was 44.
SEARCH ID Field 1 Field 2 Field 3 Field 4 Hits
1 Soil AND remote sensing AND organic carbon 184
2 Soil AND remote sensing AND geochemistry 22
3 Soil AND remote sensing AND physical OR bulk density 51594
4 Soil AND remote sensing AND bulk density 39
5 Soil AND remote sensing AND soil depth 518
6 Soil AND satellite AND organic carbon 143
7 Soil AND satellite AND geochemistry 6
8 Soil AND satellite AND physical OR bulk density 51594
9 Soil AND satellite AND soil depth 418
10 Soil AND satellite bulk density 20
11 Soil AND airborne AND organic carbon 130
12 Soil AND airborne AND geochemistry 53
13 Soil AND airborne AND physical OR bulk density 51594
14 Soil AND airborne AND bulk density 10
15 Soil AND airborne AND soil depth 158
16 Soil AND hyperspectral AND organic carbon 55
17 Soil AND hyperspectral AND geochemistry 4
18 Soil AND hyperspectral AND physical OR bulk density 51664
19 Soil AND hyperspectral AND bulk density 2
20 Soil AND hyperspectral AND soil depth 59
21 Soil AND LiDAR AND organic carbon 10
22 Soil AND LiDAR AND geochemistry 1
23 Soil AND LiDAR AND physical OR bulk density 51616
24 Soil AND LiDAR AND bulk density 3
25 Soil AND LiDAR AND soil depth 50
26 Soil AND Radar AND organic carbon 26
27 Soil AND Radar AND geochemistry 8
28 Soil AND Radar AND physical OR bulk density 51858
29 Soil AND Radar AND bulk density 24
30 Soil AND Radar AND soil depth 488
31 Soil AND Thermal AND organic carbon 539
32 Soil AND Thermal imagery AND organic carbon 7
33 Soil AND Thermal imagery 239
34 Soil AND Thermal AND geochemistry 2
35 Soil AND Thermal AND physical OR bulk density 51615
36 Soil AND Thermal AND bulk density 1
37 Soil AND Thermal AND soil depth 19
38 Soil AND Microwave organic carbon 57
39 Soil AND Microwave geochemistry 5
40 Soil AND Microwave physical OR bulk density 51804
41 Soil AND Microwave bulk density 22
42 Soil AND Microwave soil depth 318
43 Soil AND Unmanned Aerial Vehicle 23
TOTAL HITS USED FOR LITERATURE REVIEW 3663
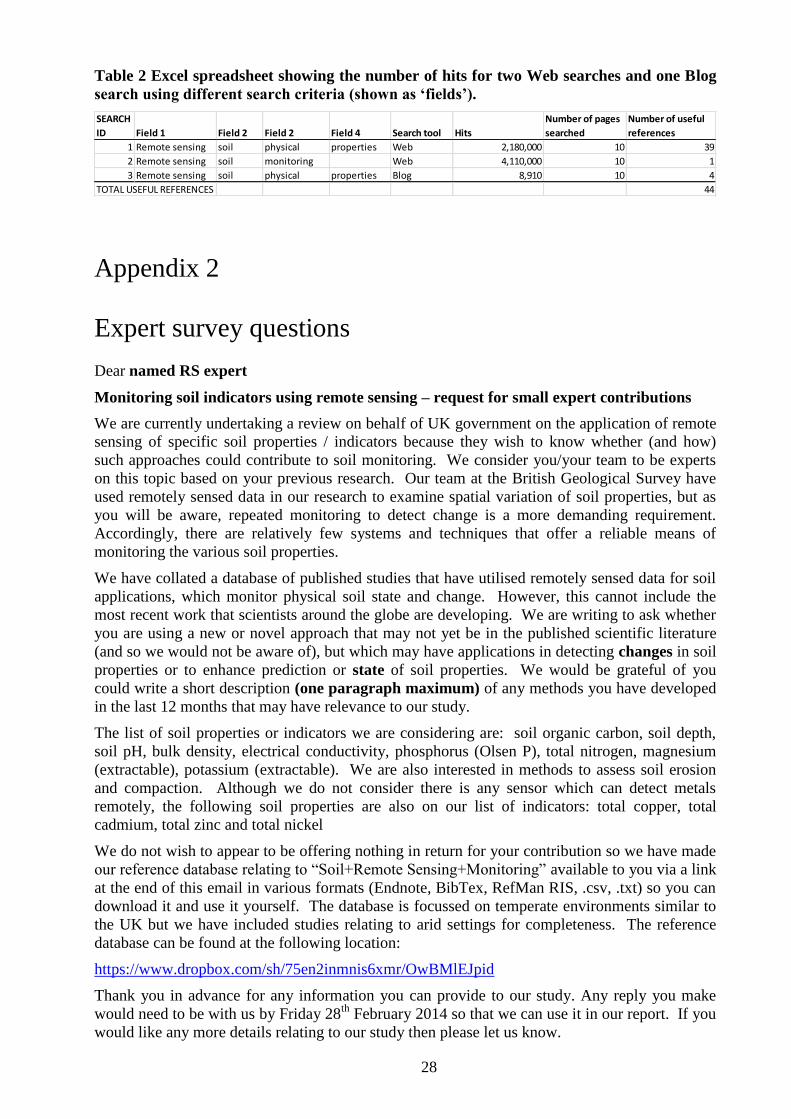
28
Table 2 Excel spreadsheet showing the number of hits for two Web searches and one Blog
search using different search criteria (shown as ‘fields’).
Appendix 2
Expert survey questions
Dear named RS expert
Monitoring soil indicators using remote sensing – request for small expert contributions
We are currently undertaking a review on behalf of UK government on the application of remote
sensing of specific soil properties / indicators because they wish to know whether (and how)
such approaches could contribute to soil monitoring. We consider you/your team to be experts
on this topic based on your previous research. Our team at the British Geological Survey have
used remotely sensed data in our research to examine spatial variation of soil properties, but as
you will be aware, repeated monitoring to detect change is a more demanding requirement.
Accordingly, there are relatively few systems and techniques that offer a reliable means of
monitoring the various soil properties.
We have collated a database of published studies that have utilised remotely sensed data for soil
applications, which monitor physical soil state and change. However, this cannot include the
most recent work that scientists around the globe are developing. We are writing to ask whether
you are using a new or novel approach that may not yet be in the published scientific literature
(and so we would not be aware of), but which may have applications in detecting changes in soil
properties or to enhance prediction or state of soil properties. We would be grateful of you
could write a short description (one paragraph maximum) of any methods you have developed
in the last 12 months that may have relevance to our study.
The list of soil properties or indicators we are considering are: soil organic carbon, soil depth,
soil pH, bulk density, electrical conductivity, phosphorus (Olsen P), total nitrogen, magnesium
(extractable), potassium (extractable). We are also interested in methods to assess soil erosion
and compaction. Although we do not consider there is any sensor which can detect metals
remotely, the following soil properties are also on our list of indicators: total copper, total
cadmium, total zinc and total nickel
We do not wish to appear to be offering nothing in return for your contribution so we have made
our reference database relating to “Soil+Remote Sensing+Monitoring” available to you via a link
at the end of this email in various formats (Endnote, BibTex, RefMan RIS, .csv, .txt) so you can
download it and use it yourself. The database is focussed on temperate environments similar to
the UK but we have included studies relating to arid settings for completeness. The reference
database can be found at the following location:
https://www.dropbox.com/sh/75en2inmnis6xmr/OwBMlEJpid
Thank you in advance for any information you can provide to our study. Any reply you make
would need to be with us by Friday 28th
February 2014 so that we can use it in our report. If you
would like any more details relating to our study then please let us know.
SEARCH
ID Field 1 Field 2 Field 2 Field 4 Search tool Hits
Number of pages
searched
Number of useful
references
1 Remote sensing soil physical properties Web 2,180,000 10 39
2 Remote sensing soil monitoring Web 4,110,000 10 1
3 Remote sensing soil physical properties Blog 8,910 10 4
TOTAL USEFUL REFERENCES 44

29
Yours sincerely,
Barry Rawlins ([email protected]) & Nicole Archer & Stephen Grebby
Table 1 Expert survey participants
Institute Expert
1.GFZ Potsdam Prof S. Chabrillat
2.Wageningen University Dr Harm Bartholemeus
University of Zurich Prof M. Scheipmann
US Department of Agriculture Dr M Moran
Tel-Aviv University Prof E. Ben-Dor
INRA, FRance Cecile Gomez


