94
Identifying candidate antimalarial compounds by searching for molecular mimetics of endogenous parasite metabolites Reis Fitzsimmons Bioinformatics Internship May 16, 2016 to July 20, 2016
| Date post: | 13-Jan-2017 |
| Category: |
Documents |
| Upload: | reis-fitzsimmons |
| View: | 111 times |
| Download: | 1 times |
Identifying candidate antimalarial compounds by searching for molecular mimetics of endogenous parasite metabolites
Reis Fitzsimmons
Bioinformatics Internship
May 16, 2016 to July 20, 2016
2
Table of Contents
1. Summary………………………………………………………………………………..32. Introduction………………………………………………………………………..……43. The Basics of Identification of Antimalarial Compounds……………………..…...…..54. Importance of the ECFP4 Fingerprint and the Tanimoto Coefficient…………..……....75. Determining a Similarity Score………………………………………………..…….….86. Presenting an Objective…………………………………………………………...……107. Basic Review of Procedure……………………………………………………...……...118. Beginning the Process of Collecting Metabolite Data……………………………….....129. Database Searching…………………………………………………………………......1510. More Issues Dealing with Database Searching……………………………………...….1611. Learning KNIME…………………………………………………………………..…...1712. A Change in Strategy……………………………………………………………..…….1813. The Temporary Solution to the Metabolite Problem…………………………………. .1914. Progress Check and Preparation for Workflow…………………………………..……..2015. Explaining the Layout of the Workflow………………………………………..……….2216. The Resolution to the Chemical Identifier Resolver Node……………………..……….2317. Trial-and-Error Using the Workflow…………………………………………..………..2518. The First Results………………………………………………………………..……….2919. Results of the General MetaCyc Metabolites……………………………………..…….3020. Results of the Malaria Metabolites (Excluding Plasmodium falciparum)……….……..3221. Results of the Plasmodium falciparum 3D7 strain…………………………….………..3822. Conclusion About MetaCyc Metabolites…………………………………….…………4023. Statistics of the Molecular Weights of the Compounds…………………….…………..4124. Statistical Inference………………………………………………………….………….4425. Chi-Squared Test of Independence………………………………………….………….4526. The Optimal Malaria Metabolites…………………………………………….………...4727. Statistics of Malaria Metabolites………………………………………………………..4928. Statistical Inference of the Malaria Metabolites………………………………………...5129. Another Chi Squared Analysis………………………………………………………….5230. Three Z-Tests of Sample Means………………………………………………………...5331. Z-Test for the Compounds from Adams et al. and Justin’s List of Antimalarials……....5532. Z-Test for the Compounds from Adams et al. and the Malaria Metabolites…………....5633. Z-Test for Justin’s List of Antimalarials and the Malaria Metabolites…………………5634. Final Conclusions……………………………………………………………………….5735. Discussion………………………………………………………………………………5836. Acknowledgments………………………………………………………………………6037. Works Cited.…………………………………………………………………………….60

3
Summary
The objective is to use KNIME, a cheminformatics workflow platform, to determine
which compounds are promising candidates as antimalarial drug targets from a given list of
antimalarial compounds. Justin Gibbons, one of Dr. Jiang’s doctoral students, created a list of
roughly 284 antimalarial compounds prioritized for a chemogenomics screening project. I used
bioinformatics resources and metabolite databases to determine which compounds would be
most suitable against malaria at a molecular level, based on their similarity with endogenous
compounds generated from parasite metabolic pathways. Compound-metabolite similarity was
measured using the ECFP4 fingerprint and the Tanimoto coefficient. Some databases which I
used to find the metabolite data were MPMP, KEGG Ligand, MetaCyc, BioCyc, PlasmoDB, and
others. It took me a while to come across the right metabolites, but I had to keep redefining my
criteria. The samples had to be chemically diverse and large. I tried a three-tiered approach in
which the first sample would consist of a general list of metabolites from many species, another
consisting of only malaria metabolites, and a final sample consisting of those only derived from
Plasmodium falciparum. Eventually, I found a general list of 4,998 compounds from over 900
species from a scientific paper which discussed small molecule metabolism used for drug
mapping (Adams et al). KNIME showed that none of the metabolites had a great degree of
chemical similarity with any of the antimalarials. I also found many metabolites from the
MetaCyc database. However, they could not be downloaded in the right format due to technical
issues with the database. Therefore, this resulted in poor results when they were processed in the
KNIME workflow. So, I downloaded 250,642 hits from ChEMBL Malaria Data in tab-delimited
format, including SMILES data. KNIME could process this information much more efficiently
compared to the MetaCyc compounds. Surprisingly, no metabolites had a great degree of
chemical similarity compared with the antimalarials. Finally, I ran statistical tests on the
4
molecular weight distributions of all three datasets and found that the compounds from Adams et
al. were significantly different from the antimalarials and the malaria metabolites. However, the
malaria metabolites and Justin’s list of antimalarials showed a significant degree of similarity in
regards to the means of their molecular weight distributions. This was a surprising discovery
considering the low level of chemical similarity between them. In order to find specific drug
targets against Plasmodium, at least millions of metabolites might have to be analyzed through
the workflow. Unfortunately, we do not have enough sufficient information on the annotation of
the genome of Plasmodium falciparum and metabolic pathways of the malaria parasite.
Introduction
A major issue regarding the search for molecular mimetics of antimalarial compounds is
that the number of compounds remains limited and that drug resistance has risen recently.
Malaria has become an ever-growing threat, especially in underdeveloped nations around the
world. Therefore, researchers have had to act quickly and effectively in determining more
antimalarial compounds from endogenous parasite metabolites to replace the current drugs used
in antimalarial therapeutics and medicine. To put this problem into perspective, the US Army
Antimalarial Drug Developmental Program has screened over 200,000 chemical compounds for
antimalarial activity in the last decade (Canfield and Rozman). Of these 200,000 compounds,
only two of them demonstrated greater antimalarial activity than any other known drug against
drug-resistant Plasmodium falciparum. There have been a few other compounds presently being
tested on human subjects that have shown to be more potent. However, Canfield and Rozman
showed that the need for antimalarial compounds is desperately needed because of the low rate
of actual success in antimalarial activity in the drug resistant parasite. In order to prepare for a
better search towards finding the appropriate compounds, biologists must examine molecular

5
mimetics from endogenous metabolic pathways found within the parasite. Molecular mimetics
would be more useful and harder to resist because they would be evolutionarily tied to the
metabolism of the parasite and require a more drastic change in its evolution to create resistance
to the compound. Thus, the modern approach to designing new compounds against complex
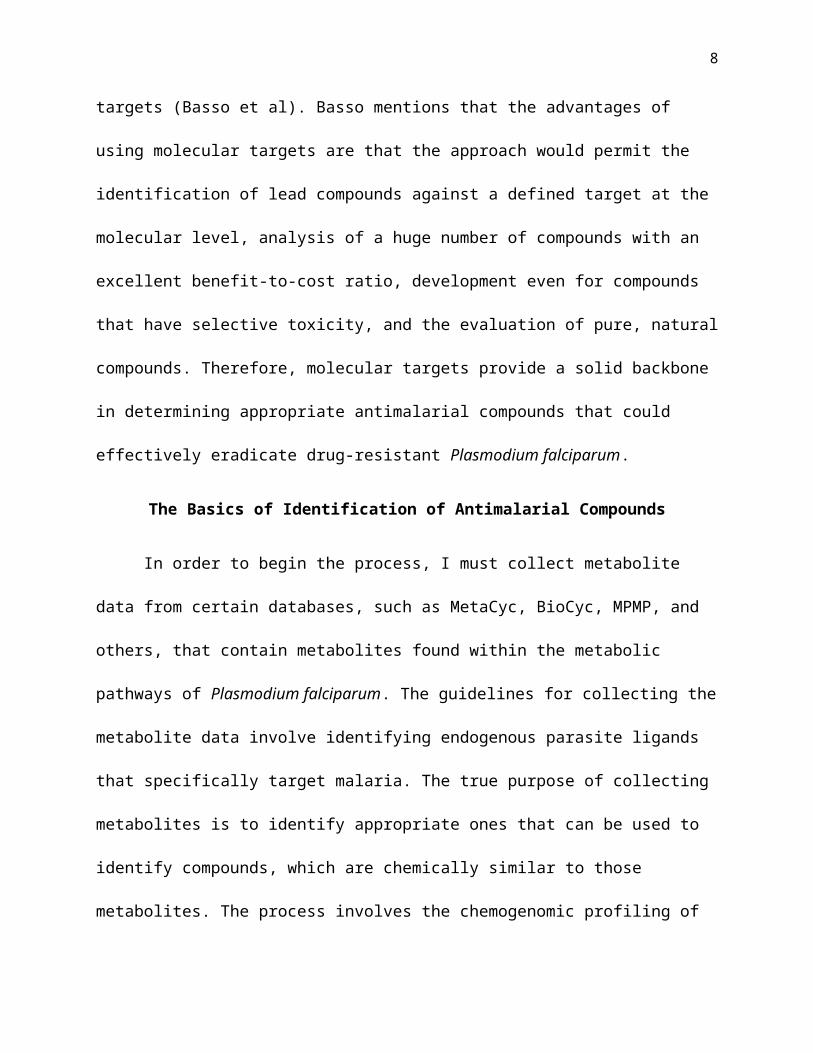
diseases involves the use of molecular targets (Basso et al). Basso mentions that the advantages
of using molecular targets are that the approach would permit the identification of lead
compounds against a defined target at the molecular level, analysis of a huge number of
compounds with an excellent benefit-to-cost ratio, development even for compounds that have
selective toxicity, and the evaluation of pure, natural compounds. Therefore, molecular targets
provide a solid backbone in determining appropriate antimalarial compounds that could
effectively eradicate drug-resistant Plasmodium falciparum.
The Basics of Identification of Antimalarial Compounds
In order to begin the process, I must collect metabolite data from certain databases, such
as MetaCyc, BioCyc, MPMP, and others, that contain metabolites found within the metabolic
pathways of Plasmodium falciparum. The guidelines for collecting the metabolite data involve
identifying endogenous parasite ligands that specifically target malaria. The true purpose of
collecting metabolites is to identify appropriate ones that can be used to identify compounds,
which are chemically similar to those metabolites. The process involves the chemogenomic
profiling of the parasite because it is a well-defined tool that can classify specific drug targets by
comparing drug fitness profiles in a collection of mutants (Pradhan et al). The associations
between genetic changes in the mutants and shifts in drug fitness are helpful in the identification
of novel antimalarial drugs and their mechanisms. Once metabolites have been successfully
identified as potential chemogenomic indicators for antimalarial compounds, then they must be

6
integrated into a workflow run by KNIME. Cheminformaticians usually process and analyze
large libraries of data of small molecules (Beisken et al). Molecules become standardized,
downstream analysis is performed, various descriptors are calculated, and molecular structures
become visualized through the simulation of the workflow. Hence, a workflow-based
cheminformatics resource provides ease-of-use and interpretation between complementary
cheminformatics packages that share similar features. Therefore, this project requires the
assistance of KNIME-CDK, which has functions that allow for molecular conversion between
common formats, fingerprints, generation of signatures, and molecular properties (Beisken et al).
KNIME is based on the Chemistry Development Toolkit and can support a wide range of
chemical classes, which could induce better functionality to the framework of the data.
Workflow environments are necessary for calculating chemical similarity between the
metabolites and compounds because they can interpret data in various formats using different
tools and can override the understanding of a scripting language to concatenate input and output
file formats. KMIME-CDK is unique in that it takes elements of the library’s core functionality
and allows the user to manipulate the data very effectively. Thus, its core library is open and
community-driven (Beisken et al). The KNIME-CDK plug-in has a node repository, workflow
used for calculation of descriptors, and an example row from the out-port view of the Atom
Signatures node (Figure 1). In the workflow, the library is read and filtered for structures
containing phenol groups before counting hydrogen donors and acceptors. At the same time,
MACCS fingerprints and atom signatures become calculated for the atom-filtered molecules.
The plug-in can accept molecules in CML, SDFile, MDL Mol, InChI, and SMILES data formats.
It is also capable of converting the CDK molecule back to its SDFile cell, which could be used
by other plug-ins. KNIME-CDK represents a user-friendly cheminformatics plug-in that
7
produces more efficiency and functionality to the platform through a workflow-based,
community-driven molecule library.
Figure 1. Overview of the KNIME-CDK plug-in (Beisken et al)
Importance of the ECFP4 Fingerprint and the Tanimoto Coefficient
Chemical similarity is determined between the metabolites and the compounds with the
assistance of the ECFP4 fingerprint and the Tanimoto coefficient. The evaluation of chemical
similarity between datasets of molecules is being further studied in recent years due to the
advances in computational combinatorial chemistry (Godden et al). The most popular forms of
expressing molecular structure and properties to calculate chemical similarity between
compounds are binary string representations, called fingerprints (FPs). Fingerprints are popular
for chemists to use because they can identify molecular features in a binary format. They can be
hashed, folded, or keyed, such that each bit is associated with a particular fragment or descriptor
value. The ECFP4 fingerprint is especially effective in determining structural diversity of
8
compounds because it is an extended connectivity fingerprint that encodes a circular substructure
that has a diameter of four bonds (Gardiner et al). Due to its desired diameter, it generally
provides the greatest enrichment when comparing molecular structures. Molecular similarity can
also be assessed in other ways, including a wide array of algorithms and descriptions of
molecular structure and properties. When chemical similarity is calculated, it usually involves
comparisons between molecular fingerprints. The Tanimoto coefficient is a type of metric that
runs pairwise comparisons between different molecules and is the most common estimator for
molecular similarity (Godden et al). The equation for the coefficient is Tc = Nab / (Na + Nb – Nab).
Na means the number of bits set in Molecule 1, Nb is the number of bits set in Molecule 2, and
finally, Nab is the number of bits shared between the two molecules. The ECFP4 fingerprint and
the Tanimoto coefficient are crucial parameters used in calculating the chemical similarity
between the compound and endogenous metabolites to prove which compounds would be best
suited as antimalarial drug targets.
Determining a Similarity Score
Similarity score is important to determine which antimalarial compounds would be most
chemically similar to the endogenous ligands because the score sets an appropriate threshold at
which certain compounds are chosen based on how well they resemble ligands at the molecular
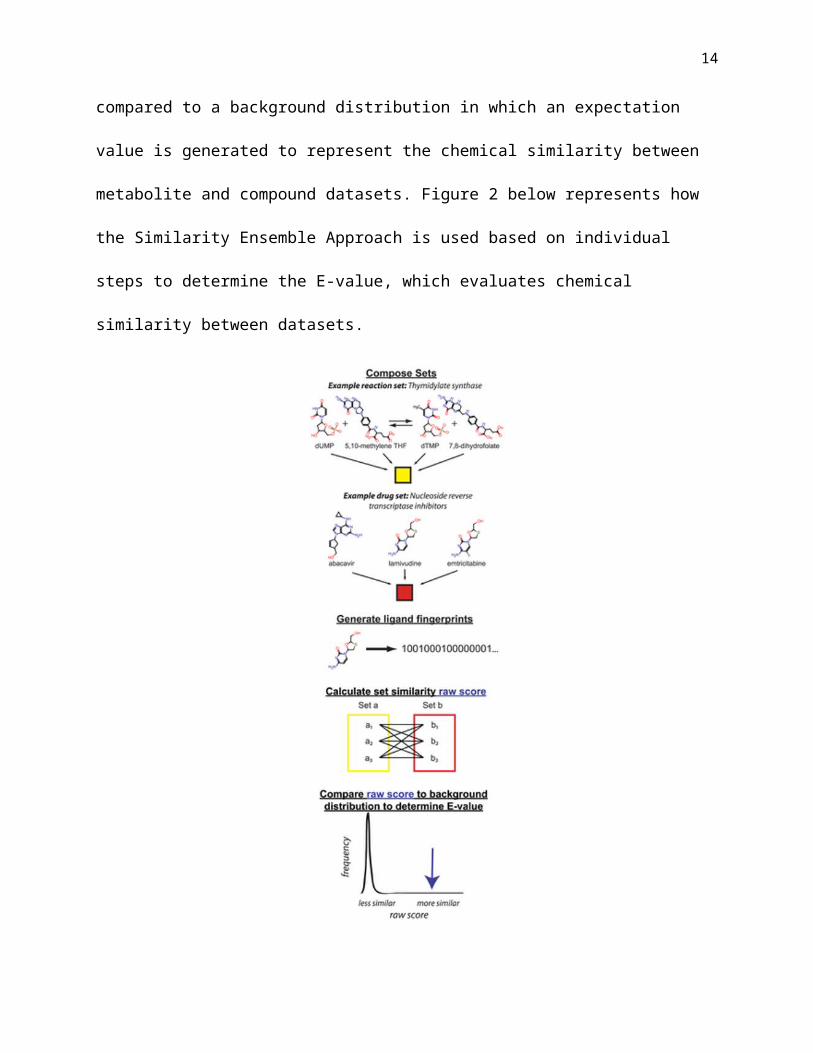
level. The Similarity Ensemble Approach is a useful method to determine similarity scores
because it compares groups of ligands based on bond topology (Adams et al). Bond topology is
measured by the use of molecular fingerprints. Raw scores are determined between compound
sets by calculating Tanimoto coefficients between the fingerprints for all molecular pairs. At last,
raw scores are compared to a background distribution in which an expectation value is generated
to represent the chemical similarity between metabolite and compound datasets. Figure 2 below

9
represents how the Similarity Ensemble Approach is used based on individual steps to determine
the E-value, which evaluates chemical similarity between datasets.
Figure 2. Similarity Ensemble Approach methodology (Adams et al)
According to Adams, an appropriate cutoff value was E = 1.0*10-10 in which 54% of the
drug sets were linked to 0.9% of the metabolic reactions. This E value was inspired by the
BLAST search statistics. The results showed that an appropriate cutoff value must be made in
order to determine a level of significance in which a fair proportion of drug sets were specific for

10
certain targeted metabolic pathways. Adams also hypothesized that since he had to recover
known drug-target interactions, he argued that chemical similarity between MetaCyc reaction
sets and MDDR drug sets could recover these known interactions. Figure 3 highlights Adams’
hypothesis that showed the importance of chemical similarity in hypothesizing that it could be
used to represent known drug-target interactions.
Figure 3. Best hits between the reaction and drug sets (Adams et al)
Presenting an Objective
There are many key steps to developing a successful cheminformatics workflow
approach and determining chemical similarity of antimalarial compounds. The first major step is
designing a clear objective to make a structured outline of the entire project. In order to present a
clear objective, one must explain their objective, claim why it is important, and show how they
will do it. Before conducting research, a scientist must be able to write their outline and have
their peers help them go over it in detail. The list of 284 compounds is unpredictable because

11
some compounds lack annotated information. Therefore, I must compare the compounds to the
endogenous ligands carefully to find the best hits. In my outline, my objective is to compare
these compounds to the reference metabolites and design a workflow in KNIME to create the
most effective specific drug targets. The reason why this is important is because antimalarials are
needed to treat the disease and specific drug targets could help act against certain metabolic
pathways and enzymes in the parasite. As before-mentioned, the ECFP4 fingerprint is necessary
for determining chemical similarity between the compounds and metabolites. I will be able to
achieve my goal by retrieving metabolite data and then creating the workflow based on the
information from the data. I am supposed to read the data, calculate the fingerprint and calculate
the similarity between the two sets. A decent similarity score is crucial for the identification of
antimalarials because it can set an ideal number of these potential candidates. Once the best hits
have been discovered, further workflows might be used for more analysis of the specific drug
targets.
Basic Review of Procedure
The next step for the process of identifying potential candidates as specific drug targets
for malaria is briefly going over the actual procedure to determine them. As recalled, the ECFP4
fingerprint is used for determining chemical similarity by giving a referenced structure to
compare molecules. The Tanimoto coefficient is the central parameter behind these calculations
because it takes into account the atomic coordinates and molecular similarity between sets of
molecules. The measurements will allow for identification of the candidate drug targets based on
chemical similarity between the compound list and reference metabolites retrieved from the
metabolic pathways of malaria. KNIME is the cheminformatics workflow platform that gives
functionality to determining the chemical similarity of the specific drug targets. To collect

12
metabolite data, I must find the appropriate bioinformatics resources and metabolite databases in
order to effectively compare compounds to ideal endogenous ligands found within the parasite’s
metabolic pathways. Some useful databases include PlasmoDB, Uniprot STRING, MPMP, and
many others. As the search continues, the correct database that provides the most relevant data
will be used for the project. If the best hits are eventually discovered, then more analysis could
be performed to annotate them, such as structural analysis, proteomics, organic chemistry
reactions, and ligand interaction networks. It would also be beneficial to research the disease
process and mechanism behind malaria to determine how molecular mimetics will be effective at
preventing the invasion and rupture of red blood cells. Once the project has been complete, then
a new list of the best hits is produced and can show how compounds are selected based on their
molecular mimicry to the metabolites found within Plasmodium. Specifically, Plasmodium
falciparum is being targeted due its hardly known metabolic pathways.
Beginning the Process of Collecting Metabolite Data
When I began my search for collecting the appropriate metabolites, I was first suggested
to get data from MPMP. MPMP stands for Malaria Parasite Metabolic Pathways, which is a
curated database for the metabolic pathways of the Plasmodium genus. Many of the pathways
found in MPMP are relevant to the erythrocytic (red blood cell) phase of the parasite cycle
(Ginsburg). Therefore, the database could prove to be an adequate source of information for
malaria metabolites. Justin mentioned that the key to adequate metabolite information is to
collect a large enough sample to represent the chemical diversity of endogenous ligands found
within the parasite. He mentioned to me that I might have to filter out ATP and other types of
generic metabolites which are not specific to malaria.
An important reference set of drug targets was used in understanding the process of

13
obtaining metabolite data, which was a subset of 246 targets from the MDL Drug Data Report
collection in which ligands were annotated to their respective targets (Adams et al). The sets had
65,241 unique ligands. Adams et al. showed the criteria for which I had to use to select the
appropriate metabolites. According to the paper, they used small molecule drugs which targeted
metabolic enzymes in humans and various pathogens. They usually mimic endogenous ligands in
which their effects could be therapeutic or toxic. Generally, their effects are frequently
unexpected. Perhaps the most important part of Adams et al. was that their project required a
large-scale mapping of the drug space in order to create a guide for novel drug discovery. A main
component of their strategy was grouping drugs and metabolites by their associated targets and
enzymes with ligand-based set signatures which were used to quantify the degree of chemical
similarity. The paper showed an effective manner by which I could use associated drug targets to
easily determine the chemical similarity between the given list of 284 compounds and a diverse
sample of small molecules. The results showed that chemical space had been exploited for drug
targets where successful drug discovery is possible. They created an online resource of
interactive maps linking the drugs to metabolic pathways i.e. MPMP. The 385 species-specific
maps were used to predict the “effect space” of over 900 species and 6000 reactions from the
BioCyc database (Adams et al). The chemical similarity linked between the drug sets and
metabolites which is used for predicting potential toxicity, suggesting routes of metabolism, and
observing drug polypharmacology. Metabolic maps gave interactive navigation of the biological
data on potential drug targets and drug chemistry, currently available for prosecuting the specific
targets. This information has provided me great details on how to obtain the correct metabolite
data and use it to map the appropriate drug targets.
Although Adams et al. prepared me for guidelines to seek the correct metabolites, the
14
paper did not specifically mention malarial metabolites. So, Dr. Jiang sent me another paper
which specifically mentioned the metabolic pathways of Plasmodium falciparum. The abstract
showed that in order to improve existing drugs, one must identify new drug targets and
understand the basis of drug resistance (Cobbold et al). Time-resolved MS-based metabolite
profiling was used as an approach to map molecular perturbations caused by a panel of clinical
antimalarial drugs on Plasmodium falciparum during asexual blood stages. Dihydroartemisinin
was used to disrupt the hemoglobin catabolism within 1 hour of exposure, which caused a
transient decline in hemoglobin-derived peptides. This also disrupted pyrimidine biosynthesis,
leading to susceptibility of Plasmodium falciparum to DNA during the early blood stages. To
effectively control the disease, one should identify novel antimalarial compounds. However, the
information on the modes of action is still limited. Therefore, scientists need to understand the
mode of action and develop new strategies to prevent continued drug resistance. Some of these
methods may include resistance screening, whole-genome sequencing, analysis of changes in
transcriptome expression, and proteomics analysis. Most antimalarials stop the disease by
targeting metabolic enzymes. Metabolic fluxes are sensitive to changes in other biological
processes. Therefore, metabolic approaches are the most effective at identifying specific drug
targets and provide more diverse drug actions on protozoan diseases.
Plasmodium falciparum is the causative agent of the most severe form of malaria.
Targeted metabolic profiling was used to investigate polyamine inhibitors (Cobbold et al). An
untargeted, dual MS approach was used to map drug-dependent perturbations in metabolic
networks of the parasite-infected erythrocytes. The approach provided important information on
the speed of action of the antimalarials, including hierarchy of the metabolic dysregulation
induced by compounds with pleiotropic modes of action. This allowed for dissection of early

15
specific effects of the inhibition of malaria. It is necessary to characterize the metabolic
signatures of existing antimalarial compounds to confirm validity of the approach. Secondly,
metabolic signatures were identified which could help target identification of novel compounds.
Treatments that use the metabolic signatures induce distinct metabolic perturbations, providing a
more accurate approach to identifying the appropriate drug targets. There are potential modes of
action and downstream consequences when these pathways are disrupted.
The conclusion showed that there has been considerable progress in fighting the global
impact of malaria, except that there still remains a need to develop new antimalarial drugs to
avoid the overreliance of existing ones and counter the threat of achievable drug resistance
(Cobbold et al). There has been success of large-scale phenotypic screens for new antimalarial
drugs and new methods developed, so the modes of action of certain inhibitors can be broadly
identified. They became prioritized to find which ones are most needed for optimization. A
metabolomics pipeline is suitable for investigating the modes of action of these compounds with
pleiotropic effects, highly needed for clinical development. The approach has to be combined
with genomics and proteomics approaches to guarantee the identification of specific drug targets
and acceleration of the hit prioritization.
Database Searching
After analyzing the research from Adams et al. and Cobbold et al., I began searching for
the appropriate metabolites through an extensive database search. The first one was MPMP in
which I obtained a list of 1010 compounds. However, Justin felt that the sample was not
chemically diverse enough. Therefore, I needed more information and sharper criteria in finding
the right metabolites. I needed a website with a more accurate built-in search engine. Other
databases, which were suggested to me, were KEGG Ligand and MetaCyc. Adams et al.

16
retrieved their data from MetaCyc, so I decided to use that database instead. If I was unable to
find Plasmodium falciparum-specific endogenous ligands, then I would be required to find
metabolites from other species and map them back to malaria if possible. I eventually found a list
of roughly 5600 polypeptides unique to Plasmodium falciparum, but I knew that I had to
continue finding more metabolites to obtain a chemically diverse dataset. After discussing
options with Justin, he mentioned that polypeptides could be used in the similarity search
although they would not be as significant as classical metabolites. A difficulty encountered was
lack of knowledge in changing the polypeptide file into a CSV format. I could have set up a
pipeline to query the websites directly, but Justin believed that it would not have been desirable
to do so. This method would have been too slow and I would have had less control over the
analysis of the metabolites. I also had to look for metabolites which bind to and are products of
malarial enzymes. Another factor that helped with establishing the right criteria was that I
needed chemical similarity of known antimalarials to predict specific drug targets. The most
frustrating issues involved in my journey to extract the correct metabolites were determining
sharp criteria for the search and file conversions.
More Issues Dealing with Database Searching
There were more issues as I continued my search for these metabolites. For example, the
vast majority of websites which I encountered were not user-friendly since I had to keep
downloading data in their original formats. It got to the point in which Justin instructed me on
how to email the curators of MetaCyc and other databases on what we specifically needed and
see how they could convert the files to CSV if feasible. I was recommended to reference from
Adams et al. as an example of how the data was to be extracted. However, emailing was
confusing and left more questions unanswered than before. The only file formats available from

17
MetaCyc were spreadsheets and SDF file formats. Another idea I developed was to use ligands
from MDDR which was demonstrated in Adams et al. However, Justin informed me that those
researchers had to pay for their ligands. As I kept database searching, I also realized that the
MetaCyc database was part of the larger BioCyc database. The difference between them was that
MetaCyc represented metabolic pathways and the BioCyc database had a collection of general
pathways and genomes. I found another sample of small compounds from different species in
MetaCyc, which contained 4023 of them. However, I did not use it because it was still not large
enough to be chemically diverse to come from a general list of different species. I kept reading
documentation of MetaCyc and KEGG Ligand, but they remained confusing. I emailed more
curators, but continued to get very little results. Justin wanted me to obtain accession numbers,
so I could use them to map the ligands back to malarial enzymes and pathways. However, I did
not know exactly how to get them and eventually had to integrate my information into one zip
folder. I could find the chemical structures and common names, but could not get the accession
numbers due to the stubborn setup of the MetaCyc database.
Learning KNIME
At one point, I downloaded KNIME and started my amateur experience as a
cheminformatician. I knew that my objective was to create a workflow to compare the chemical
similarities between compounds and reference metabolites to obtain best hits. I learned that
nodes had specific functions and that most of them were used to read and write in different file
formats. I noticed that KNIME had a database reader that could be used to transfer data from
MetaCyc if conversion to a CSV file might be too difficult to do or simply the fact that the
database is not user-friendly. There were still many questions about using KNIME and I knew
18
that playing with the nodes was my only way of ensuring how to complete an effective
workflow.
A Change in Strategy
After unsuccessful searching for the metabolite data, I decided to change my strategy.
Instead of targeting specific databases, it was wiser to find metabolites from any source since
many of the databases had metabolites shared by many species in common. I also decided that
building an effective workflow would require the files to be in SDF or text file instead of CSV
because they could provide the structural characteristics and annotation of each compound per
row. Another method I tried using was the Special Smart Tables found in MetaCyc. Since
accession numbers were unavailable, I used common names and SDF files due to the constraints
of file conversion from the database. Justin recommended me to add more samples from humans
and species of yeast to increase chemical diversity. Another limitation to the metabolite data
search was that MetaCyc would soon go private and lose its government funding. Therefore, my
project had to be completed within a short amount of time although the date for MetaCyc to go
private was never clarified. Another change in strategy was that the metabolites would be from
different species in different files and to figure out why there were so few malaria metabolites in
MetaCyc. Separate files proved to be effective since SDF files were considered non-human-
friendly. Eventually, I discovered 1843 compounds in Homo sapiens, 1198 compounds in
Saccharomyces cerevisiae 5288c, 529 compounds in Plasmodium berghei ANKA, and 577
compounds in Plasmodium vivax Sal-1. I also had the general list of 4023 compounds from
earlier, 5603 polypeptides and 660 compounds in the Plasmodium falciparum 3D7 strain, and the
4,998 unique metabolites detected in Adams et al. After combining all results, I realized that I
had roughly 15284 total possible ligands if there was no overlap. Justin also brought up the idea

19
that files should be kept separate at first when being run through the workflow in KNIME and
have them combined together after the data source is annotated. Although this change in strategy
improved finding metabolite data tremendously, it was still very unorganized and the files were
in many different, confusingly convertible formats. Therefore, a final redo had to be made to
obtain organized, diverse metabolite data.
The Temporary Solution to the Metabolite Problem
Although my strategy helped improve the metabolite search, it did not facilitate the
organization of the data. Justin thought of the final solution in which we would use a three-tiered
approach. He suggested that the first tier would consist of a general Smart Table of metabolite
data from every species in the MetaCyc database, the second tier would be malaria specific (all
species of Plasmodium), and finally the last tier would be made of Plasmodium falciparum
metabolites. I returned to the database and retrieved 13,191 compounds from all species. I used a
Special Smart Table in which I generated a spreadsheet file and a separate SDF file for each
category of metabolites. There were also 12,997 polypeptides found from the database and
another 8,038 additional pathway compounds. This produced a total of a possible 34226 possible
ligands if no overlap exists. The next tier involved the Plasmodium genus. MetaCyc only has
metabolite data from the following species: P. berghei ANKA, P. chabaudi, P. falciparum 3D7,
P. vivax Sal1, and P. yoelii yoelii 17XNL. Plasmodium berghei contained 12,238 polypeptides,
476 regular compounds, and an additional 580 pathway compounds. P. chabaudi had 527 regular
compounds, 579 additional ones from pathways, and 15011 polypeptides. Due to errors in
downloading, I could not obtain the polypeptides. Then P. falciparum 3D7 had 5603
polypeptides, 660 normal compounds, and 736 pathway compounds. P. vivax Sal-1 had 577
compounds, 631 ones retrieved from pathways, and 5344 polypeptides. P. yoelii yoelii 17XNL
20
contained 557 regular compounds, 607 pathway-derived ligands, 7865 polypeptides. Excluding
the polypeptides that could not be downloaded from P. chabaudi, there were a total of 36980
metabolites specific to malaria. The reason that it seemed that I retrieved more metabolites
specific to malaria than general compounds is because MetaCyc does not allow one to retrieve
compounds from all species from the database. Instead, the curators only allow a general list of
universal metabolites found amongst all species. Therefore, many of these numbers are only
exaggerated since overlap is not factored. If overlap of compounds between the species of
malaria was factored, the actual quantity of metabolites would be much lower. However, the
database does not offer the number of shared compounds between malarial species. Once again,
the curators did not make the website user-friendly enough for cheminformaticians to obtain the
most accurate numbers. As a review, I designed a table that contains the number of compounds
and polypeptides obtained for each tier. Table 1 below shows the total amount of compounds and
polypeptides that were used in the KNIME workflow.
Table 1. Number of polypeptides and compounds for general sample, malaria sample, and Plasmodium falciparum sample obtained from MetaCyc
General Malaria Plasmodium falciparum
Overall total
Polypeptides 12997 31050 5603 49650Compounds 21284 5930 1396 28610
Total metabolites 34281 36980 6999 78260
Progress Check and Preparation for Workflow
After successfully determining the most suitable metabolite data that I could retrieve, I
organized everything into 12 files, six SDF and six common name files. They were divided into
all compounds and polypeptides and again divided into those from general species, malaria-
specific, and Plasmodium falciparum-specific. Then I reported my notes and progress report to
Dr. Jiang to get feedback. I discussed my main objectives and how I retrieved the metabolite

21
data. We also discussed the future of the pipeline in KNIME. Justin also mentioned he would
help me determine an appropriate cutoff score for identifying ideal candidates to act as molecular
mimetics. As recalled from Figure 1, we decided that it would be the template for the workflow
in KNIME. However, Justin suggested that I would need to add an extra filter node for redundant
compounds. I might not even use the element filter or the atom signatures if I only require the
ECFP4 fingerprint. Another idea was that the template used MACCS instead of the ECFP4
fingerprint, so I had to substitute it. I also researched the element filter and the atom signatures to
find their purpose and determined if they would help identify appropriate drug targets. I realized
that the template from Figure 1 was designed to read a molecule library and filter for structures
containing phenol groups before counting hydrogen acceptors and donors (Beisken et al). Due to
the simplicity of the workflow that I designed, I wouldn’t require the element filter or the atom
structures because none of the molecules had a defined element and I was not concerned with
how the hydrogen and carbon atoms were neighbored with each other within a given molecule.
Instead, I developed a simplistic layout of what the workflow would look like. Figure 4 below
shows the rough layout of the workflow.
Figure 4. Basic Layout of Cheminformatics Workflow in KNIME

22
Explaining the Layout of the Workflow
The layout of the workflow shown in Figure 4 highlights the steps needed to identify the
best hits. First, compounds and metabolites must be read based on their file format. Since
Justin’s compounds were not in SDF, I decided to use a general file reader for his data. For my
metabolites, I decided to use the SDF file reader node to examine the structural annotation of
each metabolite. Before the compounds can be compared to the metabolites in the ECFP4
fingerprint, the metabolites must be processed by a chemical identifier resolver. In KNIME, a
chemical identifier resolver does the job of converting chemical structures to different file
formats. In the case of filtering redundant metabolites, Justin felt that it would be best to convert
my SMILES data to InChI format. A useful tool is UniChem, an extension of InChI-based
compound mapping (Chambers et al). UniChem is a low-maintenance compound identifier
mapping service found online which has ‘Connectivity Search.’ This allows for molecules to be
matched based on their structural identity between the connectivity layer of their Standard
InChIs. The remaining layers become compared to show stereochemical and isotopic differences.
Unlike SMILES, InChI was designed to compare molecules on different types of structural
specification. Even the chemical name of the compound is enough to identify it from other
compounds using InChI file formats. As a bonus, the features of the Standard InChI had been
exploited to provide more functionality for UniChem and allow for mappings between molecules
that have the same atom connectivity. This allows for the user to define their own criteria for
molecular equivalence since criteria can vary between users and areas of expertise. After
metabolites have been changed to InChI file format and filtered for redundancy, then the
compounds and metabolites can be compared using the ECFP4 fingerprint to determine

23
Tanimoto coefficients between the datasets. The Fingerprint Similarity node functions by
calculating the Tanimoto coefficients to represent the chemical similarity between the
compounds and the metabolites. Then the Statistics node could be used to analyze the Tanimoto
coefficients and determine measures of central tendency. From there, the final node could
produce a histogram to graphically represent the data of the Tanimoto coefficients. This would
be used to assess which compounds are potential candidates to be identified as best hits. Despite
several kinks and the lack of practical experience in cheminformatics, the layout showed an
appropriate depiction of the steps required to identify specific drug targets for malaria.
The Resolution to the Chemical Identifier Resolver Node
The previous issue mentioned before was that I was having difficulty finding the right
node to convert SMILES data to Standard InChI. After extensive searching, I came across the
CIR (Chemical Identifier Resolver) KNIME integration node, created by the CADD group of
NCI and NIH. Being installed from the trusted extension, the CIR node became added to the
SDF file reader node for interpreting the structural annotation of the SDF files of the metabolites.
Its basic function is to allow conversion between different chemical structure identifiers.
Although this node is useful for the conversion of the structural annotation, it cannot simply filter
the redundant compounds by itself. With further investigation, I found the GroupBy node which
has the function of grouping rows of a table by the unique values in the selected group columns
of a file. An output table is generated based on the fact that each row is made for each unique
value combination of the selected group columns. This technique would be critical for filtering
the data to detect which compounds might be unique, or in this sense, redundant. Another
dilemma I faced was that I could not connect the file reader node for the antimalarial compounds
and the GroupBy node for the metabolites to the same fingerprint node. Therefore, the workflow

24
must accommodate the problem by having two fingerprints, one for each dataset instead. It
would be a better approach because then each fingerprint can accurately model the molecular
representation of each dataset of compounds. The Fingerprint Similarity node can be used to
integrate the overall data and calculate the final Tanimoto coefficients to identify the best hits. A
question that developed over time was if the fingerprint nodes were specifically ECFP4. I found
that by configuring their internal details, I could manipulate both fingerprints to follow an
extended connectivity of 4. If it was not possible, then I was suggested to use the Morgan
Fingerprint and set the radius to 2. The difference is that ECFPs are based off of extended
connectivity while Morgan fingerprints follow the older Morgan algorithm. In the Morgan
algorithm, an iterative process assigns numeric identifiers to each atom in a given molecule
(Rogers and Hahn). Identifiers are independent of the original number of atoms. The process of
the algorithm becomes continued until every identifier is considered unique. The ECFP
fingerprints on the other hand follow certain changes to the original Morgan algorithm. ECFP
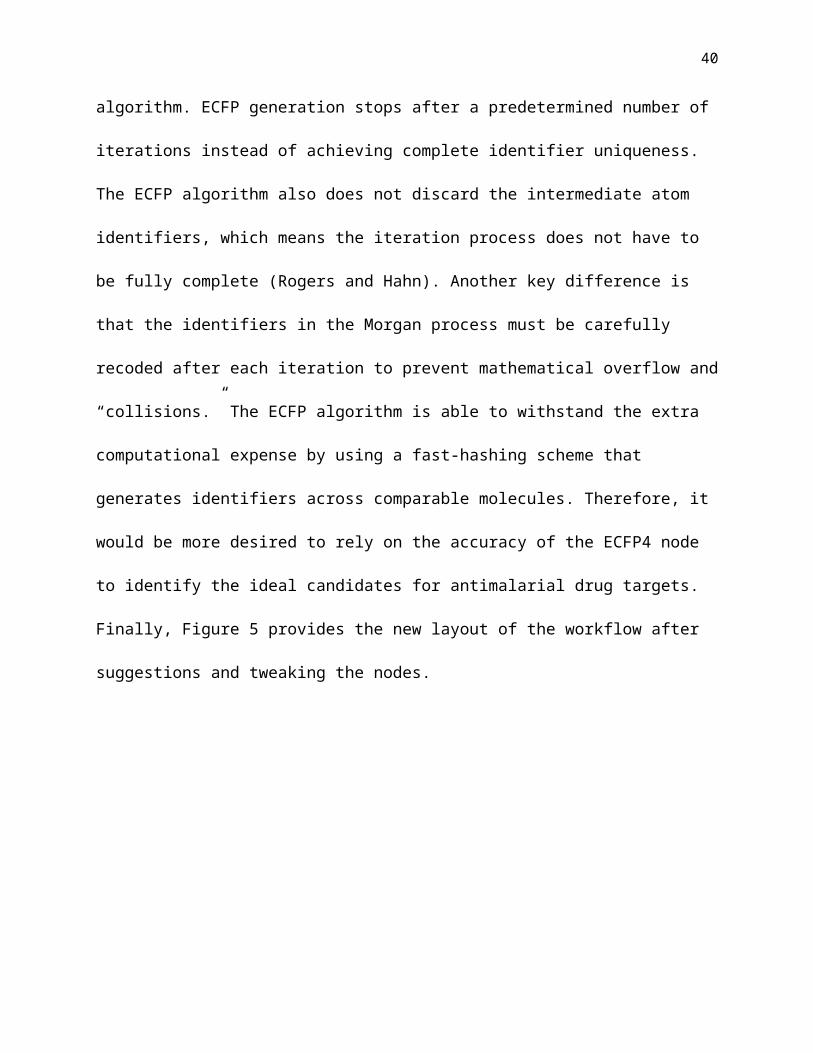
generation stops after a predetermined number of iterations instead of achieving complete
identifier uniqueness. The ECFP algorithm also does not discard the intermediate atom
identifiers, which means the iteration process does not have to be fully complete (Rogers and
Hahn). Another key difference is that the identifiers in the Morgan process must be carefully
recoded after each iteration to prevent mathematical overflow and “collisions.” The ECFP
algorithm is able to withstand the extra computational expense by using a fast-hashing scheme
that generates identifiers across comparable molecules. Therefore, it would be more desired to
rely on the accuracy of the ECFP4 node to identify the ideal candidates for antimalarial drug
targets. Finally, Figure 5 provides the new layout of the workflow after suggestions and tweaking
the nodes.
25
Figure 5. New Improved Layout of KNIME Workflow
Trial-and-Error Using the Workflow
Although the workflow appeared to be functional, trial-and-error showed that there still
had to be more improvements. The majority of files I tried to use were Excel or text which were
processed by the CIR and Fingerprint nodes as SDF input. However, I had trouble with their
conversion. Then I tried using a different node to interpret the data into proper SDF input.
Instead of directly attaching either file reader to a Fingerprint or CIR node, I found that the SDF
input required the Molecule to CDK node because it can convert the elements in one of the input
table’s columns to usable molecules, such as CDKCell. The changed format allows for the
dataset to be read as molecules in further computations in the KNIME workflow. Once the data
has been read, then the analysis can be complete. The Fingerprint and CIR nodes can therefore
accept the text file when it has been converted through the Molecule to CDK node. Figure 6
shows an improved workflow below.

26
Figure 6. Workflow After Adding Molecule to CDK Nodes
I encountered more issues when I realized that the metabolite data could not be read in
the right format or perhaps it might have not been organized enough for the workflow to process.
Therefore, I tried to use more compatible data using the structural annotations of 4,998
compounds from Adams et al. The workflow was then able to give the different measurements of
the Tanimoto coefficients for each compound. However, I believed that another change in
approach had to be necessary. Perhaps I would need a dataset from a scientific paper instead of
the regular MetaCyc data which I had used. Figures 7 and 8 show the success of the workflow
after its first run using Adams et al. and a portion of a table showing all the compounds that had
their Tanimoto coefficients measured.

27
Figure 7. Success of Workflow Using Adams et al. Compounds
Figure 8. Table of Compounds and Their Tanimoto Coefficients (Adams et al)
Unexpectedly, I found that the metabolite data should be read by the file reader. It
seemed that the main issues were rather the filtering of the redundant compounds and that the

28
Statistics node had no apparent use in producing the statistics for the histogram. I tried reading
the nodes more carefully and produced a modified workflow (Figure 9).
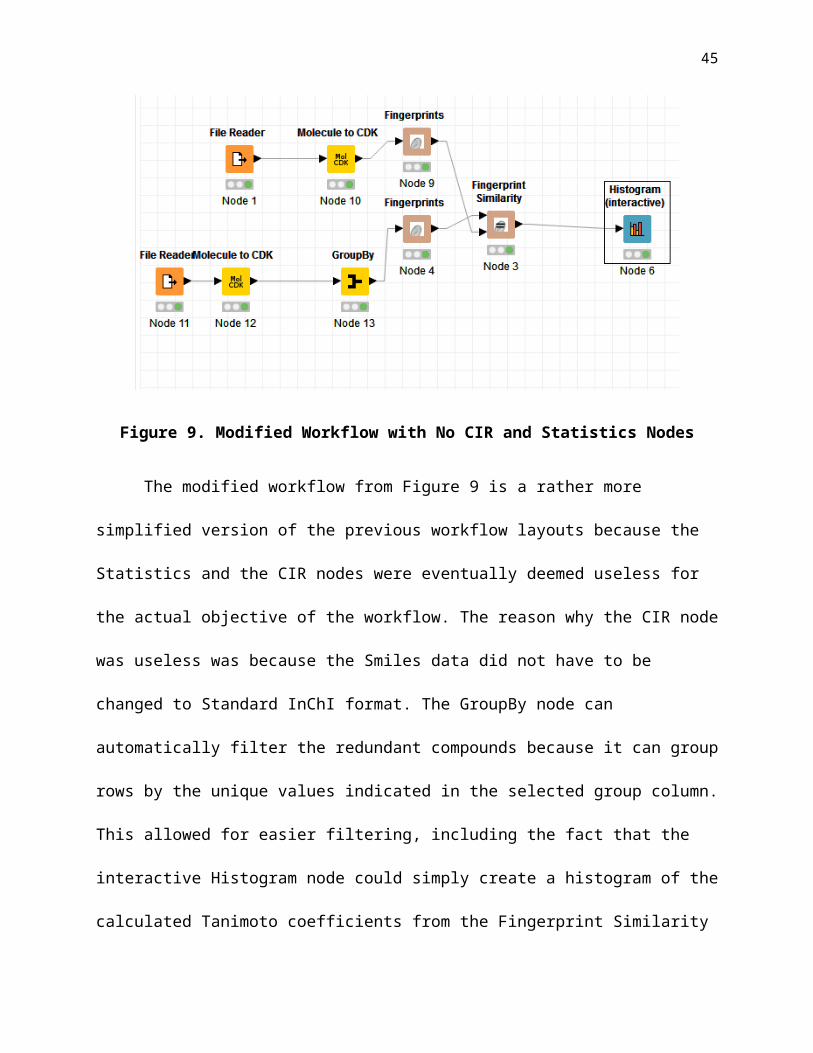
Figure 9. Modified Workflow with No CIR and Statistics Nodes
The modified workflow from Figure 9 is a rather more simplified version of the previous
workflow layouts because the Statistics and the CIR nodes were eventually deemed useless for
the actual objective of the workflow. The reason why the CIR node was useless was because the
Smiles data did not have to be changed to Standard InChI format. The GroupBy node can
automatically filter the redundant compounds because it can group rows by the unique values
indicated in the selected group column. This allowed for easier filtering, including the fact that
the interactive Histogram node could simply create a histogram of the calculated Tanimoto
coefficients from the Fingerprint Similarity node. Another feature was that the Fingerprint
Similarity node was set on minimum similarity to generate the most results possible. The Adams
et al. compounds became ran again to be able to produce the first histogram of this project.

29
Figure 10 shows the first accurate histogram performed by the cheminformatics platform
workflow in KNIME.
Figure 10. Histogram Results of Adams et al. Compounds
The First Results
Although Adams et al. was not actually the most ideal sample for determining chemical
similarity for antimalarial drug targets, the diverse chemical sample still provided a useful
depiction of the accuracy of the workflow results. Of the 4,998 compounds which became
filtered from the original dataset extracted from over 900 species, GroupBy lowered the number
to 3593. Based on the histogram from Fig. 10, over half of the compounds had less than 5.1%
chemical similarity with the antimalarial compounds. This was not a surprising result due to the
fact that Adams et al. went after several different species-specific pathogens instead of only
malaria. Only one compound was found to be in the most chemically similar category between
30
4.59% and 5.1%. Since there were no compounds that were found to have over 5.1% chemical
similarity, the metabolites extracted from Adams et al. showed that even a very chemically
diverse sample designed for various human pathogens is still unable to determine candidate
antimalarial drug targets. Based on the observations of the histogram, it would be best to
conclude that we would require metabolites that share at least 25 to 30% chemical similarity
before they can be considered as ideal candidates as molecular mimetics to the malaria parasite.
Results of the General MetaCyc Metabolites
KNIME processed 21,284 compounds and 12,997 polypeptides taken from the MetaCyc
database. The files were separated into the 12,997 polypeptides, a general list of 13191
compounds, and 8093 additional ligands retrieved from pathways. However, there might have
been overlap between the 8093 additional ligands retrieved directly from pathways and the
general list of 13191 compounds. The first sample to be processed was the 12,997 polypeptides.
The GroupBy node filtered the redundant polypeptides down to 42 and allowed for the buildup
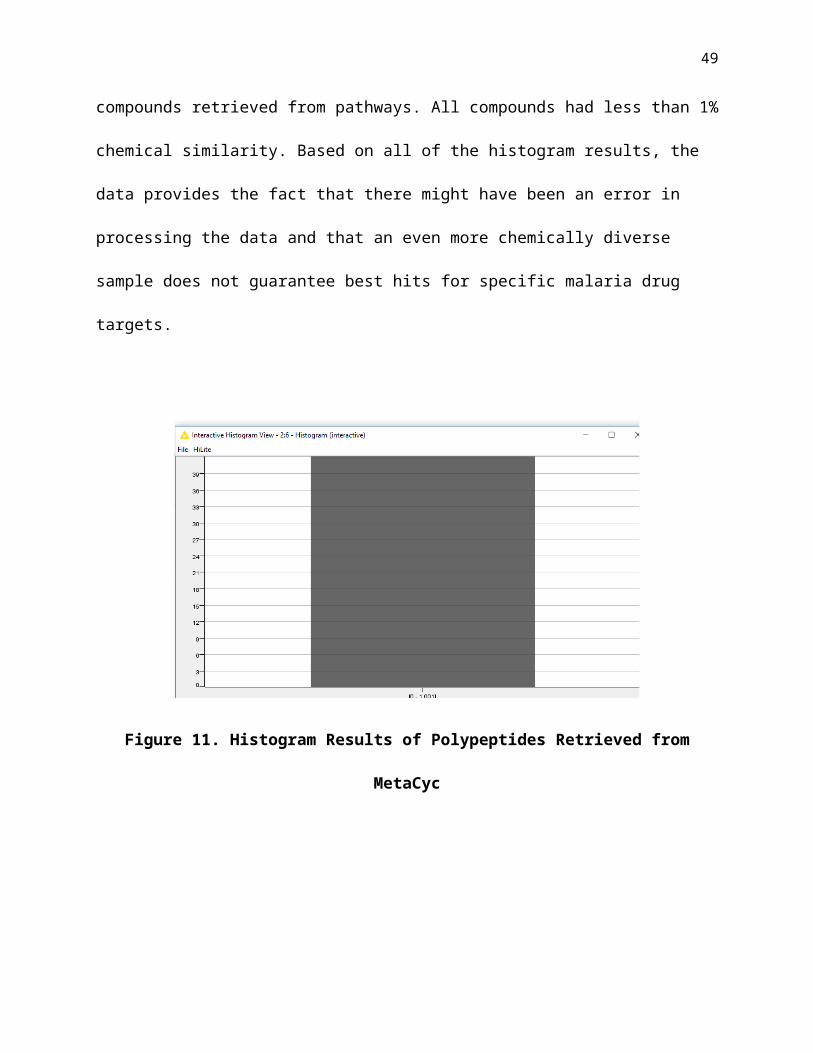
of the molecular fingerprint. Figure 11 provides the histogram for the list of polypeptides
retrieved from the MetaCyc database. All 42 polypeptides had less than 1% chemical similarity
with each of the antimalarial compounds. Next, the list of 13191 compounds were ran through
the workflow. This time the redundant compounds became filtered down to 43. Figure 12 shows
the results of the histogram representing the general list of MetaCyc compounds. Once again, all
compounds had less than 1% chemical similarity. Finally, the sample of 8093 additional
compounds was ran for histogram results. 8093 compounds were filtered down to 34. Figure 13
provides the histogram results of the additional compounds retrieved from pathways. All
compounds had less than 1% chemical similarity. Based on all of the histogram results, the data
31
provides the fact that there might have been an error in processing the data and that an even more
chemically diverse sample does not guarantee best hits for specific malaria drug targets.
Figure 11. Histogram Results of Polypeptides Retrieved from MetaCyc
Figure 12. Histogram Results of General List of MetaCyc Compounds

32
Figure 13. Histogram Results for Additional Pathway Compounds
Results of the Malaria Metabolites (Excluding Plasmodium falciparum)
The malaria metabolites were run through KNIME divided into the 5930 compounds and
31050 polypeptides. Since Plasmodium falciparum was excluded, the files were separated based
upon species. They were further split into the groupings of polypeptides, general compounds,
and additional compounds retrieved from pathways. The four species involved were P. berghei
ANKA strain, P. chabaudi, P. vivax Sal1, and P. yoelii yoelii 17XNL. P. berghei ANKA has
12,238 polypeptides, 476 general compounds, and 580 pathways compounds. P. chabaudi has
527 general compounds and 579 compounds retrieved from pathways. As mentioned earlier, the
15011 polypeptides could not be retrieved based on technical issues with MetaCyc. P. vivax Sal-
1 has 577 normal compounds, 631 pathway-derived compounds, and 5344 polypeptides. P.
yoelii yoelii 17XNL has 557 regular compounds, 607 pathway-derived compounds, and 7865
polypeptides.
P. berghei ANKA was processed through KNIME. Its 12238 polypeptides were filtered
down to 4. Figure 14 shows the histogram outcome of the polypeptide data. Next, the regular

33
compounds of this species were processed. 476 compounds were filtered to 18. The histogram
data is provided in Figure 15. The pathway compounds were finally processed. Of the 580
pathway-derived compounds, the filtered number became 19. The histogram data is shown below
in Figure 16. All histograms showed a chemical similarity of 1% or below for all filtered
metabolites.
Figure 14. Histogram Results for P. berghei ANKA polypeptides

34
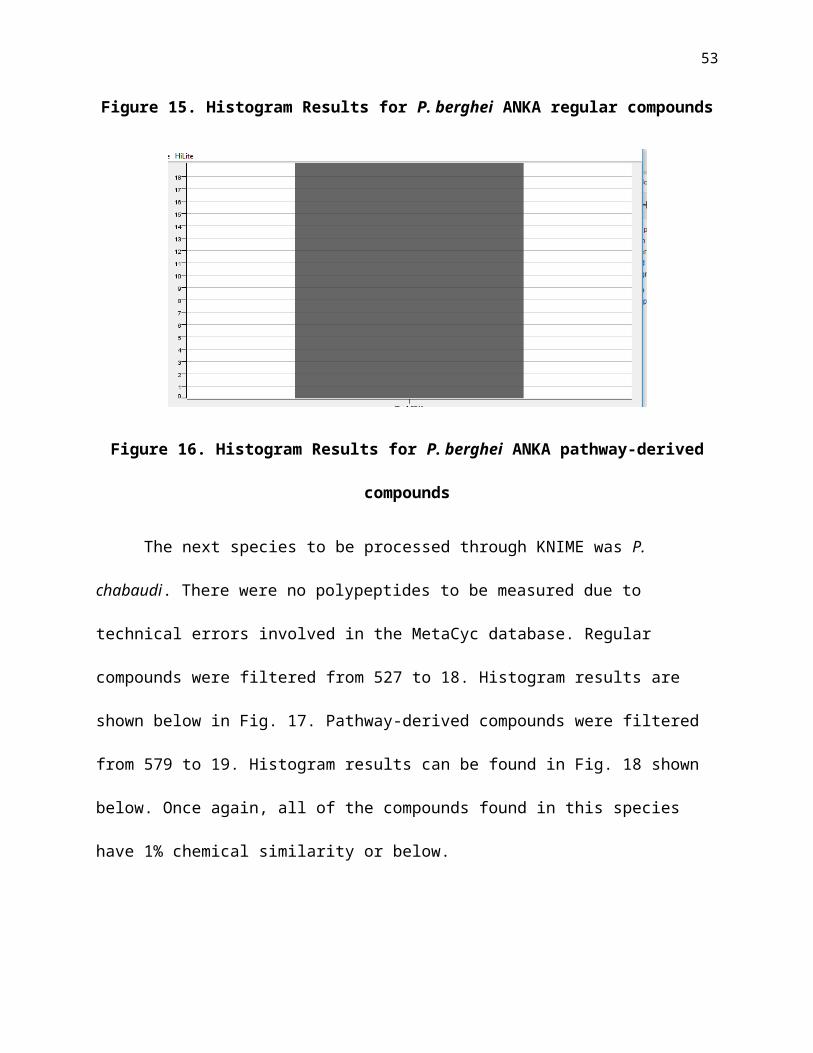
Figure 15. Histogram Results for P. berghei ANKA regular compounds
Figure 16. Histogram Results for P. berghei ANKA pathway-derived compounds
The next species to be processed through KNIME was P. chabaudi. There were no
polypeptides to be measured due to technical errors involved in the MetaCyc database. Regular
compounds were filtered from 527 to 18. Histogram results are shown below in Fig. 17.
Pathway-derived compounds were filtered from 579 to 19. Histogram results can be found in
Fig. 18 shown below. Once again, all of the compounds found in this species have 1% chemical
similarity or below.

35
Figure 17. Histogram Results for P. chabaudi regular compounds
Figure 18. Histogram Results of P. chabaudi pathway-derived compounds
P. vivax Sal1 was also processed through the workflow. The polypeptides were filtered
from 5344 to 6. Figure 19 shows the histogram results of the polypeptides for this species. The
regular compounds were filtered from 577 to 19. Figure 20 provides the histogram results of the
compounds. The pathway-derived compounds were filtered from 631 to 4. Figure 21 provides

36
the histogram results of the pathway-derived compounds. All filtered metabolites showed
chemical similarity of 1% or below.
Figure 19. Histogram Results of P. vivax Sal1 polypeptides
Figure 20. Histogram results for P. vivax Sal1 regular compounds
37
Figure 21. Histogram Results for P. vivax Sal1 pathway-derived compounds
Lastly, P. yoelii yoelii 17XNL was processed through KNIME. The polypeptides were
filtered from 7865 to 8. Fig. 22 provides the histogram outcome for the polypeptides. The regular
compounds were filtered from 557 to 19. The histogram for these results can be found in Fig. 23.
The pathway-derived compounds were filtered from 607 to 20. The histogram for these results
can be found in Fig. 24. All filtered metabolites showed chemical similarity between 0% and 1%.
Figure 22. Histogram Results for P. yeolii yoelii 17XNL polypeptides

38
Figure 23. Histogram Results for P. yoelii yoelii 17XNL regular compounds
Figure 24. Histogram Results for P. yoelii yoelii 17XNL pathway-derived compounds
Results of the Plasmodium falciparum 3D7 strain
Plasmodium falciparum is the specific target for the antimalarial drug targets because it is
the species which generates the deadliest type of malaria. The parasite has a total of 5603
polypeptides and 1396 compounds retrieved from MetaCyc. 5603 polypeptides, 660 regular

39
compounds, and 736 pathway-derived compounds were run through the workflow to collect
information on the chemical similarity of the parasite’s metabolites. The number of polypeptides
reduced to 4 after being filtered by GroupBy. Histogram results are provided below in Fig. 25.
The number of regular compounds decreased to 20 after being filtered. Histogram results are
shown in Fig. 26. Pathway compounds dropped to 19 after GroupBy filtered the data. Histogram
results are shown in Fig. 27. All of the filtered metabolites showed chemical similarity less than
1%.
Figure 25. Histogram Results for P. falciparum 3D7 polypeptides
40
Figure 26. Histogram Results for P. falciparum 3D7 regular compounds
Figure 27. Histogram Results for P. falciparum 3D7 pathway-derived compounds
Conclusion About MetaCyc Metabolites
Based on all histogram results, every single compound retrieved from the MetaCyc
database showed no more chemical similarity than 1%. Since the range for chemical similarity
for the metabolites extracted from Adams et al. was from 0% to 5.1%, there must have been an

41
error in how the data was set up. This observation showed that MetaCyc is not a user-friendly
database and does not offer efficient means in extracting its data. Other indicators of this
technical issue were extremely low filtered numbers of ligands and single bar histograms.
Logically, a sample of malaria metabolites should render higher chemical similarity on average
than the compounds from Adams et al. Therefore, malaria metabolites have to be derived from a
scientific paper which has the data organized the same way as Adams et al. It is also
recommended to determine how the Adams et al. compounds were filtered based on the range of
their molecular weight. The range for their molecular weights could be measured using the
Molecular Properties node to determine the appropriate range of molecular weights for the
malaria metabolites. Further searching for the appropriate malaria metabolites was advised to get
better results.
Statistics of the Molecular Weights of the Compounds
After discussing the results with Justin, he suggested that if I can find better results, I
should find malaria metabolites which are similar in molecular weight to the 4,998 compounds
which I ran through the workflow (Adams et al). Molecular weight is probably the most
significant factor in determining chemical similarity because molecular weight can influence the
degree of similarity based on common physical features. Therefore, I was advised to determine
the statistics of the 4,998 compounds and the list of antimalarial compounds to characterize the
range of molecular weights of both molecular datasets. Then I can use the statistics of the
datasets to create a more accurate depiction of the next malaria metabolite data.
I designed two workflows in KNIME, one for the list of antimalarial compounds and the
other for the 4,998 compounds found in Adams et al. The only difference was that Adams et al.
compounds had to be filtered by the GroupBy node. These workflows were similar to the past

42
ones, except that Fingerprint and Fingerprint Similarity nodes were replaced by the Molecular
Properties node which can be used to determine the molecular weights of the compounds.
Histogram nodes were added, but the Statistics node was also added to calculate the various
statistical values of each dataset. Figure 27 shows the two workflows in KNIME. The one at the
top ran the statistics for Adams et al. while the one at the bottom ran the statistics for Justin’s list
of antimalarials. Figure 28 shows the histogram results of the molecular weights of the
compounds in Adams et al. It is also important to recall that the number of compounds after
being filtered dropped from 4,998 to 3593. Figure 29 features the histogram results of the 284
compounds from Justin’s list of antimalarial compounds. Table 2 shows all statistical values of
the molecular weights of the compounds from Adams et al. and Justin’s list.
Figure 27. Two Workflows Used for Calculating Statistics of Molecular Weights of
Compounds

43
Figure 28. Histogram Results for the Molecular Weights of the Filtered Compounds from
Adams et al.
Figure 29. Histogram Results for the Molecular Weights of the Antimalarial Compounds

44
Table 2. Statistics of the Molecular Weights of the Compounds (g/mol)
Mean Median Standard
Deviation
Minimum Maximu
m
Range Highest
Frequenc
y
Range of
Highest
Frequency
Adams et
al.
Compounds
(n = 3592)
319.3 288.1 169.3 14.0 797.6 783.6 853 80-160
Justin’s list
of
antimalarial
compounds
(n = 284)
372.7 364.7 117.8 76.0 1300.7 1224.7 178 280-420
Statistical Inference
Based on the statistics conducted on the molecular weight of the two datasets, it seems
that the compounds taken from Adams et al. tend to have a lower mean and median molecular
weight, are more heterogeneous (expected if sample size is larger), have less range, and are more
evenly distributed in molecular weight than the antimalarial compounds. However, it is still
difficult to determine if the compounds from Adams et al. are truly similar to the antimalarial
compounds based on molecular weight. In this case, a statistical test must be performed to
further evaluate the statistical properties of the molecular weights of the two datasets. Although a
z-test could determine if they are similar based on their means, I would want a test which can
determine the accuracy of their similarity based on all values in the table, except for the highest
45
frequency and range of highest frequency. The highest frequency and the range of highest
frequency refer to the histogram data, which are irrelevant to the statistical test. The highest
frequency is based on the sample size, which will not be factored, and the range of highest
frequency refers to an inner minimum and maximum values within the range that set the inner
range for the highest bar in the histogram. Logically, the best test would be a chi-squared test of
independence to determine if there is a statistical similarity between the two datasets.
Chi-Squared Test of Independence
First, the null hypothesis states that the two datasets are independent of each other, or in
this case, different. The alternative hypothesis states that they are similar in some way depending
on the values which characterize their distribution of molecular weights. Second, the right test
statistic to be used is the chi-squared test for independence. The only way for this test statistic to
properly work based on the sample size is to take into consideration that the expected frequency
of each cell must be at least 5. This can be seen in the expected frequencies table (Table 3).
Third, the decision rule must be set up. Based on the information, the degrees of freedom equal
the number of columns minus one times the numbers of rows minus one. Df = (r-1)(c-1). Since I
mentioned that I would not take into account the highest frequency or the range for the highest
frequency, then there are 2 rows and 6 columns. Df = (r-1)(c-1) = (2-1)(6-1) = 1*5 = 5. The
degrees of freedom are equal to 5. I would use a 5% level of significance because this is the most
commonly used level of significance in biostatistics. The table highlights that I must reject the
null hypothesis if chi squared is equal to or greater than 11.070. Then we calculate the expected
frequencies in each cell. The table below shows how the expected frequencies are calculated
based on the sums added up from all columns and rows (Table 3). Note that the expected
frequencies can be found within the parentheses. They are calculated by multiplying the totals

46
corresponding to that frequency’s row and column and then dividing by the complete total
located in the most bottom-right box.
Table 3. Expected Frequencies of Statistics of the Molecular Weights of the Compounds
(g/mol)
Mean Median Standard
Deviation
Minimum Maximum Range Totals
Adams et al.
Compounds
(n=3592)
319.3
(281.6)
288.1
(265.7)
169.3
(116.8)
14.0
(36.6)
797.6
(853.9)
783.6
(817.3)
2371.9
Justin’s list
of
antimalarial
compounds
(n=284)
372.7
(410.4)
364.7
(387.1)
117.8
(170.3)
76.0
(53.4)
1300.7
(1244.4)
1224.7
(1191.0)
3456.6
Totals 692 652.8 287.1 90 2098.3 2008.3 5828.5
Calculating chi squared is basically squaring the differences between each expected and
observed frequency, dividing each square by the expected frequency, and finally taking the sum
of every number. The formula is shown below in Figure 30.
Figure 30. The Chi Squared Formula

47
After running the calculation, chi squared equals 83.6. Because this value is higher than
11.07, it means that we reject the null hypothesis. Therefore, the statistical conclusion is that the
two datasets have an association, indicating that they are statistically similar at a molecular level.
Although the chi-squared test showed that the compounds from Adams et al. are ideal enough to
be compared to the antimalarial compounds, the malarial metabolites must be more chemically
similar to the antimalarial compounds. The molecular weights of the 4,998 compounds from
Adams et al. can be used as a guide when comparing the next dataset for malaria metabolites.
The Optimal Malaria Metabolites
In order to determine the correct data for malaria metabolites, it must follow stricter
criteria. The MetaCyc metabolites were not formatted properly for KNIME to process
effectively, so I decided to use a new database, ChEMBL Malaria Data. ChEMBL is far more
user-friendly than MetaCyc because it allows for easier data input and better search options. It
also provides more file format options and is able to provide more organized data. Since Adams
et al. provided 4,998 metabolites which lead to no ideal drug targets and was taken from over
900 species and various pathogens, this time I had to collect metabolites which were specific to
malaria and have a larger sample size. Optimally, I used the substructure search tool in ChEMBL
Malaria Data. In order to create a very chemically diverse sample of malaria metabolites, I told it
to find all metabolites which had a carbon atom in it. Obviously, this led to a very diverse sample
of 250,642 hits. This time I downloaded the data as tab-delimited and to include the SMILES
format for easier file organization and processing through the workflow in KNIME. MetaCyc did
not have this option which shows the lack of convenience for cheminformaticians to do their
research. The malaria data was quite organized and could be read in columns similar to those
from Adams et al. Before I ran the data, I predicted that the malaria data would result in more

48
specific drug targets than the previous data because this time it was specific for the malaria
parasite and had a larger sample size. When the metabolites were filtered by the GroupBy node,
the number of compounds went down to 223,196. This meant that the data was mostly original
and that there were not a significant proportion of redundant ligands. Surprisingly, the histogram
results revealed that all metabolites were between 0% and 5.49% chemical similarity. They can
be found in Figure 31. Compared to the metabolites taken from Adams et al., the luck in finding
specific drug targets against malaria did not significantly change. The data was so terribly
dissimilar that even 104,264 of the 223,196 filtered metabolites were in the range of 0 to 0.61%
chemical similarity. Roughly 47% of the metabolites from ChEMBL Malaria Data had less than
approximately 0.6% chemical similarity amongst the antimalarial compounds. Another
surprising statistic was that only 56 metabolites had between 4.88% and 5.49% chemical
similarity. Even a very chemically diverse sample of over a quarter million malarial metabolites
is not enough to find one specific drug target against the malaria parasite. An optimal search
would involve millions of malarial metabolites, but I am not even sure that any database might
have that many. Due to the unavailability of a larger sample size of malarial metabolites and the
lack of annotation of the genome of the Plasmodium genus, it will take a long time and much
effort for cheminformaticians to encounter coming across new specific drug targets against the
malaria parasite, particularly Plasmodium falciparum.
49
Figure 31. Histogram Results for Chemical Similarity of Malaria Metabolites from
ChEMBL
Statistics of Malaria Metabolites
Although the malaria metabolites were not able to help us determine specific drug targets,
their molecular weights must still be analyzed to ensure that they were an appropriate example
for testing chemical similarity with the antimalarial compounds. Therefore, I processed the
malaria data through the workflow from Fig. 27 and got new results shown in Table 4. The
histogram in Figure 31 shows the distribution of molecular weights of the malaria metabolites.

50
Table 4. Statistics of Molecular Weights of All Tested Compounds (g/mol)
Mean Median Standard
Deviatio
n
Minimum Maximu
m
Range Highest
Frequency
Range of
Highest
Frequency
Adams et
al.
Compounds
(n = 3593)
319.3 288.1 169.3 14.0 797.6 783.6 853 80-160
Justin’s list
of
antimalarial
compounds
(n = 284)
372.7 364.7 117.8 76.0 1300.7 1224.7 178 280-420
Malaria
metabolites
(n=223,196)
375.6 370.1 95.1 30.0 3964.1 3934.1 142466 0-400
51
Figure 31. Histogram Results of the Molecular Weights of the Malaria Metabolites from
ChEMBL
Statistical Inference of the Malaria Metabolites
In comparison to the compounds from Adams et al. and Justin’s list of antimalarials, the
malaria metabolites appear more similar to the antimalarials. However, the malaria metabolites
have a smaller standard deviation and a much broader range of molecular weights than the other
two datasets due to its sheer size. Even the largest metabolite is much larger than the biggest
antimalarial, indicating that perhaps the list of antimalarials needs to incorporate larger
molecules to mimic the metabolic products of the malaria parasite. Although the malaria
metabolites seem to be similar in molecular weight to the other two datasets despite the broader
range, a chi-squared test of independence can confirm the true degree of similarity between all
three datasets.

52
Another Chi Squared Analysis
This is the same procedure as the first chi squared analysis, except that the malarial
metabolites are factored this time. First, the null hypothesis is that all datasets are independent of
each other. The alternative hypothesis states that there is an association between all of them, or
they share some degree of statistical similarity. The level of significance is 5% again. I am not
using highest frequency or range of the highest frequency because they can be biased by the
sample size. Next, a test statistic must be chosen which is clearly the chi squared test of
independence. We must check that each expected frequency is at least five, which is shown in
the calculations. Next a decision rule has to be made. The degrees of freedom are the number of
rows minus one times the number of columns minus 1. So, df = (r-1)(c-1) = (3-1)(6-1) = 2*5 =
10. Based on the level of significance and degrees of freedom, the null hypothesis would be
rejected if chi squared exceeded 18.307. Then calculations are carried out. The expected
frequencies are shown in Table 5 below in parentheses. The chi squared was equal to 1087.942.
Since it was greater than 18.307, then the null hypothesis must be rejected. Therefore, there is an
association between all three datasets. Although the chi squared test of independence showed
that the malarial metabolites are somewhat similar to the antimalarials and the compounds from
Adams et al., the malarial metabolites still greatly differ due to larger sample size and broader
range, especially on the heavier side of their molecular weights. Therefore, a different statistical
test must be performed to validate the similarity between the three datasets.
53
Table 5. The Expected Frequencies of the Molecular Weights of All Tested Compounds
(g/mol)
Mean Median Standard
Deviation
Minimum Maximum Range Totals
Adams et al.
Compounds
(n=3593)
319.3
(239.3)
288.1
(166.2)
169.3
(62.1)
14.0
(19.5)
797.6
(985.1)
783.6
(965.6)
2371.9
Justin’s list
of
antimalarial
compounds
(n=284)
372.7
(252.8)
364.7
(242.2)
117.8
(90.5)
76.0
(28.4)
1300.7
(1435.5)
1224.7
(1407.1)
3456.6
Malaria
Metabolites
(n=223,196)
375.6
(641.3)
370.1
(614.5)
95.1
(229.6)
30.0
(72.1)
3964.1
(3641.8)
3934.1
(3569.7)
8769
Totals 1067.6 1022.9 382.2 120 6062.4 5942.4 14597.5
Three Z-Tests of Sample Means
To ensure the best chance that all three datasets are similar to each other, I figured that
the simplest way would be to conduct three Z-tests to determine any significant differences
between the sample means. The means are the most representative measures of central tendency
of the samples. A Z-test is even more simple to conduct than a chi-squared analysis. First, the
null hypothesis states that there is no statistical difference between means. Second, the

54
alternative hypothesis states that there is a statistical difference between two of the means. The
level of significance is 5%, which is the most commonly used level in statistics. The Z test is
chosen because all sample sizes exceed 30. The decision rule is based on the degrees of freedom
in which two of the sample sizes are added together and subtracted by 2. However, the Z test
does not use the degrees of freedom because it involves very large sample sizes. The formula for
the Z statistic is shown below in Fig. 32. The Z statistic basically consists of the difference
between the means in the numerator. Then the denominator has Sp which is the pooled estimate
for common standard deviation. It has its own formula which can be shown in Fig. 33. The
pooled estimate for the common standard deviation is then multiplied by the square root of the
sum of the multiplicative reciprocals of the two sample sizes. When calculating the pooled
estimate for the common standard deviation, it is equal to the square root of a numerator divided
by a denominator. The numerator is the sum of the products of each sample size subtracted by
one and the variance of the sample (standard deviation squared). The denominator is the same as
the degrees of freedom mentioned earlier. Another important aspect when calculating the pooled
estimate is to make sure that the proportion of the sample variances is between 0.5 and 2 to
ensure that the samples are not too different from each other. Finally, the test statistic can be
calculated and be determined. If the test result is outside of the range of the two-tailed test, then
it means that the null hypothesis must be rejected and there is a statistical difference between the
means of the two samples. Since I want to determine if three samples are statistically different
from each other by their means, then I must run three individual Z tests.
Z = (X1 -X2)/(Sp * sqrt(1/n1 + 1/n2)
Figure 32. Formula for Two Sample Z Test
Sp = sqrt(((n1-1)(s1)2 + (n2 – 1)(s2)2)/(n1 + n2 – 2))

55
Figure 33. Formula for Pooled Estimate for Common Standard Deviation
Z-Test for the Compounds from Adams et al. and Justin’s List of Antimalarials
First, the null hypothesis states that the means are not different. Secondly, the alternative
hypothesis states that there is a difference between the means. Then the Z statistic is used
because both sample sizes easily exceed 30. We must also calculate the proportion of sample
variances. In this case, (s1)2/(s2)2 represents the proportion of sample variances. The standard
deviation of the compounds from Adams et al. is 169.3 and the standard deviation of Justin’s list
of antimalarials is 117.8. 169.32/117.82 = 2.065. This means that the proportion of sample
variances might not be reasonable, but the test could still give reliable results. The decision rule
states that if we are using a Z statistic, this is a two-tailed test, and that the level of significance is
5%, then the null hypothesis will be rejected if Z is greater than or equal to 1.96 or if Z is less
than or equal than to -1.96. We then calculate the Z statistic. First, we calculate the pooled
estimate for the common standard deviation, in which Sp = sqrt(((n1-1)(s1)2 + (n2 – 1)(s2)2)/(n1 + n2
– 2)). Sp = sqrt((3593-1)(169.3)2 + (284-1)(117.8)2)/(3593+284-2)) = 166.08. Next the Z test
becomes calculated in which Z = (X1 -X2)/(Sp * sqrt(1/n1 + 1/n2). Z =
(319.3-372.7)/(166.08*sqrt(1/3593+1/284)) = -5.216. Since -5.216 is less than -1.96, then the
null hypothesis has to be rejected. The means of the compounds from Adams et al. and Justin’s
list of antimalarials are different. This is not surprising because the compounds from Adams et
al. are not even specifically malarial and come from a huge variety of different pathogens and
species. Also, the proportion of sample variances was quite different.

56
Z-Test for the Compounds from Adams et al. and the Malaria Metabolites
The null hypothesis states that there is no difference between means and the alternative
hypothesis states that there is a difference between the means of these two samples. The Z test
statistic is appropriate once again due to the large sample sizes. The proportion of sample
variances must be between 0.5 and 2.0 to ensure that the assumption is reasonable. (s1)2/(s2)2 =
(169.3)2/(95.1)2 = 3.17. This means that the proportion of sample variances might be
unreasonable for the test statistic to perform on these samples. The decision rule is the same as
the last example, so the null hypothesis becomes rejected if Z is not between -1.96 and 1.96. We
calculate the pooled estimate for the common standard deviation. Sp = sqrt(((n1-1)(s1)2 + (n2 – 1)
(s2)2)/(n1 + n2 – 2)) = sqrt((3593-1)(169.3)2 + (223,196-1)(95.1)2)/(3593+223,196-2)) = 96.7. Then
we calculate the Z score. Z = (X1 -X2)/(Sp * sqrt(1/n1 + 1/n2). Z =
(319.3-375.6)/(95.7*sqrt(1/3593+1/223,196)) = -34.98. Since -34.98 is less than -1.96, it means
that the null hypothesis becomes rejected. The means of the compounds from Adams et al. and
the malaria metabolites are statistically different. Thus the proportion of the sample variances is
unreasonable too. Other factors are that the sample sizes are very different and that the malaria
metabolites are not as heterogeneous as the compounds from Adams et al.
Z-Test for Justin’s List of Antimalarials and the Malaria Metabolites
So far, this is probably the most important Z-test because it will determine if the malaria
metabolites were a suitable match for Justin’s antimalarials and if their molecular weights were
roughly similar. Once again, the null hypothesis states that there is no difference between the
means and the alternative hypothesis states otherwise. The Z statistic is used again due to the
sample sizes. We then measure the proportion of sample variances. (s1)2/(s2)2 = 117.82/95.12 =
1.534. This time the proportion of sample variances appears to be reasonable. Next the decision

57
rule is the same, in which the null hypothesis becomes rejected if Z exceeds 1.96 or goes below -
1.96. We calculate the pooled estimate for the common standard deviation. Sp = sqrt(((n1-1)(s1)2 +
(n2 – 1)(s2)2)/(n1 + n2 – 2)) = sqrt((284-1)(117.8)2 + (223,196-1)(95.1)2)/(284+223,196-2)) = 95.13.
Next the Z statistic becomes calculated. Z = (X1 -X2)/(Sp * sqrt(1/n1 + 1/n2) =
(372.7-375.6)/(95.13*sqrt(1/284+1/223,196)) = -0.51. Since -0.51 is between -1.96 and 1.96, it
means that we fail to reject the null hypothesis. Although the compounds from Adams et al. were
statistically different in molecular weight, the antimalarials and the malaria metabolites showed
similarity in molecular weight. The proportion of sample variances was also reasonable. The Z-
test confirmed that the malaria metabolites were suitable in molecular weight as a sample to
compare chemical similarity against the antimalarials. However, a confusing observation is that
despite the similarity in molecular weight, the samples still did not share at least 5.5% chemical
similarity.
Final Conclusions
My main conclusions are that it is extremely difficult to identify best hits for specific
drug targets to the malaria parasite because the metabolic pathways are still not well-annotated
and the information about the genome of malaria still remains quite unsolved. At the beginning, I
brought up the statistics that only two of 200,000 compounds screened by the US Army
Antimalarial Drug Developmental Program in the last decade were successful in demonstrating
greater antimalarial activity than any other known drug against drug-resistant P. falciparum
(Canfield and Rozman). Another important note is that the MetaCyc database is not user-friendly
and makes it harder for cheminformaticians to complete this type of work due to the constraints
of file conversion. ChEMBL was much more user-friendly because it provided access to the
metabolite data by downloading it as tab-delimited. As a bonus, the structural annotation could

58
be provided in SMILES format unlike the MetaCyc database. However, it was still astonishing to
encounter 250,642 hits through KNIME and not find one specific drug target with chemical
similarity exceeding 5.49%. This led to my other conclusion that even a very chemically diverse
sample of malarial metabolites is still not enough to determine specific drug targets against the
malaria parasite. Therefore, millions of metabolites have to be processed through KNIME to find
the appropriate drug targets. Although it was not surprising to see that the results of the
compounds from Adams et al. did not have any compounds exceeding 5.1% chemical similarity,
it was still shocking that the malaria metabolites only had slightly more chemical similarity than
the general compounds. We could have gotten better chemical similarity if the SEA Approach
was used, but time was limited (Figure 2). The statistical tests provided an even stranger
conclusion that although the general compounds were statistically different in molecular weight,
the antimalarials and the malaria metabolites were statistically similar in their means of
molecular weight distribution. It is not strange that this result occurred, but it is strange due to
the circumstances of similar chemical similarity results between the general and malarial
metabolites. However, other factors that could explain this phenomenon could be that the malaria
metabolites had a very large sample size and extremely broad range and that the maximum
molecular weight of the malarial metabolites greatly exceeded even that of the antimalarials.
Perhaps a more diverse list of antimalarials might be needed to obtain more chemically similar
results.
Discussion
In order to better prepare for finding antimalarial drug targets, we must find larger sample
sizes of malaria metabolites and find a sample specific to Plasmodium falciparum. I did not try
to find a sample specific to this species because I figured that after the failure of the malaria

59
metabolites from ChEMBL, it would have taken much more time to find a larger sample for
malaria metabolites and that future samples for only one species would result in further failures.
Another error was that I used the chi squared test of independence to determine similarity in the
statistics of the distribution of molecular weight between the general compounds, malaria
metabolites, and antimalarials. The Z tests provided much more accurate results than the chi
squared test of independence because the chi squared test of independence does not determine
similarity between independent samples. Analysis would have also been more successful if
MetaCyc had established more downloading options for collecting metabolite data. Another
major error that I also discovered was that the compounds I used from ChEMBL were mostly
antimalarial compounds. Since chemical similarity between Justin’s compounds and those from
ChEMBL were so significantly low, this raised many new questions. Perhaps Justin’s list has
much newer compounds that were not shown in the ChEMBL database or maybe the pipeline did
not work. However, the compounds from ChEMBL could be used as a much chemically diverse
sample of antimalarials to detect chemical similarity among future metabolites. In the future, a
sample of millions of metabolites specific to malaria and a larger sample of antimalarial drugs
might provide the key to determining specific drug targets to the malaria parasite.

60
Acknowledgments
This project would have not been made possible without the suggestions and careful
guidance proposed by my peer, Justin Gibbons. Acknowledgments also go out to Dr. Rays Jiang
for judging my performance as a bioinformatician and professional in presenting the data of this
project. Finally, acknowledgments also go to Dr. Vladimir Uversky for assisting my performance
in determining a key site for my bioinformatics internship and advising me on how to carry out
my bioinformatics analysis.
Works Cited
Adams, James Corey, et al. "A mapping of drug space from the viewpoint of small molecule
metabolism." PLoS Comput Biol 5.8 (2009): e1000474.
Basso, Luiz Augusto, et al. "The use of biodiversity as source of new chemical entities against
defined molecular targets for treatment of malaria, tuberculosis, and T-cell mediated
diseases: a review." Memórias do Instituto Oswaldo Cruz 100.6 (2005): 475-506.
Beisken, Stephan, et al. "KNIME-CDK: Workflow-driven cheminformatics." BMC
bioinformatics 14.1 (2013): 1.
Canfield, C. J., and R. S. Rozman. "Clinical testing of new antimalarial compounds." Bulletin of the World Health Organization 50.3-4 (1974): 203.
Chambers, Jon et al. “UniChem: Extension of InChI-Based Compound Mapping to Salt,
Connectivity and Stereochemistry Layers.” Journal of Cheminformatics 6.1 (2014): 43.
PMC. Web. 22 June 2016.
"Chi-Square Statistic: How to Calculate It." Statistics How To. N.p., 2016. Web. 1 July 2016.
Cobbold, Simon A., et al. "Metabolic Dysregulation Induced in Plasmodium falciparum by

61
Dihydroartemisinin and Other Front-Line Antimalarial Drugs." Journal of Infectious
Diseases 213.2 (2016): 276-286.
Gardiner, Eleanor J., et al. "Effectiveness of 2D fingerprints for scaffold hopping." Future
medicinal chemistry 3.4 (2011): 405-414.
Ginsburg, Hagai. "Progress in in silico functional genomics: the malaria Metabolic Pathways
database." Trends in parasitology 22.6 (2006): 238-240.
Godden, Jeffrey W., Ling Xue, and Jürgen Bajorath. "Combinatorial preferences affect
molecular similarity/diversity calculations using binary fingerprints and Tanimoto
coefficients." Journal of Chemical Information and Computer Sciences 40.1 (2000): 163
166.
Pradhan, Anupam, et al. "Chemogenomic profiling of Plasmodium falciparum as a tool to aid
antimalarial drug discovery." Scientific reports 5 (2015).
Rogers, David, and Mathew Hahn. "Extended-connectivity fingerprints." Journal of chemical
information and modeling 50.5 (2010): 742-754.


