ORIGINAL ARTICLE Identifying high-yield low-emission pathways for the cereal production in South Asia Tek B. Sapkota 1 & Jeetendra P. Aryal 2 & Arun Khatri-Chhetri 3 & Paresh B. Shirsath 3 & Ponraj Arumugam 3 & Clare M. Stirling 2 Received: 24 February 2017 /Accepted: 29 June 2017 /Published online: 22 July 2017 # The Author(s) 2017. This article is an open access publication Abstract Increasing agricultural production to meet the growing demand for food whilst reducing agricultural greenhouse gas (GHG) emissions is the major challenge under the changing climate. To develop long-term policies that address these challenges, strategies are needed to identify high-yield low-emission pathways for particular agricultural production systems. In this paper, we used bio-physical and socio-economic models to analyze the impact of different management practices on crop yield and emissions in two contrasting agricultural production systems of the Indo-Gangetic Plain (IGP) of India. The result revealed the importance of considering both management and socio-economic factors in the development of high-yield low-emission pathways for cereal production systems. Nitrogen use rate and frequency of application, tillage and residue management and manure application significantly affected GHG emissions from the cereal systems. In addition, various socio-economic factors such as gender, level of education, training on climate change adaptation and mitigation and access to information significantly influenced the adoption of technologies contributing to high-yield low-emission pathways. We discussed the policy implications of these findings in the context of food security and climate change. Mitig Adapt Strateg Glob Change (2018) 23:621–641 DOI 10.1007/s11027-017-9752-1 Jeetendra P Aryal and Arun Khatri-Chhetri contributed equally Electronic supplementary material The online version of this article (doi:10.1007/s11027-017-9752-1) contains supplementary material, which is available to authorized users. * Tek B. Sapkota [email protected]1 International Maize and Wheat Improvement Centre (CIMMYT), NASC complex, New Delhi 110012, India 2 International Maize and Wheat Improvement Centre (CIMMYT), Texcoco, Mexico 3 CGIAR Research Program on Climate Change, Agriculture and Food Security (CCAFS), Borlaug Institute for South Asia (BISA)/CIMMYT, NASC Complex, New Delhi 110012, India
Transcript
ORIGINAL ARTICLE
Identifying high-yield low-emission pathways for the cerealproduction in South Asia
Tek B. Sapkota1 & Jeetendra P. Aryal2 &
Arun Khatri-Chhetri3 & Paresh B. Shirsath3 &
Ponraj Arumugam3 & Clare M. Stirling2
Received: 24 February 2017 /Accepted: 29 June 2017 /Published online: 22 July 2017# The Author(s) 2017. This article is an open access publication
Abstract Increasing agricultural production to meet the growing demand for food whilstreducing agricultural greenhouse gas (GHG) emissions is the major challenge under thechanging climate. To develop long-term policies that address these challenges, strategies areneeded to identify high-yield low-emission pathways for particular agricultural productionsystems. In this paper, we used bio-physical and socio-economic models to analyze the impactof different management practices on crop yield and emissions in two contrasting agriculturalproduction systems of the Indo-Gangetic Plain (IGP) of India. The result revealed theimportance of considering both management and socio-economic factors in the developmentof high-yield low-emission pathways for cereal production systems. Nitrogen use rate andfrequency of application, tillage and residue management and manure application significantlyaffected GHG emissions from the cereal systems. In addition, various socio-economic factorssuch as gender, level of education, training on climate change adaptation and mitigation andaccess to information significantly influenced the adoption of technologies contributing tohigh-yield low-emission pathways. We discussed the policy implications of these findings inthe context of food security and climate change.
Jeetendra P Aryal and Arun Khatri-Chhetri contributed equally
Electronic supplementary material The online version of this article (doi:10.1007/s11027-017-9752-1)contains supplementary material, which is available to authorized users.
1 International Maize and Wheat Improvement Centre (CIMMYT), NASC complex, NewDelhi 110012, India
2 International Maize and Wheat Improvement Centre (CIMMYT), Texcoco, Mexico3 CGIAR Research Program on Climate Change, Agriculture and Food Security (CCAFS), Borlaug
Institute for South Asia (BISA)/CIMMYT, NASC Complex, New Delhi 110012, India
Keywords Greenhouse gas emissions . Climate change . Cereal systems . High-yield low-emission pathway
1 Introduction
Global agricultural greenhouse gas (GHG) emissions are increasing. In the past 50 years,emissions from agriculture, forestry and fisheries have nearly doubled due to an increase inglobal agricultural production (Smith et al. 2014). This is driven largely by an increase indemand for food and changes in food consumption patterns, particularly in developingcountries. Recent analysis suggests that trends in population growth and food demand willresult in a further 30% increase in global GHG emissions from agricultural by 2050 with Asianand African countries accounting for most of the increase (Tubiello et al. 2014).
Synthetic fertilizer is one of the major and fastest growing emission sources in agriculture(Camargo et al. 2013; Shcherbak et al. 2014), together with paddy rice (Oryza sativa L.)cultivation and burning of crop residues (Wassmann et al. 2000; INCCA 2010; Boateng et al.2017). Energy and fertilizer consumption is particularly high in intensive cereal productionsystems. For example fertilizer and chemical energy (e.g. pesticides, herbicides etc) inputscomprise about 45% of the total energy consumed for production of rice, wheat (Triticumaestivum L.) and maize (Zea mays L.) (Khan et al. 2009), about 60% of which is due tonitrogen fertilizer alone. On the other hand, projections indicate that production of food cropssuch as rice, wheat and maize needs to increase over the coming decades to meet food demand(Jat et al. 2011). Given the necessity to increase crop production and limited scope forhorizontal expansion, fertilizer consumption is expected to increase, thereby augmentingemissions from agriculture. Therefore, production systems guided by key concerns of sustain-ability are necessary in order to increase food production without compromising environmen-tal integrity.
Many developing countries identified agriculture and allied sectors as one of thepriority areas for emission reduction in their Intended Nationally Determined Contribu-tions (INDCs) to the United National Framework Convention on Climate Change(UNFCCC) (Richards et al. 2016). Similarly, climate change adaptation and mitigation-related policies and programs in many developing countries highlight the need forsustainable increase in agricultural production and a reduction of emissions wherepossible. These countries possess immense mitigation potential for land use in agricul-ture and have targeted this sector to reduce their carbon footprints (CCAFS 2015).However, current understanding of the effect of various management options on GHGemissions from crops and the enabling socio-economic factors that influence theiradoption is limited. This dearth of information constrains the development of evidence-based strategies and targets for low-carbon agricultural development.
Reductions in GHG emissions from agricultural sector can be achieved through improvedagronomic practices and adoption of precision input management and enhanced resource useefficiencies (Godfray et al. 2010; Sapkota et al. 2015a, b; Verge et al. 2007). Yield improve-ment and emission reduction are also directly influenced by farmers’ decisions to implementfarm technologies and/or practices. Farming decisions are influenced by farm size, incomelevel, land ownership, access to market and credits and other socio-economic variables (Keilet al. 2015; Khatri-Chhetri et al. 2016; Mottaleb et al. 2016). However, there remains a majorknowledge gap in terms of the relationship between agricultural emissions and socio-economic
conditions which needs to be better understood in order to develop appropriate emissionreduction strategy for agriculture.
The overall aim of this paper is to identify high-yield low-emission development pathwaysin cereal production systems. To achieve this, specific objectives are as follows: (i) to identifyvarious technologies and farm management practices that influence GHG emissions and (ii) toexplore household socio-economic factors that determine the adoption of low-emission tech-nologies and management practices at the farm level. By identifying the important determi-nants of GHG emissions, this paper explores a possible pathway to produce or maintain higheryields with lower GHG emissions in two major, but different, production systems in the IndianIndo-Gangetic Plains (IGP) through the use of a GHG emission tool, household survey andstatistical models. The study has important global implications because the IGP is the majorfood bowl of India producing food for about 40% of India’s 1.2 billion population (Saharawatet al. 2010). India is the third largest GHG emitter in the world (Ge et al. 2014) with agriculturebeing the second largest source of GHG emission accounting for 18% of the gross nationalemissions (INCCA 2010). The country has recently declared a voluntary goal of reducing theemission intensity of its GDP by 33–35% and placed emphasis on land-based mitigationmeasures (India’s INDC to UNFCCC, http://www.moef.nic.in/climate-change-docs-and-publications). As the third largest emitter in the world, such a commitment has the potentialfor substantial impacts on global emissions. The state of Haryana in India represents a high-input production system with relatively high productivity whereas Bihar represents a low-inputproduction system with correspondingly low productivity. By using these two states of India asexemplary study, we discuss the policy implications of the findings in the context of foodsecurity and climate change.
2 Materials and methods
2.1 Study area and data collection
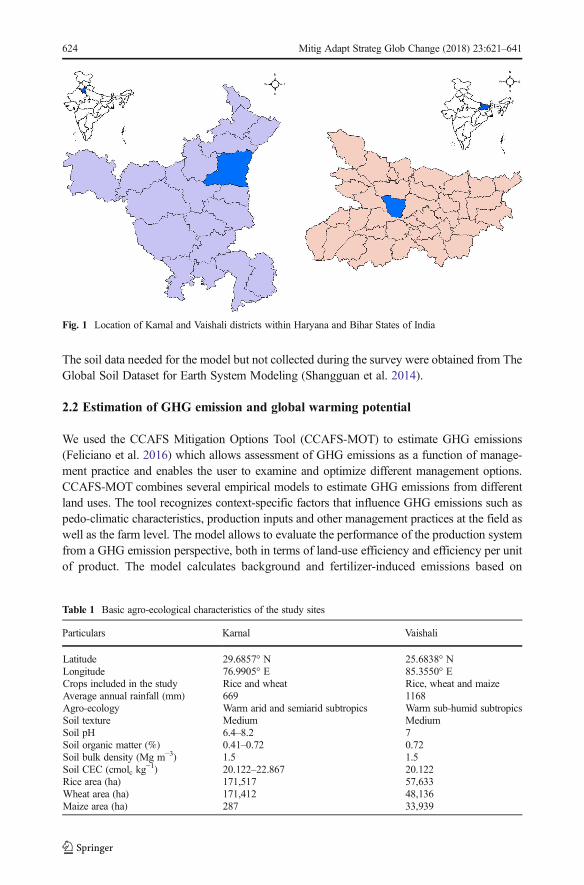
Data for this study were derived from a household survey conducted in two districts: Karnaldistrict of Haryana state and Vaishali district of Bihar state in India (Fig. 1) in 2013. Karnal andVaishali represent high and low input production systems typical of the western and easternIGP, respectively. Cereal production in the IGP is GHG intensive compared to other regions inSouth Asia. Annual GHG emissions resulting from the production of rice, wheat and maize inthe Indian IGP are 113,388, 20,727 and 1632 Gg CO2eq, respectively (calculated using theaverage emissions reported in Vetter et al. 2017).
An overview of the agro-ecological conditions of the study sites are given in Table 1. Thehousehold survey comprised 626 and 641 randomly selected households in Karnal andVaishali, respectively. In this survey, farmers were interviewed to obtain information on cropproduction, socio-economic and demographic conditions, climate risks in agriculture andadaptation and mitigation measures. Within household, farmers manage multiple plots fordifferent crops (rice, wheat, maize) under different management conditions. From each plot,information regarding tillage operations and fuel use, crop establishment, agronomy (nutrient,water, weed and pest), yield and residue management were obtained. Total applied N in theplots was calculated as the sum of the N from di-ammonium-phosphate (DAP), urea, farm-yard-manure (FYM) and crop residue (where applicable) and assuming an N content of FYMas 0.5% (Tandon 1994) and that of crop residues as 0.8% (Dobermann and Fairhurst 2002).
The soil data needed for the model but not collected during the survey were obtained from TheGlobal Soil Dataset for Earth System Modeling (Shangguan et al. 2014).
2.2 Estimation of GHG emission and global warming potential
We used the CCAFS Mitigation Options Tool (CCAFS-MOT) to estimate GHG emissions(Feliciano et al. 2016) which allows assessment of GHG emissions as a function of manage-ment practice and enables the user to examine and optimize different management options.CCAFS-MOT combines several empirical models to estimate GHG emissions from differentland uses. The tool recognizes context-specific factors that influence GHG emissions such aspedo-climatic characteristics, production inputs and other management practices at the field aswell as the farm level. The model allows to evaluate the performance of the production systemfrom a GHG emission perspective, both in terms of land-use efficiency and efficiency per unitof product. The model calculates background and fertilizer-induced emissions based on
Fig. 1 Location of Karnal and Vaishali districts within Haryana and Bihar States of India
Table 1 Basic agro-ecological characteristics of the study sites
Particulars Karnal Vaishali
Latitude 29.6857° N 25.6838° NLongitude 76.9905° E 85.3550° ECrops included in the study Rice and wheat Rice, wheat and maizeAverage annual rainfall (mm) 669 1168Agro-ecology Warm arid and semiarid subtropics Warm sub-humid subtropicsSoil texture Medium MediumSoil pH 6.4–8.2 7Soil organic matter (%) 0.41–0.72 0.72Soil bulk density (Mg m−3) 1.5 1.5Soil CEC (cmolc kg
−1) 20.122–22.867 20.122Rice area (ha) 171,517 57,633Wheat area (ha) 171,412 48,136Maize area (ha) 287 33,939
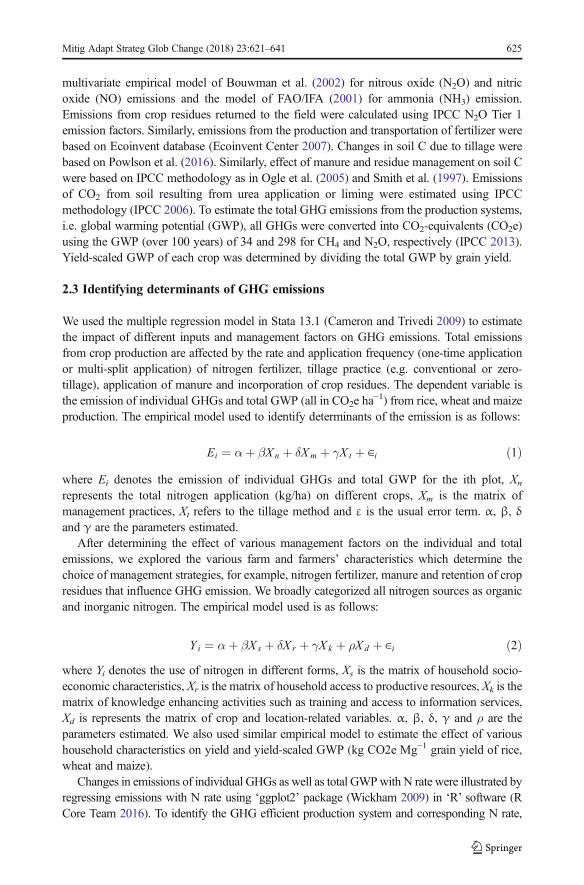
multivariate empirical model of Bouwman et al. (2002) for nitrous oxide (N2O) and nitricoxide (NO) emissions and the model of FAO/IFA (2001) for ammonia (NH3) emission.Emissions from crop residues returned to the field were calculated using IPCC N2O Tier 1emission factors. Similarly, emissions from the production and transportation of fertilizer werebased on Ecoinvent database (Ecoinvent Center 2007). Changes in soil C due to tillage werebased on Powlson et al. (2016). Similarly, effect of manure and residue management on soil Cwere based on IPCC methodology as in Ogle et al. (2005) and Smith et al. (1997). Emissionsof CO2 from soil resulting from urea application or liming were estimated using IPCCmethodology (IPCC 2006). To estimate the total GHG emissions from the production systems,i.e. global warming potential (GWP), all GHGs were converted into CO2-equivalents (CO2e)using the GWP (over 100 years) of 34 and 298 for CH4 and N2O, respectively (IPCC 2013).Yield-scaled GWP of each crop was determined by dividing the total GWP by grain yield.
2.3 Identifying determinants of GHG emissions
We used the multiple regression model in Stata 13.1 (Cameron and Trivedi 2009) to estimatethe impact of different inputs and management factors on GHG emissions. Total emissionsfrom crop production are affected by the rate and application frequency (one-time applicationor multi-split application) of nitrogen fertilizer, tillage practice (e.g. conventional or zero-tillage), application of manure and incorporation of crop residues. The dependent variable isthe emission of individual GHGs and total GWP (all in CO2e ha
−1) from rice, wheat and maizeproduction. The empirical model used to identify determinants of the emission is as follows:
Ei ¼ αþ βXn þ δXm þ γX t þ ∈i ð1Þwhere Ei denotes the emission of individual GHGs and total GWP for the ith plot, Xn
represents the total nitrogen application (kg/ha) on different crops, Xm is the matrix ofmanagement practices, Xt refers to the tillage method and ε is the usual error term. α, β, δand γ are the parameters estimated.
After determining the effect of various management factors on the individual and totalemissions, we explored the various farm and farmers’ characteristics which determine thechoice of management strategies, for example, nitrogen fertilizer, manure and retention of cropresidues that influence GHG emission. We broadly categorized all nitrogen sources as organicand inorganic nitrogen. The empirical model used is as follows:
Y i ¼ αþ βX s þ δX r þ γX k þ ρX d þ ∈i ð2Þwhere Yi denotes the use of nitrogen in different forms, Xs is the matrix of household socio-economic characteristics, Xr is the matrix of household access to productive resources, Xk is thematrix of knowledge enhancing activities such as training and access to information services,Xd is represents the matrix of crop and location-related variables. α, β, δ, γ and ρ are theparameters estimated. We also used similar empirical model to estimate the effect of varioushousehold characteristics on yield and yield-scaled GWP (kg CO2e Mg−1 grain yield of rice,wheat and maize).
Changes in emissions of individual GHGs as well as total GWPwith N rate were illustrated byregressing emissions with N rate using ‘ggplot2’ package (Wickham 2009) in ‘R’ software (RCore Team 2016). To identify the GHG efficient production system and corresponding N rate,
relationships were established between yield and yield-scaled GWP under different N applicationranges, as described byBellarby et al. (2014). For this, the total N applied was binned into 20 kgNha−1 range, i.e. 0–20, 20–40, ……… 220–240 kg N ha−1, and corresponding yield and yield-scaled GWP were plotted together. Finally, a stylized framework (Cui et al. 2014) of grain yieldand GHG emission was developed to evaluate different GHG-efficient production pathways.
3 Results
3.1 Grain yield
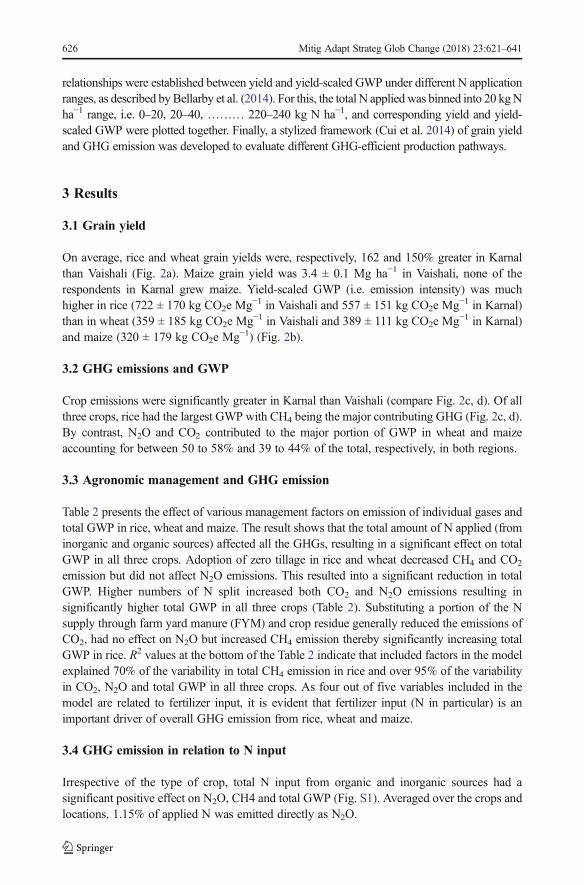
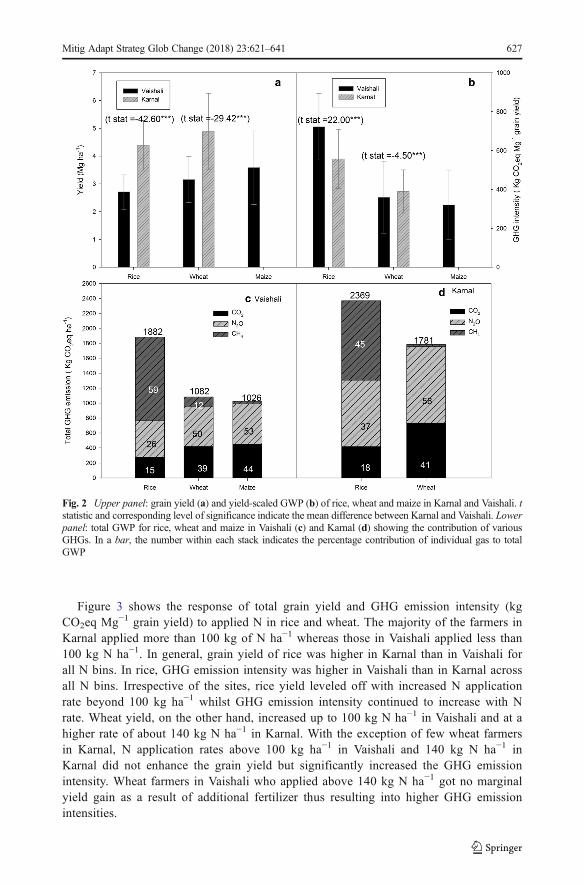
On average, rice and wheat grain yields were, respectively, 162 and 150% greater in Karnalthan Vaishali (Fig. 2a). Maize grain yield was 3.4 ± 0.1 Mg ha−1 in Vaishali, none of therespondents in Karnal grew maize. Yield-scaled GWP (i.e. emission intensity) was muchhigher in rice (722 ± 170 kg CO2e Mg−1 in Vaishali and 557 ± 151 kg CO2e Mg−1 in Karnal)than in wheat (359 ± 185 kg CO2e Mg−1 in Vaishali and 389 ± 111 kg CO2e Mg−1 in Karnal)and maize (320 ± 179 kg CO2e Mg−1) (Fig. 2b).
3.2 GHG emissions and GWP
Crop emissions were significantly greater in Karnal than Vaishali (compare Fig. 2c, d). Of allthree crops, rice had the largest GWP with CH4 being the major contributing GHG (Fig. 2c, d).By contrast, N2O and CO2 contributed to the major portion of GWP in wheat and maizeaccounting for between 50 to 58% and 39 to 44% of the total, respectively, in both regions.
3.3 Agronomic management and GHG emission
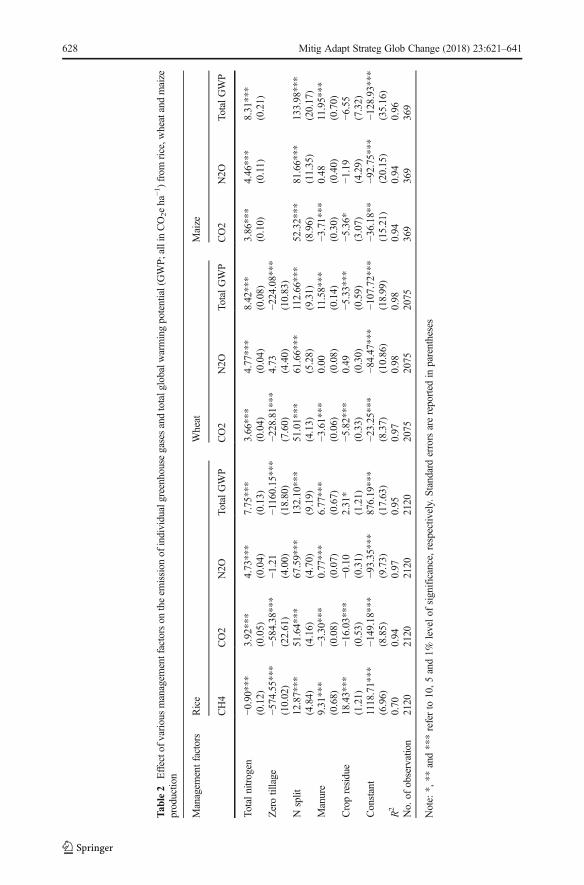
Table 2 presents the effect of various management factors on emission of individual gases andtotal GWP in rice, wheat and maize. The result shows that the total amount of N applied (frominorganic and organic sources) affected all the GHGs, resulting in a significant effect on totalGWP in all three crops. Adoption of zero tillage in rice and wheat decreased CH4 and CO2
emission but did not affect N2O emissions. This resulted into a significant reduction in totalGWP. Higher numbers of N split increased both CO2 and N2O emissions resulting insignificantly higher total GWP in all three crops (Table 2). Substituting a portion of the Nsupply through farm yard manure (FYM) and crop residue generally reduced the emissions ofCO2, had no effect on N2O but increased CH4 emission thereby significantly increasing totalGWP in rice. R2 values at the bottom of the Table 2 indicate that included factors in the modelexplained 70% of the variability in total CH4 emission in rice and over 95% of the variabilityin CO2, N2O and total GWP in all three crops. As four out of five variables included in themodel are related to fertilizer input, it is evident that fertilizer input (N in particular) is animportant driver of overall GHG emission from rice, wheat and maize.
3.4 GHG emission in relation to N input
Irrespective of the type of crop, total N input from organic and inorganic sources had asignificant positive effect on N2O, CH4 and total GWP (Fig. S1). Averaged over the crops andlocations, 1.15% of applied N was emitted directly as N2O.
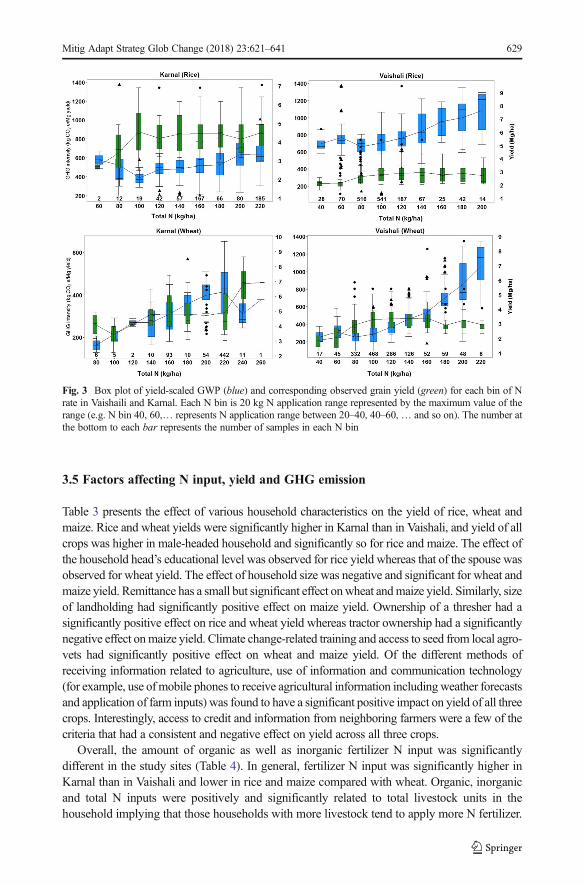
Figure 3 shows the response of total grain yield and GHG emission intensity (kgCO2eq Mg−1 grain yield) to applied N in rice and wheat. The majority of the farmers inKarnal applied more than 100 kg of N ha−1 whereas those in Vaishali applied less than100 kg N ha−1. In general, grain yield of rice was higher in Karnal than in Vaishali forall N bins. In rice, GHG emission intensity was higher in Vaishali than in Karnal acrossall N bins. Irrespective of the sites, rice yield leveled off with increased N applicationrate beyond 100 kg ha−1 whilst GHG emission intensity continued to increase with Nrate. Wheat yield, on the other hand, increased up to 100 kg N ha−1 in Vaishali and at ahigher rate of about 140 kg N ha−1 in Karnal. With the exception of few wheat farmersin Karnal, N application rates above 100 kg ha−1 in Vaishali and 140 kg N ha−1 inKarnal did not enhance the grain yield but significantly increased the GHG emissionintensity. Wheat farmers in Vaishali who applied above 140 kg N ha−1 got no marginalyield gain as a result of additional fertilizer thus resulting into higher GHG emissionintensities.
Fig. 2 Upper panel: grain yield (a) and yield-scaled GWP (b) of rice, wheat and maize in Karnal and Vaishali. tstatistic and corresponding level of significance indicate the mean difference between Karnal and Vaishali. Lowerpanel: total GWP for rice, wheat and maize in Vaishali (c) and Karnal (d) showing the contribution of variousGHGs. In a bar, the number within each stack indicates the percentage contribution of individual gas to totalGWP
3.5 Factors affecting N input, yield and GHG emission
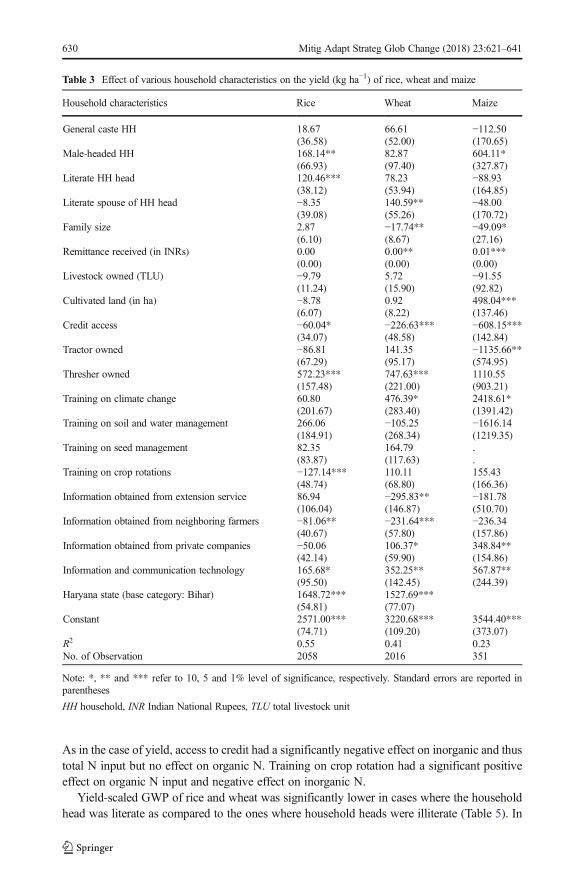
Table 3 presents the effect of various household characteristics on the yield of rice, wheat andmaize. Rice and wheat yields were significantly higher in Karnal than in Vaishali, and yield of allcrops was higher in male-headed household and significantly so for rice and maize. The effect ofthe household head’s educational level was observed for rice yield whereas that of the spouse wasobserved for wheat yield. The effect of household size was negative and significant for wheat andmaize yield. Remittance has a small but significant effect onwheat andmaize yield. Similarly, sizeof landholding had significantly positive effect on maize yield. Ownership of a thresher had asignificantly positive effect on rice and wheat yield whereas tractor ownership had a significantlynegative effect onmaize yield. Climate change-related training and access to seed from local agro-vets had significantly positive effect on wheat and maize yield. Of the different methods ofreceiving information related to agriculture, use of information and communication technology(for example, use of mobile phones to receive agricultural information includingweather forecastsand application of farm inputs) was found to have a significant positive impact on yield of all threecrops. Interestingly, access to credit and information from neighboring farmers were a few of thecriteria that had a consistent and negative effect on yield across all three crops.
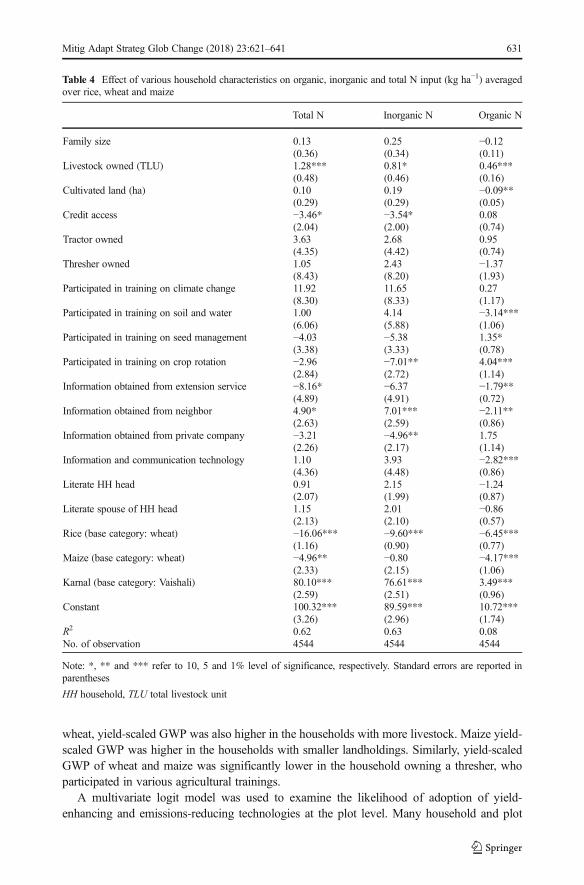
Overall, the amount of organic as well as inorganic fertilizer N input was significantlydifferent in the study sites (Table 4). In general, fertilizer N input was significantly higher inKarnal than in Vaishali and lower in rice and maize compared with wheat. Organic, inorganicand total N inputs were positively and significantly related to total livestock units in thehousehold implying that those households with more livestock tend to apply more N fertilizer.
Fig. 3 Box plot of yield-scaled GWP (blue) and corresponding observed grain yield (green) for each bin of Nrate in Vaishaili and Karnal. Each N bin is 20 kg N application range represented by the maximum value of therange (e.g. N bin 40, 60,… represents N application range between 20–40, 40–60,… and so on). The number atthe bottom to each bar represents the number of samples in each N bin
As in the case of yield, access to credit had a significantly negative effect on inorganic and thustotal N input but no effect on organic N. Training on crop rotation had a significant positiveeffect on organic N input and negative effect on inorganic N.
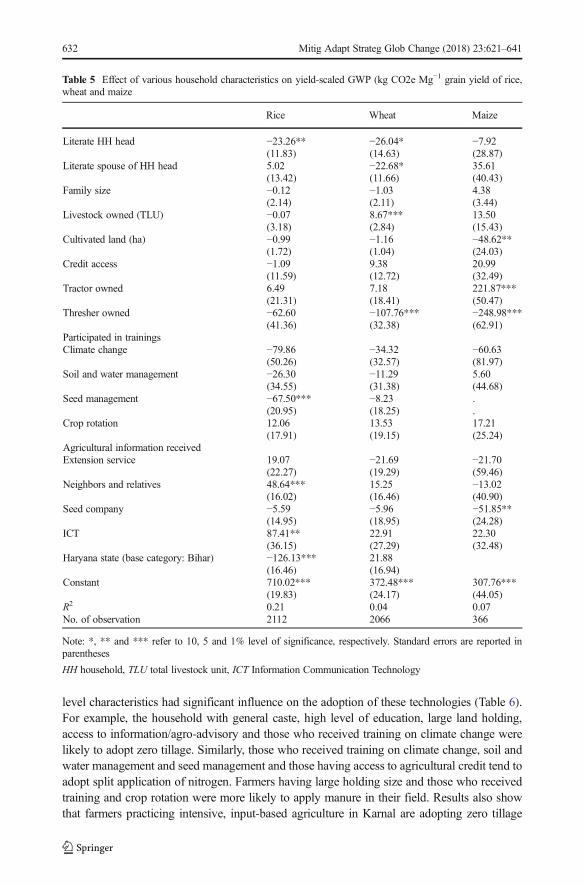
Yield-scaled GWP of rice and wheat was significantly lower in cases where the householdhead was literate as compared to the ones where household heads were illiterate (Table 5). In
Table 3 Effect of various household characteristics on the yield (kg ha−1) of rice, wheat and maize
Household characteristics Rice Wheat Maize
General caste HH 18.67 66.61 −112.50(36.58) (52.00) (170.65)
wheat, yield-scaled GWP was also higher in the households with more livestock. Maize yield-scaled GWP was higher in the households with smaller landholdings. Similarly, yield-scaledGWP of wheat and maize was significantly lower in the household owning a thresher, whoparticipated in various agricultural trainings.
A multivariate logit model was used to examine the likelihood of adoption of yield-enhancing and emissions-reducing technologies at the plot level. Many household and plot
Table 4 Effect of various household characteristics on organic, inorganic and total N input (kg ha−1) averagedover rice, wheat and maize
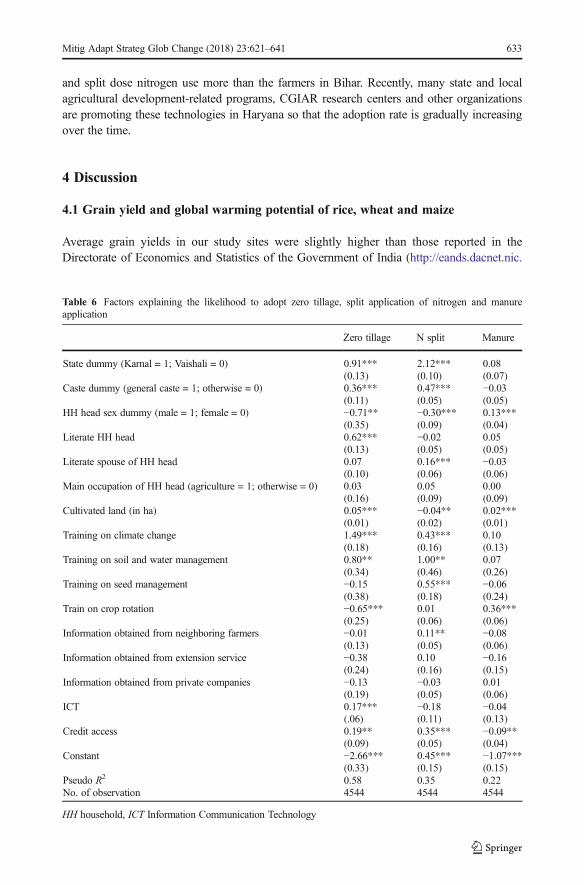
level characteristics had significant influence on the adoption of these technologies (Table 6).For example, the household with general caste, high level of education, large land holding,access to information/agro-advisory and those who received training on climate change werelikely to adopt zero tillage. Similarly, those who received training on climate change, soil andwater management and seed management and those having access to agricultural credit tend toadopt split application of nitrogen. Farmers having large holding size and those who receivedtraining and crop rotation were more likely to apply manure in their field. Results also showthat farmers practicing intensive, input-based agriculture in Karnal are adopting zero tillage
Table 5 Effect of various household characteristics on yield-scaled GWP (kg CO2e Mg−1 grain yield of rice,wheat and maize
Rice Wheat Maize
Literate HH head −23.26** −26.04* −7.92(11.83) (14.63) (28.87)
Literate spouse of HH head 5.02 −22.68* 35.61(13.42) (11.66) (40.43)
and split dose nitrogen use more than the farmers in Bihar. Recently, many state and localagricultural development-related programs, CGIAR research centers and other organizationsare promoting these technologies in Haryana so that the adoption rate is gradually increasingover the time.
4 Discussion
4.1 Grain yield and global warming potential of rice, wheat and maize
Average grain yields in our study sites were slightly higher than those reported in theDirectorate of Economics and Statistics of the Government of India (http://eands.dacnet.nic.
Table 6 Factors explaining the likelihood to adopt zero tillage, split application of nitrogen and manureapplication
in) for respective crops in the respective states. Average grain yields observed in our studywere, however, less than those reported from on-station trials in Bihar (Jat et al. 2014) and alsothose reported from the on-farm nutrient management trials of wheat in Haryana (Sapkota et al.2014).
The total GWP for rice production in our study was within the range (1027–2632 kg CO2eha−1) reported from India (Bhatia et al. 2005; Malla et al. 2005; Datta et al. 2009) but smallerthan the values reported by Linquist et al. (2012) (3900 kg CO2e ha
−1) through global meta-analysis. Relatively higher emissions reported in Linquist’s meta-analysis are probably becausea large proportion of the data (77% of data points for rice) were from South-East Asia whererice is grown mostly under continuously flooded conditions leading to high CH4 emission. Inour study sites, rice is mostly grown as a rainfed crop in Vaishali or intermittently irrigated cropin Karnal. Thus, the magnitude of CH4 emission from rice in our study (18–65 kg CH4 ha
−1)was much smaller than those reported from South-East Asia and China (Zou et al. 2005; Maet al. 2009; Zhang et al. 2010; Shang et al. 2011). The estimated total GHG emission fromwheat and maize in our study was similar to those reported by Linquist et al. (2012) (1107–1238 kg CO2e ha
−1) through meta-analysis of field measurements globally.Higher total GHG emission from rice than wheat and maize (Fig. 2) was mainly driven by
higher CH4 emission. This is because anaerobic conditions in rice field leads tomethanogenesis (biochemical decomposition of organic matter in anaerobic environments),which is responsible for CH4 emission. Further, rice plants are important conduits of CH4 fromsoil to atmosphere sometime accounting for up to 90% of the total CH4 emission (Butterbach-bahl et al. 1997). The contribution of CH4 to the total GHG emission was nominal in the caseof wheat and maize. In both rice and wheat, total GHG emissions were higher in Karnal than inVaishali (Fig. 2) mainly driven by higher rates of N in Karnal than in Vaishali. GWP of wheatand maize was mainly driven by N2O and CO2 emissions related to fertilizer input. In thisstudy, CO2 emissions refer to the balance of CO2 emissions/sequestration due to tillage andorganic matter application (compost, manure and crop residues); CO2 emissions due toproduction and transportation of fertilizer; and CO2 emissions due to application of urea inthe field.
Linquist et al. (2012) suggest that yield-scaled GWP is an appropriate integrated metric thataddresses the dual goals of environmental protection and food security. In our study, yield-scaled GWP was almost two-fold greater in rice than wheat or maize (Fig. 2b). Evidently,higher yield-scaled GWP in rice than in wheat and maize was mainly due to CH4 emissionfrom rice. Yield-scaled GWP in rice, in our study, was smaller than the value reported byPathak et al. (2010) (1221 kg CO2e Mg−1) and larger than the value reported by Malla et al.(2005) (~210 kg CO2e Mg−1) for India but similar to the one reported by Linquist et al. (2012)(655 kg CO2e Mg−1). The GWP estimates of Pathak et al. (2010) are unrealistically high whilstthe lower GWP estimates reported by Malla et al. (2005) were because the authors consideredonly CH4 and N2O emission in GWP calculation. Our estimates also include CO2 emissiondue to production, transportation and field application of fertilizer besides field emission ofCH4 and N2O.
Yield-scaled GWP of wheat and maize production were slightly higher than the GWPvalue reported by Linquist et al. (2012) and by Malla et al. (2005) from the rice-wheatsystem of India. Again, this difference is primarily due to inclusion of CO2 emissionarising from production, transportation and field application of fertilizer in our GWPcalculation whereas GWP from other studies were solely based on field emission of CH4
4.2 Agronomic, management and household characteristics contributing to reduceGHG emission
Our study indicates that both N2O and CH4 emissions are higher with higher N input (Fig. S1)leading to higher total GHG emission in all crops. Higher N input associated with number oflivestock units (Table 3) indicates that farmers with more livestock in the household tend toapply more organic manure in addition to the usual amount of inorganic N. Lower yield-scaledemissions associated with literate household heads, larger holding size and thresher ownership(Table 5) suggest that richer and educated farmers intensify farming with better input-use-efficiency thereby reducing emissions while maintaining yield. Our findings are similar tothose of Ju et al. (2016) from China, who also reported that large farms are more sensitive tofertilizer use thereby increasing production and reducing emission. Similarly, lower yield-scaled GWP in maize among the farmers receiving information from private seed companiessuggest the higher yield from these farmers resulting from high yielding and quality seeds.Therefore, use of high yielding varieties (e.g. hybrids) to increase yield is one way forward toreduce emission intensity. Lower emission intensity with the farmers receiving training onclimate change, seed and cropping system management (Table 5) shows that increasingfarmers’ awareness and capacity in the area of agriculture and climate change is an importantmechanisms to reduce GHG emission from agriculture. The negative relationship betweencredit access and N input (Table 3) and thus crop yield (Table 2) indicates that farmers in thestudy area are probably using agricultural credit for non-agricultural purposes, as has also beenreported by Aryal et al. (2014). Higher GHG emissions with higher number of N-splits(Table 2) in this case were because farmers who apply fertilizer more frequently tend to applymore N fertilizer in total. Also, N2O emissions in our model are based on Bouwman et al.(2002) and do not take into account the effects of timing of N application. Although our resultsshow no effect of substituting inorganic N with organic sources, it should be noted that N fromthe organic sources will not be fully available to crops in the same season and may induce N2Oemissions in subsequent years also. Overall, these production technologies associated withprecision nutrient management, tillage and residue management etc. also contribute to climatechange adaptation and so could be promoted through appropriate programs and policies foradaptation-led mitigation in agriculture.
4.3 Identifying high-yield low-emission pathways of cereal production
The results from both high-input (Karnal) and low-input (Vaishali) production systems clearlyillustrate the dependence of GHG emissions on fertilizer usage, particularly N fertilizer(Table 2; Fig. 3). However, GHG emissions cannot be reduced only by reducing N fertilizerinput due to trade-offs between yield and food security. Lower crop yields may also induceemissions elsewhere by bringing additional land into cultivation in order to meet the shortfallin food production (Bellarby et al. 2014). As adequate nutrient input is essential to increase andmaintain crop production (Tittonell and Giller 2013), a valid approach under smallholdersystems is to compute and compare emissions on a per-tonne-product basis, i.e. yield-scaledGWP or emission intensity. The strong negative correlation between grain yield and emissionintensity for all three crops (Fig. 4) indicates that emission intensity can be reduced byincreasing yield.
To develop the pathways for emission-efficient production systems and identify therole of different variables for increasing production and reducing emissions, we present a
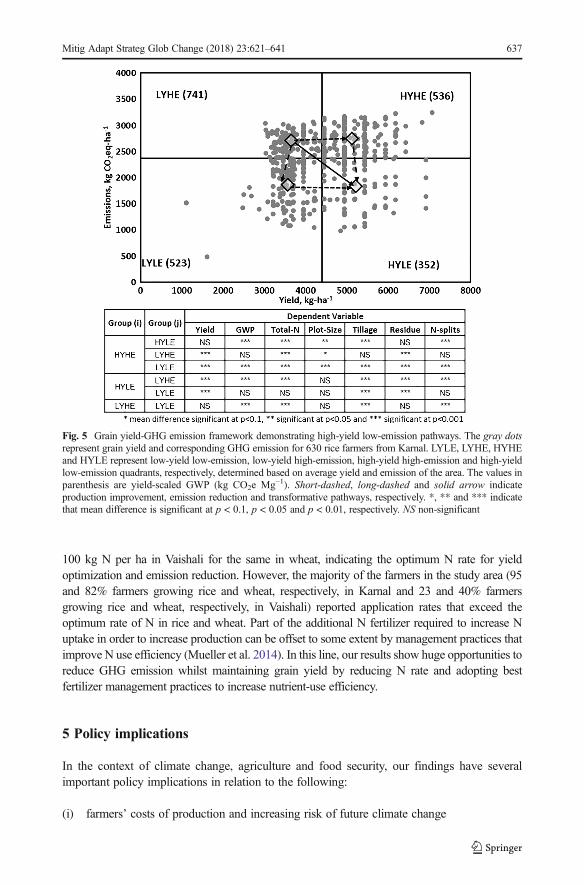
‘yield-GHG emission’ framework using rice production data from the high-input pro-duction system, i.e. Karnal, as an example. Taking the mean grain yield and GHGemissions, all rice farmers in Karnal were divided into four groups: low-yield low-emission (LYLE), low-yield high-emission (LYHE), high-yield high-emission (HYHE)and high-yield low-emission (HYLE) (Fig. 5). Yield-scaled GWP was the lowest inHYLE and the highest in LYHE, with LYLE and HYHE having intermediate yield-scaledGWP. Theoretically, developing high-yield low-emission production systems wouldrequire a shift towards HYLE, i.e. lower right quadrant of Fig. 5. For this, the farmersin HYHE quadrant can follow an emission reduction (without compromising yield)pathway (long-dashed arrow in Fig. 5) whereas those in LYLE quadrant can follow yieldimprovement (with no additional emission) pathway (short-dashed arrow in Fig. 5). Thefarmers in LYHE quadrant, on the other hand, can follow production improvementpathway, emission reduction pathway or even transformative pathway (increase produc-tion and reduce emission) (solid arrow in Fig. 5) depending on production condition andresources available. Zero-tillage (ZT) is primarily responsible for low emissions, both inlow and higher yield regimes. None of the farmers adopting ZT fell into the highemission quadrants (i.e. LYHE and HYHE) indicating that adoption of ZT is one ofthe ways towards low-emission pathway. As stated earlier, the higher emissions withhigher number of N splits were mainly due to the confounding of number of N splits andtotal amount applied with farmers using more N splits also using a greater amount of N.Farmers in HYHE and HYLE quadrants retained more crop residues supporting the viewthat residue retention is an essential component of sustainable intensification in tropicalagro-ecosystems (Powlson et al. 2016). Larger plot sizes in general resulted in loweremissions indicating higher input use efficiencies confirming the findings of Ju et al.(2016) from China.
As cereal seeds contain large amount of storage protein reserves and protein comprises about6% N (Ladha et al. 2016), more production will require more N uptake. However, significantlyhigher rate of N application by the farmers in LYHE quadrant than those in HYHE quadrantclearly demonstrates that higher total N does not necessarily result in higher yield but does lead tohigher emissions. This is because crop yield is likely to be limited by other factors including othernutrients, water and soil conditions. Precision N use (right source, right time and right method ofapplication) could be a transformative pathway for farmers in LYHE quadrant to increaseproduction and reduce GHG emission. Our results in Fig. 3 show that N application between80 and 100 kg N per ha (both in Karnal and Vaishali) provides the highest grain yield with thelowest GHG emission intensity in rice and between 120 and 140 kg N per ha in Karnal and 80–
Fig. 4 Relationship between yield-scaled GWP (kg CO2-eq Mg−1 grain yield) and grain yield of rice, wheat andmaize
100 kg N per ha in Vaishali for the same in wheat, indicating the optimum N rate for yieldoptimization and emission reduction. However, the majority of the farmers in the study area (95and 82% farmers growing rice and wheat, respectively, in Karnal and 23 and 40% farmersgrowing rice and wheat, respectively, in Vaishali) reported application rates that exceed theoptimum rate of N in rice and wheat. Part of the additional N fertilizer required to increase Nuptake in order to increase production can be offset to some extent by management practices thatimprove N use efficiency (Mueller et al. 2014). In this line, our results show huge opportunities toreduce GHG emission whilst maintaining grain yield by reducing N rate and adopting bestfertilizer management practices to increase nutrient-use efficiency.
5 Policy implications
In the context of climate change, agriculture and food security, our findings have severalimportant policy implications in relation to the following:
(i) farmers’ costs of production and increasing risk of future climate change
Fig. 5 Grain yield-GHG emission framework demonstrating high-yield low-emission pathways. The gray dotsrepresent grain yield and corresponding GHG emission for 630 rice farmers from Karnal. LYLE, LYHE, HYHEand HYLE represent low-yield low-emission, low-yield high-emission, high-yield high-emission and high-yieldlow-emission quadrants, respectively, determined based on average yield and emission of the area. The values inparenthesis are yield-scaled GWP (kg CO2e Mg−1). Short-dashed, long-dashed and solid arrow indicateproduction improvement, emission reduction and transformative pathways, respectively. *, ** and *** indicatethat mean difference is significant at p < 0.1, p < 0.05 and p < 0.01, respectively. NS non-significant
Cost of fertilizer is increasing over time and so supra-optimal application of fertilizerrepresents a wasted cost of production. At the level of an individual farmer, it may not besignificant, but collectively, it is a huge cost. As seen in Haryana where 82 to 95% of thefarmers were applying above the optimal rate, this leads to a huge loss of agricultural inputsand farm household income in addition to all the possible negative environmental externalities(Sapkota et al. 2014). Moreover, it has implications for climate change, which ultimatelyaffects farm production and increases the burden of adaptation in the future.
(ii) the government in terms of integrating policies and technology and enhancing farmersaccess to new technology and information
Many developing countries’ Intended Nationally Determined Contributions (INDCs) to theUNFCCC’s Paris Agreement have identified agriculture and allied sectors as one of thepriority areas for emission reduction. Our case study from low- and high-input productionsystems indicates that if commercialization of agriculture in low-input agriculture follows asimilar pathway to that of high-input production where rates of fertilizer use are supra-optimal,then targets for reductions in GHG emissions will be even more difficult to achieve. Therefore,the governments need to set up alternative pathways for agricultural development so that high-yield, low-emission targets are achieved in the agricultural sector. For example, optimumfertilizer application in wheat using optical sensors such as the GreenSeeker can reducenational emissions in India by 0.14 to 2.5 million Mg CO2e without compromising yield(Basak 2016). However, such alternative pathways should not only focus on technology butalso on the socio-economic and human behavioral dimensions. Our results show strongassociations between grain yield and emissions with various socio-economic and householdcharacteristics such as education and gender and access to information (mainly ICT).
(iii) agricultural research community and civil society
Coupled with the immediate task of tackling widespread poverty and nutritional insecurity,there is the pressing challenge of increasing farmer awareness of new technologies indeveloping countries. Governments need to work together with the international communityto disseminate appropriate technologies that help farmers take rational decisions to makeagricultural production sustainable. Our findings add to the understanding of the social driverscontributing to climate change, particularly in relation to GHG emissions from agriculture. Wefound that education and access to information are important factors affecting crop yield andemissions. There is a need to educate farmers about the adverse impact of adopting inappro-priate technologies. Farm cooperatives and local non-governmental organizations can play avital role here. The Governments need to support local organizations to carry out on-farmtraining courses. ICT can be used to inform farmers on how they can make savings in terms ofreduced cost of input (e.g. fertilizer) and increase income through higher yields.
6 Conclusion
The global target for reducing agricultural emissions to limit global warming in 2100 to 2 °Cabove pre-industrial levels is ca. 1 gigatonne of CO2 equivalent per year by 2030 (Wollenberget al. 2016). Low emission development (LED) in agriculture with the adoption of appropriate
technologies and practices can deliver a large portion of the needed mitigation. For this,agricultural production systems must consider the impacts of adaptive interventions not only interms of the primary goal of food security but also in terms of GHG emissions. This studyexplores the options that can help to reduce agricultural emissions whilst raising productionand in a region of global importance in relation to the food-climate nexus. Our study highlightsthe contribution that improved cropland management can make to India’s INDC of emissionsreduction to UNFCCC.
Growth in food demand and agricultural emissions is projected to be among the highestin Asia and most particularly in the Indian subcontinent. High-yield low-emission path-ways are required to address the rapidly increasing demand for food and global climatechange. Our analyses clearly indicate that in the case of agriculture, a high-yield low-emission pathway is possible through wide-scale adoption of improved technologies andpractices such as tillage, irrigation, residue, farm manure and nitrogen fertilizer applicationand management.
All mitigation-related interventions require investment decisions at the household level.Our analyses show that the implementation of emission-reducing technologies and practicesare influenced by the household’s socio-economic conditions including family size, gender ofhousehold head and farm size as well as flow of information through training and use of ICT.These socio-economic factors must be taken into account when considering the scaling out ofmitigation-related interventions and the implementation of high-yield low-emission pathwaysin agriculture. Future research evaluating a high-yield low-emission pathway in agricultureshould consider not only emission-reducing interventions but also the tradeoffs between GHGemissions and food/nutrition security in different agricultural production systems.
Acknowledgements This work was carried out as part of International Maize and Wheat Improvement Center(CIMMYT) and the CGIAR research program on Climate Change, Agriculture and Food Security (CCAFS),with the support from CGIAR Fund Donors and through bilateral funding agreements. For details, please visithttps://ccafs.cgiar.org/donors. The views expressed in this paper cannot be taken to reflect the official opinions ofthese organizations. We sincerely acknowledge the support rendered by the farmers of Haryana and Bihar duringthis study. We thank Sarbashi Ray for her help in initial data cleaning.
Open Access This article is distributed under the terms of the Creative Commons Attribution 4.0 InternationalLicense (http://creativecommons.org/licenses/by/4.0/), which permits unrestricted use, distribution, and repro-duction in any medium, provided you give appropriate credit to the original author(s) and the source, provide alink to the Creative Commons license, and indicate if changes were made.
References
Aryal JP, Farnworth CR, Khurana R, et al (2014) Gender dimensions of climate change adaptation throughcliamte smart agricultural practices in India. In: Innovation in Indian agriculture: ways forward. Institute ofEconomic Growth (IEG), New Delhi, and international food policy research institute (IFPRI), WashingtonDC, New Delhi, India
Basak R (2016) Benefits and costs of nitrogen fertilizer management for climate change mitigation: focus onIndia and Mexico. CCAFS working paper no. 161. CGIAR research program on climate change, agricultureand food security (CCAFS), Copenhagen
Bellarby J, Stirling C, Vetter SH et al (2014) Identifying secure and low carbon food production practices: a casestudy in Kenya and Ethiopia. Agric Ecosyst Environ 197:137–146. doi:10.1016/j.agee.2014.07.015
Bhatia A, Pathak H, Jain N et al (2005) Global warming potential of manure amended soils under rice–wheatsystem in the indo-Gangetic plains. Atmos Environ 39:6976–6984
Boateng K, Obeng G, Mensah E (2017) Rice cultivation and greenhouse gas emissions: a review and conceptualframework with reference to Ghana. Agriculture 7:7. doi:10.3390/agriculture7010007
Bouwman AF, Boumans LJM, Batjes NH (2002) Emissions of N2O and NO from fertilized fields: summary ofavailable measurement data. Glob Biogeochem Cycles 16:1058. doi:10.1029/2001GB001811
Butterbach-bahl K, Papen H, Rennenberg H (1997) Impact of gas transport through rice cultivars on methaneemission from rice paddy fields. Plant Cell Environ 20:1175–1183. doi:10.1046/j.1365-3040.1997.d01-142.x
Camargo GGT, Ryan MR, Richard TOML (2013) Energy use and greenhouse gas emissions from cropproduction using the farm energy analysis tool. Bioscience 63:263–273. doi:10.1525/bio.2013.63.4.6
Cameron CA, Trivedi PK (2009) Microeconometrics using Stata. Stata Press, TexasCCAFS (2015) Mitigating direct agriculture emissions. CGIAR research program on agriculture. Climate
Change and Food Security, CopenhagenCui ZL, Wu L, Ye YL et al (2014) Trade-offs between high yields and greenhouse gas emissions in irrigation
wheat cropland in China. Biogeosciences 11:2287–2294. doi:10.5194/bg-11-2287-2014Datta A, Nayak DRR, Sinhababu DPP, Adhya TKK (2009) Methane and nitrous oxide emissions from an
integrated rainfed rice-fish farming system of eastern India. Agric Ecosyst Environ 129:228–237.doi:10.1016/j.agee.2008.09.003
Dobermann A, Fairhurst TH (2002) Rice straw management. Better Crop Int 16:7–11Ecoinvent Center (2007) Ecoinvent data v2.0. Ecoinvent report No. 1–25. Swiss Centre of Life Cycle
Inventories, DubendorfFAO/IFA (2001) Global estimates of gaseous emissions of NH3, NO and N2O from agricultural land. FAO and
IFA, RomeFeliciano D, Nayak D, Vetter SH, Hillier J (2016) CCAFS Mitigation Options Tool. www.ccafs.cgiar.orgGe M, Friedrich J, Damassa T (2014). 6 graphs explains the world’s top 10 emitters. https://wri.org/blog/2014/11
/6-graphs-explain-world's-top-10-emittersGodfray H, Muir J, Beddington JR, et al (2010) Food Security: the challenge of feeding 9 billion peopleINCCA (2010) India: greenhouse gas emissions 2007. Indian network for climate change assessment. Ministry of
Environment and Forests, Government of IndiaIPCC (2006) IPCC guidelines for national greenhouse gas inventories. In: Eggleston S, Buendia L, Miwa K et al (eds)
IPCCguidelines for national greenhouse gas inventories. Institute for Global Environmental Strategies, KanagawaIPCC (2013) Climate change 2013. The physical science basis. Working group I contribuiton to the fifth
assessment report of the intergovernmental panel on climate change. Chapter 8: anthropogenic and naturalRAdiative forcing. Intergovernmental panel on climate Chang
Jat ML, Saharawat YS, Gupta RK (2011) Conservation agriculture in cereal systems of south Asia : nutrientmanagement perspectives. Karnataka J Agric Sci 24:100–105
Jat RK, Sapkota TB, Singh RG et al (2014) Seven years of conservation agriculture in a rice–wheat rotation ofeastern Gangetic Plains of South Asia: yield trends and economic profitability. Field Crop Res 164:199–210.doi:10.1016/j.fcr.2014.04.015
Ju X, Gu B, Wu Y, Galloway JN (2016) Reducing China’s fertilizer use by increasing farm size. Glob EnvironChang 41:26–32. doi:10.1016/j.gloenvcha.2016.08.005
Keil A, D’souza A, McDonald A (2015) Zero-tillage as a pathway for sustainable wheat intensification in theeastern indo-Gangetic Plains: does it work in farmers’ fields? Food Secur 7:983–1001. doi:10.1007/s12571-015-0492-3
Khan S, Khan MA, Hanjra MA, Mu J (2009) Pathways to reduce the environmental footprints of water andenergy inputs in food production. Food Policy 34:141–149
Khatri-Chhetri A, Aryal JP, Sapkota TB, Khurana R (2016) Economic benefits of climate-smart agriculturalpractices to smallholder farmers in the indo-Gangetic Plains of India. Curr Sci. doi:10.18520/cs/v110/i7/1251-1256
Ladha JK, Tirol-Padre A, Reddy CK et al (2016) Global nitrogen budgets in cereals: a 50-year assessment formaize, rice, and wheat production systems. Sci Rep 6:19355. doi:10.1038/srep19355
Linquist B, Groenigen KJ, Adviento-Borbe MA et al (2012) An agronomic assessment of greenhouse gasemissions from major cereal crops. Glob Chang Biol 18:194–209
Ma J, Ma E, Xu H et al (2009) Wheat straw management affects CH 4 and N 2 O emissions from rice fields. SoilBiol Biochem 41:1022–1028
Malla G, Bhatia A, Pathak H et al (2005) Mitigating nitrous oxide and methane emissions from soil in rice–wheatsystem of the indo-Gangetic plain with nitrification and urease inhibitors. Chemosphere 58:141–147
Mottaleb KA, Krupnik TJ, Erenstein O (2016) Factors associated with small-scale agricultural machineryadoption in Bangladesh: census findings. J Rural Stud 46:155–168. doi:10.1016/j.jrurstud.2016.06.012
Mueller ND, West PC, Gerber JS et al (2014) A tradeoff frontier for global nitrogen use and cereal production.Environ Res Lett 9:54002. doi:10.1088/1748-9326/9/5/054002
Ogle S, Breidt FJ, Paustian K (2005) Agricultural management impacts on soil organic carbon storage undermoist and dry climatic conditions of temperate and tropical regions. Biogeochemistry 72:87–121 LA–English. doi:10.1007/s10533-004-0360-2
Pathak H, Jain N, Bhatia A et al (2010) Carbon footprints of Indian food items. Agric Ecosyst Environ 139:66–73. doi:10.1016/j.agee.2010.07.002
Powlson DS, Stirling CM, Thierfelder C et al (2016) Does conservation agriculture deliver climate changemitigation through soil carbon sequestration in tropical agro-ecosystems? Agric Ecosyst Environ 220:164–174. doi:10.1016/j.agee.2016.01.005
R Core Team (2016) R: A language and environment for statistical computing. R Foundation for StatisticalComputing, Vienna www.R-project.org
Richards M, Bruun TB, Campbell BM, et al (2016) How countries plan to address agricultural adaptation andmitigation: an analysis of intended nationally determined contributions. CCAFS dataset
Saharawat YS, Singh B, Malik RK, et al (2010) Evaluation of alternative tillage and crop establishment methodsin a rice–wheat rotation in North Western IGP. F Crop Res 116:260–267. doi:10.1016/j.fcr.2010.01.003
Sapkota TB, Majumdar K, Jat ML et al (2014) Precision nutrient management in conservation agriculture basedwheat production of Northwest India: profitability, nutrient use efficiency and environmental footprint. FieldCrop Res 155:233–244. doi:10.1016/j.fcr.2013.09.001
Sapkota TB, Jat ML, Aryal JP et al (2015a) Climate change adaptation, greenhouse gas mitigation and economicprofitability of conservation agriculture: some examples from cereal systems of indo-Gangetic Plains. JIntegr Agric 14:1524–1533. doi:10.1016/S2095-3119(15)61093-0
Sapkota TB, Jat ML, Shankar V et al (2015b) Tillage, residue and nitrogen management effects on methane andnitrous oxide emission from rice–wheat system of Indian northwest indo-Gangetic Plains. J Integr EnvironSci 12:1–16. doi:10.1080/1943815X.2015.1110181
Shang Q, Yang X, Gao C et al (2011) Net annual global warming potential and greenhouse gas intensity inChinese double rice-cropping systems: a 3-year field measurement in long-term fertilizer experiments. GlobChang Biol 17:2196–2210. doi:10.1111/j.1365-2486.2010.02374.x
Shangguan W, Dai Y, Duan Q et al (2014) A global soil data set for earth system modeling. J Adv Model EarthSyst 6:249–263
Shcherbak I, Millar N, Robertson GP (2014) Global metaanalysis of the nonlinear response of soil nitrous oxide(N2O) emissions to fertilizer nitrogen. Proc Natl Acad Sci U S A 111:9199–9204. doi:10.1073/pnas.1322434111
Smith P, Powlson D, Glendining M, Smith JO (1997) Potential for carbon sequestration in European soils:preliminary estimates for five scenarios using results from long-term experiments. Glob Chang Biol 3:67–79. doi:10.1046/j.1365-2486.1997.00055.x
Smith P, Bustamante M, Ahammad H et al (2014) Agriculture, forestry and other land use (AFOLU). In:Edenhofer O, Pichs-Madruga R, Sokona Y et al (eds) Climate change 2014: mitigation of climate change,contribution of working group III to the fifth assessment report of the intergovernmental panel on climatechange. Cambridge University Press, Cambridge
Tandon HLS (1994) Fertilizers, organic manures, recyclable wastes and biofertilizers. Fertilizer Development andConsultantcy Organization (FDCO), New Delhi
Tittonell P, Giller KE (2013) When yield gaps are poverty traps: the paradigm of ecological intensification inAfrican smallholder agriculture. Field Crop Res 143:76–90. doi:10.1016/j.fcr.2012.10.007
Tubiello FN, Salvatore M, Cóndor Golec RD, et al (2014) Agriculture, Forestry and Other Land Use Emissionsby Sources and Removals by Sinks. FAO - e Food Agric Organ United Nations 2:4–89. doi:10.13140/2.1.4143.4245
Verge X, de Kimpe C, Desjardins, R (2007) Agricultural production, greenhouse gas emissions and mitigationpotential. Agric Forest Meteorol 142:255–269
Vetter SH, Sapkota TB, Hillier J et al (2017) Greenhouse gas emissions from agricultural food production tosupply Indian diets: implications for climate change mitigation. Agric Ecosyst Environ 237:234–241.doi:10.1016/j.agee.2016.12.024
Wassmann R, Lantin RS, Neue HU, et al (2000) Characterization of methane emissions from rice fields in Asia.III . Mitigation options and future research needs. 23–36
Wickham H (2009) ggplot2: elegant graphics for data analysis. Springer Science & Business MediaWollenberg E, Richards M, Smith P et al (2016) Reducing emissions from agriculture to meet the 2°C target.
Glob Chang Biol 1–6. doi:10.1111/gcb.13340Zhang A, Cui L, Pan G et al (2010) Effect of biochar amendment on yield and methane and nitrous oxide
emissions from a rice paddy from tai Lake plain, China. Agric Ecosyst Environ 139:469–475. doi:10.1016/j.agee.2010.09.003
Zou J, Huang Y, Jiang J et al (2005) A 3-year field measurement of methane and nitrous oxide emissions fromrice paddies in China: effects of water regime, crop residue, and fertilizer application. Glob BiogeochemCycles 19:1–9. doi:10.1029/2004GB002401