Identifying Relevant Information for
Emergency Services from Twitter in
Response to Natural Disaster
Avijit Paul
Master of Science
Submitted in fulfilment of the requirements for the degree of
Doctor of Philosophy
Creative Industries Faculty
Queensland University of Technology
2015
i
Keywords
Emergency services, Twitter, Social Media, Computational Social Science, Big data,
Natural Language Processing
ii
Abstract During recent natural disasters (e.g., Queensland Flood in 2010‐2011 and
Earthquake, Tsunami and Nuclear Crisis in Japan 2011, Typhoon Haiyan in 2013)
millions of status updates appeared on various social networks. This suggests that
people’s reliance on social media at times of disaster has increased tremendously in
recent years. However, the greatest concern to emergency services when it comes
to harvesting information from users of social media is the quality of the received
data content. At present it is highly problematic to differentiate between
information that has a high degree of disaster relevance and that information which
has a very low degree of disaster relevance. And this is not simply an
inconvenience, it poses a significant challenge that if resolved can mean the
difference between life‐saving decisions and life‐wasting decisions.
This project analyses natural disaster related conversation in Twitter that occurs
during the dynamic states of an unfolding disaster. It proposes a framework that
identifies high‐value disaster based information by digitally harvesting and
categorising social media conversation streams that are relevant for emergency
services for intelligence gathering and to facilitate key decision‐making processes
during times of natural disaster. The original contribution of this thesis is three‐fold.
The first contribution is in the creation of a new coding category that emergency
services and researchers in crisis communications can use when analysing contents
relating to natural disasters. The second contribution is the framework that
combines novel features using well‐established algorithms to identify disaster
relevant conversations from social media streams. Methods for extending
qualitative analysis to large scale quantitative analysis in the area of social media
and Twitter research is the third contribution of this research.
iii
Table of Contents
KEYWORDS I
ABSTRACT II
TABLE OF CONTENTS III
LIST OF FIGURES VII
LIST OF TABLES IX
PUBLICATIONS X
STATEMENT OF ORIGINAL AUTHORSHIP XI
ACKNOWLEDGEMENT XII
CHAPTER 1: INTRODUCTION 1
1.1 Context of the Study 2
1.2 Aim and Scope 4
1.3 Research Question 5
1.4 Significance of the Study 7
1.5 Thesis Outline 8
CHAPTER 2: LITERATURE REVIEW 10
2.1 Research Domain and Literature Map 10
2.2 Hazard, Emergency and Disaster 12 2.2.1 Types of natural disasters 13 2.2.2 Natural disaster classification 14 2.2.3 Historical context 15 2.2.4 Emergency alert guidelines 17 2.2.5 Role of emergency services 18 2.2.6 Disaster management cycle 19 2.2.7 Hyogo Framework for Action 24 2.2.8 Emerging from disaster management literature 26
2.3 Twitter in Everyday Life and Crisis Events 28 2.3.1 Overview of social media sites 30 2.3.2 Twitter as a medium 34
iv
2.3.3 Twitter as news medium 36 2.3.4 Twitter in crisis communication 37 2.3.5 Selecting Twitter for this research 39 2.3.6 How Twitter is used in a crisis situation 41 2.3.7 Twitter uses and collective behaviour theories 44 2.3.8 Challenges with Twitter data 49 2.3.9 Emerging from Twitter related literature 54
2.4 Summary 55
CHAPTER 3: METHODOLOGY 57
3.1 Deep Data, Surface Data and Big Data 57
3.2 Gathering Twitter Data 60 3.2.1 Twitter data 61 3.2.2 Twitter metadata 69 3.2.3 Twitter data and metadata source 72 3.2.4 Data gathering tools 75
3.3 Methods for Analysis 77 3.3.1 Qualitative analysis methods 78 3.3.2 Quantitative analysis methods 83 3.3.3 Mixed method approach 95
3.4 Research Design 96 3.4.1 Data collection and sample size 98
3.5 Evaluation of Outputs 100 3.5.1 Cross validation 101 3.5.2 Outperforming a random baseline 101
3.6 Summary 105
CHAPTER 4: MANUAL ANALYSIS 106
4.1 Sampling for Manual Analysis 107 4.1.1 Sampling for phase one part one 108 4.1.2 Sampling for phase one part two 110
4.2 Coding and Ranking 116 4.2.1 Coding categories and theme 117 4.2.2 Ranking of information 121
4.3 Part One: #qldfloods dataset 123 4.3.1 Distribution of coding categories 125 4.3.2 Occurrence of specific information 127 4.3.3 Keywords 130 4.3.4 Part‐of‐Speech 132 4.3.5 Summary of findings 134
4.4 Phase One Part Two: Yolanda dataset 135 4.4.1 Distribution of coding categories 136 4.4.2 Occurrence of specific information 138 4.4.3 Keywords 140 4.4.4 Part of speech 142
v
4.4.5 Other findings 143 4.4.6 Summary of findings 146
4.5 Summary of Findings from Manual Analysis 147 4.5.1 Rule based filtering 151 4.5.2 Limitations of the study 152
CHAPTER 5: AUTOMATED ANALYSIS 153
5.1 Sample Size for Analysis 154
5.2 Mapping Features and Methods 155 5.2.1 Image and URL distribution 156 5.2.2 Named entity extraction 156 5.2.3 Keywords 157
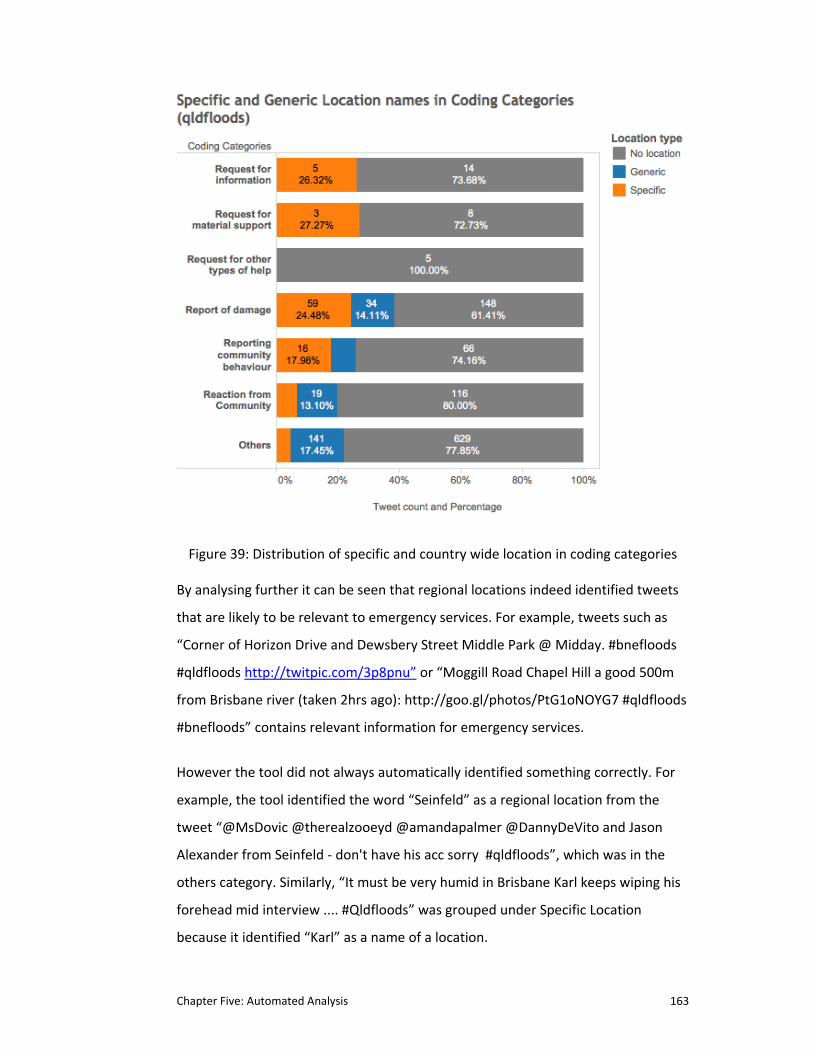
5.3 Phase Two Part One: #qldfloods dataset 159 5.3.1 Image distribution 159 5.3.2 Named entity distribution 161 5.3.3 Keywords distribution 164 5.3.4 Summary of findings 168
5.4 Phase Two Part Two: Yolanda dataset 169 5.4.1 Image distribution 169 5.4.2 Named entity distribution 172 5.4.3 Keywords distribution 176 5.4.4 Summary of findings 179
5.5 Summary of Findings from Automated Analysis 179
CHAPTER 6: DISCUSSION 182
6.1 Sub RQ1: Identifying Relevant tweet for emergency services 184
6.2 Sub RQ 2: Identifying relevant tweets automatically 186 6.2.1 Existence of image 187 6.2.2 Specific location 187 6.2.3 Desirable keywords for emergency services 188 6.2.4 Undesirable keywords for emergency services 189
6.3 Combining Features 189 6.3.1 #qldfloods dataset 190 6.3.2 Yolanda dataset 198 6.3.3 Combined regression coefficient 203
6.4 Result and Evaluation of Combined Features 204 6.4.1 Scoring each tweet 205 6.4.2 Cut off score 206 6.4.3 Evaluating output of the system using MicroMapper coding 208
6.5 Limitations 210 6.5.1 Infrastructure damage 210 6.5.2 Requests for help 211 6.5.3 Not relevant 212
6.6 Summary of Discussion 214
vi
CHAPTER 7: CONCLUSION 216
7.1 Implications and Contributions to Knowledge 217 7.1.1 Crisis informatics 217 7.1.2 Emergency services 218 7.1.3 Research process 219
7.2 Practical Uses 220
7.3 Limitations 220
7.4 Future research 222 7.4.1 Better quality location detection 222 7.4.2 Automated image recognition 222 7.4.3 Keyword detection and expansion 223 7.4.4 Hashtag identification and separation 223 7.4.5 Better weighting 224 7.4.6 Twitter users 224 7.4.7 Different disaster dataset 224
REFERENCES 226
APPENDICES 258 Appendix A: Sample Json file 258 Appendix B: Data Collection Process 260 Appendix C: Setting up development platform 261 Appendix D: SQL Queries & Python Scripts 263 Appendix E: List of Keywords 264 Appendix F: Extending with Wikipedia & Wordnet 266 Appendix G: Using Co‐occurance of keywords 271 Appendix H: Using Sentiment Analysis 274 Appendix I: Using part of speech 278
vii
List of Figures Figure 1: Current and optimal situation after natural disaster (Queensland Government, 2012) 1
Figure 2: Thesis outline 8
Figure 3: Research domain and concept map of the literatures reviewed 10
Figure 4: Natural Disaster Classification by Below et al. (2009) 15
Figure 5: Estimated damage cost by natural disasters from Em‐DAT (Emergency Events Database,
2014) 16
Figure 6: Four phases of disaster cycle introduced by National Governors Association in 1979 20
Figure 7: Hyogo Framework for Action (ISDR, 2005) 25
Figure 8: Chris Messina outlines a proposal for Twitter Tag Channels 48
Figure 9: People’s response for Mexico earthquake in Twitter with #earthquake hashtag 50
Figure 10: A Sample tweet related to a crisis situation 62
Figure 11: A sample profile page of Queensland Police Media Unit 65
Figure 12: A sample profile page of an automated bot 66
Figure 13: Research Design Flowchart 98
Figure 14: Research design flowchart – manual analysis (phase one) 107
Figure 15: Count of tweet per day based on #qldfloods dataset excluding RT. 109
Figure 16: Tweets per hour on 12th January 2011 109
Figure 17: Tutorial at the start of MicroMapping explaining the categories 111
Figure 18: A sample tweet being evaluated via MicroMappers 112
Figure 19: Agreement among MicroMappers whether the tweet belongs to a category 114
Figure 20: Number of tweets with more than 80% agreement between MicroMappers 115
Figure 21: Total tweets based on their ranks from sample tweets 125
Figure 22: Distribution of tweets in their coding categories and sub categories by rank (#qldfloods)
127
Figure 23: Percentage of location names and Image in the tweets based on ranks (#qldfloods) 128
Figure 24: Percentage of named entity and image in the tweets based on codes (#qldfloods) 129
Figure 25: Distribution of parts of speech in their ranks from #qldfloods tweets 132
Figure 26: Distribution of parts of speech in #qldfloods tweets 133
Figure 27: Distribution of tweets in their coding categories and sub categories by rank (Yolanda) 137
Figure 28: Count and percentage of image and location names in tweets by rank (Yolanda) 139
Figure 29: Count and percentage of image and location names in tweets by their code (Yolanda) 140
Figure 30: Distribution of parts of speech by ranks in Yolanda 142
Figure 31: Distribution of parts of speech by coding category in Yolanda 143
Figure 32: Twitter users attempt to reach CNN 144
Figure 33: Types of people users were trying to reach 144
Figure 34: Comparison of distribution of tweets in their coding categories by rank 148
viii
Figure 35: Comparison of image and location in tweets by rank 149
Figure 36: Research design flowchart – automated analysis (phase two) 154
Figure 37: Distribution of coding categories in image based tweets 160
Figure 38: Distribution of types of named entity in their coding categories 162
Figure 39: Distribution of specific and country wide location in coding categories 163
Figure 40: Distribution of coding categories in Report of Damage and Request 165
Figure 41: Distribution of coding categories for undesirable keywords 167
Figure 42: Distribution of coding categories in tweets with images 170
Figure 43: Sample irrelevant tweets for emergency services that has photos 171
Figure 44: Sample tweets relevant for emergency services that has photos 172
Figure 45: Distribution of categories in each named entities (Yolanda) 173
Figure 46: Distribution of generic and specific locations in tweets with location mention (Yolanda)
174
Figure 47: Presence of desirable keywords in their coding category (Yolanda) 177
Figure 48: Presence of undesirable keywords in their coding category (Yolanda) 178
Figure 49: Comparing probability of tweets with and without features with random chance
(#qldfloods) 196
Figure 50: Comparing probability of tweets with and without features with random chance (Yolanda)
201
Figure 51: Change in count and percentage of tweets from Yolanda dataset based on change of cut‐
off score 207
Figure 52: Change in percentage and count of tweets in above cut off score in their category 208
ix
List of Tables Table 1: When to raise an alert (Emergency Management, 2003) 18
Table 2: List of notable social networking sites as of early 2015 32
Table 3: Twitter data sources 72
Table 4: List of off the shelf Twitter data collection tools 76
Table 5: Coding schema developed by Vieweg (2012a) with regards to natural disaster tweets 81
Table 6: Coding schema developed by Bruns et al. (2012) with regards to natural disaster tweets 81
Table 7: Coding categories based on the need of emergency services 118
Table 8: Ranking of tweets 122
Table 9: Ranking and other metadata analysis of the tweets 123
Table 10: Common keywords in #qldfloods dataset based on their coding categories 131
Table 11: Common keywords in Yolanda dataset based on their coding categories 141
Table 12: Summary of common and specific keywords in #qldfloods and Yolanda dataset 150
Table 13: Desirable Keywords listed under Report of Damage category that was used for testing 158
Table 14: Undesirable keywords listed under other categories that was used for testing 158
Table 15: Tweet counts in their coding categories (#qldfloods) 191
Table 16: Independent probability of a tweet belonging to a certain coding category (#qldfloods). 192
Table 17: Tweet counts based on Report of Damage and images 193
Table 18: Tweet counts based on their location 194
Table 19: Tweet counts based on undesirable keywords list 195
Table 20: Tweet counts based on desirable keywords list 195
Table 21: Random probability and difference with random chance in #qldfloods dataset 197
Table 22: Independent probability of a tweet belonging to a certain coding category in Yolanda
tweets 199
Table 23: Tweet counts based on Infrastructure Damage and image 199
Table 24: Tweet counts based on Infrastructure Damage and location 200
Table 25: Tweet counts based on Infrastructure Damage and undesirable keywords 200
Table 26: Tweet counts based on Infrastructure Damage and desirable keywords 200
Table 27: Random probability and regression coefficients of Yolanda dataset 202
Table 28: Calculating Regression coefficients for final experiment 204
Table 29: Calculating relevance score of sample tweets 206
x
Publications
Woodford, D., Walker, S., & Paul, A. (2013). Slicing Big Data: Extracting
important information from a social network stream during crisis. In Selected
Papers of Internet Research 14.0 (pp. 10‐13). Denver, USA: AOIR.
Paul, A (2013, May 28 ‐ 30) A framework for identifying named entities from
social media discussions in crisis situation, Paper presented in Australian and New
Zealand Disaster and Emergency Management Conference, Brisbane, Australia.
Paul, A & Bruns, A (2013) Usability of small crisis data sets in the absence of big
data. In Ariwa, Ezendu, Zhao, Wenbing, & Gandhi, Meenakshi (Eds.) Proceedings of
the 2013 International Conference on Information, Business and Education
Technology, (pp. 718‐721) Beijing, China Atlantis Press.
xi
Statement of Original Authorship
The work contained in this thesis has not been previously submitted to meet
requirements for an award at this or any other higher education institution. To the
best of my knowledge and belief, the thesis contains no material previously
published or written by another person except where due reference is made.
Signature:
Date: October 2015
QUT Verified Signature
xii
Acknowledgement I would like to express my sincere gratitude to my supervisors ‐ Professor Axel
Bruns, Professor Dian Tjondronegoro, and Dr. Oksana Zelenko for their guidance in
the last 3 years. I had the best supervision team of the world and it was still a
difficult journey. Without their support, I would not be where I am now.
I was fortunate to have Dr. Andy Lau doing his PhD in similar area because when I
was stuck with my programming and I could not find the answer in Google or Stack
Overflow, I could go to him. I would also like to extend my thanks to Dr. Tim
Highfield and Dr. Barabara Gligorijevic for helping me along the way with
encouragement, push and support. Thanks to Dr. Michelle Hall for proof reading
and correcting the grammar and other mistakes.
I am indebted to Irene Ma, Steve Fox, Vijay Ananad, Joy Zhang, Wilfred Wang,
Ruari Atkington, Fiona Suwana for helping in along this PhD journey. I am glad that
Meg Jing Zeng, Emma Potter, Andrew Quodling were all working in similar areas ‐
which helped me to talk about my ideas to them and get feedback. It was good to
have an uncle who had a PhD many years before and a cousin doing PhD in other
side of the world so I was never short of motivation.
My sincere thanks go to my wife for uprooting her life in Malaysia and moving over
here. My parents have sacrificed their whole life for me and I hope the struggle
pays off in the future.
Last but not least, thanks to QUT and Australian Government for giving me the
scholarship. It took me over hundreds of applications across the globe to get a full
scholarship and the experience in QUT made it worth it.
Chapter One: Introduction 1
Chapter 1: Introduction
The first 24 hours is considered the most crucial time in a natural disaster and is
when most community harm occurs (Queensland Government, 2012a). Delays in
attaining actionable information following a natural disaster have been shown to
lead to an increase in the number of casualties and to a slow response time from
disaster responders (Meier, 2012). Varying the range of sources used to identify
information relevant to disaster management to include social networks, for
example Twitter, has the potential to decrease the time it takes to find this
information, to minimise response time and to help to reduce community harm
(McElroy, 2014; Platt, Hood, & Citrin, 2011b). Figure 1 shows a model of reducing
community harm and the associated factors, including a timely and impactful
response immediately following the disaster. This includes disaster management
services obtaining immediate access to relevant information that can be actioned.
As immediate updates of situations can be found in social media, this study
investigates how disaster relevant information can be automatically identified from
social media streams.
Figure 1: Current and optimal situation after natural disaster (Queensland Government, 2012a)
2
1.1 Context of the Study
A number of recent natural disasters, including the New Zealand earthquake
(Christchurch, 2011), the Japanese tsunami (2011), Queensland flood (2012) and
Typhoon Haiyan in the Philippines (2013) have framed social network sites as
globally accepted channels for sharing information about disasters. The primary
uses include providing updates on specific situations, requests for help, as well as
general well‐wishes and expressions of concern. The use of social media for this
purpose has positioned it as a significant and powerful information source during
crisis events (Muralidharan, Rasmussen, Patterson, & Shin, 2011). According to the
American Red Cross (2011), people who use social media to share information
about disasters expect emergency response organisations to monitor and respond
to what they share (American Red Cross, 2011).
During recent natural disaster events (e.g., Queensland flood, Japanese
earthquake) the social networking sites Facebook and Twitter were the most
utilised sites for both sharing and accessing news and updates on the unfolding
events. Research shows that due to the ‘walled garden’ approach Facebook has
become less accessible than Twitter for public communication (Bruns, 2012). Given
Twitter updates are publicly available to non‐registered users, it is a platform that
allows any user to follow any other user without knowing them personally. Ability
to follow any user on Twitter allows community members to monitor
communication from a crisis authority organisation (e.g., Department of
Community Safety, Queensland Government) during a disaster in order to get real
time updates. This frames Twitter as a unique platform that simultaneously collects
and stores a large pool of potentially life saving disaster related information and
that acts as a key dissemination channel and information source at the same time.
For this reason Twitter was selected as the social networking site to be investigated
within this research project for its potential to provide timely critical information to
emergency services.
Chapter One: Introduction 3
Keeping track of the rapid flow of Twitter updates in order to filter useful
information is a key issue impacting tracking disaster communication (McElroy,
2014). Current research on Twitter uses the method of following hashtags and
keywords to identify messages related to a specific natural disaster in order to
retrieve disaster relevant information (Garcia‐Herranz, Egido, Cebrian, Christakis, &
Fowler, 2012; Potts, Seitzinger, Jones, & Harrison, 2011; Tsur & Rappoport, 2012).
However these methods of tracking information via hashtags and keywords have
limitations. A dominant hashtag can produce thousands of tweets per second
(Empson, 2012; Mandel et al., 2012) making the task of manually monitoring the
information flow humanly impossible. This is because the task of emergency
services is not limited to identify that a disaster is in progress, but to find out which
of the tweets have actionable information (e.g., reports of flooding roads with
location indicated) and which are personal narratives (e.g., well‐wishers or
expressions of community concern).
Researchers have made numerous attempts to devise tools for automated Twitter
analysis by using machine learning algorithms to identify potentially relevant
tweets (Bruns & Stieglitz, 2012; Lau, Tao, Tjondronegoro, & Li, 2012; Verma et al.,
2011; Acar & Muraki, 2011; Banerjee, Chakraborty, Joshi, Mittal, Rai, & Ravindran,
2012; Culotta, 2010; Hughes & Palen, 2009; Rogstadius, Vukovic, Teixeira,
Kostakos,Karapanos & Laredo, 2013). Chapter 2 and 3 discusses this in more details.
However, to date the process of using human intelligence has outperformed
automated systems in determining whether a tweet is disaster relevant and
actionable by disaster response units. As emergency services have limited human
resources, dedicating these to the evaluation of social media feeds in order to
identify disaster relevant information is not practical and does not take priority over
their core roles and responsibilities during and after a natural disaster. This
research presents a potential for new approaches in presenting Twitter information
to emergency services.
This study focuses on developing and testing a set of new approaches to produce a
subset of updates that is likely to be disaster relevant and actionable by disaster
4
management and to enable them to harness social media more effectively. To do
that, this research project analyses the needs of emergency services after a natural
disaster and then formulates a framework to identify disaster relevant information
for emergency services. Based on the identified information needs, the study
further develops a theoretical framework for new methods of automatically
identifying disaster relevant information from social media and tests it using data
sets of Tweets from two recent disasters. By building a theoretical framework for a
new approach to identifying disaster relevant information and an automated
system to test it, this project reframes the flow of social media content from
conversation streams to targeted actionable information that can help emergency
services make life saving decisions.
1.2 Aim and Scope
The main aim of the study is to help emergency services to identify natural disaster
relevant information on social media using individual user tweets and updates. The
automated filtering approach will assist emergency services with the evaluation of
Twitter messages by eliminating the unsustainable process of manually monitoring
thousands of tweets after a natural disaster, to instead focus evaluation efforts on a
handful of targeted messages with the highest degree of relevance. The aim of the
study is therefore not to focus on filtering out irrelevant social media updates.
Instead the research aims to develop a method that mimics a manual human
evaluation process using a set of automated techniques that reduce the
unmanageable number of tweets to a small enough sample that can be readily
assessed by the emergency services for critical actionable information.
It is outside the scope of this study to create an automated way of identifying if a
natural disaster has occurred. The scope of this study is further limited to disaster
information requirements of emergency services such as Department of
Chapter One: Introduction 5
Community Safety, Red Cross or similar humanitarian organisations. As the scope of
this study is limited to natural disaster, man made disasters including terrorism and
sabotage is not included in this dissertation. In addition, General tweets found not
to be relevant for emergency services are not included in this research. Thus, the
research questions focus on identifying what is specifically relevant for emergency
services in a disaster rather than what might be generally relevant. It is also
necessary to address that as this thesis focuses on getting information from social
media, density of social media users is an important variable in information
gathering from social media. If an area has a lower number of social media users,
amount of information that can be gathered from there even in the case of severe
situation is potentially lower than in an area with high number of social media
users.
A minimum social media literary is also needed by a user to be able to contribute in
social media stream. This would involve having a social media account or being able
to create an account. For the purpose of using Twitter during crisis this will also
include ability to use a hashtag to engage in an existing discussion about crisis. In
addition, having a mobile device from where the user can tweet also assist in
producing content during crisis event.
1.3 Research Question
This thesis has a central research question, which is further divided into two sub‐
questions. Dividing the central research question in two parts allows first part of
the research to focus on identifying information needs from emergency services
and in the second part to focus on automatically finding the type of information
identified as relevant in the first research question.
6
Central Research Question: How can relevant information for emergency services
be identified from social media streams automatically in response to natural
disaster?
During a natural disaster and immediately afterwards Twitter updates are posted at
a rapid pace, which further emphasises the need for emergency services to identify
relevant and potentially actionable information. Even though it is possible to read
through real time social media data, the large volume makes it a difficult task.
Navigating through thousands of Twitter updates to identify those containing
actionable information remains a major challenge for emergency services.
Therefore, a key aim of this research is to develop and test a new procedure that
automates the process of manually identifying relevant information for emergency
services and enables an emergency response to be actioned.
Sub Research Question 1: What is relevant information for emergency services
during and following a natural disaster?
As relevant is a relative term, the first problem to address is to determine what
constitutes relevant information for emergency services during and after a crisis
situation. Although there are various metrics currently available from social media
research, the question remains if these metrics contain the same type of
information emergency services are looking for, and if not, what is instead
considered relevant by them.
Sub Research Question 2: How can this relevant information be identified
automatically?
After identifying disaster relevant information, the next question is how can this
information be identified automatically and can this method be used to identify
relevant tweets from the sample of all available tweets on the topic. In order to do
that, the data is first analysed manually to determine how a human evaluator
selects and evaluates an individual message as disaster relevant. Secondly, once the
new automated process is developed, it is tested on the same data set to
Chapter One: Introduction 7
determine how closely the automated evaluation results mimic the manual process
of human evaluation undertaken in the first step.
1.4 Significance of the Study
This research proposes a novel contribution to identify disaster relevant
information from Twitter for emergency services. In order to improve identification
of disaster relevant information from Twitter, it extracts four features from tweets
and combines them to assign a disaster relevance score. By using this relevance
scoring algorithm emergency services can rank tweets according to their relevance
and exclude tweets below a certain threshold score to reduce the amount of
incoming tweets they need to review to find relevant information from social
media.
The contribution of this research also includes the proposal of a new coding
category to identify disaster relevant tweets. This coding category can be used by
other researchers and emergency services to categorise incoming tweets based on
their relevance, qualitatively or quantitatively. By combining existing coding
categories with information needs for emergency services, this coding category
advances the grouping of disaster relevant information beyond the currently
available categories.
The iterative research process used in this project also extends existing
interdisciplinary approaches in Twitter research. The method of using both manual
and automated analysis that was applied in this research can be used by other
researchers in the field of social media. Evaluating outputs from algorithms with
crowdcoded evaluation is a novel evaluation approach that has not previously been
used in the context of social media in disaster research and can be adopted by
other researchers.
8
1.5 Thesis Outline
This dissertation consists of seven chapters in four main parts. The overall thesis
outline is presented in Figure 2.
Figure 2: Thesis outline
In this Introduction (Chapter One) the overall position of this thesis, aim, scope and
research question has been described. The discussion then focuses on reviewing
literature, working documents and frameworks used by emergency services to find
what is likely to be considered as relevant information for emergency services
(Chapter Two). This is followed by a description of the research design and
methodology (Chapter Three).
The second part of the research is built on the first part where a manual analysis
was conducted on a small sample from two different datasets to identify the
features that separate a relevant from an irrelevant tweet (Chapter Four). Following
that an automated analysis was performed on the entire datasets to find out if
these features can be identified automatically (Chapter Five).
This leads to the third part where the findings were combined to create the overall
framework that is used to identify disaster relevant information automatically and
evaluate the outcome to find out if it can really identify disaster relevant
Chapter One: Introduction 9
information (Chapter Six). In the conclusion (Chapter Seven) the findings from the
combined framework and evaluation are summarised to describe if this research
has achieved the aim and to suggest potential future research.
10
Chapter 2: Literature Review
The primary research aim of this thesis is to find relevant information for
emergency services at times of natural disaster. This chapter therefore reviews
academic literature related to emergency services management, natural disasters
and information gathering from social media.
2.1 Research Domain and Literature Map
This dissertation falls in the broad spectrum of Crisis Informatics, an applied
interdisciplinary research paradigm that integrates technical, social as well as
informational facets of crisis events (Artman, Brynielsson, Johansson, & Trnka,
2011; Pipek, Palen, & Landgren, 2012; Shklovski, Burke, Kiesler, & Kraut, 2010). The
literature review is constructed around the three disciplines of crisis informatics –
disaster management, media and communication studies (including social media
studies) and computer science (Figure 3).
Figure 3: Research domain and concept map of the literatures reviewed
Chapter Two: Literature Review 11
Disaster management The first component of Figure 3 is disaster management.
This section discusses literature from the perspective of the disaster managers who
are responsible for humanitarian aspects of emergencies. They are involved in all
phases of disaster cycle in order to lessen the impact of disasters. What they deem
as relevant information after natural disaster is addressed in this section.
Media and communication studies The second component of Figure 3 is literature
related to media and communication, especially social media in everyday life and
role of social media during and after natural disaster, focusing on Twitter. Key
challenges of using Twitter in disaster situations are discussed in this section. This is
followed by a discussion of the common elements between information needs of
emergency services and what is available on Twitter.
Computer science The third component of Figure 3 is literature from computer
science because crisis informatics uses technology for various phases of disaster.
This section looks at various methods used in computer science to collect analyse
and evaluate information automatically.
Of these three disciplinary areas of crisis informatics, first two are discussed in the
literature review chapter and third, computer science, is discussed in the
methodology chapter. This is not to suggest that computer science literature has
been viewed only from a methodological point of view. Various computer science
theories have been evaluated for this thesis. In addition some of the tools
developed in this thesis also used computer science theories. Therefore it was
positioned in the Methodology so that both theory and practical discussions can be
included in the same area.
12
2.2 Hazard, Emergency and Disaster
This section provides an overview of the key theories and practices of disaster
management, particularly those related to response phase of disaster
management. As this thesis focuses on identifying relevant information from social
media after a natural disaster, the aim of this section is to identify what emergency
services need that can potentially be found in social media. Therefore the literature
reviewed in this section mostly focuses on crisis communication.
Before proceeding, it is necessary to discuss the terminologies related to crisis and
disaster, because there is a degree of uncertainty around the words used to
describe natural disasters. Despite the common uses of the word ‘crisis’ and
‘disaster’ to suggest a catastrophe, emergency services use different terms to
identify the severity of the event : hazard and emergency (Smith, 2013). Generally,
when a situation affects many people and arises due to massive scale natural (e.g.,
earthquake, cyclone) or technological (e.g., structural failure, terrorism) events that
exceed the ability of the emergency services (e.g., fire, ambulance, police), it is
classified as disaster by emergency services (Haddow, Bullock, & Coppola, 2010).
Based on the emergency services definition, the smallest unit of a disaster situation
is known as a ‘hazard’; which stands for the source of danger that may or may not
lead to emergency or disaster (National Governors Association, 1979). An
‘emergency’ is “a serious, unexpected, and often dangerous situation requiring
immediate action” (McConnan, 1998) that can be relevant for an individual or for a
community. In most cases if an emergency situation is life threatening, emergency
personnel (e.g., fire brigade, police) are called into action.
The term ‘disastrous’ event on the other hand is reserved for something much
bigger. Usually for an event to be considered disastrous it needs to affect one or
more critical areas – shelter, fire suppression and mass care – and has to occur in a
area too large for emergency services to handle. Therefore, from an emergency
Chapter Two: Literature Review 13
services point of view, a building fire is not a disaster, but a bush fire across a state
is a disaster, as it suppresses their ability to control the fire.
However, literature can also refer this situation as a crisis situation (Liu, 2010; Palen
& Liu, 2007; Reynolds, Galdo, & Sokler, 2002). As each of these terms can refer to a
different degree of damage, this dissertation aims to use the appropriate
terminology as based on the status of the situation
2.2.1 Types of natural disasters
In order to justify why the scope was limited to natural disasters, this section first
discusses the differences between types of disasters, followed by natural disasters
in historical context. Therefore before going deeper, it is necessary to clarify the
scope of this thesis in terms of the hazards it discusses.
Historically early classification of hazards only included situations that were caused
by natural forces, as it was difficult for people to create a disastrous situation
affecting large group of people. However, in recent years it has become increasingly
possible for a disaster to be man made. Therefore various organisations have
created various types of classification. Among them, one of the most widely used
classification was created by Centre for Research on the Epidemiology of Disasters
(CRED) under World Health Organization (WHO) (Below, Wirtz, & Guha‐Sapir,
2009) which classifies all hazards based on their source: natural and man‐made.
Since other emergency service organisations such as Red Cross and FEMA also
follow this classification (Haddow, et al., 2010), it was used in this dissertation.
Following are some of the example of natural and technological (man‐made)
hazards.
A) Natural hazards Hazards that are caused by natural forces are grouped under
the category Natural Hazard. These can be caused by hydrological (flood),
meteorological (cyclone, bushfire), seismic (earthquake), biological (epidemic),
volcanic or other natural processes, and often affect a large community of people.
14
B) Technological hazard Technological hazards are often man made hazards that
result from the failure of man made objects. Like natural hazards, man made or
technological hazards can arise from various causes such as transportation failure
(ship, plane), infrastructure (building, bridge) collapse, terrorism, sabotage and
nuclear hazards.
The biggest difference between these hazard categories is that, excluding nuclear
hazards, man made hazards often affect hundreds of people, while natural hazards
commonly affect thousands and are often elevated to the status of disaster
(Haddow, et al., 2010). Since this research focuses on disasters that affect many
people, the scope was delimited to natural disasters.
2.2.2 Natural disaster classification
Hazard classification from CRED also includes further classification of natural
disasters. Although there are many different types of natural disaster researchers
from CRED classified in three major groups based on their trigger (Figure 4) (Below,
Wirtz, & Guha‐Sapir, 2009). They are:
• Biological: disasters caused by the exposure of living organisms to germs
and toxic substances
• Geophysical: events originating from solid earth
• Hydro‐meteorological: which is further divided into three parts:
Hydrological: events caused by deviations in the normal water cycle
and/or overflow of bodies of water caused by wind set‐up
Meteorological: events caused by short‐lived/small to meso‐scale
atmospheric processes (in the spectrum from minutes to days)
Climatological: events caused by long‐lived/meso‐ to macro‐scale
processes (in the spectrum from intra‐seasonal to multi‐decadal
climate variability)
Chapter Two: Literature Review 15
Figure 4: Natural Disaster Classification by Below et al. (2009)
2.2.3 Historical context
However not all natural disasters affect people equally. Historical context allows us
to gain a better understanding about natural disasters and their affect. Although
there have been earthquakes, flood and various other natural disasters for
centuries, the damage caused by all natural disasters are not the same. Figure 5
shows estimated damage costs of natural disasters for over 100 years, and it can be
seen that the most destruction in terms of damage cost were caused by tsunamis,
hurricanes and earthquakes.
16
Figure 5: Estimated damage cost by natural disasters from Em‐DAT (Emergency Events Database, 2014)
Counting the types of disasters by number of reports over the past 100 years
highlights that hydrological disasters such as floods, are also a prominent issue.
Data from national Geophysical Data Centers reports that the top three causes of
disasters since record keeping began are flood, earthquakes and cyclones
(CBCnews, 2010). Earthquakes have also been responsible for triggering other
natural disasters, such as avalanches (e.g., Peru, 1970), and tsnuamis (e.g., Indian
Ocean, 2004).
This thesis focuses on disasters that are based on hydrological and climatological
causes and uses datasets that are drawn specifically from major storms and storm‐
related floods.
Chapter Two: Literature Review 17
2.2.4 Emergency alert guidelines
Whilst it is clear that natural disasters vary in their impact in both damage costs and
frequency, what prompts emergency services to raise the alert level is different
than what would be considered disastrous by people. For a person who is victim in
a serious situation, it is disastrous (Postle, 1980). But for emergency services an
event is disastrous when it affects a significantly large number of people. Therefore,
even though the terms hazard, emergency and disaster all describe negative
consequences of a situation and calls for attention, the criteria that escalates a
hazard or emergency to a disaster differs in each disaster situation.
Emergency services around the world each have their own set of criteria that allow
them to redefine current situations and raise an alert. The Queensland Emergency
Alert Operational Manual (Emergency Management, 2003) presents clear
guidelines on this topic. The Queensland Emergency Alert Operational Manual
suggests six criteria to consider when an emergency alert is issued:
Certainty: whether the impact will be within 12 hours and what factors can
increase or decrease the threat
Severity: how bad the effect will be? Will it be loss of life or significant
damage to infrastructure and environment
Timeframe: is the warning going to be effective before the disaster hits?
Frequency: is this event going to occur too often and therefore make this
alert ineffective in the future?
Similarity: does this alert overlap any other existing warning?
Action: does the community needs to act based on the alert?
In addition, the Queensland Department of Community Safety also outlines which
situation is likely to need more attention (Table 1).
Definitely Probably Possibly
Severe bushfire Chemical, biological, radioactive threats
Localised very severe hail up to 4 cm in diameter
Imminent storm surge Imminent severe cyclone of Localised severe
18
and 0.5 metre high tide Cat 3 and higher thunderstorm with destructive winds and / or intense rainfall
Hazardous material release
Localised severe hail of 4 cm diameter
Tsunami of more than 1 metre height
Major flood
Table 1: When to raise an alert (Emergency Management, 2003)
The point is, these criteria are related to how badly people or infrastructure are
affected (Coombs, 2011). A severe storm in the middle of desert will not raise the
necessity for an alert, while a storm of much lesser strength in a highly populated
area will. Thus, even if the magnitude of a disaster can be measured by scientific
sensors (e.g. seismic sensor for earthquake), the severity of a disaster is often
determined based on how many lives were lost (Smith, 2013), and how much of the
damage that was inflicted directly affected people. Therefore finding how people
have been affected may provide emergency services with more actionable
information. This thesis looks at how to find out information from people in order
to help the people in the affected areas.
2.2.5 Role of emergency services
As mentioned in the previous section, it is the emergency services who classifies if a
situation is considered a hazard or disaster. This section introduces what is an
Emergency Service and what is their job scope in order to understand their roles
and responsibilities in disaster and why actionable information is important to
them.
According to Haddow et al. (2010) emergency services are organisations whose
main job is to deal with risk and risk avoidance. This means their role is not just
limited to assessing a situation, but to be involved in every phase of a disaster.
Although emergency services are most visible immediately after a disaster, as they
are on the ground to conduct and coordinate relief efforts, their involvement goes
Chapter Two: Literature Review 19
far beyond the moments of disaster and post‐disaster (Phillips, Neal, & Webb,
2011; Reynolds, et al., 2002). Emergency services organisations are also involved in
disaster management planning and response, as well as in educating communities
to help them become more resilient. The role of emergency services organisations
can be better understood through the discussion of the disaster management cycle
in the following section.
2.2.6 Disaster management cycle
As emergency service organisations aim to reduce or avoid damage and loss from
natural disasters (or hazards) they need to ensure rapid actions are taken when
there is a hazard or disaster. In order to do so, there needs to have an ongoing
process of activities (e.g. educating communities about disaster) that goes on
throughout the year. Therefore, even though this thesis focuses on the response
phase of disaster management, understanding the various phases of a disaster is
useful to understand the overall role of emergency services. To do so, this thesis
draws on disaster management cycles and disaster life cycles, as they illustrate on
going activities taken by emergency service organisations.
As most countries have disaster management organisations, many versions of this
cycle have been developed to categorise the disaster management activities. Some
cycles describe four phases (Mitigation, Preparedness, Response and Recovery),
while others suggest up to seven phases that include education and prevention
(Kramer, 2009). A National Governors Association (from U.S.A) report in 1979 as
cited in Phillips et al. (2011) established the four phases (Mitigation, Preparedness,
Response and Recovery) as the main group within the cycle, and has been adopted
by most emergency service organisations around the world. Although different
countries use different names of the phases (Phillips, et al., 2011) such as
Australia’s Prepare, Respond, Recover, Prevent; and New Zealand’s Four R:
Readiness, Response, Recovery and Reduction, these management cycles generally
20
share the same features and activities. The following section describes the four
phases (Mitigation, Preparedness, Response and Recovery) and their needs.
Figure 6: Four phases of disaster cycle introduced by National Governors Association in 1979
Mitigation The idea of mitigation is to eliminate or decrease any possibility of a
disaster happening. This generally includes consistent effort by emergency services,
as well as other organisations (mostly government bodies), to disallow activities
that can increase a hazard and become a disaster. For example, a national
earthquake hazard reduction program by the USA federal government conducts
basic and applied research in seismology and infrastructure engineering, provides
requirements for land use planning, creates list of materials use based on location,
and supports the global Seismographic network to pinpoint earthquakes in real
time (Haddow, et al., 2010). Countries around the world have similar programs for
managing floods and tsunamis by building dams and walls, which are aimed at
preventing disasters as much as possible.
This phase happens before a disaster and is often introduced again after an area
has recovered from the disaster. The key contributing factors for this phase are
education and communication, which can range from educating people about
where to build their house, to making them aware about climate change and the
risk they may face. The mitigation phase also usually involves authorities such as
Mitigation
Preparedness
ResponseRecovery
Chapter Two: Literature Review 21
local councils or other governing bodies, as many of the mitigation tasks involve
policy and legislation activities. Understandably this phase is a long term
continuous activity that goes on hand in hand with nation building and
development.
Preparedness Preparedness consists of activities that prepare a community on
how to respond when disaster strikes (Altay & Green III, 2006). Preparedness is
often considered as the building block of emergency management because in the
case of mitigation failure, this phase prepares people to face the disaster. While
mitigation works at a much larger scale such as policy making, preparedness
prepares people in specifically how to face the disaster, by creating evacuation
planning or training ordinary people to be volunteers during a disaster period.
Like mitigation this phase also happens before a disaster. Typical activities in the
preparedness phase involve recruitment and training. While recruitment could be
for emergency services or for volunteer groups, training can involve concerned
citizens as well. Constructing emergency operation centres and shelters also falls
under this area, although it can overlap with the mitigation phase.
A significant part of preparedness training involves training on the emergency
operation plan, which usually consists of several parts. The first is the base plan that
contains the details of the plans needed during emergency situation. The second is
an operational plan that describes what type of help the emergency services can
provide. The third plan, the hazard plan, goes further in creating situational
awareness and detailing an action plan.
Response The response phase is the actions taken after a disaster to save lives as
well as to prevent further damage of environment and property. This phase deals
with providing emergency assistance for people in need. The first step usually is to
activate the emergency operation plan, which consists of activities such as the
mobilising of personnel and relief. The relief works involve providing basic human
needs such as food, water, shelter and medical assistance (Todd & Todd, 2011). The
second is the activation of emergency operation centre and the opening of shelters
22
and other preparations for provision for mass care (Simpson & Hancock, 2009). This
is followed by search and rescue, infrastructure protection, recovery of lifeline
services (Si, Wang, Hu, & Zhou, 2011), fatalities management and other emergency
rescue and medical care (Noreña, Yamín, Akhavan‐Tabatabaei, & Ospina, 2011).
This phase happens during and immediately after a disaster and the duration of this
phase can vary based on the type of disaster that occurred. For rapid disasters such
as earthquake it can last for few weeks to few months. For prolonged disasters such
as flood or drought, this phase can last months to even years.
The biggest challenge at response phase is the rapid and effective mobilisation of
personnel, leadership, resources and information according to the Department of
Community Safety, Queensland Government (2011). This view has been echoed by
other researchers (e.g., Todd & Todd, 2011; Zhou, Huang, & Zhang, 2011), who
have emphasised the importance of rapid action, clear awareness of
responsibilities, logistic application and the collection of relevant information. The
DCS, (2011) argues that the faster and more effectively that disaster responders can
respond the more they can reduce community harm.
This view of the need to respond as quickly as possible to save lives is not always
agreed upon. Telford, Cosgrave, and Houghton (2006) argue that, contrary to this
belief, disaster affected people are often not that helpless and the first step of life
saving actions are often handled by people locally. In addition, these local people
may also be assisted by people from nearby areas. The role of the state remains
important, however it have been argued the significance of emergency services in
the immediate aftermath of a disaster has been overstated (Lorch, 2005). The help
of the emergency services and the state authorities is necessary when the local
community’s capacity to cope is exceeded (McConnan, 1998).
In the Tsunami Evaluation Commission (TEC) report, Telford (2006) instead
suggested that, information immediately after disaster is the most valuable
resource. This is because access to high quality information allows both emergency
services and local responders to provide a better emergency response and to plan
Chapter Two: Literature Review 23
recovery. An inability to gather accurate, or at least actionable information, creates
other problems too. According to Goyet and Morinière (2006), a lack of information
creates ignorance among emergency services and can mislead both international
donation organisations as well as community. Furthermore poor information flow
with emergency services is one of the biggest sources of dissatisfaction, anger and
frustration among affected people (Harrald, 2006). For this reason Telford et al.
(2006) argues that it is valuable for emergency services to compile and analyse
information from various sources to gain accurate information regarding the
situation.
The importance of using multiple information sources was echoed in the 2006
Indian Ocean Tsuanmi Evaluation report by Goyet and Morinière (2006). According
to Goyet and Morinière (2006) the initial assessment of the tsunami was done
significantly based on media reports. Although there were pre‐assessments done by
various other agencies, it was often not sufficient. Furthermore, while in more
industrialised countries there are emergency services, in developing nations
immediate disaster responders are often locals in that area (Telford, et al., 2006),
who often don't have access to such emergency services report. In addition,
disaster responders in developing nations may not have access to channels (e.g.
mass media, emergency call service) to voice out their needs as well.
As it can be seen, in a disaster situation having actionable information is an
extremely critical component of disaster response. In the past, with the extreme
amount of chaos that a natural disaster can create, it was often very difficult to find
accurate actionable information. Fortunately with technological changes are
increasing avenues for locals to express their needs, and these can be extremely
useful for gathering information.
Recovery Even though this phase of the disaster life cycle happens after a
disaster, it can start very quickly as it addresses recovery, rehabilitation and
reconstruction (Todd & Todd, 2011). Most of the actions taken post disaster are
targeted towards re‐establishing the normal activities of the society as early as
possible (Queensland Government, 2012b).
24
The initial activities at the recovery phase usually involve clearing up the damage or
the debris (Fetter & Rakes, 2012), as well as burial of human and animal remains.
This is then followed by longer term recovery activities such as rebuilding key
infrastructure such as roads, bridges, hospitals, schools. Financial assistance to the
general public, as well as local governments, are commonly provided at this phase
to bring the lifeline services back. This recovery period often not only covers basic
needs, but also addresses the mental health of the people affected.
Restarting the cycle At the end of the cycle, mitigation starts. And this new phase
disaster management draws on what they have learnt from having gone through
the above cycle, and may include improving physical infrastructure and community
resilience. Improving the performance of emergency services using the information
gathered through various sources, including social media, is crucial. The importance
of this type of information is addressed in the discussion of the “Post Hyogo
Framework” in the following section.
2.2.7 Hyogo Framework for Action
Although this thesis is focused on identifying relevant information from social
media, any discussion about natural disaster and emergency response is incomplete
without the mention of the Hyogo Framework. The Hyogo Framework for Action
(ISDR, 2005) is a framework adopted by 168 countries around the world to build
more disaster resilient nations and communities (Hall, 2007). The framework was
developed in Hyogo province of Japan where approximately 6434 people lost their
lives and more than $100 billion worth of property was damaged due to Kobe
earthquake in 1995. The post‐earthquake assessment prompted the Japanese
emergency services to propose this framework at the World Conference on Disaster
Reduction in 2005. The aim of the framework was to assist countries to reduce
vulnerabilities and the risk of hazards, in recognition that risk reduction efforts
need to be systematically integrated. The initial timeframe for implementation was
from 2005 to 2015
Chapter Two: Literature Review 25
The framework (Figure 7) identified five main gaps and challenges that needs to be
addressed. They are:
(a) Governance: Ensure that disaster risk reduction (DRR) is a national and a
local priority with a strong institutional basis for implementation
(b) Risk identification, assessment, monitoring and early warning;
(c) Knowledge management and education: Use knowledge, innovation and
education to build a culture of safety and resilience at all levels
(d) Reducing underlying risk factors;
(e) Preparedness for effective response and recovery: Strengthen disaster
preparedness for effective response at all levels (ISDR, 2005, p. 14)
Figure 7: Hyogo Framework for Action (ISDR, 2005)
One common criticism of Hyogo Framework is that it is extremely generic and does
not provide specific guidelines for action (Hannigan, 2013; Rasid & Paul, 2013).
However, such umbrella guidelines can be more useful than specific guidelines
because they can allow for yet unrealised technological changes or system
improvements. For example, in this framework, importance of information has
26
been mentioned in two of the five sections, Risk identification, assessment,
monitoring and early warning and Knowledge management and education, without
providing specific guidelines on how tasks should be accomplished (ISDR, 2005).
Considering that the guidelines were proposed in 2005, and therefore are likely to
have been written in 2004‐2005, it is unsurprising that harnessing information from
digital sources such as blogs, which were utilised in 2005 (Hurricane Katrina)
(Macias, Hilyard, & Freimuth, 2009), or social media (seen in recent disasters).
The framework highlights that reliable information is valuable to emergency
responders. This research looks at how to identify such information from social
media, because, as the next section explains, social media contains a lot of
information after a natural disaster.
2.2.8 Emerging from disaster management literature
As the literature above demonstrates responding to a natural disaster is a complex
affair that involves long term activities as well as rapid actions. Depending on the
phase and type of disaster, the need and pace of activity varies drastically. Although
different phases of disaster have different needs, the most important phase – the
response phase – has a few critical success factors identified by various literatures
and the Hyogo framework. They are:
A) Accurate assessment and awareness of the situation
B) Mobilising resources based on an accurate estimation of need
C) An appropriate leadership and structure
A common component among these factors is accurate and usable information.
Bodenhamer, (2011) identifies the role of quality information gathering as a critical
success factor for making decisions on all levels. Both disaster organisations and the
general public can benefit from usable information at times of disaster. The TEC
report (2006) has further pointed out the need for information to identify who to
involve from the community in relief operations. Various other government articles
Chapter Two: Literature Review 27
such as Queensland Reconstruction (Queensland Government, 2012) emphasises
involving people on the ground for both information dissemination and information
gathering, in order to find useful and reliable information during times of disaster.
In Chapter One it was mentioned that finding actionable information immediately
after disaster could reduce community harm. As emergency services emphasise
that disaster impacts are measured based on their level of community harm, if
information about the disaster can be gathered from the community who are
affected by the disaster, it may help to address the information gap. However,
finding such information after a natural disaster is challenging (UNISDR, 2013) and
in. Therefore it comes as no surprise then that governments around the world have
started to consider the use of social media during disasters to gain critical
intelligence on emergencies and natural disasters (Rothery, 2012), as the use of
social media has increased globally. Based on a synthesis of the literature,
information that can be drawn from social media and is needed by emergency
services can be grouped into following categories.
Need estimation and resource mobilization The first category of information
needed after any disaster is in relation to basic human needs, which includes food
and water. Such information can be found in social media as people often go to
social media to report about need of basic necessities followed by requests for
shelter and medical assistance, as well as reports of public and private property
damage (Palen, Starbird, Vieweg, & Hughes, 2010). By analysing the areas in which
are communicating about missing persons in their social media feed, emergency
services can estimate which specific areas might have been the most affected
(Imran, Elbassuoni, Castillo, Diaz, & Meier, 2013). Information about animals can
also be useful as some people would not want to leave their pets behind, which
means emergency services need to bring the animals along with the people they
are rescuing.
Updated information The second group of information is in identifying up to date
details regarding a disaster area. It is often difficult to get the entire picture
immediately after a disaster. As new and up to date information often appears in
28
social media after disaster, it can be used to update existing information and
current estimates of damage and loss of lives.
Challenges There are however several key challenges in gathering intelligence
from social media and incorporating that information for critical decision making.
Two of the most notable challenges are identification (Platt, Hood, & Citrin, 2011;
Seo, Mohapatra, & Abdelzaher, 2012) and verification (Mendoza, Poblete, &
Castillo, 2010). As of now there are no clear guidelines that identify what type of
information is considered relevant for emergency services and what should be
excluded. Therefore, even though identifying relevant information from social
media has been highlighted repeatedly in disaster management literature, in
practice it is still uncommon to fully integrate social media in emergency response
efforts (Pipek, Liu, & Kerne, 2014).
Therefore this thesis focuses on one component, identifying relevant information
from social media after a natural disaster. Although verification is another key
research area in intelligence gathering, in order to limit the research to a
manageable scope this thesis focuses only on identification. The next section
describes, synthesises, and evaluates existing social media research to determine
what is known about how to identify information from social media that is relevant
for emergency services to use for disaster response.
2.3 Twitter in Everyday Life and Crisis Events
Previous sections of this literature review discussed the needs of emergency
services that can potentially be drawn from social media. This section introduces
the literature from the second discipline of crisis informatics – media and
communication – focusing on social media studies in crisis communication. After
introducing currently popular social media sites, it will present the rationale for the
Chapter Two: Literature Review 29
focus of this research on Twitter. The review will then explore the opportunities
and challenges for emergency services to use Twitter to gather information.
The reason for the growing interest in social media to find disaster relevant
information is, in recent years social media websites (social networking sites) have
heavily influenced the way people communicate socially or interpersonally (Baym,
Zhang, & Lin, 2004). People have become more prone to discussing their life events
publicly (Stutzman, Boyd, Marwick, Lampe, & Ellison, 2008). With short messages or
status updates, they do not need to invest too much time to engage in discussion
and debates that matters to them (Stephens & Malone, 2009). This has made
sharing information, reporting about surroundings or just engaging in daily chatter
over social networks an easy task (Java, Song, Finin, & Tseng, 2007). Although for
each individual it is their own voice, the aggregation from millions of people have
made these social networking sites a source of information for news and an avenue
for research (Bruns & Burgess, 2011a; Jordaan, 2013; Kwak, Lee, Park, & Moon,
2010). In addition, as increasingly more people join and share information and day
to day life happenings in social media, it is increasingly becoming a valuable tool for
gaining insights about human behaviour.
While the underlying functionality of social media sites are similar, the way the sites
function and the type of users they attracts can be drastically different (Lipsman,
2009). Some social networking sites focus on users and their life (Facebook), some
focus on the message (Twitter), some focus on collecting and discovering ideas
(pinterest), some focus on knowledge creation (Quora), while some other focus on
pictures (instagram), or finding jobs (linkedIn). This differentiation in functionality
attracts different types of audiences as well as different types of activity, which can
range from using the networks for personal reasons (Deller, 2011), or for work
related purpose (Ehrlich & Shami, 2010), or to support revolution in order to topple
a government (Lotan et al., 2011). Since the activities are often drastically different,
different networks presents different opportunities and challenges for research.
The next section provides a list of key social networks with brief descriptions of
30
features, functions, demographics and the rationale for selecting one of the social
media sites in this research.
2.3.1 Overview of social media sites
As mentioned in the previous section, the reasons people use certain social
networks over others depends on a combination of the features, functions,
demographics and various other components. It could be because their friends are
there (Westlake, 2008), or it helps them to stay in touch with what is going on
around them (Zuckerberg et al., 2010), or they have created their own audience
(Tufekci, 2008). The bigger the user base a social network has, the higher the
chance that people will use it more often as the likely audience is there (Deller,
2011). At present the most popular social network is Facebook, which has 1.28
billion monthly active users (Facebook, 2014). Based on the numbers reported in
their website, the second most active users belong to Google+. However, even
though Google+ reports they have 540 million users, it does not say if they are
solely a Google+ user, or if they are gmail users who also have account in Google+
and log into their integrated account. Similarly, Twitter reports over 288 million
monthly active users, even though around 8% of twitter accounts are reported as
automated accounts or bots (Zi, Gianvecchio, Haining, & Jajodia, 2012).
One thing can be observed from the numbers of monthly active users – each of the
above mentioned social network has a large number of users. Even discarding the
total monthly active users as problematic (Wagner, 2015) and looking only at the
usage do not help to narrow down the scope of this research. From a usage point,
in Twitter, the total number of daily tweets has gone from thousands to half a
billion within five years (Twitter Inc, 2015), and the numbers of tweets are
increasing daily. Users upload an average of 60 million photos on Instagram daily
(Instagram, 2014). More than 890 million people log in to Facebook daily and spend
on average 21 minutes performing various activities (Facebook, 2014). Reddit
claims to have 202 million active users each month viewing more than 7 billion
Chapter Two: Literature Review 31
pages and often conversation happens as readily as other social networks (Reddit,
2015). There are more than a billion monthly active users in YouTube and it is
common to find videos from disasters first responders in YouTube (YouTube, 2015).
Therefore analysing multiple social networks for crisis communication would
require a massive effort, whilst focusing on a single social network makes this
research more managabale by focusing on information collation of emergency
services from a single social network. The following list therefore provides a brief
outline of the best known social network websites, why people use them for, their
limitations and how easy it is to discover their contents, along with active monthly
users as of early 2015 (Table 2).
32
Name Monthly active users*
Common usage and challenges for research
Accessibility, search and discovery
Facebook 1.4 billion Users share their life events with mostly close groups of friends. Need to be a friend to access contents.
Password protected, search for users, places.
Twitter 288 million
Apart from sharing daily life, users tend to share breaking news impulsively.
Public, can search with hashtag or keywords to find tweets
Sina Weibo
167 million
Limited to Chinese speaking audience and used for sharing both life events and breaking news.
Public, can search for user and their posts
LinkedIn 200 million
For professional networking and finding job opportunities, people only update when they are looking for job.
Semi public. If logged in, able to see more information
Google+ 540 million
Most commonly used for sharing with niche Group members. The largest sectors are technical sectors.
Public, posts and community
Quora 11 million
Knowledge creation via personal stories. Still in its early stages of usage and there is no way to verify if the content is authentic.
Semi public. Need to login to read more than one story
Pinterest 40 million Sharing of creative ideas. The largest share of contents are do‐it‐yourself items.
Public, discovery through pins and boards
Instagram 300 million
Photo sharing. Often used by celebrities.
Public, can access with hashtag
Reddit 202 million
Stories and discussions around various topics. Highest voted stories appear in the front page. Often controversial
Public, discovery through subreddits.
Youtube 1 billion Users shares wide range of videos. After disasters it is common to have crisis related videos to appear here.
Public, discovery through search or suggested videos
Table 2: List of notable social networking sites as of early 2015
Based on the Table 2, it can be seen that not all social media sites are useful for this
research. For example, Pinterest or Quora are an unlikely source for identifying
disaster information quickly because, although they have large numbers of active
users, the focus is on quality content creation rather than breaking news about an
event. Similarly, although Sina Weibo has been used in disaster situations (Yang, Yu,
Liu, & Yang, 2012), due to the language limitation, it is only useful for Chinese
Chapter Two: Literature Review 33
emergency services. Google+ may appear to have a large number of active users
but they are hardly mentioned in the literatures related to crisis situations mostly
because Google does not disclose if these users are Google+ users or they are Gmail
users who also have an automatic Google+ profile. Instead, for the purpose of
finding disaster information, researchers find Facebook, Twitter (Huang, Chan, &
Hyder, 2010) and Instagram (Aulov, Price, Smith, & Halem, 2013) to be the three
most relevant social media sites.
However, as a primarily photo sharing platform Instagram is still not as prominent
as Twitter and Facebook in crisis informatics literature. By drawing on the concept
of ever increasing importance of Twitter and Facebook (Mitchell, Rosenstiel, &
Christian, 2012) suggested in the article “What Facebook and Twitter mean for
news” that, social media sites in general have now become a pathway to news and
are often seen as a place where reporters get ideas for their news rather than the
other way round. The difference between Facebook and Twitter is that Facebook’s
walled garden approach makes it less useful as a breaking news platform (Murthy,
2011; Stassen, 2010). The platform specific limitations are revisited in detail later in
this chapter.
In conclusion, the majority of the studies across the crisis communication literature
noted in this review have highlighted the critical role of Twitter in breaking news
(Bruns & Burgess, 2011; Kwak, Lee, Park, & Moon, 2010). Given the focus of this
research on identifying information from disasters that is relevant to emergency
services, it is expected that information from Twitter often contains breaking news,
making Twitter a highly relevant platform as a news medium. The following section
defines Twitter as a medium before addressing its suitability as a news medium in a
crisis situation.
34
2.3.2 Twitter as a medium
Twitter has established itself as a ‘new’ medium (Kwak, et al., 2010) that some
researchers argue complements older media (Harrington, Highfield, & Bruns, 2012)
and others argue outperforms traditional news agencies (Petrovic et al., 2013). In
order to understand the difference in standpoints on Twitter as a medium among
media studies researchers, it is first necessary to address what differentiates
Twitter from other forms of media.
A key aspect of Twitter is the brevity of the message (Zhao & Rosson, 2009).
Compared to any other medium, including other social media sites, a tweet is
extremely brief. However, instead of being a hindrance, the limitation of only
writing 140 characters have been cited as one of the reason for Twitter’s explosive
growth because it allows time starved modern users to express their thoughts and
feelings extremely quickly (Java, Song, Finin, & Tseng, 2007). Since composing a
tweet generally requires less time and thought investment than writing a blog or a
news article, it is no surprise that people often flock to Twitter to share all kinds of
opinions and information, ranging from comments about their favourite TV shows,
to a plane crash or natural disaster (Farhi, 2009).
This abundance of expression in the form of tweets, along with the flexibility of
following another prominent user, topic (with hashtag), or redistributing another
user’s tweet to an individual’s own followers with ease (via retweet), has fuelled an
explosion of participation from average users in reporting newsworthy events
(Gupta et al., 2013; Hermida, Siapera, & Veglis, 2012) – often before they get
broadcasted by traditional media. Kwak, et al (2010) stated that their “preliminary
results confirms the role of Twitter as a media for breaking news”. This trend can
be observed from other notable example such ash live tweets about Osama Bin
Laden capture (Hu, Liu, Wei, Wu, Stasko & Ma, 2012), death of singer Whitney
Houston (Lau, Collier & Baldwin, 2012), Boston Marathon bombing (Cassa, Chunara,
Mandl, & Brownstein, 2013). In addition, Dewan and Kumaraguru (2014) have used
Facebook, Google Plus and Twitter to analyse 29 major events and found that
Twitter is the fastest among all in breaking news, a view that is supported by other
Chapter Two: Literature Review 35
researchers as well (Osborne, Petrovic, McCreadie, Macdonald, & Ounis, 2012;
Dewan & Kumaraguru, 2014)
This has resulted in Twitter being used to predict stock market results (Bollen, Mao,
& Zeng, 2011), for aggregating consumer opinions about brands (Jansen, Zhang,
Sobel, & Chowdury, 2009), predicting election results (Tumasjan, Sprenger,
Sandner, & Welpe, 2010) or communicating after a natural disaster (Acar & Muraki,
2011). These are some of the reasons why some researchers argue that Twitter
outperforms traditional media in speed of information sharing, since it often
contains breaking news (Neuberger, Vom Hofe, & Nuernbergk, 2013).
There are of course other cases where Twitter complements traditional media. Due
to its dialogic transmission system, it has been used with popular TV shows to
create real time engagement (Doughty, Rowland, & Lawson, 2012). Although in
most cases such programs use Twitter as an additional engagement layer,
entertainment programs such as “Tweet Love” in Japan has used Twitter to find
potential match making couples from audience’s tweets (Sakamoto & Nakajima,
2014). And Twitter’s ability to complement traditional media is not just limited to
entertainment shows. According to Zhao et al. (2011), important world news topics
are likely to spread faster through Twitter than other types of news. Twitter’s CEO
also suggests that Twitter is meant to complement news media and not to replace
them (Isaac, 2013).
Taken together, these studies suggest that Twitter is a prominent news medium of
modern times. Whether it outperforms or complements traditional media is a
debatable topic. What is evident from these studies is that Twitter has enabled
people not to rely on specific media institutions to get their news and rather to
broadcast their own opinions to their followers. In addition, news outlets are
providing more opportunities than ever before for the public to contribute to
professionally edited publications through active participations via mediums such
Twitter (Hermida, et al., 2012). These opportunities, along with the large volume of
36
messages, has made Twitter a strong medium in its own right. The next section
addresses the question of whether Twitter is a relevant news medium for
emergency services.
2.3.3 Twitter as news medium
In broad terms, some of the key criteria for a medium to be considered a prominent
news medium are the ability to deliver news that is timely, significant, credible, and
which occurred nearby (Harcup & O'neill, 2001). News is time sensitive, and with its
potential for realtime delivery (Bandari, Asur, & Huberman, 2012) Twitter has
emerged as a powerful news source (Sankaranarayanan, Samet, Teitler, Lieberman,
& Sperling, 2009). Although information credibility in Twitter remains a concern
(Mendoza, et al., 2010), at times Twitter has proven to be able to break news faster
than others and has been described as an ambient journalism platform (Burns,
2010; Hermida, 2013).
Nevertheless, it is important to determine what type news usually gets broken on
Twitter compared to other traditional news media. Since this dissertation looks into
identifying relevant information after a natural disaster, it is important to find out if
news stories that would be useful for emergency services can be found in Twitter.
Some recent events show that such information can indeed be found in Twitter. For
example, when U.S. Airways flight 1549 landed on Hudson River, the news was
broken via Twitter by Janis Krum who took a photo and tweeted about it (Lenhart &
Fox, 2009).
This trend of live tweeting from location can also be seen after a natural disaster
(Reynolds & Seeger, 2012). After the 2011 Japan tsunami, there were about 5,500
tweet per second related to the tsunami ‐ many of those originating from Japan.
Similar trends were seen during the Mexico earthquake in 2012 (Crooks, Croitoru,
Stefanidis, & Radzikowski, 2013), Queensland flood in 2010‐2011 (Bruns, Burgess,
Crawford, & Shaw, 2012). Based on the recent events, it can be suggested that,
Chapter Two: Literature Review 37
even though twitter only has 140 characters and people may tweet about the
events individually without knowing about other tweets, it became news in Twitter
because details of what happened were disseminated instantly and were repeated
throughout the network.
In view of all that has been mentioned so far, one may argue that Twitter fulfills
many of the criteria of news medium: significant information is spread faster than
other types of information, nearby events get reported earlier than traditional
media and most importantly, information can be found extremely quickly (Machin,
2011). The next section summarises why Twitter was selected for this research on
disaster management services’ access to critical information.
2.3.4 Twitter in crisis communication
The studies presented so far suggest that Twitter is an excellent venue for
disseminating various types of information extremely quickly. Regardless some
critics argue that Twitter is only used for a social presence (Dunlap & Lowenthal,
2009) or posting “Fried eggs and beans on toast for breakfast today” (Launer,
2013). However as described earlier, Twitter played a big role in sharing crisis
information around the world from Queensland flood (Bruns, et al., 2012), tsunami
in Japan (Acar & Muraki, 2011) to hurricane Sandy (Guskin & Hitlin, 2012), and its
use in such situations continues to increase (Bruns, 2014).
One can argue that because so many people are sharing information, it may be
difficult for emergency services to act on it. However, examples from disaster
situations suggests otherwise. For example, after the earthquake in Japan in early
2011, a Japanese Twitter user reached out to the American Ambassador in Japan,
John Roos, who was heading the American rescue operations after the earthquake
with two following tweets: “Kameda hospital in Chiba needs to transfer 80 patients
from Kyoritsu hospital in Iwaki city, just outside of 30km range" "Some of them are
seriously ill and they need air transport. If US military can help, pls contact (name
38
withheld) at Kameda" (Harris, 2013). According to USA today, “The ambassador
alerted the U.S. Embassy's defense attache, who passed it down through the U.S.
military chain of command, says Fuller, Roos' aide. An hour or so later, Fuller says,
"we got a note back," saying the patients would be evacuated by Japan's Ground
Self‐Defense Forces. Two tweets had mobilized troops” (Sternberg, 2011).
Such stories are rather norm instead of exception. Similar situations have been
observed during other disaster situations, such as hurricane Irene in the U.S.A.
(Abbasi, Kumar, Filho, & Liu, 2012). Government and crisis response organisations
have been embracing social media increasingly. This is partly due to the ability to
communicate directly to the people in need (McNutt, 2014), and partly due to the
increased expectation from people that they will get assistance if they post in social
networking sites (American Red Cross, 2011).
This emphasis on social media was especially evident in the Queensland flood
(Bruns, et al., 2012), where Queensland Police Service (QPS) rose to prominence on
Twitter in just 3 days (Bunce, Partridge, & Davis, 2012; Dufty, 2011). Recognising a
new avenue where they could post updates and reach people extremely quickly,
QPS media used social networking sites heavily, and these became a major source
of information in the times of crisis.
This embrace of social media by authorities had not been limited to natural disaster
situations, but also other crisis events such as the Boston Marathon bombing
(Cassa, Chunara, Mandl, & Brownstein, 2013). The tweet request from Boston
police for the video “Boston Police looking for video of the finish line
#tweetfromthebeat via @CherylFiandaca” was retweeted more than 3000 times
(Rogers, 2013). Similarly “#WANTED: Updated photo of 19 year‐old Dzhokhar
Tsarnaev released. Suspect considered armed & dangerous” posted at 11:32 PM ‐
19 Apr 2013, just 4 days after bombing was retweeted 13,574 times and helped to
locate the suspect. The success of using Twitter to catch the suspect within a week
was documented in the Huffington Post article, “Boston Police Twitter: How Cop
Team Tweets Led City From Terror To Joy” which portrayed how Twitter can be
useful for emergency services in a crisis (Bindley, 2013).
Chapter Two: Literature Review 39
Although for the purpose of this thesis the role of Twitter in crisis communication
and information diffusion is limited to natural disasters, such examples show that
Twitter has been increasingly used by both the general public and emergency
services in crisis communication. In addition, in countries where news media is
known to be censored, people look to micro blogging platforms for unbiased news.
For example, in the Yanjin (China) earthquake in 2006, it was reported that Twitter
was the place that broke the news (Qu, Huang, Zhang, & Zhang, 2011). In addition,
as people generally trust their friends and families more than authorities, people
are more willing to believe crisis related news when it comes from known people
(even in the form of retweet), than the media or government (Qu et al., 2011).
2.3.5 Selecting Twitter for this research
Earlier sections have provided an overview of prominent social media networks,
including Facebook and Twitter, which have both become a ‘go to place’ for news
reporters. However, as this section shows, Twitter is a more prominent
contemporary news medium among social networks and it is most suitable for
breaking news. It is therefore the platform that is most likely to contain relevant
information even though Facebook may contain similar information as well. This
section presents a rationale for the selection of Twitter as the platform for this
research.
The first issue emergency services face with regard to Facebook is the restricted
membership and access to information based on having to be added to a network
as a ‘friend’ (Dabner, 2012). Although most Facebook pages are publicly available
(Dabner, 2012) and often host useful and relevant information after a disaster (Bird,
Ling, & Haynes, 2012), to post a message in the Facebook page the user has to
navigate to the page and post in that page. At present a Facebook user is unable to
post freely to another user’s or groups’ Facebook page from his or her own status
update. Therefore to seek for help from emergency services, the user has to go to
the emergency services page and post there.
40
Such limitations on posting messages during a disaster are problematic for
emergency services for a number of reasons. First, unless the page is already well
established and publicised, the user may not know where to get help. Since
popularity in social networks can change quickly, and authoritative pages may not
always be popular. From an intelligence gathering perspective it is even more
troublesome since emergency services are unable to automatically extract disaster
relevant information from a user’s personal status unless the user is a friend of the
emergency services account. Although emergency services can look for other pages
related to an event, it would be difficult for emergency services to monitor all the
pages in the Facebook network.
An alternative, and arguably better approach would be to search through Twitter
status via API since in Twitter such messages can be extracted from an user’s own
status. A tweet is openly available and accessible without having to ‘follow’ a
person or a public page (unless it is protected, which would go beyond the scope of
this thesis). It is also possible for emergency services to find important information
through the use of the ‘hashtag’ (DeMers, 2013) or keywords without the user
having to contact them directly.
Furthermore, despite having a smaller number of users, Twitter users serve as
multipliers for spreading information (Neuberger, Vom Hofe, & Nuernbergk, 2013).
The ability to spread information so rapidly is one of the reasons why the research
to date on social media and natural disasters has tended to focus on Twitter,
despite that Facebook has more active users, and both social media types have
impacted disaster responses. As this thesis focuses on gathering information in a
crisis situation, and Twitter users have been shown to provide crisis related
information without restricting their updates behind a walled garden, Twitter is the
social network of choice for this thesis.
Before going further it needs to be mentioned that, it is necessary to keep in mind
that density of Twitter user is an important factor in gathering social media
information from Twitter. It is not uncommon to have a small scale crisis situation
appear huge in social media if that crisis affects a location with large number of
Chapter Two: Literature Review 41
social media users compared to a location that does not have ample social media
users. Therefore the question of representativeness of data needs to be taken into
consideration in any Twitter research.
2.3.6 How Twitter is used in a crisis situation
In order to discuss the activity patterns in Twitter in crisis situation, it is useful to
understand how users communicate in Twitter. This is relevant because a well
defined communication pattern in other media or platforms, may not apply in
Twitter. For example, in Atkinson and Wald (2007) conducted a mass survey on
earthquake and collected 750,000 responses to suggest that “did you feel it” is a
surprisingly good measure of ground movement. This finding prompted other
researchers to use this as an indicator of earthquake, and suggested that it would
be a useful measurement tool to identify if an earthquake had occurred from
Twitter. However, Earle, Bowden and Guy (2012) found during a five month
experiment, that there were no mentions of “did you feel it” in Twitter during an
earthquake. Rather, there were mentions of earthquake, shake and other words
that were synonymous to earthquake and by tracking those words instead of the
whole sentence, Burks, Miller and Zadeh (2014) identified the trajectory of 2011
Tohoku earthquake. This section discusses some of the known communication
patterns and the evolution of communication patterns over the years.
Requesting information One of the first things people do after a natural disaster
is to look for their family members and friends via calling, texting or any other
means possible (Ling et al., 2014). This behaviour is commonly seen in Twitter as
well, where people who have friends and family tend to seek information from
Twitter (Shklovski, Palen, & Sutton, 2008). The reason people tend to ask for such
information from Twitter is, for a specific location to be newsworthy, it either needs
to be in an area of importance or an area that is badly damaged. If it is not, it is
difficult to find information for that area in the news, especially in the early hours
of a disaster (Gupta, Joshi, & Kumaraguru, 2012). Thus in the midst of uncertainty
42
when the total picture of the disaster area is not known, people who’s friends and
families live in that area may go to Twitter for information about these places from
people living in that area who may inform that they are safe or that a certain area is
affected.
However, in recent years there has been an increased expectation from users that
the authorities are following tweets even though users may not be sure how the
authorities might know about the tweet (Stephens & Malone, 2009). In a 2010
survey the American Red Cross found that among the 1048 respondents, 75%
wanted or expected to received assistance after they posted a message in social
media. This adds additional pressure for emergency services, who now not only are
expected to know information from the ground, but also from online (Crowe,
2012).
Updating about surroundings In the previous section the benefit of getting real
time information from Twitter that is extremely difficult to get from the other
media was discussed (Kavanaugh, et al., 2012; Stieglitz & Dang‐Xuan). One area in
which this works very well in a crisis situation is updating of temporal information.
In the early hours of a disaster location specific information changes frequently
(Dodds, Harris, Kloumann, Bliss, & Danforth, 2011). A road might be flooded in the
first hour but the water may go down in the second hour or vice versa. It is not
possible for media to broadcast such specific information based on locale. In these
situations getting updates from people about their area can provide emergency
services with helpful and up to date information.
Voluntweeting Another Twitter centric activity is known as ‘voluntweeting’.
Starbird and Palen (2011) found that after natural disaster a group of people tend
to self mobilise into a group of voluntweeters who come forward to assist in relief
efforts. In addition to actively tweeting about the situation, users who are present
locally also tend to assist physically and those who are not near assist through
online channels. This behaviour is similar to how people act after natural disasters;
as mentioned by Telford et al. (2006) it is the local residents who are likely to be the
first responders instead of emergency services.
Chapter Two: Literature Review 43
With Twitter it goes beyond the geographical boundaries. Even if people are not
near the affected area, they can still help emergency services by filtering
information that is relevant for them. One of primary example of this was seen
during 2010 Haiti earthquake, when many people from various parts of the world
used social media, text messages and Ushahidi maps to assist in relief efforts as
well as guiding emergency services to find people under the rubble (Muralidharan,
Rasmussen, Patterson, & Shin, 2011; Norheim‐Hagtun & Meier, 2010).
In addition to gathering information and channeling them to emergency services,
these self deployed volunteers also tend to assist in re‐broadcasting information
that they think are accurate, verify wrong information as well as offer various other
kinds of help (Oh, Kwon, & Rao, 2010). Such activities often continue even after the
disaster. For example, in the 2011 Queensland flood, the ‘Baked Relief’ campaign
was organised by volunteers through Twitter (and Facebook) to cook and deliver
home cooked meals to the volunteers who were cleaning up flood affected areas
(Bruns, et al., 2012).
Identifying these self organised volunteers after a disasters can be extremely
beneficial for emergency services as they can utilise these additional supports to
filter actionable information to help disaster affected people.
Overall, these studies highlight that it is common for people to both update about
their surroundings after a natural disaster and use Twitter to look for information
about their friends and families. And while doing so, they may use keywords, a full
sentence or use Twitter specific ways (e.g. hashtag with keyword) to express their
situation. Understanding how Twitter users communicate is useful for information
gathering since understanding of the communication pattern can assist emergency
services to target other components of a tweet rather than relying on keywords
alone.
Automated tools So far this chapter has focused on people’s tweeting behaviour.
In recent years there has been an increasing number of automated tools, often
44
known as ‘bots’ that tweet during natural disasters (Chu, Gianvecchio, Wang, &
Jajodia, 2010), and that can assist emergency services.
Although bots are often perceived negatively due to their usage for spam posts
(Lee, Eoff, & Caverlee, 2011), tweetbots linked to sensors from earthquake centres,
flood centres, and various other monitoring organisations, can provide relevant
information for emergency services. In recent years such sensor bots have been
gaining in popularity (Messias, Schmidt, Oliveira, & Benevenuto, 2013), due to their
automated updates providing followers with up to date information about a
situation.
In conclusion, this section suggests that even though various types of information
gets spread in Twitter and some of communicative activities are specific to the
medium, a large percentage of the communication pattern is related to the
behaviour of the users. Understanding Twitter users through the lens of crowd
behaviour theories therefore can provide a useful angle for emergency services.
2.3.7 Twitter uses and collective behaviour theories
This discussion about Twitter users and theories of collective behaviour aims to
serve two purposes. The first is to gain deeper understanding about tweeting in a
crisis through the lens of collective behaviour theories. The second is to introduce
the challenges that are likely to occur in using information from Twitter due to the
speed of information spread in Twitter before delving deeper in these challenges in
the next section.
In their seminal paper on detecting earthquakes in real time via Twitter, Sakaki,
Okazaki, and Matsuo (2010) demonstrated how people act as a “social sensor”
during an earthquake. By monitoring tweets they could detect earthquake
situations with 96% accuracy and were faster than the Japan Meteorological
Agency. Liu (2010) argues that this happens because when a natural disaster
occurs, people are likely to retweet or compose an original tweet based on the
Chapter Two: Literature Review 45
information that is gathered through the collection of tweets they are exposed to,
even if they are not at the scene.
From that aspect, collective behaviour phenomena (Ishii, Koguchi, & Uchiyama,
2013; Lehmann, Gonçalves, Ramasco, & Cattuto, 2012; Liu, Liu, & Li, 2012) is
commonly seen in Twitter (Reips & Garaizar, 2011). From various crowd theories,
this section analyses three different crowd theories that are related to this study.
Having discussed Twitter centric activity in a crisis situation, this section discusses
why users perform the activities addressed in previous section. In order to gain a
deeper understanding, these activities are discussed through the lens of collective
behaviour theories since the behaviour of users in social media can be influenced
by who they follow (Romero, Meeder, & Kleinberg, 2011).
Contagion theory To explain contagion theory, the example of a standing ovation
in a concert is often used (Miller & Page, 2004). The example illustrates that concert
goers are likely to participate in standing ovation even if they don’t intend to, if
people around them are standing up. Romero et al. (2011) found that such
behaviour can be seen in Twitter as well. In many situations, if a user is exposed to
hashtags related to same event from multiple users, there is a high possibility that
the user will retweet some of the tweets or compose a new tweet that relates to
the same event (Romero, et al., 2011). And if the event happens to be a crisis event,
the chance of participation is even higher (Glasgow & Fink, 2013).
The findings related to the contagion in Twitter, and the theory itself, are useful to
understand one of the most prominent components of Twitter ‐ retweets. In
general retweets provide an endorsement of the tweet, often indicating support or
agreement to the cause. In terms of a crisis situation, Starbird and Palen (2010)
suggested that focusing on retweets is a useful way to collect information because
people in the disaster affected area are likely to use the retweet function to pass on
information.
However, other researchers have suggested that retweets are one of the main
noise (unimportant tweets) generators in Twitter, and in disaster context do not
46
provide any value for intelligence gathering (Macskassy & Michelson, 2011; Sikdar,
Kang, O'Donovan, Hollerer, & Adal, 2013). As described earlier, studies on
contagion theory and Twitter suggests that people are likely to retweet because
they are exposed to disaster news, rather than because they are in the disaster
area, thus making retweets irrelevant for emergency services.
To make the matter worse (or noisier), in many cases people retweet during a
disaster with the hope that the information will be useful, without knowing if it
really is (Harrigan, Achananuparp, & Lim, 2012). In some instances people retweet
just because the tweet asks to be retweeted (Malhotra, Kubowicz, & See, 2012).
Combining this with contagion theory it can be suggested that contrary to some of
the research, retweets are more likely to contain information that is not useful for
emergency services. Thus in this research, retweets will be considered the first
content to be filtered from Twitter in order to find disaster relevant information.
Convergence theory By definition convergence theory suggests that people form
groups with like‐minded people, and as a group can intensify a situation by
gathering a critical mass (Smelser, 2011). Therefore convergence theory has been
used to explain people’s behaviour, especially negative behaviour that can occur
after a natural disaster (Fritz & Mathewson, 1957).
Convergence theory has also been used to explain online behaviour such as hashtag
adoption in Twitter after a natural disaster (Potts, Seitzinger, Jones, & Harrison,
2011). After a disaster Twitter users quickly create many hashtags related to the
disaster in question. This can include multi‐word hashtags that combines a location
with the disaster (Efron, 2010; Tsur & Rappoport, 2012). For example, #QLDfloods
for the Queensland flood and #yolandaPH for typhoon Yolanda (or Haiyan) in the
Philippines. However Twitter users often settle on a single hashtag (e.g., #eqnz),
dropping other alternatives (e.g., #nzeq, #chch, etc.) to form a single channel of
information very quickly. However they may also diverge from this again for more
specific side conversations (e.g., #bakedrelief), so that these do not clog up the
main hashtag.
Chapter Two: Literature Review 47
Understanding such forms of convergence through hashtags is an important part of
identifying relevant information for emergency services. This is because if the
hashtag does not collect large number of tweets, it is possible that it has been
replaced by another more dominant hashtag.
Complex adaptive systems theory Traces of complex adaptive systems can be
found in many aspects of Twitter. However before discussing its Twitter
manifestations, it is necessary to explain the fundamentals of the theory itself. The
central idea of a complex adaptive system is that many small structures (systems or
agents) iterate and interact in small groups to adapt to a dynamic and changing
environment, and as a by product of this, form a pattern that they may not have
intended (Van Ginneken, 2003). Here complexity refers to the dynamic nature and
networks of that interaction and adaptive refers to self organisation and mutation.
For example, in a weather system each water and air molecule interact and connect
with each other in ways that are not pre planned. However at the end of this
interaction, a resultant pattern, a cloud, is formed.
This tendency also emerges in Twitter. After a natural disaster people often self‐
organise themselves and act in their small groups to become the first responders
(Vieweg, Palen, Liu, Hughes, & Sutton, 2008). This group of voluntweeters display
the core components of complex systems: unplanned emergence, simple rules, self
organising and often random.
However, with regards to Twitter usage after a natural disaster, the most relevant
component of the complex adaptive system is the co‐evolution. The central idea is,
anything that is in the system adapts to the changes in the environment the system
is in. The similarity between Twitter and the concept of co‐evolution can be linked
to the frequent changes in the way Twitter works. This can be understood by
looking at introduction of features in Twitter both from top down Twitter driven,
and bottom up user driven approaches.
Twitter provided communicative features It is very common for a social network,
not just Twitter, to change the way it works; adapting the design, interaction
48
mechanisms, or the algorithm, to keep them trendy. For example, as image sharing
social networks such as Instagram became widely popular, Twitter started to
embed images in the tweet instead of linking to them from other third party
sources. Similarly, as autosuggestions became common in other computing
environments such as search engines, Twitter introduced this functionality. The
reasons such evolution based changes are important for natural disaster situations
is that any algorithm that relies on specific features needs to be able to adapt,
because what is important today to identify disaster relevant information may not
remain important in the next version or API update.
Furthermore, the introduction of new features may change behaviour altogether.
For example, as Twitter introduced autosuggestion of hashtags, it is possible that
when a natural disaster strikes, people use a hashtag that has been suggested by
Twitter itself. Therefore, identifying new features are necessary to find what is
important in the Twitter stream.
User generated communicative features One of the most significant user driven
adaptations in Twitter was the hashtag. Chris Messina, who originated the idea of
the hashtag in Twitter, wanted to create a group management system by using a
single word that is already part of the tweet (Figure 8). Thus Messina borrowed the
grouping convention used in IRC channels to help users create and discover new
groups of conversation on the go (Messina, 2011).
Figure 8: Chris Messina outlines a proposal for Twitter Tag Channels
Initially Twitter was reluctant to use hashtag as it was too nerdy and preferred to
use machine learning to group tweets (Messina, 2011), but once twitter embraced
the hashtag to group the tweets, it had been used tremendously.
Chapter Two: Literature Review 49
However, reliance on hashtag alone to identify disaster relevant information is risky
because there is no guarantee that a dominant and well established hashtag will
persist over time, even for a similar event (Lin, Margolin, Keegan, Baronchelli, &
Lazer, 2013). Therefore, if disaster responders follow only well established
hashtags, they may get limited information. Therefore having a static pre defined
hashtag may or may not work at the times of crisis because the usage pattern is
likely to evolve, and if the process does not cater to that, the tracking system is
unlikely to find important information.
In conclusion, understanding Twitter through the lens of collective behaviour
theories starts to highlight potential problems emergency managers are likely to
face when gathering intelligence from Twitter. Due to the dynamic nature of the
social media and user behaviours the opportunities are often mixed with
challenges. Next section addresses some of the challenges faced when collecting
data from Twitter.
2.3.8 Challenges with Twitter data
Having discussed the advantages and benefits of using Twitter in crisis
communication, this section addresses some of the challenges of identifying
relevant information for emergency services from Twitter during a natural disaster.
In the previous sections, it has been mentioned that people flock to social media
during a disaster to find or to share information. However, during the early stages
of a disaster, both locals and people outside the affected area are likely to tweet
about the disaster (Bruns & Burgess, 2012). This can make it a difficult task to
identify which tweets are likely to be relevant for emergency services.
An example of how the tweeting of locals and onlookers at the same time can be a
problem was seen from the tweet counts after the 2012 hurricane Sandy in the
U.S.A. In the first five days after the hurricane, there were more than 20 million
tweets related to the hurricane (Guskin & Hitlin, 2012). Such large volumes make it
humanly impossible to read the tweets to identify which of these are relevant for
emergency services. In addition, during the course of disaster situations change
50
quickly, making tweets with updated information more useful than older tweets.
Furthermore, natural disasters related tweets not only appear in volume, but also
with extreme speed. After the tsunami in Japan in 2011, on average 5,500 tweets
were recorded every second (Reynolds & Seeger, 2012). Unless an emergency team
has a really large team searching through the dataset, it is extremely difficult to find
information that is relevant. And volume and velocity are only two of the
challenges; others include identifying the context as well as the veracity and
temporality of information (Burgess & Bruns, 2012; Mendoza, et al., 2010; Platt, et
al., 2011; Thomson, et al., 2012). The following sections discuss the challenges of
identifying disaster relevant information from Twitter in detail.
Volume and velocity Whilst the volume and velocity of disaster related tweets can
be extreme, this high usage does not remain constant over a long period of time.
During such unexpected events there is generally a large amount of information
shared in the immediate aftermath of the incident but the rate drops exponentially
afterwards. This is because as time passes, the intensity drops exponentially as the
novelty of the information reduces (Hendrickson, 2012), (Figure 9). In Figure 9 the
blue dots represent the number of tweets that included the keyword ‘earthquake’
after the Mexico earthquake on 20th March 2012. The yellow line is the trend line
that shows the spike and the drop after the first hour.
Figure 9: People’s response for Mexico earthquake in Twitter with #earthquake hashtag
Chapter Two: Literature Review 51
However, this drop in intensity varies based on the nature of the event. When an
event happens unexpectedly, Twitter users inform their followers or just spread the
word about that event. Whilst users who were informed late continue to share
information, the overall volume of tweets reduces.
In terms of the content or the source of the tweet, it can range from people on the
ground to those living far away who want to share their concern. A user in the
ground may write "Slightly dizzy after being shaken around by the Chengdu
earthquake for several hours now,", while a user who may or may not be near the
location might write “there is a 7.9 #earthquake in #Chengdu”. The update can be
in the form of tweet, retweet or reply. The tweets may contain keywords or
hashtags related to the location or just generic information. However, what is
common is that during such disruptive events people tend to flock to social media
and share information, creating a massive spike in information regarding that
particular event.
On the other hand, events that are anticipated have a different curve. Perhaps as
the people are familiar with the time and date of the event, only few people start
talking about it earlier and most talk about it only when the events occur. This
produces a bell curve for events such hurricane Irene (Hendrickson, 2012). That is
why slow moving event such as a flood, the pattern of Twitter usage is similar to a
hurricane rather than an earthquake. As it was seen in Queensland flood, people
tend to share tremendously at the very beginning and the rate of sharing drops
afterwards (Bruns, et al., 2012)
In conclusion, there is a large volume of social media data that gets generated in
Twitter after a natural disaster. Moreover, it also gets generated very quickly.
Therefore in theory, by harvesting those streams it is possible to identify disaster
relevant information that is appropriate for action in times of disaster. The task for
emergency managers is to identify relevant information from this dataset quickly,
but due to the volume and speed of the data the is created, this task becomes
extremely challenging.
52
Context and noise The challenges are not just limited to the volume and speed of
social media output, but also to group a tweet in appropriate context. This is
because it is possible to read different meanings from words depending on the
context. For example, same word ‘shake’ can mean earthquake or a milk shake
based on the context it is used. This is termed word‐sense disambiguation (WSD)
and is a known problem in computational linguistics (Banerjee & Pedersen, 2002) as
well as in Twitter research.
However, in the context of Twitter Huston, Weiss and Benyoucef (2011) have
argued that identifying the context of the conversation can eliminate this
disambiguation as the words are meant to represent the context. Furthermore,
using words with hashtags can help to eliminate that issue because with the
hashtag, people are putting their tweets in the context of a wider ongoing
conversation. However there has been cases of misusing hashtags for promotion
(knowingly or unknowingly), and for spam.
Therefore when tweets are processed in real time the context and relevancy
identification poses a challenge. Some of the ways Twitter researchers have
addressed this has been explained in detail in the methodology chapter.
Veracity Credibility of information is an issue in Twitter (Castillo, Mendoza, &
Poblete, 2011). In the seminal paper “Can we trust what we RT”, Mendoza et al.
(2010) examined if it is possible to differentiate real information and rumour in
Twitter. The authors found that rumours or fake information tend to have more
provocative tweets rather than descriptive or seeking help based tweets. Similarly,
Gupta and Kumaraguru (2012) identified 50 different variables such as tweet
length, whether the tweet included a URL and the number of followers of the user
who tweeted it, to rank tweets based on their relevance. However the problem
with automatically classifying tweets based on their meta‐data alone is, it may miss
the context the tweet is in.
According to Chen and Sakamoto (2012) people are more likely to spread
information via retweet if they can relate to the situation. They are also more likely
Chapter Two: Literature Review 53
to spread negative information (such as death toll, building collapse etc.) than
positive information during disaster. This might be because negative information
has more attention grabbing potential than positive information (Pratto & John,
1991). Therefore updates such as “the road is ready to be used” are less likely to
get retweeted than “5 new deaths in Toowoomba”. Since these tweets are usually
not verified at the time they are sent, they potentially contain a lot of irrelevant
information for emergency services and can pose problems of reliability,
authenticity and usefulness (Mendoza, et al., 2010).
The complexity of separating credible information from rumour therefore remains
extremely challenging. Although studies have been conducted in the area of deep
machine learning that focuses on automatically identifying credible information it is
still not possible to automatically identify credible information (Arel, Rose, &
Karnowski, 2010). This thesis therefore does not engage with the verification of
information because the challenges that come with veracity are beyond the scope
of this thesis.
Temporality The longevity of a tweet can vary depending on many factors (Bruns,
2011). Although the design of Twitter encourages quick status updates, many
tweets that appear important gets passed on during a disaster (Starbird & Palen,
2010), and in some cases long after the validity of the tweet is expired (Maxwell,
Raue, Azzopardi, Johnson, & Oates, 2012). For example, in the 2011 Queensland
flood a tweet asking help from other users to collect animals from a RSPCA centre
that was being affected by the flood was highly retweeted and many volunteers
drove to get the animals out. However, long after all the animals were gone and
flood water was already inside the facility, people were still coming, as a later tweet
from the RSPCA advising that all animals were already removed was not as highly
retweeted (Cheong & Cheong, 2011).
Identifying such temporal information remains a problem for Twitter research with
regards to natural disasters (Cataldi, Di Caro, & Schifanella, 2010). Although time‐
stamp metadata can be used to identify the temporality of a tweet, people can
copy from another person’s tweet and paste it, making it difficult to use in a real
54
time situation. As incorporating temporality increases the complexity, this thesis
does not engage with the temporality of information from Twitter.
2.3.9 Emerging from Twitter related literature
After addressing why Twitter was chosen for this research, this section reviewed
three key areas of literature related to Twitter usage in a disaster situation:
activities that are Twitter centric that might be unique to the platform, theories
that can provide an explanation of the way users use Twitter, and the key
challenges of identifying information from Twitter.
From the discussion it can be seen that after a natural disaster people use Twitter
to seek information related to their family members or the area their family lives in,
and they update information about their surroundings by posting tweets, images or
other media items. However, a large number of users, who are not in the affected
area may also post simultaneously. Sometimes they retweet, sometimes they post
original tweets offering sympathy to the disaster affected area.
This act of tweeting on a massive scale provides both opportunities and challenges
for emergency services. On one hand, these updates regarding surroundings
provides actionable information for emergency services, but on the other hand, it
may get lost easily in the large volume of irrelevant but fast appearing tweets.
Other challenges such as the high visibility of rumours and outdated information
also poses additional problems in gathering disaster relevant information.
Overall, an extensive amount of research has been conducted that looks at what is
being said in the tweets and how these can be filtered to identify relevant
information. Theories of collective behaviours have also been used by researchers
to investigate how the techniques of identifying relevant infromation can be
improved. Certain theories such as contagion theory suggest that retweets are
likely to be not useful. Convergence theory discusses why Twitter users are likely to
adopt a dominant hashtag to be part of the on going event and complex adaptive
Chapter Two: Literature Review 55
systems theory suggests how users might be integrating new features and evolve
the way they had been communicating. The next section combines the literature
summaries from both sections, natural disasters and Twitter, to identify key
challenges and opportunities for this research.
2.4 Summary
There is a body of literature that has analysed Twitter data from various natural
disasters around the world to suggest that there are possibilities and challenges in
finding relevant information for emergency services from Twitter (Acar & Muraki,
2011; Mendoza, et al., 2010; Verma, et al., 2011; Vieweg, Hughes, Starbird, & Palen,
2010).
From an opportunity perspective, Twitter helps people to mobilise themselves to
assist others, allows first responders to communicate between themselves and acts
as a potential information source and venue for dissemination. These actions are
similar to the information needs identified by the emergency services, including
information related to the community, information regarding which area has been
most affected and feedback on the relief effort (Bodenhamer, 2011; Hall, 2007;
Reynolds, et al., 2002; UNISDR, 2013).
However, the challenges of finding this information are many. From the literature it
can be seen that most of the tweets related to disasters contain information from
outsiders that include sympathy, retweets of existing reports, and misinformation
or outdated information – all not what is regarded as relevant by emergency
services.
Therefore, although research has already been conducted on finding information
from Twitter, there is a gap in identifying information automatically that is relevant
for emergency services after a disaster. In order to do that this research uses a
56
mixed methods approach by combining quantitative and qualitative research tools.
In the next chapter the methodological approaches are discussed in detail.
Chapter Three: Methodology 57
Chapter 3: Methodology
The previous chapters, the Introduction and Literature Review, have identified the
overall information needs of emergency services and the potential and challenges
in finding this information from Twitter. This chapter discusses various
methodological approaches used in identifying specific information from Twitter
before outlining the research design used in this dissertation. The theories and
frameworks described in this chapter broadly fall under the computer science
discipline, the third component of the research domain described in Figure 3.
This chapter is structured into three sections. The first section discusses various
data types and how Twitter data is collected. The second section discusses the
methods of analysis and tools for collecting data. The third section addresses the
research design that describes the flow of the research, followed by a description of
how results from the experiments were evaluated in this research.
3.1 Deep Data, Surface Data and Big Data
To understand computational methods in social science, it is necessary to
understand what types of data social science researchers collect. Manovich (2011)
proposes that there are two types of data. One is surface data, which stands for
data collected from many people but where the collection method limits it to
surface level information. The other is deep data, which is more in‐depth and often
from a small number of participant. Both of these are build on variations of two
well‐established paradigms known as quantitative and qualitative research.
58
Deep data is about gaining a deeper understanding of a very small sample of data
(Manovich, 2011). Various branches of humanities and social sciences use the deep
data approach to understand what is going on with the subject matter. Most of the
time ‘why’ questions tend to shape these type of research. This type of research
tends to use qualitative methods such as interviews, participant observation and
focus groups to gather data on an event.
Surface data on the other hand is used to find a pattern by analysing large datasets
where most things are converted to numbers and then grouped based on those
numbers. Computer science, statistics and economics tend to use surface data. In
these type of research the questions ask ‘what’ rather than why. Most of the time,
these research cover large sample of the population, as they do not require
significant time investment from the participants.
Big data on the other hand can combine both surface and deep data. Unfortunately
there is no agreed definition of Big Data. Even the widely cited article by boyd and
Crawford (2012) vaguely defines big data as “a cultural, technological, and scholarly
phenomenon”. Mayer‐Schönberger & Cukier (2013) defines big data as an ability to
crunch and analyse a large volume of data, to draw astonishing conclusion from
that data (Mayer‐Schönberger & Cukier, 2013) but do not define what consists of
the large volume of data. Therefore in a traditional sense a dataset of big data has
three characteristics or three Vs; volume, velocity and variety. This type of data is
meant to be beyond the scope of traditional database storage and requires a
different approach to indexing and retrieving information stored in the database.
Even though the original term ‘big data’ stands for large data set, and tweets are
made of 140 characters, the reason Twitter data falls under the big data category
due to the collection of information and the frenetic pace at which it gets
generated. Therefore 500 tweets is not considered big data but 500 thousand
tweets, which is a common number of tweet after a natural disaster can be
considered as big data. It is necessary to note using such an example is problematic
because situation of considering 500 thousand tweets as big data is likely to change
as amount of data gathered continues to increase.
Chapter Three: Methodology 59
Although a standing criticism of Big Data is that it is only surface data (Uprichard,
2013; Kitchin, 2014), computational social science researchers have been engaging
with Twitter and big data is to understand human behaviour on a large scale
(Broniatowski, Paul, & Dredze, 2014; Wang, Chen, Thirunarayan, & Sheth, 2012;
Zikopoulos, Parasuraman, Deutsch, Giles, & Corrigan, 2012). Understanding human
behaviour has traditionally been part of the qualitative or deep data approach, as it
was not possible to gain deeper understanding about someone’s life when
collecting information through quantitative collection methods. With big data and
social media this is changing, and in doing so is allowing researchers to collect large
scale data about human behaviour including contextual human experience and
analyse it using both quantitative and qualitative methods (Tufekci, 2014).
In addition, for the purpose of many social science researchers big data also acts as
a starting point to identify meaningful pattern that can be analysed further. Using
abductive reasoning on big data sets researchers looks for patterns in order to form
their hypothesis before formally proceeding with deductive theory construction
and inductive empirical testing (Dixon, 2012).
Therefore, even though big datasets create problems in terms of storage and
accessibility, and often requires new ways of dealing with the data, big data has
also been changing the way researchers understand and experience knowledge
(boyd & Crawford, 2012; Lavalle, Lesser, Shockley, Hopkins, & Kruschwitz, 2011).
These large datasets have given researchers the ability to find information ranging
from medicine to astrophysics that they were unable to find before. Another
reason this area of research has risen to prominence among social scientists is the
ability to understand human behaviour through social media. As increasingly more
people join and share information and day to day life in social media, social media is
becoming an important tool through which to gain more insight into how people
behave.
In conclusion, Twitter researchers have used the Twitter dataset for various
purposes. Some researches have used only deep data through qualitative methods,
some has used surface data with quantitative methods and some have used big
60
data with quantitative or mixed methods. After discussing what data points can be
gathered from Twitter, research methods are discussed in this chapter under
methods for analysis section.
3.2 Gathering Twitter Data
It is necessary to consider the question of ethics before gathering Twitter data. In
gathering data from Twitter, most, if not all of the tweets that are gathered using
API comes from publicly available tweets. Therefore, from a technical point of view
there are no ethical issues in gathering Twitter data. However, tweets are
expression of users and when users expressed their thought and emotions via
tweets they may not have intended their tweets to be gathered in a dataset.
Therefore when gathering datasets from tweets this issues needs to be carefully
considered.
However, in this case the dataset was gathered around hashtags and keywords
related to a major natural disaster and details of the dataset is discussed at the end
of this chapter. It can be justified that since users tweeted with that specific
hashtag or keyword in their tweet, they deliberately meant the tweets to be visible
to other members of the hashtag as the hashtag is a crisis hashtag and contribute
to the on going crisis discussion. Furthermore this research is aimed at finding
patterns in the tweets rather than focusing on the content of each tweet. This
removes the focus from the contribution of individual user and looks at the overall
response pattern of the crisis and how a meaningful contribution can be obtained
from these patterns. Therefore the possibility of this research and the tool
developed from this research being harmful to individual is minimal. In addition,
this project has also received ethical clearance from QUT to conduct the research.
In order to use Twitter data for research, after considering ethics, next step is to
collect the data (Woodford, Walker, & Paul, 2013). However, due to availability of
Chapter Three: Methodology 61
many data points in Twitter (Broniatowski, et al., 2014), as well as limitations
imposed by Twitter (Puschmann & Burgess, 2013), one needs to be selective about
what type of data to collect. In order to understand what can be collected that is
potentially be useful for emergency services, this section first addresses the
relevant components of Twitter for emergency services, followed by a discussion on
Twitter data and metadata. This then leads to a discussion on various data sources
and limitations. The section then concludes with reasoning for choosing the specific
method for collecting data used in this thesis research.
3.2.1 Twitter data
The first element of gathering Twitter data is to understand the building blocks of
Twitter. Although Twitter has various components, tweets and users are the two
key items that are visible to any Twitter user (Twitter, 2013). The following section
therefore firstly discusses tweets. This is then followed by a discussion of users.
Although this research focuses on tweets, detailing the technical side of a user
account can assist in understanding the building blocks that can be used to identify
disaster related information.
Tweet A tweet is the most basic building block of Twitter (Twitter, 2013). This is
what people read when they are posted in Twitter. A tweet can contain any
language supported by computers (e.g., English, Chinese, Arabic), embedded
images, website URLs, hashtags, and @replies. Each tweet is limited to 140
characters. They can also include emoticons (funny faces, sad faces etc.). Tweets
are also referred to as status updates. Any tweet can be embedded into another
website, other users can reply to that tweet, they can also favourite that tweet, or
unfavourite it. Only the user who composed the tweet can delete it. Figure 10
shows a sample tweet related to a crisis situation where a Queensland based
regional council is advising their residents to evacuate an area.
62
Figure 10: A Sample tweet related to a crisis situation
Figure 10 demonstrates another Twitter practice, the “MT” or ‘modified tweet’.’
This marker is inserted by Twitter users to indicate that the tweet was not
composed by them
Although this does not reduce the importance of the tweet, it is necessary to
understand the various types of tweets and the contents users can create namely;
original tweet, retweet including modified and quoted tweet, @replies, hashtags,
URL and media.
Original tweet An original tweet is usually the 140 character long message
composed by the user from their account and is viewable publicly. For example in
the sample tweet in Figure 10, the original tweet was from the account QPSmedia,
who wrote the message about Moreton Bay Regional Council advising residents to
evacuate. During natural disasters many people who are on the ground share their
current situation in the form of original tweets (Starbird, Muzny, & Palen, 2012). It
could be describing their situation (Bruns, et al., 2012; Hughes & Palen, 2009),
posting photos of their surroundings (Boulos et al., 2011), venting frustration about
their environment, or wondering how others are doing. In disaster situations
original tweets are not only composed by people who are on the ground, people in
other places may post original sympathetic tweets such as “pray for Haiti” (Smith,
2010) or “pray for Queensland” as well. Similarly, people from far places may post
original tweets that contain keywords such as “help people in Queensland” which,
although is a demonstration of good heart, is not useful for emergency services.
Chapter Three: Methodology 63
Retweets (RT) Redistributing another user’s tweet to their own followers is
known as a retweet and Twitter users can do that via retweet button or manually
but putting “RT” in front (Bruns & Burgess, 2011a). Manual retweeting has always
been practice of Twitter users, however when the retweet button was introduced
in 2009 (Kwon & Han, 2013) it became a common practice, partly due to the
increased ease, and partly because the nature of Twitter encourages sharing.
Significantly for this research, retweets often count for a large volume of Twitter
activity in a natural disaster. In the ARC Centre of Excellence for Creative Industries
and Innovation (CCI) floods report Bruns, et al. (2012) found that the number of
retweets were often higher than original tweets. After the Japan earthquake in
2012 the number of retweets were 20 times more than normal retweet rates
(Miyabe, Miura, & Aramaki, 2012). While it amplifies the visibility of tweets, a large
number of retweets contain media based information that is of limited use by
emergency services. Due to their lack of relevance for emergency services, retweets
were the first element that was filtered out in this project. The method of doing so
is described in chapter 5.
@ replies Replies to another user’s tweet are marked with @reply. This @reply
does not necessarily have to be a reply to a status update, it could be a user
attempting to reach another Twitter user. Users can place a dot (“.”) in front of the
@ to ensure that this @reply is a public message that is broadcasted to all of the
user’s followers. This form of sending a public message is often seen in political and
crisis communication. Replies usually suggest conversation, but during a disaster it
can be an attempt to reach a user. As observed by Bruns et al. (2012), about 200
replies were sent to the twitter account of the Premier of Queensland although
they were not meant to start a conversation, but rather to alert or to report a
specific situation. In terms of conversation replies, the number of genuine replies to
a specific user in a natural disaster suggests a higher visibility of that user’s tweets
compared to others. Emergency services can therefore use replies to identify
influential or visible users on whom they can focus to get more information.
64
Hashtag (#) In the previous chapter hashtags were introduced as a user
generated communicative feature. Whilst Chris Messina is credited as the inventor
of the hashtag for Twitter, it became mainstream during the San Diego forest fire in
2007. Citizen journalists used hashtag #sandiegofire to communicate about the fires
(Zak, 2013). Since then, hashtags have been used in many different areas from
business, politics to crisis situations such as natural disasters, riots or plane crashes
(Cullum, 2010; Glasgow & Fink, 2013; Lin, Margolin, Keegan, Baronchelli, & Lazer,
2013; Tsur & Rappoport, 2012). In this research the data was collected using
specific hashtags, as is explained later in this chapter.
URL URLs shared with Twitter during annatural disaster generally consist of
additional information (Bruns, et al., 2012). During the Queensland flood, the
majority of URLs shared were either image services (as Twitter did not have their
own embedding image option) or links to government website and traditional
media websites. From an emergency services point, this may not provide them with
additional information, although it can highlight new community sites that are
gaining popularity, as was seen in the Thailand flood in 2011 (Terpstra, de Vries,
Stronkman, & Paradies, 2012).
Media Images shared during natural disasters can be of immense help to
emergency services (Terpstra, et al., 2012). At the same time, fake images can be
problematic, and to tend to appear a lot during natural disasters (Gupta, Lamba,
Kumaraguru, & Joshi, 2013). Users can embed media such as an image or vine video
along with the tweet. This can be done by attaching the image in Twitter itself, or
via various third party apps that support Twitter. However, while an image contains
various meta (EXIF) data, when it is uploaded to Twitter, the metadata is stripped
off to ensure it is not trackable (Harvey, 2014). While this protects the privacy of
the user and makes the user non identifiable, it also eliminates the possibility of
emergency services to identify if the images are directly taken on a camera or have
been modified via Photoshop.
Overall, as can be seen from the Twitter research cited in this section, a tweet
contains a range of data points that can be used to identify various patterns.
Chapter Three: Methodology 65
Researchers have used these data points, either singly or in a combination, to
address specific questions. Which of these components can be used to determine if
a tweet is relevant for emergency services is addressed in the next chapter.
The other key component of Twitter that is often researched is the users. Even
though user based features, such as a count of tweets or followers and following
were not used in this research, detailing the building blocks of the user can increase
understanding about this research project. The remainder of this section therefore
discusses various user specific components and the ways these have been used in
Twitter research.
User Profile The user profile consists of various attributes about the account
holder. Although it is meant to be a person, the account holder can be an
automated bot such as earthquake bot or a spam bot. A twitter profile contains
various data that can be useful in disaster purposes. Similar to tweets, the user
profile has both visible information and invisible information. This section discusses
the markers that are useful for emergency services during natural disasters to
extract useful information.
Figure 11: A sample profile page of Queensland Police Media Unit
Username and accounts As can be seen in the above profile (Figure 11), there are
two named units. On the top is the real name and the other is the @username.
Usernames are sometimes also called the user handle. The username appears in
66
the URL and is unique. The real name indicates who the account holder really is as a
person or organisation, however there is no requirement to use a real name in
Twitter. The username can have 15 characters and the real name 20. Both the
username and the real name can be changed at any time. The only difference is, as
the username is unique, changing a username requires that the new username is
not in use by anyone else. The real name on the other hand can be changed at
anytime without having to worry about duplicates.
From an emergency services point of view, a real or user name can assist in
identifying if the information is coming from the general public or from a media
organisation. In addition, if the name suggests that it is an automated system (e.g.,
Figure 12), it could mean that the user is updating their status from sensors, which
can be used by emergency services. Overall, both the username and real name can
be useful for emergency services to identify who the user is.
Figure 12: A sample profile page of an automated bot
Description In this space Twitter users briefly describe themselves. In general
people tend to explain briefly what they do. Official accounts such as the
Queensland Police Service (Figure 11) may use this to describe more important
things as well. Official bots (bot‐assisted human or human‐assisted bot) tend to
have a written description indicating that they are automated accounts (Figure 12).
Wagner et al. (2012) suggest that the description is a key attribute to identify the
topic expertise of the user. Thus, if the user is an expert in disaster related
information, it is likely that they may have this detail about themselves written in
Chapter Three: Methodology 67
the description. By extracting such information, emergency services can identify key
personnel and get informative tweets.
Count of tweets, followers and following An additional part of the user profile is
the count of followers and following. A follower count shows how many other
accounts follow this user and the following count shows how many other accounts
this user follows. Generally a popular figure such as celebrity, media or important
accounts have a very high follower count, while they do not follow a similarly high
number of accounts. Compared to that, a new user who is not famous in the offline
or real world, will have limited number of followers and following. On the other
hand, active twitter users may have a close ratio of followers and following counts,
having hundreds on both sides. A high follower count from a user account can be
an identifier of credible tweets, since users with a high follower count are less likely
to damage their reputation by sharing false information (Morris, Counts, Roseway,
Hoff, & Schwarz, 2012). These type of users with high follower counts can belong to
the group the Reynolds and Seeger (2012) have argued are ‘leaders’ who tend to
post important information, and in case of incorrect postings, tend to correct
themselves. For emergency services, such users could be useful for identifing
breaking news.
The count of tweets indicates how many tweets a user has sent out and can be an
indicator of a novice user or ‘elders’ (Reynolds & Seeger, 2012). Elders are the type
of user who has been active before but stopped being active. They are likely to
have large gaps between tweets but they could jump back if the situation demands
for it. These users are likely to be familiar with various the twitter terminologies
described earlier. Novice users however could be those who have heard of the
benefits of twitter during a disaster and have just signed up to get or provide
information (Vivacqua & Borges, 2012). In all those cases, tweet counts and time of
tweet can be a useful marker for emergency services.
Profile image Profile images are an important part of a user’s expression of
identity. By default Twitter provides every user with an ‘egg’ image. The account
holder can upload a preferred image to replace the egg. The usefulness of profile
68
image is it visually distinguishes new users with older users without looking at other
data sets. Even when analysing it programmatically, if the user profile is an egg and
the user’s tweet count is low, it might suggest that this is a new user. With regard
to emergency services information, if such a user has started to tweet about the
location it could be that the user has just signed up to update about the disaster.
Verified Sometimes a blue verified badge (a tick sign) appears in the top right
portion of user profiles. This is to establish the authenticity of the account, and is
done for highly sought after users in key interest areas. These areas include
celebrity (e.g., sports, music, acting), political and governmental figures or
organisations, media, religious leaders, and well known businesses and business
leaders.
The relevance of the verified option is that, it is almost impossible for a normal user
to be verified and that a tweet from verified user may be expected to be retweeted
a lot. Furthermore, such an account could belong to other emergency services from
other government areas or local areas and thus providing relevant information. In
addition, these users could be ‘leaders’ in another field and they may take an
interest in the disaster outside their usual role (Tonkin, Pfeiffer, & Tourte, 2012).
Thus the verified user tick is a key marker of information verification, but not
necessarily for information gathering for emergency services purposes.
User ID Although every user has a user ID number, it is hidden and often the user
is not aware of the number. The benefit of knowing this number is that, unless the
user deletes the account, the number does not change. Therefore, even if the user
changes their username or real name, it is still possible to find information about
that user by using their ID number. Such information can assist in identifying users
who have been active in previous natural disasters. Although there is no guarantee,
it is possible that the user who was active in a previous disaster will also be active in
the current disaster. And in case they have changed their user handle (username),
they are still identifiable through Twitter.
Chapter Three: Methodology 69
Location data There are two ways a user can provide their location. The first is by
setting their location in their profile. Second is when a user enables geo location,
the geo enabled field gets populated with geo location data. This data then can be
used to identify where the user is located. This is a very powerful feature and can
be useful during crisis. However, due to various reasons such as high battery
consumption of geo location features and privacy concerns, people are often
unwilling to share their geo location data. Thus other ways are needed to identify
users and their locations. An alternative option used by researchers is to convert
the time zone to a location.
In conclusion, Twitter has many building blocks that can be used by emergency
services to find relevant messages. Although both tweets and users were discussed
in this section, in this project only tweet data was used. The main reason for only
selecting tweet data is that including user data would have increased the scope of
the project immensely due to various challenges associated with user data. In
addition, when the data was gathered for this research only tweet data and not
user data was collected. Using the latest user information on archived data may
also mislead the direction of the research. Therefore only tweet data was used in
this research.
Nonetheless, each tweet contents a lot more information than what is visible
through the Twitter feed. In the next section this invisible data, or metadata is
discussed in further detail.
3.2.2 Twitter metadata
So far the discussion about Twitter data has been around what can be seen from
Twitter. Metadata on the other hand, is structured data provided by Twitter that
allows access to feature objects that may or may not be visible directly from
tweets. According to Dwoskin (2014) there are 150 different metadata associated
with each tweet, which includes commonly visible metadata such as retweet counts
70
and hashtags, to metadata that can only be accessed through an API, such as
location metadata. A number of studies have used Twitter metadata to identify key
moments in communicative activities because metadata can go beyond the
contents of the tweet to identify important information (Burks, Miller, & Zadeh,
2014; Leetaru, Wang, Cao, Padmanabhan, & Shook, 2013). This section discusses
the opportunites and challenges associated with metadata, and discusses the
different approaches researchers have used to access the metadata in order to
identify disaster relevant tweets.
Burks et al. (2014) found that the occurrence of location metadata in the
earthquake area in Japan was almost representative of the seismic data reported by
geological services. Researchers have also analysed location metadata to identify
areas affected in real time (Davis Jr, Pappa, de Oliveira, & de L. Arcanjo, 2011;
Kinsella, Murdock, & OHare, 2011). Based on the findings of this research it can be
suggested that the identifying location is a crucial factor in a disaster (Davis Jr., et
al., 2011), and that metadata such as location and time zone are useful for
emergency services to identify disaster relevant information (Yin, Lampert,
Cameron, Robinson, & Power, 2012).
However, extracting information such as location from Twitter can be challenging.
First of all, most people do not enable geo location data in their tweets due to
various reasons such as privacy and excessive battery consumption on mobile
devices (Hale, Gaffney, & Graham, 2012). Furthermore, images that are attached to
tweets are stripped of their GPS and other metadata (Harvey, 2014), making it
impossible to extract location data. Since location metadata is collected based on
the device’s GPS location, it is dependent the user switching on their location. Since
only two percent people keep their GPS switched on (Hale, et al., 2012), emergency
services cannot rely on location metadata.
To address this limitation, MacEachren et al. (2011) searched for extracting location
information from tweets to find disaster related Tweets. However, extracting
location names is a complex information retrieval task (Jung, 2012; Li et al., 2012;
Liu, Wei, Zhang, & Zhou, 2013; Nadeau & Sekine, 2007; Ritter, Clark, & Etzioni,
Chapter Three: Methodology 71
2011). This is because, for example, street names are often based on people’s
names, making it difficult to differentiate. In addition, many roads around the world
share the same names. An Oxford Street could be in U.K., U.S., Australia or any
other country. There are 10,893 streets named as Second Street in the U.S.A. alone.
Thus finding exact locations is problematic (Finin et al., 2010; Jung, 2012; Liu, et al.,
2013), and because of this named entity identification remains an active area of
research (Klein, Smarr, Nguyen, & Manning, 2003; Yin, et al., 2012 ).
Such problems can potentially be addressed through hashtag based location
(Huang, Liu, & Nguyen, 2015). Recent studies have found that Twitter users
sometimes use location names as hashtags. Identifying such information can help
emergency services to identify tweets that are related.
Another reason to extract metadata from tweets instead of relying on invisible
metadata is that filtering information based on metadata can lead to false positives
that a human would be able to easily identify. An example of this can be seen in the
study conducted by Gupta and Kumaraguru (2012) and as was demonstrated in
Figure 9 in the Veracity sub section of the Literature Review. Only considering
underlying metadata can allow a tweet or image that is satire to be counted as
credible. One of the reasons for this is that, when using metadata alone, the tweet
is taken out of the context of what is being said. Thus, counting only on Twitter
metadata might be a useful tool to get an overall summary or pattern, but is less
helpful to identify individual tweets where a user is asking for help.
In conclusion, researchers have identified that metadata contains information that
is potentially relevant in disaster situations. However relying only on what is
provided by Twitter is problematic and is more useful for understanding patterns
than identifying individual tweets. On the other hand, metadata that is extracted
from tweets, such as location or image, can be useful for emergency services and
are considered in this thesis.
72
3.2.3 Twitter data and metadata source
Having discussed what relevant information for emergency services can be
collected from Twitter, this section addresses the sources that Twitter data and
metadata can be collected from. This is because despite tweeting activities are
done via Twitter and the tweets are mostly public, accessing all tweets is restricted
by Twitter (Puschmann & Burgess, 2013). A commercial license is required to access
both the full dataset, known as ‘firehose’ and a ‘decahose’ which incorporates only
10% of all tweets (Leetaru, et al., 2013). The alternative is free access to Twitter API
data, but the tradeoff is it returns only 1% of the Twitter contents.
Source
Sample returned
Historical Data Cost Common Export Format
Twitter website As much as user can see
Undefined ‐may return historical data
Free Manual reading
Twitter Search API (part of REST API)
Approx 1500 tweets
One week Free json
Twitter Streaming API
1% of Twitter data
None – live data only
Free json
Data reseller (Gnip ‐acquired by Twitter)
Full twitter firehose
Complete Twitter archive from Mar 2006
Subscription starts at $500
json, HTTP Streaming, WebSockets
Data reseller (DataSift )
Full Twitter firehose (available till Aug 2015)
3+ years of Twitter data
Subscription starts at $3000 per month
json, HTTP Streaming, WebSockets
3rd party vendor (radian6 salesforce, crimson hexagon)
Full Twitter firehose
Depends on the vendor
Starts at $500 per month and increases per volume
CSV or other commonly used format
Texifter Full Twitter firehose
Depends on the vendor
Starts at $30 per 100,000 tweets for 1 to 500,000 items
CSV
Table 3: Twitter data sources
Table 3 shows the data sources available from Twitter, along with the amount of
samples they return, the availability of the data, cost and export formats.
Chapter Three: Methodology 73
As it can be seen in Table 3, the free option to collect data from Twitter is only
available from Twitter itself via API or by reading Twitter feeds manually and
copying it from the search results in the website (Kim et al., 2013). Although
reading it manually is by far the simplest option, the challenge with the manual
approach is, as highlighted in the previous chapter, that when a natural disasters
happens the volume of tweets is extremely large. For example, during the 2011
tsunami in Japan there were almost five thousand tweets regarding the disaster
every second (Acar & Muraki, 2011), and during the Mexico earthquake in 2012
there were more than 800 thousand tweets in first half hour (Hendrickson, 2012b).
This large volume of data makes reading and identifying important tweets an
impossible task during a natural disaster. Therefore the preferred choice of Twitter
researchers is to collect data by using the Twitter API (Perera, Anand,
Subbalakshmi, Chandramouli, & Ieee, 2010), as the paid options of using data
resellers can be costly (Kim, et al., 2013).
Of the two types of API detailed in Table 3, the most commonly used in Twitter
research is the streaming API (McGuinness, 2013). This is because streaming API
focuses on completeness, compared to a focus on relevance of the search API
(Twitter, 2012). The relevance search is based on direct and non‐recurring queries.
For example, searching for “my friend” with the search API will return a result that
contains top tweets ranked by Twitter’s own sorting algorithm. These top tweets
over represent the central users and do not show all the tweets (González‐Bailón,
Wang, Rivero, Borge‐Holthoefer, & Moreno, 2012). Furthermore, there is a limit on
how many API searches can be performed. The rate limit of search API is related to
how many calls are made, which in a disaster situation often reaches the limit very
quickly. At present the API search rate is limited to 15 minutes intervals, and only
delivers 180 to 450 tweets depending on authentication type (Twitter, 2015). Since
during natural disasters thousands of tweets appear every second, being able to
search for only 180 tweets in 15 minutes limits the amount of data researchers can
work with.
74
On the other hand, streaming API is designed for data intensive applications that
require a real time sample of Twitter data. Thus streaming API allows for large
quantities of keywords to be specified and tracked, retrieving geo tagged tweets
from a certain region, or to have the public statuses of a user set returned. Once a
keyword, hashtag, username or other search criteria is determined, Twitter will
deliver tweets that match those criteria (McGuinness, 2013). Given that in a crisis
situation, finding tweets that require an action such as providing help or
information is more important than finding a top tweet, the standard practice in
Twitter research is to use the streaming API.
However, there are two key issues with streaming API searches. Firstly, it only
delivers 1% of tweets (also know known as Spritzer) (Conover et al., 2011) for free.
The second issue is that the streaming API does not provide access to past or
historical data. Therefore it is not possible to collect data based on a hashtag that is
stored on Twitter servers. Streaming API searches only collect data once that
hashtag is added to the tweet collector tool, and only from the incoming feed.
The concern about a 1% data sample is the question of representativeness. One of
the common criticisms of utilising only 1% of tweets is that as 99% of the tweets
excluded, that streaming API data cannot be used for research to make
generalisable claims (Gerlitz & Rieder, 2013). To address this issue, Morstatter et al.
(2013) compared firehose data (100% of Twitter data) with the 1% of data collected
from streaming API and found that in many cases data gathered from the streaming
API contains a sufficient sample. In addition, Morstatter et al. (2013) found that
there is an insignificant difference between the 1% of data and randomly choosing
a dataset from firehose.
The area where firehose output was significantly better than streaming API was in
the discovery of new hashtags (Morstatter, et al., 2013). However it has been
argued that hashtags are a self‐selecting tool which Twitter users tend to include
when they think this will contribute to the discovery of related information or that
their contribution is related to the hashtag (Anagnostopoulos, Kolias, & Mylonas,
2012; Cullum, 2010; Tufekci, 2014). Thus although misuse of hashtags is common in
Chapter Three: Methodology 75
Twitter conversations, and is one of the biggest contributor of noise, the dominant
hashtags surface quickly and tends to be followed by other users (Ma, Sun, & Cong,
2012). Once the relevant hashtags have been established, following the hashtag will
likely generate conversation related to the topic (Bruns & Burgess, 2011b). Since
this research is not trying to identify a breaking event through a tweet, it is not
necessary to find all hashtags to identify which is the most dominant hashtag.
In conclusion, even though streaming API has various limitations, the benefits of
being free outweigh the challenges associated with it. In the section where
sampling of Twitter data is discussed, some of the ways these challenges can be
overcome are explained. However for the purpose of this project, streaming API
was deemed sufficient because emergency services often do not have the budget
to purchase expensive social media data for long periods of time. Furthermore with
firehose, the amount of data generated is large and would therefore also require
extensive computational resources (Woodford, et al., 2013). Once again it is highly
unlikely for emergency services to have such resources. Therefore for the purpose
of this project, streaming API was used and any tweet that used hashtags and
keywords prior to adding it in the list of the tools were not recorded. In the next
section some of the tools used for gathering Twitter data are discussed.
3.2.4 Data gathering tools
In order to collect tweets and other metadata from Twitter using streaming API,
researchers have used a range of tools including open source tools such as
YourTwapperkeeper (Burgess & Bruns, 2012; Larsson & Moe, 2012) and DMI‐TCAT
(Borra & Rieder, 2014; Gerlitz & Rieder, 2013), or commercial tools such as Topsy
(Thaiprayoon, Kongthon, Palingoon, & Haruechaiyasak, 2012). A brief list of free
and open source tools that can collect large amount of Twitter data in an
exportable format are provided in the Table 4. This list is not intended to be all
encompassing, as constant changes in the way Twitter works means new tools are
continually developed.
76
Tool Description License
Chorus Analytics
Combined in two parts ‐ TweetCatcher searches streaming API for keywords and hashtags and TweetVis, visualises the streaming contents.
On request, Free
Discovertext Cloud based collection and analysis solution from texifter. Uses streaming API for free version and Gnip for paid version.
Free and Paid
DMI‐TCAT
Similar to YTK, DMI‐TCAT runs on a web server and the data captured can be exported in formats such as CSV or GEXF (Borra & Rieder, 2014). In addition to collecting data it can also analyse and provide visualisations of that data.
Free
Follow the Hashtag
Web based search tool but only allows 1500 tweets to be captured at one time. If searches require more than 1500 tweets, searches must be repeated after a while
Free (in beta)
Sodato Newly developed data collection and analysis tool that allows connections to Facebook and Twitter to collect data on a large‐scale.
Free (in beta)
TAGS (Twitter Archiving Google Spreadsheet)
By using Google spreadsheet as the database, this tool allows a quick checking of keywords. It is popular for testing some keywords but is less practical in a disaster situation as the database is not get updated in real time
Free
Topsy
By using firehose of Twitter, Topsy provides a real time analysis of what people are saying about keywords. It also provides social analytics and a trend application as part of the package. Apple bought this service in late 2013.
Paid
Tweet Archivist
Allows tracking of data from streaming API once the keyword or hashtag is inserted. Pricing starts from $15 a month and allows archiving of three entries
Paid
Twitonomy Creates a visual analysis of a specific keyword, hashtag or user. Allows exporting in multiple formats.
Free
twXplorer
In addition to archiving, it provides a visual analysis of recent tweets with identified terms. The most popular links and hashtags which appear in those tweets, and the most popular other terms which appear in those tweets are also included.
Free
yourTwapperkeeper
One of the oldest tools available for collecting data on Twitter. Formerly this tool was available via the organisation’s website and anyone could use this to download tweets from the Internet. However as this was in conflict with the terms and services of Twitter, it was stopped. The company then published it as open source tool which people can download and install in their own server. For the purposes of this research this tool was used to collect the datasets.
Free
Table 4: List of off the shelf Twitter data collection tools
For this research, the datasets was based on the #QLDfloods hashtag and was
collected using yourTwapperkeeper because most of the other tools mentioned in
the tables above were not available at the time. The Yolanda dataset was collected
by Qatar Computing Research Institute (QCRI) who has been collecting and mining
Chapter Three: Methodology 77
social media data for various social and political events since 2012. To collect
Yolanda dataset they used their own custom tool Artificial Intelligence for Disaster
Response (AIDR), that has an initial component called ‘collector’ that is similar to
yourTwapperkeeper (Imran, Castillo, Lucas, Meier, & Vieweg, 2014). The reason it
was not listed in the table is because the collector tool is part of AIDR and does not
work independently.
In conclusion, there are various data gathering tools available that can collect both
Twitter data and metadata. Once these are collected, they are used for analysis
using various methods. The following section therefore addresses various methods
of analysing Twitter data, which includes the qualitative, quantitative and mixed
methods approaches that are used in computational social science.
3.3 Methods for Analysis
From the discussions so far it can be seen that within the big dataset of Twitter,
both surface and deep data can be found. Depending on the research question, a
researcher can use either deep data or surface data approach to analyse Twitter
data. Thus, usually Twitter research has been conducted with either quantitative or
qualitative approach.
In a qualitative approach it is common for researchers to select a small set of
Twitter data and study them manually to find meanings of specific tweets (Bunce,
Partridge, & Davis, 2012). This approach is also known as a ‘deep data’ approach
(Manovich & Gold, 2011). On the other hand, a quantitative approach looks to
identify patterns from a larger set (Yin, et al., 2012). This approach of analysing
surface data (Manovich & Gold, 2011) allows researchers to computationally
identify emerging patterns (Lau, Li, & Tjondronegoro, 2011). This approach is useful
for identifying breaking events such as new stories, tracking the whereabouts of a
78
disaster, creating real time alerts or finding patterns in language (Verma et al.,
2011).
This research applies a mixed methods approach, as a way of capitalising on the
benefits of qualitative and quantitative methodologies. The research draws on what
has been termed the 'computational turn' (Berry, 2011), which has focused on
engaging digital technology in social sciences research processes. For Twitter
research this mixed methods approach is useful as it allows researchers to expand
their findings beyond the small qualitative sample (Choi & Park, 2013). This section
discusses both the traditional and modern concepts of computational social science
that use qualitative, quantitate and mixed methods approaches, and then explains
how these approaches are utilised in this research.
3.3.1 Qualitative analysis methods
Even though computers and artificial intelligence have progressed tremendously in
recent years, computers are still unable to identify relevant information as well as
humans (Hovy, Navigli, & Ponzetto, 2013). Thus a number of studies have used
human evaluation to extract initial features from a dataset (Jensen, Heidorn, &
Richardson, 2013; Sabou, Bontcheva, & Scharl, 2012; Shore & Bice, 2012), before
automating the process with quantitative approaches. In a mixed method
approach, Twitter researchers have also used similar approaches of evaluating
tweets with human evaluators in order to extract features that can be used with
quantitative methods (Bontcheva & Rout, 2014; Go, Bhayani, & Huang, 2009).
There are many ways a human evaluator can engage and evaluate data
qualitatively. As qualitative research tends to assess attitudes, opinions and
behaviours, it is generally done via discourse analysis, content analysis, in depth
interviews or focus groups, as well as close reading of tweets from key users
(Marwick, 2013). However, for archived Twitter data, a preferred method is to do
content analysis by creating a coding schema and use manual coding to evaluate
Chapter Three: Methodology 79
tweets (Bruns, Burgess, Crawford, & Shaw, 2012). As this research also uses
archived Twitter data, the subsections addresses the steps used in this method.
Sampling of data for analysis As qualitative analysis that involves close reading is
usually done manually, it is a challenging task to take a large data set and engage in
deep reading. Even though 1% of Twitter streaming API data appears manageable,
it often generates hundreds of thousands of tweets, making it beyond the scope of
human evaluation. Therefore before creating a coding manual or schema a sample
from the archived Twitter data is drawn.
There are a range of ways in which a Twitter dataset can be sampled. For example,
Bruns et al., (2012) applied a systematic sampling method and took a
representative sample from the 2011 Queensland flood database (#qldfloods) by
looking at every twentieth tweet from the #qldfloods dataset. Vieweg (2012b) used
a random sampling method to select 1000 tweets from each dataset for coding.
Bakshy et al. (2011) on the other hand used a stratified sampling method where
they first filtered out spam tweets and grouped the tweets into several groups
based on certain features. They then used the top groups for their analysis. The
common characteristics of these methods are that probability sampling is the
preferred sampling method, and it was this approach that was chosen for this
project. The details of this method are explained later in this chapter.
Coding schema generation In qualitative studies, coding often refers to capturing
the essence of a portion of language or visual data (Saldana, 2012). And finding this
essence generally depends on the research question. For example, “Lots of new
folks joining the Brisbane flood info center today. Join the online community at
http://www.bnefloods.com #qldfloods #flood” can be coded as information
sharing, URL, or a call for community building action depending on the question
that is asked. If the intention is to identify the built‐in metadata such as a URL, then
the coding scheme will find that there is a URL in these tweets. On the other hand if
the research intended to create categories that has information about community,
it would be coded under community.
80
One of the first steps then is to create a coding manual. Creating such a schema is
important as it allows the coders to interpret the information from data that is
communicated at a linguistic level and to group them in their respective categories
(Fillmore, 1976). Therefore it is essential to create a referable manual that the
coders can use to convert their interpretation into measurable and numerical units
to check inter‐coder agreement (Zhang & Wildemuth, 2009). However coding is an
iterative process and most of the time it requires multiple iteration before finalising
the codes (Strauss, 1987). It is only after the coding cycles are completed, that
researchers can identify the pattern in the dataset. Furthermore, it is only after the
pattern is identified and categorised that high‐level abstract constructs and
theories can be formed (Morse, 2012).
As grouping related tweets is an important part of extracting information from
Twitter, qualitative coding is an important first activity performed by researchers to
group the tweets in ways that support the development of a coding schema that
can be used to gain understanding about the disaster (Bruns., et al., 2012), as well
as form the basis of quantitative analysis (Vieweg, 2012a).
For the first cycle of coding, Vieweg (2012a) used a binary method to divide the
tweets as off topic or on topic, with a further division of on topic and related to the
disaster and on topic but not related to disaster. This method of binary division is
used in this project to quickly eliminate irrelevant tweets before classifying the
remainder into their coding groups.
For the second pass of coding, Vieweg (2012a) identified 27 information groups
(Table 5) while analysing tweets from three different natural disasters that occurred
between 2009 and 2011. Bruns et al. (2012) developed five broad categories with
sub categories (Table 6 ). Both of these approaches contains useful but different
methods of observation. Both coding schemas are listed below to gain further
understanding about how these schemas can be applied to this research.
Chapter Three: Methodology 81
Coding schema by Vieweg (2012a)
Social Environment
Advice ‐ Information space, Animal Management, Caution, Crime, Evacuation, Injury, Offer of Help, Preparation, Recovery, Request for Help, Request for Information, Response ‐ Community, Response ‐ Formal, Response ‐ Personal, Sheltering, Status ‐ Community, Status ‐ Personal
Built Environment
Damage, Status ‐ Infrastructure, Status ‐ Private property, Status ‐ Public property
Hazard / Physical Environment
General Area Information, General Hazard Information, Historical Information, Prediction, Status ‐ Hazard, Weather
Table 5: Coding schema developed by Vieweg (2012a) with regards to natural disaster tweets
Coding schema by Bruns et al. (2012)
Information Advice, Situational awareness, Request for Information
Media Sharing News media, Multimedia,
Help and Fundraising
Help, Fundraising
Direct Experience
Personal narrative, Eye witness report
Discussion and Reaction
Adjunctive discussion, Personal reaction, Thanks, Support, Meta discussion
Table 6: Coding schema developed by Bruns et al. (2012) with regards to natural disaster tweets
As it can be seen, there are a number of similarities between these two coding
schema, as well as quite a few differences. While Vieweg (2012a) categorised the
codes based on the environment the disaster affected, Bruns et al. (2012) focused
on the type of content that was being shared. Selections from both of these coding
schema have been used in this project and are further explained in a later section.
Inter‐coder agreement The next step of the process, the reading and grouping of
tweets based on the defined coding schema, is done by either one or multiple
people or computers (Williams, Terras, & Warwick, 2013). The objective of having a
human interpreter, or coder, is to convert the subjective judgment of the tweets to
measurable units or groups (Krippendorff, 2012).
However, as human coding judgments may vary, in order to improve reliability
multiple coders are often used to code the same dataset (Oh, Kwon, & Rao, 2010).
82
At the end of the process, the coding is compared using established reliability
indexes such as Cronbach α or Cohen κ to find out what percentage the coders have
agreed on. These reliability indexes can be used to quantify the amount of errors a
single source can cause. Therefore, in most cases, when evaluating disaster tweets,
multiple coders are employed. And in most cases, there has been consistent
agreement on the coding of disaster relatedness (Vieweg, 2012b). For various
dataset analysed by Vieweg (2012b), the inter‐coder agreement for the majority of
the datasets were above 80% kappa value (Cohen κ), and therefore considered
good (Manning & Schütze, 1999). Only in one specific case of Haiti, the agreement
between the coders were below 67%, thus suggesting it was not a fair agreement.
Even though coding is generally done in a team to reduce the coder‐specific error
and to improve reliability, when the objective is to gain an understanding of the
whole dataset in order to perform future experiments, sole coders are also
employed (Burant, Gray, Ndaw, McKinney‐Keys, & Allen, 2007; Strauss, 1987). In
such situation where solo coding takes place, Saldana (2012) suggests the sole
coder consult a mentor or supervisor or even a colleague during the analyses
process as a way of validating the findings. According to Ezzy (2013), such practices
help to make connections between categories and creates a reflection process that
can assist in addressing limitations posed by single person coding. Saldana (2012)
argues, even if the result of solo coding is not used for creating a final output, it can
be used as an intermediate step as a part of a bigger process.
For the purpose of this project during phase one where the objective was to gain an
understanding of the dataset, and in identifying patterns in the smaller dataset
before applying to a larger dataset, solo coding took place. The second phase, the
coding was conducted using a crowd sourced method which is explained in the next
section.
Crowdsourcing A major criticism of manual coding in general is that it takes a long
time to perform this task. Since time is an extremely important factor after a
natural disaster, researchers have experimented with expanding the number of
coders from a handful to thousands (Imran, Elbassuoni, Castillo, Diaz, & Meier,
Chapter Three: Methodology 83
2013; Norheim‐Hagtun & Meier, 2010). With the help of crowdsourcing platforms
such as crowd flower and micro mapper, researchers have explored ways they can
engage crowds to perform this activity in a large scale (Meier, 2013). As this is a
relatively new area of research, there has been limited study on the adaptation of
the existing statistical methods with regards to crowdsourcing inter‐coder
agreement. This is another area that is explored in this dissertation.
Transition to quantitative methods As discussed earlier, most of the natural
disaster‐based Twitter research uses a mixed methods approach. The first step
adopts a qualitative approach where a coding manual is developed and coders are
used to code the tweets manually into groups as described earlier. The next step is
to create an automated option that can apply these methods of coding to a much
larger dataset. From the previous examples, Vieweg (2012a) used a coding scheme
together with natural language processing where verbs were used as the basis to
determine the communication pattern in the dataset, and then grouped them into
a specific category as developed in the qualitative step. Similarly, in addition to
grouping tweets based on their content, Bruns et al. (2012) also counted various
embedded objects in the tweet such as URL, RT, @replies, use of # (hashtag), time
and date to identify which coding group that particular tweet may fall into, or who
the message was sent to. The next section describes how other researchers have
used quantitative approaches with Twitter data and which of those were adopted
in this dissertation.
3.3.2 Quantitative analysis methods
Quantitative methods refer to systematic empirical investigation with the help of
computational, statistical and mathematical approaches. As Twitter generates a
large amount of data in a short period of time after natural disaster, research often
uses quantitative methods on its own or extends the qualitative method to identify
patterns and extract important information from Twitter. Compared to qualitative
methods, often both the content of tweets and the metadata gets used when
84
quantitative methods are employed. This may be to test if a breaking event such as
natural disaster has occurred (Yin, et al., 2012), or determine what are the specific
situational awareness tweets that are appearing in Twitter (Corvey, Vieweg, Rood,
& Palmer, 2010; Döhling & Leser, 2011).
A number of Twitter components are suitable for quantitative analysis. Among
them the most prominent is the hashtag. Although hashtags are usually not
counted to understand the contents of the tweet, they are useful for identifying the
size of the sample, or to determine if the data being collected is of significance
(Potts, Seitzinger, Jones, & Harrison, 2011). For example, it is expected that after a
natural disaster a dominant hashtag would generate a substantial amount of tweets
(Hendrickson, 2012b). If the hashtag does not generate substantial amount of data
it is possible that either the hashtag is not dominant or the event is not significant.
Therefore hashtags can act as the first data validation point.
Keywords on the other hand are widely used to identify how often a specific event
occurs . By identifying the frequency of the keywords it is possible to gauge what
type of disaster has happened or what type of information people are looking for or
sharing. However counting keywords alone is often problematic, as keywords
themselves do not describe the context of the tweet. This has resulted in extensive
research that uses various methods to identify the context of the keywords. In the
following sections several of these methods are explained in detail.
Other basic building blocks of Twitter can also generate quantitative data. @reply
or @mention are useful for identifying prolific users, and to create network graphs
of interactions or indications of impact (Bruns., et al., 2012). Counts of retweets
suggest visibility of tweets or the user as they can amplify conversation as it allows
users to broadcast a specific message to their own followers. Although for the
purpose of emergency services retweets are often considered as unimportant
(Mendoza, Poblete, & Castillo, 2010; Thomson et al., 2012), they can be useful in
certain situations such as in the case of the Christchurch earthquake where a tweet
about the CTV building was retweeted a number of times before the building
Chapter Three: Methodology 85
collapse became prominent (Paul & Bruns, 2013). Therefore the viability of using
retweet in determining importance is considered in this dissertation.
Embedded objects such as URLs, images and video also contains relevant
information. For example, a highly shared URL may contain information about the
disaster warning or information from media. Although for the purpose emergency
services, URL information may have limited use, research has used counts of URLs
to identify message dissemination in Twitter. Images and videos are one of the
most useful features in assessing the amount of damage caused by the disaster
(Muralidharan, Rasmussen, Patterson, & Shin, 2011). Unfortunately the number of
fake images spread through Twitter is also high. Moreover, fake images tend to get
more visibility with retweets due to their quirkiness (Gupta, et al., 2013). However,
images remain an important entity to identify important information during
disaster.
Apart from the contents of the tweet, metadata can be counted and used to
identify patterns as well. For example, tweet creation time and date metadata is
often used to create temporal analysis or to identify a section for further analysis.
By counting when the particular message appeared in the tweet, Cataldi, Di Caro
and Schifanella (2010) identified the temporality of the tweet and if it is still
relevant.
The geo location feature of Twitter is also useful metadata for emergency services.
Although the number of users who share their geographical location with Twitter is
often below 2% (Hossmann, et al., 2011), it is regardless important metadata to
consider. In cases where geo location data is not available, related metadata such
as user’s time zones have also been used to identify the potential location of the
user (Hale, et al., 2012). Since location metadata contains useful information,
researchers have converting time zone to location and extracted named entities
from the tweet itself (Jung, 2012; Li, et al., 2012; Liu, et al., 2013). These additional
metadata are also being used during quantitative analyses to identify various
patterns in Twitter.
86
Overall, there are many features that are used by Twitter researchers to analyse
tweets quantitatively. The following sub‐section describes various methods
researchers have used to analyse the above mentioned tweet content data as well
as metadata in order to find relevant information from Twitter. This is then
followed by a justification for applying some of these methods in this project.
Word Frequency In Twitter research that uses computational methods, detecting
whether a natural disaster has happened falls under the category of event or topic
detection. Both of these terms are often used interchangeably because any
breaking event creates topics (although not all topics become a breaking event).
The usual approach is to count the frequency of given terms over a period of time
and if the frequency is higher than the usual rate, it can be considered as a
potential breaking event (Petrovic et al., 2013). Sakaki et al. (2010) have utilised this
method to detect earthquakes in Japan and alert the community that a potential
earthquake may occur.
As quantitative methods focus on counting and measuring, such frequency
counting is one of the most popular analysis methods used in quantitative studies.
In terms of topic detection, the most visible topic detection is the trending topic,
which displays currently popular keywords and hashtags in the specific geographical
area and is displayed by Twitter on their homepage using proprietary algorithm
(Lee et al., 2011). ). Trending topics were introduced by Twitter in 2008 and has
been widely used ever since (Abrahamson, 2012). Due to the sudden burst of
tweets, disaster keywords often become trending topics in Twitter, which
prompted some researchers to use it to identify disaster relevant tweets (Lee, Yang,
Chien, & Wen, 2011).
However, according to Lin and Mishne (2012) trending topics can depend more on
the velocity of tweeting than the volume, as interest changes quickly in Twitter.
Furthermore, a topic might feel popular but may not generate enough volume of
mentions compared to other topics which might not seem popular in order to be
listed as trending topic (Twitter, 2010). Furthermore, sometimes even if a topic
Chapter Three: Methodology 87
generates huge volume of interest, but is outpaced by other topics in terms of
velocity of mentions, the initial topic might get delisted by the newer entries.
Overall, although trending topics may be useful to identify if a disaster in progress,
the trending topic can also contain a large number of frequently appearing tweets,
making it difficult for emergency services to isolate relevant information. In
addition, even though trending topics are a useful indicator of highly popular
tweets, it is less useful for emergency services as it usually takes a few hours for a
topic to become trending (Mendoza, et al., 2010). Therefore, even though it
suggests the topics are related to breaking event, as trending topics can be slow to
appear in the list, this measure has not been used in this research.
Detecting a bursty topic on the other hand is a more useful method. This refers to a
sudden spike in the dataset. Various researchers have used the bursty topic to
detect potential hazardous events through Twitter (Yin, et al., 2012; Z. Wei, 2011).
The common way to use bursty topic detection is to assign a list of keywords, which
can include part of a keyword, to identify if there is a sudden increase of the use of
that word. For example, Hendrickson (2012a) used the word earthquake to detect
more than 800 thousand tweets after the Mexico earthquake. Thus usage of the
bursty topic is a commonly used method detect sudden event.
Counting the frequency of other components has also been used in Twitter
research. Bruns et al. (2012) used number of replies received by a user to identify
impact, and a count of retweets to determine visibility of a tweet. In order to
compare communication patterns across a dataset, Bruns and Stieglitz (2012) used
counts of other entities, such as URLs, to identify the difference between types of
events. Lin and Mishne (2012) used a combination of keyword count with the speed
that tweets appear, to identify if an event has recently occurred.
Word frequency counting has also been used to identify an area that has a power
outage, and to provide road and traffic situation information using Twitter after the
Japan tsunami (Huang, Liu, Du, & Cheng, 2014; Utani, Mizumoto, & Okumura,
2011). Usahidi mapped the count of location names to a mapping system and were
88
able to showing visually which area had more reports of damage, this providing a
quick visual indication of the status of damage. Robinson et al. (2013) also mapped
tweet counts that contained the word earthquake to create a quick look of affected
areas in the New Zealand earthquake.
The limitation of using word frequency searching in an emergency is that once a
disaster already happened, the next course of action for emergency services is to
help people, and therefore identifying a breaking event is less useful. However, as it
can be seen from prior research that tweets containing disaster related information
in a disaster that continues for a long time (e.g. flood) or comes with a few days of
warning (e.g. cyclone), have an up‐down trend (Bruns, et al., 2012). The up‐down
trend happens because people don’t tweet when they are asleep and therefore
total amount of tweets reduces at night and then rises again during day. However,
if there is a sudden change in event, there is a sudden spike in tweeting activity
regardless of the time. This method can therefore be used after the first major
event to detect if a certain area has been affected by a second wave of disaster, or
to identify if the severity of damage has increased in a certain location. Although
there has been extensive research on methods to improve the technique of bursty
topic searching, research has generally used universally known keywords to identify
the burst (Platt, Hood, & Citrin, 2011; Aggarwal, 2011; Becker, Naaman & Gravano,
2011). There has however been limited research on which keywords actually
appear in Twitter that signal the type of information needed by emergency
services. Therefore this research looks at identifying a list of keywords and
proposing a framework to identify such words.
There is an additional challenge that is associated with the use of the frequency of
entities. Counting only single entities such as keywords, replies, retweets or URLs
may not provide enough information to identify if the tweets share the same
context. Therefore it is necessary to find a way to group individual tweets in a
cluster or classify them individually using various methods. Some of these
classification and clustering methods are addressed in this later sections of this
chapter.
Chapter Three: Methodology 89
Natural language processing As it can be seen from the previous sections,
although identifying patterns can be useful way to find breaking events and topics,
for the purpose of emergency services, finding information from individuals tweets
is more desirable (Goyet & Morinière, 2006; Lorch, 2005; Telford, Cosgrave, &
Houghton, 2006). With the increasing use of social media in natural disasters, the
expectation from people that they will have their message heard by emergency
services, it is becoming even more important to identify and categorise individual
tweets according to whether someone is asking for help or providing information
about the location (Reynolds & Seeger, 2012). Thus another widely used method to
analyse disaster related tweets is natural language processing (Corvey, Vieweg,
Rood, & Palmer, 2010). There has been extensive amount of research in this area
that deals with various forms of natural language processing (Valero, Gómez, &
Pineda, 2009; Verma, et al., 2011; Vieweg, Hughes, Starbird, & Palen, 2010;
Vlachos, 2011). This includes dictionary lookup, word sense disambiguation, part‐
of‐speech tagging, counting frequency of unigram, bigram or a combination of
these methods.
Dictionary of keywords Dictionary lookup is generally the first approach when
using natural language processing to classify Twitter data (Han, Cook, & Baldwin,
2013). The process of dictionary lookup is done by breaking each tweet into words
or tokens, known as tokenization, and to then compare that with words in the
dictionary. The common problem with Twitter is that a significant amount of tweets
do not comply with traditional spelling. For example it is normal to use the word b4
to represent before. To address this issue Han et al. (2013) suggested normalising
texts to match regular vocabulary in the dictionary.
Similarly, it is also common to perform other removal processes to reduce the
number of counter‐checking of word and their variants with the dictionary. This
process often involves eliminating non‐representative words such as conjunctions
and prepositions, as well as short function words, such as ‘the’, ‘is’ and ‘which’, in
order to leave the bare essential words in a single tweet. This process is then
followed by a further reduction of words into their original form through a process
90
called ‘stemming’ (Imran, et al., 2013), which converts plurals, adverbs, adjectives
into the basic word.
However, there are several limitations when applying these research methods in a
disaster situation. A notable limitation is the lack of a relevant referable word list
(also known as a dictionary) and of a framework to create such a list that contains
the words that need to be counted. For example, in a flood the commonly used
words would be water, rising, filling but in earthquake it would be shake or broken
(Yin, et al., 2012). The unavailability of such lists makes it difficult to identify which
words are more important than others. Furthermore, such a list would also need to
be updatable, as people learn new words in a disaster situation and use that to
refer to the disaster. For example, in the Christchurch earthquake, people started
to use a term called “liquefaction” shortly after earthquake to refer to the soil
becoming liquid and coming out of the ground (Reyners, 2011). Since this is not a
commonly used term, this would not be in the word search dictionary,
demonstrating that such a dictionary needs to be updatable. A framework that can
identify the words used and add new words would be useful to isolate potential
disaster related tweets from those that are not related.
One could argue then that as the topics of conversation continuously change in
Twitter, having a static dictionary is pointless. However, as it has been seen from
various research (Mandel et al., 2012), a list of keywords that can be used as a
starting point would be a useful addition to the body of literature. Therefore one of
the tasks of this project is to identify a mechanism to create such dictionary from
disaster tweets.
Co‐occurence of keywords One of the biggest issues of identifying individual
keywords using a dictionary lookup method is word sense disambiguation (Banerjee
& Pedersen, 2002). For example, by looking at a single word ‘foundation’, it is
difficult to determine if it belongs to a foundation of a building that is flooded or it
is a foundation that has donated money for flood victims. Owoputi, O’Connor, Dyer,
Gimpel, Schneider, & Smith (2012) suggested grouping phrases that co‐occur even
though based on a dictionary they are unlikely to be together. Through this process
Chapter Three: Methodology 91
it is possible to identify a theme based on co‐occurring words. For example, by
comparing the word group ‘water’ and ‘food’ with ‘flood’ and ‘water’, it is possible
to identify themes, such that the first group is potentially describing a need,
whereas the second group is describing the situation. As this is a useful theme
identification method, it is adopted in this dissertation.
N‐gram Before going further it is necessary to address other commonly used
methods for natural language processing in Twitter research. One of the most
notable methods is n‐gram, which is a contiguous sequence of items (where n
refers to the number of items) in a sequence of text (Dunning, 1994). The question
of how many words should be grouped together was addressed by various n‐gram
methods (Verma, et al., 2011). Bermingham and Smeaton (2010) have found the
unigram method to be better than the bigram method in finding sentiments from
tweets. However, Verma et al. (2011) found that bigrams perform better than
unigrams or trigrams when analysing a Twitter dataset. Due to the similarity
between a bigram of words and the co‐occurence of words, the n‐gram method
was not tested in this research.
Sequential pattern mining A more advanced extension of n‐gram is sequential
pattern mining (Zhong, Li, & Wu, 2012). Sequential pattern mining finds statistically
relevant patterns between datasets provided that they are presented in a
sequence. Lau et al. (2012) suggested using sequential pattern mining to identify
topics, as the order the information appears is crucial in understanding the context
of the keyword. Although this is a useful method of identifying topics from tweets,
it is more relevant to news organisations than for emergency services. This is
because, pattern mining is useful for identifying topics from a set of unknown
tweets, but in natural disaster, the information that is required is often known and
the question is instead, if the tweet contains that information. Therefore this
method was not used in this project.
Parts of speech In addition to the sequence of words in sentences, another area
that has been researched in the disaster related Twitter research is parts of speech.
The part of speech is a useful method to identify which lexical category the
92
particular word is in. Although traditionally this approach considers eight different
lexical categories (noun, pronoun, adjective, verb, adverb, preposition, conjunction,
interjection), Chris and Schneider (2012) introduced new categories that can
identify short forms such as idk (I don’t know) and imho (in my humble opinion) to
gain more understanding about tweet content.
Named entity extraction Identifying the location of disasters is a critical factor for
emergency services (Davis Jr., et al., 2011). As mentioned earlier, extracting this
information from Twitter can be problematic due to concerns with privacy and
users not utilising their GPS (Hale, et al., 2012; Harvey, 2014). This is where named
entity extraction can be useful as named entity contains the name of the location,
person, organisation, time, being able to identify location, person or organisation
from tweets can assist emergency services to identify tweets that are disaster
relevant. Therefore named entity extraction (Klein, et al., 2003; Ritter, et al., 2011;
Tjong Kim Sang & De Meulder, 2003) can be useful for emergency services in
identifying location from tweets. The application of this approach is discussed in
details when it is used in the chapter five.
Classification In its simplest form, tweet classification is meant to identify if a
tweet is relevant or not relevant for emergency services (Banerjee et al., 2012;
Sriram, Fuhry, Demir, Ferhatosmanoglu, & Demirbas, 2010; Vitale, Ferragina, &
Scaiella, 2012). However, as Twitter generates large volumes of data after a natural
disaster, classifying only according to useful and not useful is not enough. For the
purpose of emergency services it also need to be identified if the tweet is asking for
help, providing information about the location or seeking medical advice (Below,
Wirtz, & Guha‐Sapir, 2009). One of the advantageous of using a classification
algorithm is it can predict categories with the help of classifiers.
The general approach to classification usually consists of two step process where
the first step is learning and the second is classification. This process is similar to
qualitative coding, where a coding schema is generated first and then coders
manually read tweets and group them into categories. Classification algorithms
achieve similar results by first learning which categories exist from the data and
Chapter Three: Methodology 93
then assigning these categories automatically in a larger dataset. It is common to
apply various classification algorithms such as rule based classification, support
vector machine (SVM), bag‐of‐words, term frequency ‐ inverse document frequency
(TF‐IDF), Naive Bayes, maximum entropy (MaxEnt), decision tree or random forest
(RF) to automatically categorise Twitter data (Castillo, Mendoza, & Poblete, 2011;
Roy Chowdhury, Imran, Asghar, Amer‐Yahia, & Castillo, 2013). Sakaki, et al., 2010;
Sakaki, Toriumi, & Matsuo, 2011) These approaches have been used to identify an
earthquake as it happened, with SVM being used to group tweets based on their
region and therefore suggest which is the next area that might be affected (Sakaki,
et al., 2010; Sakaki, Toriumi, & Matsuo, 2011). Yin et al. (2012) used the bag‐of‐
words and TF‐IDF method of breaking tweets to tokens and then assigning scores to
the tokens, in order to rank the tweets in disaster times.
However, these techniques are more useful for identifying breaking events or news
topics (Osborne, et.al, 2012; Petrovic, et al., 2013) rather than individual tweets. In
addition, methods such as TF‐IDF is problematic for Twitter as tweets are not long
enough to have an effective IDF score; and since rarely the same word appears
twice in the tweet, there is no difference between document frequency (DF) and
term frequency (TF) (Sriram, et al., 2010). Therefore, even though Yin et al. (2012)
have used TF‐IDF scores to assign weights to tweets, the approach is not universally
accepted (Bontcheva & Rout, 2014).
In addition, Imran et al. (2014) argues that pre training classifiers do not work from
one disaster to another. Therefore the suggestion is to utilise crowdsourcing as a
filtering mechanism. Unfortunately not all emergency services have the means and
ability to utilise crowd source platforms immediately after a disaster strikes. It
might be better to identify if the information that emergency services require can
be identified using simple rule‐based classification that utilises a dictionary lookup
method. Therefore this project attempts to identify if tweets contain information
that emergency services need and if it is possible to create a dictionary that can be
used by other researchers as a starting point.
94
Clustering Clustering by definition groups a set of objects to find whether there is
a relationship between the objects. It is essential to address clustering as clustering
is a popular research method for Twitter. The objective for using clustering is to
identify if there is a relationship between the tweets in order to cluster them into a
category. A number of researchers have used clustering to group messages in their
related category using known algorithms such as k‐means (e.g., Sasongko &
Tjondronegoro, 2010; Silva et al., 2013; Thaiprayoon, et al., 2012). As actionable
information is a top priority for emergency services clustering can extend the
grouped information in their own cluster to create a quick visual representation
(Rangrej, Kulkarni, & Tendulkar, 2011). For example, emergency services may want
to know which area needs more food and water, compared to only identifying the
fact that people are looking for food and water, and clustering that with the name
of a location may suggest that one area is more affected than another.
Clustering analyses partitions the objects in various subsets. It can be clustering of
words, co‐occurred words, URL, geo location, or other entities that are extracted
through natural language processing or classification methods. Clustering methods
usually fall under partitioning, hierarchical, density based or grid based methods.
The k‐means method is one of the most popular partitioning methods used in
clustering tweets (Karandikar, 2010; Silva, et al., 2013). However the problem of k‐
means, is in order to identify the clusters, the number of clusters needs to be pre‐
identified (Lau, et al., 2012, Yin, Lampert, Cameron, Robinson & Power, 2012). Yin
et al. (2012) further argues that since the Twitter dataset is often unpredictable, it
is difficult to use clustering algorithms in Twitter with a priori knowledge of how
many clusters are needed. Karandikar (2010) have used the manual scanning of
topics generated by initial clustering algorithms to suggest how many clusters to
specify, and then used that for further detection. Such approach at the time of
disaster is difficult as in the initial stages there may not be enough variety in the
messages to identify the number of potential clusters.
Other information retrieval approach In addition to the methods already
discussed, there are other approaches of topic detection that uses external
Chapter Three: Methodology 95
metadata from other online resources. The most notable of them is use of wordnet
and Wikipedia (Sriram, et al., 2010). Wordnet is one of the largest English lexical
databases that groups words based on their synonyms (Miller, 1995). It has been
used in numerous information retrieval projects (Shvaiko & Euzenat, 2013; Zhang,
Islam, & Lu, 2012). However, the issue with wordnet is that even though it contains
a large number of paraphrases, synonyms and other lexical features, words in
Twitter often do not follow lexical patterns. Instead identifying topics based on
wikipedia instead of wordnet has been recommended (Hu, Zhang, Lu, Park, & Zhou,
2009; Osborne, et al., 2012). For the purpose of this research, external metadata
from wikipedia was therefore looked at.
3.3.3 Mixed method approach
As it can be seen from the discussions so far, both qualitative and quantitative
methods are useful for Twitter researchers. In some cases, independent
researchers working with Twitter datasets from same event using qualitative and
quantitative method have produced similar outputs, as shown by the examples
below.
For example, Bunce et al. (2012) wanted to identify people’s information
experience during the 2011 Queensland flood following the blog post of Axel Bruns
regarding the emergence of social media networks. Therefore using semistructured
interviews they asked people about their information experience during the
Queensland flood. By taking a deep data approach, they identified four categories
of information experience: monitoring information, community and
communication, affirmation, and awareness.
These findings were similar; although not identical to those reported by Bruns et al.
(2012) in their CCI floods report. The CCI findings were based on a surface data
approach, where they collected and evaluated large datasets by finding the
patterns in the data instead of going through individual tweets. Based on that
96
analysis for the same event they identified the categories of information, media
sharing, help and fundraising, direct experience, reaction and discussion. The
interesting part of both of these approaches is that whilst both focusing on social
media in the same event, they used different methods to uncover similar categories
that were potentially relevant for emergency services.
However, instead of relying only on qualitative or quantitative method, mixed
method has been growing in popularity among Twitter researchers because it
allows researchers to gain a deeper understanding about a situation while being
able to analyse a large of dataset at the same time (Bruns & Liang, 2012). Although
rigorous research may produce similar results through quantitative and qualitative
studies, combining both of these methods allow Twitter researchers to draw from
the strength of both research methods. In such mixed methods studies in Twitter,
an initial study is conducted using qualitative methods to identify which features
potentially makes a tweet relevant for emergency services from a human
perspective before testing them with automated methods. An example of this
approach can be seen from Huang, Thornton & Efthimiadis (2010) where the
researchers started with interpretive analysis to understand conversational tagging
of Twitter and Digg dataset before using statistical analysis to find the difference in
tagging pattern between both of their dataset.
This whole approach of going back and forward between qualitative and
quantitative approach is used in this research and explained in details in the next
section, the research design.
3.4 Research Design
The primary objective of this research is to identify and extract important
information from social network streams during times of disaster. Therefore the
Chapter Three: Methodology 97
research firstly looked at identifying what is important, and then how can it be
automatically identified in social media during a natural disaster.
The research design used a mixed method approach that combined qualitative and
quantitative analysis methods. The qualitative approach included performing
content analysis on tweets by evaluating them manually ‐ at first using a sole coder
and later via a crowd sourcing platform. The quantitative approach included using
an off the shelf software package for a smaller dataset in the first round of analysis
and later developing a bespoke set of tools and analysing a larger dataset to
identify important information. Figure 13 shows the process of this research, where
the steps flows from one stage to another. Findings from a smaller dataset are
tested against a larger dataset and then those modified findings are used to change
the model that is tested on next dataset till the final outcome is reached.
The reason for using two groups of datasets was the diversity that these two groups
possessed. Although the collection process remained almost the same (and is
explained in next section), the Queensland flood dataset, which was collected in
early 2011, contains data from single hashtag during a time when Twitter was not
widely used. Comparatively, the Yolanda dataset, which was collected in late 2013
using multiple hashtags from a different location, was done so in a time where the
usage of Twitter had grown significantly. Therefore analysing these two groups of
datasets can provide valuable insights in the way users communicate in Twitter and
how this communication might have shifted over time, so to identify what is
important for emergency services. In the following sections both the single and
multiple hashtag datasets are discussed, including the reasons why they were
selected and how the data was collected.
98
Figure 13: Research Design Flowchart
3.4.1 Data collection and sample size
Both datasets, the QLDfloods and the Yolanda dataset were collected using Twitter
streaming API. As streaming API only goes forward, this dataset does not include
any tweets that had the hashtags or keywords before it was recorded in the
collection system. This section describes the sample size as well as the collection
procedure.
Collection Tool The QLDfloods dataset was collected using yourTwapperkeeper,
as it was the most popular open source collection tool in 2011. Generally the
criteria for choosing a collection tools involved decisions such as how easy it is to
setup, the cost and resources need to run the tool, and most importantly, what
data it can collect. Based on the available tools at that moment,
yourTwapperkeeper (yTk) was the best solution as it was an open source version
Chapter Three: Methodology 99
with relatively easy setup options and it could capture from streaming API. It was
also already in use by various other researchers such as Yang and Kavanaugh
(2010). Therefore for the collection of the QLDflood dataset yTk was used.
The Yolanda dataset was collected using the collector part of the AIDR tool (Imran,
et al., 2014). Developed at QCRI, the collector tool works in the same way as yTk;
once a user authorises the tool with their Twitter authentication page (details in the
Appendix B), users can include hashtag or keywords and it starts collecting any
tweet that includes that hashtag or keyword.
Collecting data and size of the dataset Using hashtag based sampling, a total of
49,748 tweets were collected using the #qldfloods hashtag from 5th January 2011 to
9th February 2011. The tracking of the flood on Twitter began after the start of the
flood in the north of Queensland in December 2010. When flood hit Brisbane and
the Gold Coast in January 2011, the hashtags were already being tracked, which
ensured the method captured tweets from the early stages of the event.
About 230,000 tweets were collected from Twitter streaming API using related
hashtags and keywords that included; #yolandaph, #hurricane, #haiyan, #typhoon,
#Philippines, #yolanda, as well the keywords without hashtag; yolandaph,
hurricane, haiyan, typhoon, and Philippines. Other related words, disaster, wind
and the nearby areas of Vietnam and Korea that fell in the typhoon path were also
included. After category 5 typhoon Yolanda (also known as Typhoon haiyan) hit the
Philippines at 3am on the 8th November, 2013 (Philippines time), people from
Philippines and the rest of the world began to flock to Twitter. This was one of the
most disastrous typhoons with the strongest wind speed ever recorded in history.
As information gathered during first 24 hours are the most crucial (Queensland
Government, 2012a) QCRI used tweets collected in the first 24 hours for
crowdsourcing purposes, and this research analyses that data. This dataset was
made available to the researcher for use in this PhD research through a personal
connection with Dr. Patrick Meier.
100
From the 230,000 tweets collected, standard classification techniques described by
Imran et al. (2013) and Chowdhury et al. (2013) were used by QCRI to automatically
filter the tweets for relevancy and uniqueness. This reduced the number of tweets
to 26,664. These tweets were then used by Tweetclickers, the crowdsourcing micro
mapping tool for categorisation. The process of categorisation through
crowdsourcing is described in next chapter.
Limitation The primary limitation of this method of collecting data is, as the
keyword and the hashtags were added manually, it is possible to miss hashtags or
keywords that might have used at the beginning of the disaster prior to entering
the hashtags in the tracking system. As mentioned earlier, streaming API does not
allow the capturing of historical data and search API limits the number of data
stored, although it does allow access to older tweets.
Taken together the phases outlined in the research design represent a mixed
methods model that capitalises on the potential of qualitative and quantitative
approaches. Each phase is designed to generate the best possible features from
tweets that can be used by emergency services to identify disaster related
information. The question remains is, how the results of this research can be
evaluated which is discussed in the next section.
3.5 Evaluation of Outputs
Validating a predictive model is necessary to ensure the outcome of the model is
satisfactory (Bollen, Mao, & Zeng, 2011). Since this research analyses a tweet and
suggests if the tweet is likely to be relevant for emergency services, the output of
the algorithm needs to be validated to ensure it produces an accurate result.
Although this research does not intend to create a solution that will automatically
classify an incoming tweet without any human intervention, the algorithm aims to
reduce the number of tweets that emergency services need to evaluate manually.
Chapter Three: Methodology 101
Therefore, the outcome of the algorithm needs to be evaluated to ensure it has a
satisfactory performance. In computer science there are several methods of
evaluating such models and this section discusses various validation methods used
by Twitter researchers to determine which of these methods is applicable for this
research.
3.5.1 Cross validation
One of the most common validation methods used by Twitter researchers to
predicting if a tweet or dataset will answer their research question is the k‐fold
cross validation method. In a k‐fold cross validation, a dataset is divided equally in k
number where one of the subset of data is used for validation and rest (k‐1) used
for training. Verma et al. (2011) used a 10‐fold cross validation to find which
features were better at finding disaster related tweets. Davidov, Tsur and
Rappoport (2010) similarly used a 10‐fold cross validation to identify sentiments.
However, the method of using cross validation is most useful when both the
training and validation set are time independent (Amari, Murata, Muller, Finke, &
Yang, 1997). Since the contents of the tweet in the early stage of a disaster are
likely to be time dependent, cross validation methods may successfully identify
disaster relevant tweets for the same dataset but may not work for new data from
the same event. Therefore cross validation was not used as the validation method.
3.5.2 Outperforming a random baseline
An alternative evaluation method is to test if the outcome outperforms a random
baseline. Although this method is similar to cross validation as it uses portion of the
same dataset, the difference with cross validation is that instead of comparing with
an equally divided portion of the dataset, the approach compares the result with a
random chance (Ramage, Dumais, & Liebling, 2010). The performance of an
102
algorithm against a random baseline has been used in much computer science
research (e.g., Baldi, Brunak, Chauvin, Andersen, & Nielsen, 2000; Pang, Lee, &
Vaithyanathan, 2002; Speriosu, Sudan, Upadhyay, & Baldridge, 2011). Petrovic,
Osborne and Lavrenko (2011) found that when it involved the prediction of
relevance at an individual tweet level, evaluating against random chances often
produces acceptable classification solutions. This method of evaluation was used in
this project, and thus the remainder of this section provides an overview of that
process.
Identifying a random baseline The first step in this process is to identify a random
baseline. In order to that, the probability that a given tweet in question is related to
disaster (and emergency services) is calculated. The formula used to calculate the
basic probability is below (DeGroot, Schervish, Fang, Lu, & Li, 1986).
P (tweet is relevant for emergency services) =
The second step is to identify the probability that a tweet is related to the disaster
and relevant for emergency services given that it includes the feature previously
identified. This is done using a conditional probability formula.
P( tweet is relevant for emergency services | feature) = the probability of a tweet
is relevant to emergency serivces GIVEN the tweet contains that feature.
If the result of the conditional probability is worse than random, it can be
concluded that for that tweet that specific feature does not outperform the
random chance, and is therefore not a good filtering feature.
Combining features However, as the discussions in this chapter and the literature
review suggest, a single feature is unlikely to be able to be the point of difference
that identifies if a tweet is relevant for emergency services. A combination of
multiple features however can potentially identify if a tweet is relevant for
emergency services. In order to do that researchers usually use a ranking algorithm
that calculates a score for each tweet before combining them to find a final score
Chapter Three: Methodology 103
(Huang, et al., 2014; Lau, et al., 2011). If the score is less than the cut off score, it is
then classified as either relevant for emergency services or not relevant. Linear
regression algorithms are usually used in this case and is discussed next.
Linear regression In recent years there has been a growing number of research
that uses Simple Linear Regression (Ginsberg et al., 2008) and Multiple Linear
Regression models to analyse posts in social network websites or search engine
queries to predict crisis related situations such as disease outbreak (Culotta, 2010).
Due to the similarity of information diffusion in crisis related situations both of the
linear regression models stand are suitable to use in this research.
However, Culotta (2010) suggested that when there are multiple determinants of a
measurement outcome, the Multiple Linear Regression model outperforms Simple
Linear Regression. As this research uses multiple independent variables (such as
existence of image, location, keywords), Multiple Linear Regression has been
chosen as the model to calculate the score of the tweets. The formula is:
Where is the total score from a tweet. To are the features that have
been identified in the qualitative method as the marker of relevance, and (
To ) are the coefficients. In the equation is the ‘intercept’ which is the
expected mean value of when all . For the purpose of this thesis,
is 0 as existence of no variables should result in no value for the score.
Identifying regression coefficients From the previous discussions, it can be seen
that the features ( To ) are the features that were identified through the
qualitative approach. In order to determine the coefficients to use ( To
), Taylor (1990) suggests that the most common way is to find the difference
between that feature and a random feature. For example, if randomly there is a
104
10% chance that a tweet is related to the disaster and including one feature
increases the chance to 20%, then the regression coefficient will be 2.
Sample calculation To illustrate how this formula may work to identify a score of
a tweet, a sample scenario can be constructed. If three features were identified as
of importance,
1. If the tweet has none of these features, the score will be equal to 0.
2. If the tweet has only one feature, and the coefficient for that feature is 3,
then .
3. If the tweet has two features where one has coefficient of 3 and one is 1.5,
then
Based on this example, if the cut off score is set to 4, only one of the tweet (no 3 in
the list above) will be classified as relevant for emergency services while other two
will be classified as not relevant.
In conclusion, it is necessary to evaluate methods to ensure they perform the task
accurately. However due to various factors not all methods used for evaluation in
computer science are appropriate for every research. The method of creating a
score to evaluate the output described here is not meant to be the final output, but
the objective is to reduce the number of tweets that require further qualitative
evaluation. This evaluation using multiple linear regression is discussed in further
detail in the discussion chapter.
Chapter Three: Methodology 105
3.6 Summary
To date various methods have been developed and introduced to analyse Twitter
data. The mixed methods research study described in this chapter was chosen as it
uses both qualitative and quantitative methods. Among various data types that can
be gathered, tweet data was chosen for this research, the content of which is then
evaluated through qualitative methods to identify which features makes a tweet
potentially relevant for emergency services. The findings are then used to
automatically identify relevant tweets using quantitative methods. Once the results
are achieved they are evaluated against random baseline to ensure they identify
relevant tweets.
In the next chapter, chapter 4, the findings from the qualitative study are
presented. This is followed by the quantitative study which is described in chapter
5. The evaluation process is discussed in chapter 6.
106
Chapter 4: Manual Analysis
The outcomes presented in this chapter address the central research question of
this thesis about finding relevant information for emergency services from social
media during and after natural disaster. As the question of relevance is qualitative
in nature, this phase uses a qualitative methodology to address this question. Also
termed Phase One, this chapter describes the qualitative methods and processes of
analysis, along with the findings. This phase used an iterative process that involved
manual reading of tweets using a single coder and crowdcoding. This was done in
order to find features of tweets that can identify if a tweet is relevant for
emergency services. Based on the findings this chapter proposed a working
hypothesis to answer the research the question on relevance.
The studies in this chapter were conducted in two parts. The first involved creating
a refined coding schema based on literature. This was followed by manual reading,
explorative categorising, evaluation and criteria development from the #qldfloods
dataset sample. The second part repeated the same process with a sample from a
crowd filtered and crowd categorised dataset, Yolanda (Figure 14). Both of these
datasets were gathered during a natural disaster, but they occurred in different
times and locations. The sampling is addressed in the next section.
Chapter Four: Manual Analysis 107
Figure 14: Research design flowchart – manual analysis (phase one)
At the end of both parts of this phase, a working hypothesis was created for the
quantitative analysis termed Phase Two.
4.1 Sampling for Manual Analysis
This section explains the process of selecting the sample from the dataset. As this is
a qualitative phase, the sample size needed to be reduced from the entire dataset
in order for it to be readable by a human coder. For phase one part one, total of
108
1,320 tweets were evaluated from the #qldfloods dataset. For phase one part two,
293 tweets were evaluated from Yolanda dataset.
4.1.1 Sampling for phase one part one
Total of 1320 tweets from #qldfloods dataset were selected for the part one
analysis. The size of the initial sample gathered for #qldfloods was 49,748 tweets.
Since this is a large amount for manual reading, it was reduced to the smaller size.
Using the stratified sampling method suggested by Bakshy et al. (2011), the
approach utilised was to identify the time that most tweets were captured. This is
because the high number of tweeting activity may represent a potential breaking
event or an important change in the situation.
The first step was to filter out tweets that used the word “RT”. This is because
retweets that were captured in the dataset were essentially duplicates of what was
already in the dataset. This step brought down the number to 17,983. As this is also
a large number, the next step was find out which days had the most number of
tweets. In order to do that, the data was put into a pivot table and sorted based on
the count of tweet per day. As it can be seen from Figure 15 the day with the
highest level of tweeting was the 12th of January 2011. A total of 4,054 tweets were
archived using the #qldfloods hashtag on those two days.
A second round of filtering was performed to select tweets from the hours that had
the highest number of tweets. The six hours from 9 a.m. to 2 p.m. were selected as
they had the most number of tweets on the 12th of January 2011, as well as showing
an upward trend (Figure 16).
Chapter Four: Manual Analysis 109
Figure 15: Count of tweet per day based on #qldfloods dataset excluding RT.
Based on that, total number of tweets selected for manual analysis were 1,373
tweets. From that list, 52 tweets were removed as they were duplicates (even
though did not have RT) and therefore the total number of tweets evaluated was
1320. Phase one part one uses this sample for the coding and evaluation.
Figure 16: Tweets per hour on 12th January 2011
110
4.1.2 Sampling for phase one part two
Similarly to part one, as the 52,548 tweets from Yolanda dataset was too large for
manual evaluation it was narrowed down to 382 tweets. This section describes that
selection process and the differences to that used in part one.
Crowdcoding after natural disaster Although assigning multiple coder on the
same dataset is an well established practice (Pipek, Palen, & Landgren, 2012;
Starbird & Palen, 2012; Verma et al., 2011), utilising crowds to filter incoming
tweets is gaining wider acceptance (Liu, 2014). For a number of years the research
group at QCRI has been engaging crowds to evaluate social data (Meier, 2012).
When a disaster happens researchers would capture the data from Twitter based
on keywords and hashtags and then open that data to Internet users through
system called MicroMappers. This is a part of their larger system known as AIDR
(Artificial intelligence for disaster response) (Imran, Castillo, Lucas, Meier, &
Vieweg, 2014). The system at first gathers tweets and other based on related
keywords and hashtags and then filters them using various methods. Once the
preliminary filter is done, QCRI team use crowdsourcing to identify which of these
tweets are potentially relevant for emergency services.
MicroMapping for disaster response MicroMapping works similarly to the manual
coding process where a few people read the content and categorise tweets into
their respective group based on pre‐defined categories. The difference is, instead of
being coded by few people, the same content can be coded by hundreds of people.
Similarly to a manual coding approach, at the beginning each MicroMapper is given
a one line description of the category meanings (Figure 17). Once they are familiar
with the codes, they can press next to start evaluating the tweets. Each
MicroMapper is then presented with a single tweet on the screen that they can
categorise in any of the categories selected. However, to ensure inter‐coder
reliability each tweet is evaluated by more than one coder. Since the tweet
selection is random, some tweets are evaluated more than others. MicroMappers
Who then are these MicroMappers? Any person from around the world can go to
Chapter Four: Manual Analysis 111
the MicroMapping website to help classify tweets into categories. Participating in
the site is voluntary and does not require the users to register, nor have any prior
experience in digital volunteerism. According to micromappers.org “No need to
register, and no prior experience or training required” and the objective is to “Click
Your Mouse to support humanitarian efforts across the world” (Meier, Lucas, &
Mack, 2013).
However according to Collins (2013), about 60% of these digital volunteers are
academics, students, translators or journalists who already work in tech or
humanitarian fields. When they know about the disaster, often through social
media, they go to the website to offer help (Gilbert‐Knight, 2013). Overall,
MicroMappers are people who are experienced in digital disaster response even
though they may not have formal disaster response training similar to emergency
service managers.
Figure 17: Tutorial at the start of MicroMapping explaining the categories
MicroMapping process For the Yolanda dataset, each MicroMapper was given
1500 tweets to evaluate (Figure 18). However not everyone who participated
evaluated all 1500 tweets. Therefore, even though a total of 90,000 clicks were
generated through MicroMappers, not all the 26,664 tweets were equally
evaluated. The evaluation resulted in 237,779 rows of data labelled with additional
112
information such as taskID, category of the tweet selected by a MicroMapper in
that task, and taskCompletionTime that suggests when the MicroMapping task was
completed.
It is worth noting that, when a MicroMapper evaluates a particular tweet, the
MicroMapper does not have any other information about the tweet (such as the
user) except the fact that the tweet was composed recently. Therefore, it is likely
that the information the MicroMapper has used to identify importance of that
particular tweet is solely based on the text (and other symbols such as # or @).
Figure 18: A sample tweet being evaluated via MicroMappers
Re‐categorisation of the tweets For the purpose of analysing the Yolanda tweet
dataset, among the six categories (Figure 18) three were regarded as relevant for
emergency services. They are Infrastructure Damage, Request for Help and
Population Displacement. Three others, Not relevant / Skip / RT, Not English and
Relevant but Other were regarded as irrelevant for emergency services to identify
Chapter Four: Manual Analysis 113
disaster related tweets. Although in some cases the tweets that is classified as Not
English may contain useful information, MicroMappers may not understand the
language and therefore such tweets were classified as not relevant.
Agreement percentage calculation Inter‐rater agreement is a commonly used
approach in statistics to identify homogeneity among evaluators (Byrt, Bishop, &
Carlin, 1993). Even though inter‐rater agreement is generally used in small samples,
such as Cohen's kappa, for two raters, and Fleiss' kappa for any fixed number of
raters, Nowak and Rüger (2010) have extended this for crowdsourced tasks. Similar
to Cohen's kappa, Nowak and Rüger (2010) found that more than 60% agreement
between inter‐raters is good and more than 80% agreement gets the best result.
Since a large number of coders have already marked these tweets as potentially
relevant or irrelevant for emergency services, the objective was to find out which
tweets all the MicroMappers agreed were relevant for emergency services and
which are not, so that the difference between relevant and irrelevant tweets can be
established.
Percentage agreement The single most striking observation to emerge from the
data comparison was that MicroMappers agreed with one another when a tweet
was not relevant for emergency services. As can be seen from Figure 19, most
evaluators agreed on tweets that were not relevant for emergency services or were
retweets.
114
Figure 19: Agreement among MicroMappers whether the tweet belongs to a category
However, there was disagreement between evaluators when they were presented
with a tweet that was somewhat useful. As it can be seen in Figure 19, tweets that
belong to the relevant for emergency services categories, such as a Request for
help, Infrastructure damage and Population displacement, did not achieve
consistent agreement like the tweets in other non relevant categories. For example,
the tweet “Bildt: Around ten Swedes missing in Philippines http://t.co/hDyLj45WJ2”
was evaluated by 13 evaluators and was marked by six evaluators under Request for
Help / Needs and five evaluators under Population Displacement, one under
Relevant but Other and one under Not Relevant / Skip / RTs. Compared to that, this
tweet “@ayeemacaraig daliii Kindly pls check my town #CarigaraPh no news from
our relatives, no communication since #YolandaPH” was evaluated by 15 evaluators
and 14 evaluators marked it under Request for Help and had an agreement score of
93.3%.
Selecting sample size Since only a limited number of tweets can be evaluated
through manual close reading, tweets that had high number of agreement between
Chapter Four: Manual Analysis 115
evaluators were selected for analysis this part of the phase. Agreement scores of
80% and was chosen as the cut off point, as researchers have previously identified
this score to produce the highest inter‐coder reliability (Nowak & Rüger, 2010) .
Figure 20: Number of tweets with more than 80% agreement between MicroMappers
Two types of tweets are selected for manual analysis. One type was the tweets that
were coded as relevant for emergency services and the other the tweets that were
not relevant for emergency services. Of the categories represented (Figure 20)
amongst tweets which received 80% or more intercoder agreement, the vast
majority were rated as Not relevant / Skip / RT. The top 200 tweets from Not
relevant category were selected to find out more about why they are regarded as
irrelevant to emergency services by MicroMappers. Tweets that belonged to Not
English and Relevant but Other were also excluded as they fall under irrelevant
categories. This leaves 182 tweets, distributed across the categories Infrastructure
Damage, Population Displacement, and Request for Help that are likely to contain
tweets that are relevant for emergency services. Based on the 80% agreement,
116
there were 182 tweets available and these were selected for further manual
evaluation in this project.
In conclusion, for the manual analysis phase, the sample size of the two datasets
was reduced to a number suitable for close reading. For the #qldfloods dataset the
sample size for qualitative phase was 1320 tweets collected using #qldfloods
hashtag during six hours, from 9 a.m. to 2 p.m. on 12th of January 2011. For
Yolanda dataset, the first part of the selection involved finding the percentage of
agreement between MicroMappers. 182 tweets from three categories that are
relevant for emergency services – Request for Help, Infrastructure Damage and
Population Displacement had more than 80% agreement and therefore were
selected for this phase. In addition to that, 200 tweets from Not Relevant categories
were also selected for evaluation to investigate the common features that can be
found from irrelevant tweets. After collecting the samples they were evaluated
using coding and ranking, which is explained in the next section.
4.2 Coding and Ranking
In this first part of this phase, the objective was to gain deeper understanding about
the contents of the tweets from both of the datasets to identify if they contained
information that is potentially important for emergency services.
As mentioned in the Methodology chapter, usually the first step of content analysis
is to create a coding manual and then use that manual to analyse the content.
Additionally, for time sensitive contents such as disaster relevant tweets,
researchers have also used ranking to create a point of differentiation (Huston,
Weiss, & Benyoucef, 2011; Verma, et al., 2011; Vieweg, 2012). The following sub
sections describe how both coding and ranking were developed in this research.
Chapter Four: Manual Analysis 117
4.2.1 Coding categories and theme
The creation of a coding category is dependent on the research question (Saldana,
2012). Therefore creating appropriate coding categories play an important role in
analysing contents and answering the research questions.
Since the purpose of this research is to identify information that may be relevant for
emergency services, the coding categories were created based on the need of
emergency services discussed in the earlier discussion on hazards, emergencies and
disasters. In terms of method of coding categories, a descriptive coding method was
used as it identifies topic from the content instead of summarising the text (Tesch,
1990; Wolcott, 1994). Although this method was developed to study longer form of
text, in the context of evaluating tweets, it was deemed as most appropriate as it
identifies the topic from the tweet. Based on the literature, the coding categories
included three major themes: Request, Report and Reaction. These were broken
into further coding categories as listed in Table 7.
Coding Categories
Sub categories Description
Request for material support
• Request for food and water (RF) • Request for shelter (RS)
One of the first things people need after a disaster is food, water and shelter (Todd & Todd, 2011, p.4).
Request for medical assistance
• Requesting medical assistance (RM)
Sometimes some people are injured and some may seek medical assistance (Noreña, Yamín, Akhavan‐Tabatabaei, & Ospina, 2011)
Request for information
• Request for information about person (RP)
• Request for information about an area (RA)
• Request for other information (RI)
People want to know about their family members (Si, Wang, Hu, & Zhou, 2011). People who are not in the area often look for information about that as well.
Request for other types of help
• Request for help (RH) Various other forms of request such as request for help can be seen as well
Report of damage
• Reporting about public property damage (DP)
• Reporting about private
To assess the damage of the area (Goyet & Morinière, 2006)
118
property damage such as their own house (DH)
• Reporting environmental damage (DE)
• Reporting change in situation (DC)
• Reporting injuries and deaths (DI)
Reporting community behaviour
• Reporting about community mood, behaviour or situation (CB)
• Reporting crime that happened after the disaster (CC)
False information, criminal activity and various other issues dampen community mood after a disaster resulting in action that may cause more harm. Tweets related to this can be useful for intelligence gathering
Reaction from community
• Reaction from community
regarding emergency service efforts (RE)
• Reaction or response from community, community efforts, advice (RC)
To assess the community mood in order to gauge if a community might be doing something that is not intended (e.g., going to a shelter centre using a road that is prone to flash flooding) (Harrald, 2006). Knowledge of crime is necessary for mobilisation of resources. Identifying the first responders can help emergency services to engage people who have been doing the hard work at the beginning and not alienate them (Telford, Cosgrave, & Houghton, 2006 ).
Other
• Spam or marketing message (OM)
• Spiritual messages (OS) • Greetings and thanks (OG) • Narratives that may not be
directly useful for emergency services (ON)
• News and reports (OR)
A lot of messages in social media are not related to the needs of emergency services in the context of a disaster even though they might be welcomed in other instances. Spiritual messages and greetings are commonly seen but not useful for emergency services purposes. Similarly, news and reports are not very useful for emergency services
Table 7: Coding categories based on the need of emergency services
T the type of contents falls under each of the coding sub categories are described
next.
Chapter Four: Manual Analysis 119
RF ‐ Request for food and water Where people ask for food and water. After a
major disaster it is common for people to run out of food and water.
RS ‐ Request for shelter Where people inform about loss of places to live, or ask if
anyone has a place for them as their house is currently disaster struck and
unliveable.
RM ‐ Requesting medical assistance Where people seek for medical assistance as
they or someone they know are injured. As this requires different emergency
services to respond (e.g., ambulance), this is categorised under different category.
RP ‐ Request for information about person One of the first things many people do
after a disaster is to look for their family members. In many cases these are relevant
tweets for emergency services to assist in looking for people who might still be
missing in an area.
RA ‐ Request for Information about an area Tweets that ask about the conditions
in a particular area. While these tweets are not the highest in priority for emergency
services, they can be used to get update about the latest changes in a situation that
may not have been reported before.
RH ‐ Request for help Sometimes people can call for help in situations that are not
life threatening. For example, someone calling for help to give them a hand in
moving something. If a lot of people are asking for similar help it might be relevant
for emergency services to look into it in order to find patterns.
DP ‐ Reporting about public property damage Information about damage to public
property is one of the most crucial for emergency services because people may be
trapped in public buildings.
DH ‐ Reporting about private property damage By collecting information from
people updating about damage to their private property emergency services can
identify the seriousness of a situation in a given area.
120
DE ‐ Reporting environmental damage Report about environmental damage
contains information about surroundings such as trees falling and blocking roads,
water tanks or electric poles getting damaged, and road flooding. These can inform
how devastating the disaster was.
DC ‐ Reporting change in situation Tweets reporting such as mention of a sudden
flash flood or a tornado has just occurred.
DI ‐ Reporting injuries and deaths Tweets that report about death can be used to
identify the loss of lives in an area. Report about injury can indicate potential
medical emergencies.
CB ‐ Reporting about community news, mood, behaviour Sometimes it is
necessary to know about community mood or behaviour in order to mobilise
appropriate resources.
CC ‐ Reporting crime that happened after the disaster Knowledge of criminal
activity in an area can be useful for the safety of the emergency workers.
RC ‐ Reporting community efforts and advice Reporting about community efforts
that can range from clean‐up volunteers, food providers, to wifi and electricity
providers
RE ‐ Reaction from community regarding emergency service efforts Getting
feedback quickly is essential for emergency serves as it can help them to identify if
their efforts are in the correct place.
OM ‐ Spam or marketing message Messages that uses the hashtag or keywords
but has no relationship with the event
ON ‐ Narratives that are not directly useful for emergency services It is common to
see a lot of personal narratives during natural disasters.
OS ‐ Spiritual messages Messages that are spiritual in nature, such as asking
people to pray for victims.
Chapter Four: Manual Analysis 121
OG ‐ Greetings and thanks Tweets that come from well‐wishers wishing disaster
victims.
OR ‐ News and reports Many people tweet links from news reports in social
media. Although they are useful for the general public awareness of the situation,
news reporters often learn about the incident from emergency services. Therefore
they are often not rekevant for emergency services.
4.2.2 Ranking of information
Not all areas get equally affected in a natural disaster. Sometimes some areas can
have repeated waves of disaster or sometimes the situation may suddenly get
worse. Therefore knowing the current situation is a top priority for emergency
services. Even though the coding schema identified in Table 7 can be used to
identify if the tweet contains information that may be needed by emergency
services, it only identifies if the tweet contains information without creating an
order of priority.
Identifying urgency and specificity from tweets Therefore, in addition to
identifying the topics, to identify the level of importance it is common to add a
magnitude coding to the coding category (Saldana, 2012). Generally in natural
disaster situations, such prioritised information is gathered by designated
emergency services personnel and then channelled to central information control
who determines the severity of the information (Iakovou & Douligeris, 2001). For
the purpose of this research, the magnitude can be determined based on the
urgency and specificity of the tweet. A tweet mentioning “water coming to the
house at Kelvin Grove right now” is more relevant for emergency services than
“water is rising” – which is neither urgent nor precise. Thus the magnitude coding is
ranked (Table 8) based on their urgency or specificity. If the tweet contains both
urgent and specific information, it is ranked higher compared to another tweet that
may contain either or have neither.
122
Criteria Value Description
Rank 4 Definitely urgent and/or specific
3 Moderately urgent and/or specific
2 Somewhat urgent and/or specific
1 Neither urgent nor specific
0 Spam, unclear relationship with disaster
Table 8: Ranking of tweets
Coding for other content features The patterns identified in the manual analysis
phase were used as the basis for designing an automated evaluation algorithm in
the automated analysis phase. Therefore, the components that make a tweet
potentially urgent or specific needed to be broken into specific features. These
components can consist of the text, metadata or metadata extracted from the text.
Among the data and metadata that can be extracted from tweets, text and
especially keywords, have been the dominant component researchers use when
analysing Twitter as well as other web based platforms (Brin & Page, 1998; Burgess
& Bruns, 2012; Kim et al., 2013; Robinson, Power, & Cameron, 2013; Williams,
Terras, & Warwick, 2013). In terms of natural disasters, other metadata such as
images (Aggarwal, 2011; Gupta, Lamba, Kumaraguru, & Joshi, 2013), location and
named entity (Finin et al., 2010; Li et al., 2012; Liu, Wei, Zhang, & Zhou, 2013), and
users (Kumar, Morstatter, Zafarani, & Liu, 2013; Pennacchiotti & Popescu, 2011).
Since both location names and image URLs can be identified from the text itself
during a manual reading, they were selected as features to extract.
For the purpose of this part of the phase three specific features – keywords, image
URL and location names were selected to evaluate. The method applied was to read
the tweets and give it a ranking number (between zero and four), identify which
coding category it belongs to and if it contains an image, location names and
keywords. How this was applied to the dataset is described in the next section.
Chapter Four: Manual Analysis 123
4.3 Part One: #qldfloods dataset
The following sections discuss the findings from the #qldfloods dataset after
applying coding categories and ranking (as detailed in Tables 7, 8 and 9) shows an
example of the process of how each tweet was read and given a rank and code.
Tweet Rating Code Keyword Location Name
Image Comment
Riverside walkway flooded and rising looking towards Friday. Where I'm standing will be under soon http://twitpic.com/3p9ax8 #qldfloods
4 DC Flooded, rising, soon, standing
Yes, Specific
Uses urgent words such as “soon”, “rising” along with location. Picture shows moving water
Cnr Coro Drv and Hale St. Go‐Between bridge on ramp #aquapocolypse #qldfloods http://twitpic.com/3p9jmq
3 DE none
Yes, Specific
Picture shows the area being flooded although there are no keywords except names of places.
http://twitpic.com/3p8iqz Have just seen first hand the aftermath at Toowoomba. Hard to believe the sheer force of flash flood #qldfloods
2 DH
Seen, aftermath, flash, force
Yes, Specific
While it shows the damage done by the flash flood, the flood is not there now
Amazing image from NASA of the flooding in Rockhampton: http://bit.ly/hSddi0 #QLDfloods #fb
1 ON Flooding, image
Yes, General
Although a satellite view shows the status, it is not a matter of priority
Get your tickets to @ladisputeband @danmanganmusic @sparkadia or whoever else you wanna see TODAY on @OzTix!! www.oztix.com.au #QLDFloods
0 OM none
no none Not related at all
Table 9: Ranking and other metadata analysis of the tweets
As it can be seen from Table 9, when the tweet was showing urgency and providing
temporal information, such as soon or rising, it was given a rank of four. Compared
124
to that, despite the tweet about #aquapocolypse including a photo regarding
damage, the urgency could not be determined and therefore the rank was lower.
Similarly, tweets with NASA had a lower rank due to a lower level of urgency. It is
necessary to note that, although all the tweets included in the Table 12 had location
names, it was not the case for all tweets.
Both coding and ranking of the #qldfloods dataset was done by the researcher. As
discussed earlier, even though coding is generally done in a team to reduce the
coder‐specific error and to improve reliability, when the objective is to gain an
understanding of the whole dataset in order to perform future experiments, sole
coders are also employed (Burant, Gray, Ndaw, McKinney‐Keys, & Allen, 2007;
Strauss, 1987). In such situation where solo coding takes place, Saldana (2012)
suggests the sole coder consult a mentor or supervisor or even a colleague during
the analyses process as a way of validating the findings. Therefore the results were
analysed periodically by the thesis supervisors. At the end of this part of the phase,
a number of criteria were identified that fulfil the requirements of emergency
services and could be considered as important.
In conclusion, the key focus of understanding the disaster relevance of a tweet is to
find the value of the tweet for emergency services. Even if the tweet had the word
“soon”, and it suggests urgency, it might already be well known and therefore not
have a strong value for emergency services. On the other hand, having a photo or a
location that is not known but that has recently been damaged is extremely
valuable for emergency services. Since such understandings are qualitative in
nature, the objective of this phase was to identify any specific features that might
be extracted automatically through quantitative methods. The next section presents
the outcome of the manual analysis for the #qldfloods dataset to identify which
features can be used in the design of an automated algorithm for detecting
potentially disaster relevant tweets (described in the following chapter).
Chapter Four: Manual Analysis 125
4.3.1 Distribution of coding categories
The first set of analysis examined if the tweets contained more noise than relevant
tweets. That is, they were tweets that are not related to the disaster, thus making
them irrelevant for emergency services. Based on their ranks in Figure 21, it can be
seen that the largest number of the tweets (1062 tweets) were ranked at number
one, the lowest rank of importance. This is similar to the findings of other twitter
researchers (Imran, Elbassuoni, Castillo, Diaz, & Meier, 2013a; Thaiprayoon,
Kongthon, Palingoon, & Haruechaiyasak, 2012; Tonkin, Pfeiffer, & Tourte, 2012)
who found that the bulk of tweets after a natural disaster, and in other catastrophic
situations, contain mostly narratives that are not very useful for emergency services
purposes.
Figure 21: Total tweets based on their ranks from sample tweets
Distribution of coding categories based on rank Figure 22 displays the distribution
of coding categories and sub categories in their respective ranks. As detailed earlier
in Table 7, three themes, Request, Report and Reaction were identified as relevant
126
for emergency services from synthesising the literature. The objective of this
analysis was to find how often these codes appear in each ranked groups.
Based on the Figure 22, it can be seen that in the tweets from the #qldfloods
dataset that were selected for evaluation, reports of damage were significantly
higher than other relevant categories. In that category, the largest was reports
about environmental damage where people tweeted about their surroundings. This
was followed by Change in Situation where people reported about rising water.
There were minimal tweets related to Request for Material Support such as food,
water, shelter and among the requests one of the prominent was asking for shelter
for animals: “URGENT PLz REPOST Fairfield RSPCA is going under water anyone who
can take in any animals please call (07) 3426 9999 #qldfloods #lime”. This supports
the need to include tweets related to animals as relevant for emergency services as
identified by Heath, Kass, Beck, and Glickman, (2001) with regards to people not
wanting to evacuate while leaving their pets behind.
Reports about the community and their reaction towards the effort of emergency
services was identified as relevant for emergency services in the coding categories
listed in Table 7. Based on the findings presented in Figure 22 it can be seen that it
was not a significant component in the highest importance ranks. While some of the
tweets such as “power cut off in Highgate Hill. when will it be fixed? no idea.
#qldfloods”; is somewhat useful indication of people’s mood in an area, “I feel so
helpless. #qldfloods stay strong Queensland!” does not have actionable information
for emergency services. Based on the distribution of the coding categories it can be
suggested that finding Report of Damage tweets should be a priority in the
automated analysis as tweets from Report of Damage were most prominent in the
highest ranked tweets.
Chapter Four: Manual Analysis 127
Figure 22: Distribution of tweets in their coding categories and sub categories by rank (#qldfloods)
4.3.2 Occurrence of specific information
As mentioned earlier, specificity and urgency (Table 8) were the driving force
behind the ranking. In order to assess the frequency of specific information
occurrence, the name of location and images were noted while evaluating tweets.
The most common finding was that tweets with highest ranking had either a name
of a place or a picture or both. As it can be seen from Figure 23, tweets that were
128
ranked three and four had a high percentage of image and place names. Of those
ranked four, 95% of the tweets had either location names or images compared to
rank one and two where only less than 30% of the tweets had either of the location
or image. This is a significant finding as it suggests that if a tweet contains a
location name or an image it is likely to be a tweet relevant for emergency
services.
Figure 23: Percentage of location names and Image in the tweets based on ranks (#qldfloods)
Furthermore, another interesting observation from this dataset is that some Twitter
users tried to combine the hashtag mechanism of Twitter with the name of places
to increase prominence as well as make the tweet clickable. For example:
#Caboolture residents hardest hit by #QldFloods are now counting the cost
http://bit.ly/fpc5Q5 @QuestNewspapers
#Adelaide let's come together and help the people of #qldfloods. There's a
'Shoe Boxes of Love' Flood Appeal set... http://fb.me/OWxpSwyR
Although these tweets were not relevant for emergency services, they certainly
serve as a marker to identify name of a place. This use of place names with hashtags
was a novel attempt to highlight a location in 2011 even though it might have
Chapter Four: Manual Analysis 129
become common knowledge in 2015. Even though there were only five such
instances where people used a hashtag in front of the location name, it was an
interesting attempt to highlight a name of a place. In terms of image, a lot of the
images were hosted on third party websites such as twitpic or yfrog. This is likely to
have changed as Twitter has introduced its own feature for embedded images, but
the presence of images remains an important marker to consider.
Specific information by code It is perhaps not surprising to see that Report of
Damage had the highest number of images while both damage reports and Request
for Information had a high number of location names (Figure 24). Most tweets that
enquired about information wanted to know if a specific place was still unaffected
by the flood or if a road was still functioning.
Figure 24: Percentage of named entity and image in the tweets based on codes (#qldfloods)
However relevant information do not always contain photo. For example, when
people tweeted about crime, often they did not take a photo. An example can be
seen in this tweet: , “@FamePR SOMEONE LOOTING CATTLE IN IPSWICH AREA!!
#qldfloods” is a relevant tweet for emergency services even though it did not have a
130
photo posted to prove the crime. The mention of the criminal activity is often
sufficient to alert emergency services.
4.3.3 Keywords
Words are an integral part of Twitter (Jansen, Zhang, Sobel, & Chowdury, 2009).
Although word sense disambiguation (WSD) is a known problem for any automated
analysis of documents (Banerjee & Pedersen, 2002), especially tweets (Bakshy, et
al., 2011), in the manual phase the attempt was to distinguish between keywords
that are likely to be an indicator that a tweet is relevant to emergency services, and
those that may also occur frequently in other contexts.
Coding Categories Notable Keywords
Request for material support (RF, RS)
Seeking, help, flood, animals, roof
Request for medical assistance (RM)
None as no tweets were in this category
Request for information (RP, RA, RI)
Anyone, contact, current, have, know, my, mum, old, power, safe, situation
Request for other types of help (RH)
Animal, anyone, can, dog, evacuate, looking, offer, organise
Report of damage (DP, DH, DE, DC, DI)
50 cm, across, another, area, at, basement, been, braces, bridge, brim, closed, closes, Coming, corner, crocodile, debris, destroyed, direction, door, down, ferry, filling, flash, flat, floating, flood, floodbound, flooded, flooding, flow, from, full, getting, gone, good, height, high, higher, hour, house, indistinguishable, lake, large, later, line, low, massive, meant, midday, near, nearly, next, no , now, on, our, out , peak, quickly, raw, rising, river, riverside, roads, rise, scene, second, serene, sewage, someone, soon, spewing, still, street, surging, swallowed, terminal, tide, time, towers, under, underwater, water, waterfront, were, worst
Reporting community behaviour (CB, CC)
Creeping, donate, evacuating, fever, flood, grim, helpless, homes, information, located, looting, lost, morgues, near, polluted, power, river, safe, sandbag, shot, submerged, temporary, washes, water, wrong
Reaction from community (RE, RC)
Amazing, anyone, asking, avoid, back, call, charger, check, donate, donated, extraordinary, floodwater, follow, great, help, list, needs, offer, out, pack, people, phenomenal, photo, picture, please, proud, really, safe, session, suffering, superb, together, try, volunteer, when
Others (OM, OS, OG, ON, OR)
According, amazing, business, buy, comparisons, ideological, God, lord, love, mercy, miracle, pray, prayer, price, purchase, sexy, striking
Chapter Four: Manual Analysis 131
Table 10: Common keywords in #qldfloods dataset based on their coding categories
Contrary to the previous two sections, the distribution of keywords was not the key
focus of this section, which was instead to build a dictionary of keywords that can
be used in automated analysis in next Chapter.
Many of the high ranking tweets had keywords that were active verbs such as
“rising”, “flooding”, “creeping”, “floating”. This finding of action words is similar to
the findings of Vieweg et al. (2008). Some tweets also mentioned current situations
such as the word “now”, “near” as well as “quickly” to indicate the urgency level.
Many of the tweets used words such as “basement” and “under” to suggest the
status of the flood. In addition, there were also mentions of family member related
words. For example “Can anyone on #BribieIsland pls confirm conditions? Cannot
ctc my 96 year old mum at Bongaree. Pls DM me #qldfloods”. Therefore words
related to family members were included in the list of keywords to consider.
However, just the existence of the words did not necessarily make the tweet
relevant for emergency services, which reinforces the WSD problem. For example,
these two tweets:
“Fucking floods! I'm donating to the qld flood appeal. Mother nature's a bitch.
Stay safe everyone #qldfloods”
“The river has broken at Yeronga according to ABC! #Qldfloods”
Both had disaster related keywords such as “floods”, “mother” as well as action
words such as the “river breaking its banks” at a particular place. However, one of
the tweets was used to vent anger while another was a statement based on a
report by ABC news. Therefore, having a potentially highly relevant word alone is
not an indicator of the high importance of a tweet. At this stage of the research
process, this selection is entirely qualitative and manual of course. This list of
keywords are used in the automated analysis in following chapter.
132
4.3.4 Part‐of‐Speech
Part of speech has been used by various researchers to analyse crisis related twitter
datasets (Corvey, Vieweg, Rood, & Palmer, 2010; Imran, Elbassuoni, Castillo, Diaz, &
Meier, 2013b; Panem, Gupta, & Varma, 2014; Verma, et al., 2011). However each
research project have focused on various parts of speech. Some have focused on
verbs, while others looked at personal pronouns, adverbs, and determiners. In this
research, tweets from both datasets were analysed to see the distribution of the
part of speech in order to determine if a certain part of speech stands out in this
dataset.
In addition to analysing various grammar based parts of speech, Twitter specific
symbols such as @, # and RT were also analysed as they have been identified as
potentially relevant markers for tweet identification by the Carnegie Mellon Ark‐
Tweet‐NLP group (Owoputi et al., 2012). It should be noted that Ark‐Tweet‐NLP
extends the Penn Treebank structure (Marcus, Marcinkiewicz, & Santorini, 1993)
with a Twitter specific add‐on.
Figure 25: Distribution of parts of speech in their ranks from #qldfloods tweets
Chapter Four: Manual Analysis 133
As it can be seen from Figure 25, nouns were equally common across all the ranks.
Whether it was the relevant or irrelevant tweets, about 30% of the words were
nouns. Similarly, the percentage of verbs was also similar across the ranks.
When this is analysed based on their coding categories, similar patterns can be
observed. Relevant categories, Request, Report and Reaction had more adjectives
and adverbs than the Other category. In terms of verbs, relevant categories had
verbs with present and past participles such as “rising”, “spewing”, “surging”,
“creeping” which are considered relevant for emergency services. The distribution
from Figure 26 shows that none of the parts of speech were dominant.
Figure 26: Distribution of parts of speech in #qldfloods tweets
These figures suggests that part of speech may not be an marker of relevance as it is
difficult to identify a relevant tweet for emergency services based on their part of
speech. Therefore it was not tested in the quantitative phase.
134
4.3.5 Summary of findings
This section summarises the findings from #qldfloods manual evaluation. There
were a few novel findings from the #qldfloods dataset and some findings echoed
similar results from other researchers.
1. High percentage of damage reports The largest section of relevant tweets
were related to damage reports. Among the damaged reports,
environmental damage was the most reported damage. This could be due to
the nature of the event or the evaluated dataset. Therefore this finding is
compared in the next section with Yolanda dataset to find out if this can be
used as a marker of disaster relevant features in tweets.
2. Image and name of place More than 50% of the higher ranked tweets
(three or four) had either name of a place or an image. Similarly, more than
50% of the tweets that were grouped under report of damage, request for
material support or request for information also had a name of place or
image in them. Based on the initial findings, it can be hypothesised that if a
tweet has a name of place or image it is likely to be a relevant tweet for
emergency services.
3. Patterns in the keywords Although keywords can carry completely
different meanings based on the context in which they are used, when
keywords were grouped based on their coding category, certain patterns
emerged. One pattern is specific to the words and the other is related to the
part of speech.
When people were asking for information or requesting help, they tend to mention
family members, their house or work place. When people mentioned a change in a
situation, they used continuous tense more often than in other types of damage
reports. When people tweeted damage reports, they often mentioned the distance
of the water from a location, or the status of their house. When tweets contained
Chapter Four: Manual Analysis 135
spiritual words or greetings, they were often not useful for action by emergency
services.
Preliminary rule set Based on these findings, a preliminary rule set to identify
relevant tweets was developed. The common findings were that if tweets had
pictures, or name of places, they were more relevant for emergency services. At the
same time tweets that contained temporal information and words related to
persons were also were considered more relevant. Furthermore, tweets that
contained keywords that are closely related to the disaster such as “water”, or the
status of the water level were ranked high as well. Therefore based on this
observation, the following rule set was identified for testing in the quantitative
phase:
If tweet CONTAINS (Name of Place OR Image) -> relevant for emergency services
In order of relevance, Image > Name of place > keywords
If tweet contains Desirable keyword > relevant for emergency services
If tweet contains Undesirable keyword > irrelevant for emergency services
4.4 Phase One Part Two: Yolanda dataset
Although the Yolanda dataset was already categorised into six respective
categories, to compare if the patterns in Yolanda tweets with #qldfloods tweets,
they needed to match same category of #qldfloods. Therefore the selected sample
tweets were re‐evaluated and coded using the same coding categories used in
#qldfloods to identify what type of codes. This section explains the findings of this
process.
136
4.4.1 Distribution of coding categories
A similar manual process of reading tweets and grouping them in their coding
categories and then identifying if the selected tweet samples contained location
name, image, keyword and any other potential marker was performed at this part
of the phase. Following is a description of the findings.
Coded tweets based on percentage agreed Of the analysed tweets, the
distribution of codes in the Yolanda dataset were different than the #qldfloods
dataset (Figure 27). Report of Damage was the dominant category in the #qldfloods
dataset in high ranked tweets but in the Yolanda dataset it was present almost
equally across all the ranks. The fact that the sample from the Yolanda dataset was
already marked as relevant for emergency services was one of the major
contributing factor for having reports of damage across all ranks.
In addition, the reason presence of other disaster relevant categories such as
Request for Material Support and Medical Support in the high ranked Yolanda
dataset, which was not present in the #qldfloods dataset. This distribution can be
seen in detail in Figure 27. Among the report of damage tweets, reports of damage
to the environment were the highest. A large number of tweets in this group had
very useful tweets for emergency services such as “@micaelapapa: All paths out
from our hotel along Candayog road in Palo, Leyte now impassable due to fallen
trees and branches. #YolandaPH” and “Damaged electrical cables and fallen electric
post along Rxs Blvd. #RoxasCity #Capiz #YolandaPH #HelpCapiz #RescuePH
http://t.co/RKEr8s9RXa”.
Chapter Four: Manual Analysis 137
Figure 27: Distribution of tweets in their coding categories and sub categories by rank (Yolanda)
There were a large percentage of tweets (30% of the 182 tweets evaluated) that
only asked for help without providing much detail about the type of help they
required. For example, “@mateoguidicelli yes northern part of cebu is badly hit by
#YolandaPH people there badly need help” and “@ANCALERTS Bantayan needs
help!!! #RescuePH #BantayanIsland” both asked for help and had specific
information such as location but did not mention what type of help they needed.
Although these tweets provide a signal to emergency services that people need
help, they need to respond and ask for further details about these tweets.
138
Compared to the #qldfloods dataset, Yolanda dataset had tweets regarding
reactions to the relief efforts. For example, “@ancalerts #RescuePH please send
help in Coron, Palawan now!!! No help is reaching them.” Is a good indication that
certain area needs help and if they have not received help yet emergency services
need to act on that.
Overall, as the tweets were already evaluated by many users and identified as
relevant tweets, they had components that showed clear indications of being
relevant. Furthermore, large numbers of tweets mentioned the area they were in;
which is explained in further detail later in this section.
4.4.2 Occurrence of specific information
As it can be seen in the manual analysis of the #qldfloods dataset, specificity and
urgency are two clear signs of relevance for emergency services. Therefore, to test
if these tweets had specific information, location names and images were counted
as well. And one of the most common findings was that almost all tweets had
names of places (Figure 28). However, contrary to the findings from the #qldfloods
dataset, the number of images in the tweets was incredibly low. One of the
potential reasons for such low image count is the time the tweets were composed.
Since the typhoon hit at midnight, people did not take photos and rather tweeted
about their location. Therefore the percentage of tweets that had both name of
location and images was extremely low because most tweets did not have images
with them.
Chapter Four: Manual Analysis 139
Figure 28: Count and percentage of image and location names in tweets by rank (Yolanda)
Specific information by coding categories By counting how frequently images and
location names appear in the coding categories, it was found that similarly to
#qldfloods, in the Yolanda dataset Report of Damage had high percentage of images
(Figure 29). Although a closer look at the percentages suggests that the Other
category (which contains irrelevant tweets) had the highest percentage of images,
when it was evaluated further it was seen that the images where actually linking to
tweets that were already categorised under Report of Damage. Overall, existence of
image still remains an extremely relevant marker even though images were not as
present as in the #qldfloods dataset.
In terms of location, as it can be seen from Figure 28 most of the tweets had
mention of a location in them. Therefore in Figure 29, locations are present in
almost all tweets regardless of the category. However, it should be noted that these
tweets were already marked as relevant for emergency services by MicroMappers,
therefore presence of location suggests that disaster relevant tweets are more likely
to have mention of locations in them. Since image and name of place were both
identified as important markers for emergency services, they remained as two
features that were tested in the automated phase.
140
Figure 29: Count and percentage of image and location names in tweets by their code (Yolanda)
4.4.3 Keywords
As identified in the manual analysis of the #qldfloods dataset, keywords remain an
important feature as it may indicate the context of tweet is in. The manually
identified keywords from the different coding categories are listed in Table 11.
Similar to #qldfloods, the listing reveals some specific findings. Common words such
as “help”, “please” were present in all categories by looking at the top keywords in
these categories. There were variations of the words that included shorter, tweet‐
sized version of the words such as “pls”, “plz”. In addition to please, “building” was
also mentioned as “bldg.”. Table 11 lists keywords that were identified during
manual evaluation where green were marked for those that would be desirable by
emergency services to identify potentially disaster relevant tweets and red for
undesirable keywords that were mostly present in the irrelevant tweet.
Coding Categories Notable Keywords
Request for material support (RF, RS)
Also, any, badly, bodies, candles, damaged, dead, dire, electricity, everything, flashlight, food, from, goods, help, isolated, need, no, out, please, pls,
Chapter Four: Manual Analysis 141
received, relief, rescue, running, School, send, signal, update, water
Request for medical assistance (RM)
Please, need, medicines
Request for information (RP, RA, RI)
Any, anyone, anything, boyfriend, bring, check, colleague, contact, families, family, father, find, finding, for, friend, help, husband, knows, looking, lost, my, mother, out, people, plz, relatives, relief, rescue, son, still, update, yet
Request for other types of help (RH)
Please, send, relief, goods, dire, need, asking, help
Report of damage (DP, DH, DE, DC, DI)
After, almost, badly, blackout, bldg, block, bridge, cables, casualties, city, communication, damaged, destroyed, detach, disconnects, down, electrical, electricity, failed, fallen, falling, giant, help, hit, hitting, houses, impassable, knocks, leaning, lines, lost, need, number, outage, please, power, roads, roof, storm, strong, supply, their, trees, winds
Reporting community behaviour (CB, CC)
200, electricity, evacuating, evacuation, evacuees, families, forced, municipalities, out, residents, waters
Reaction from community (RE, RC)
Badly, haven't, help, need, now, please, reaching, received, send, yet
Others (OM, OS, OG, ON, OR)
Analyst, article, beautiful, believe, bless, breaking, calm, charts, discussion, glad, God, heart, hell, heroes, jobs, lord, love, mercy, mighty, miracle, pray, prayer, psalm, report, sex
Table 11: Common keywords in Yolanda dataset based on their coding categories
Infrastructure, environment and words related to help With regards to the words
in the category Report of Damage, as this was a disaster related to strong wind,
some of the keywords were “flying” of “roof” or “falling” of “electric pole”, which
were relevant for emergency services. As it can be seen in Figure 29, a large number
of tweets were about the damage of infrastructure as well as the environment and
therefore uprooting of vegetation to block paths was considered as a relevant
tweet. The pattern that emerged here from this limited set of tweets was that
action words are generally specific to the disaster in context. When the #qldfloods
dataset was analysed, the action words were “rising” (of water), “nearing” (of flood
water); and in this dataset the words were related to the activity of wind.
Furthermore, all the tweets that were grouped under infrastructure damage
mentioned destruction in commonly known terms such as house, roof, and power
line. Therefore, when using another disaster dataset, common behaviour and the
action of that behaviour seems likely to appear in the tweets. This is tested in the
automated analysis phase.
142
4.4.4 Part of speech
Findings from part of speech analysis of part two (Figure 30) are similar to the
#qldfloods dataset. Nouns were present in all coding categories and often had
similar percentages. Verbs, especially participles, were more visible in the relevant
categories. In addition, prepositions and conjunctions were also present in the
relevant categories.
Figure 30: Distribution of parts of speech by ranks in Yolanda
Similarly, in terms of ranking the priority of information there was no obvious
pattern (Figure 31). Similar to Figure 30, across all category nouns were present,
which were followed by verbs. Surprisingly Report of Damage had a lower verb
count compared to the other categories. Based on these findings, it can be
suggested that part of speech is not a good determiner of importance. Hence, part
of speech is not considered for phase two.
Chapter Four: Manual Analysis 143
Figure 31: Distribution of parts of speech by coding category in Yolanda
4.4.5 Other findings
In addition to the findings discussed above, there were quite a few interesting
qualitative findings that were different from those observed in the #qldfloods
dataset. This section explains that those differences in detail.
Attempt to reach @prominent users One of the notable findings from the tweets
in the Yolanda dataset were the attempts to reach prominent Twitter users which
was not commonly found in the #qldfloods dataset. In two of the three categories,
Damage to Infrastructure and Request for Help, Twitter users try to reach
prominent users, celebrities and news organisations with the hope that their
message will gain widespread attention. For example, one user tried to reach CNN
international (@cnni) by mentioning the need for food and water with the hope
that CNN will act on that. Although CNN did not reply to that tweet and the tweet
was not retweeted by any other users (Figure 32), this tweet was deemed as
relevant for emergency services by all 15 evaluators as Request for Help / Need with
100% agreement.
144
Figure 32: Twitter users attempt to reach CNN
This attempt to reach a prominent user was seen among many of the tweets
evaluated in this part. While accounts such as CNN International is recognisable by
disaster responders, many other accounts were prominent Twitter users or local
celebrities who may not be obvious at first glance. As it can be seen in Figure 33, a
number of users also tried to reach local media and local celebrities.
Figure 33: Types of people users were trying to reach
However, knowing which user is prominent and which is not automatically is
difficult task. One of the ways this issue can be resolved in an automatic setting is by
trying to identify if the user handle in the tweet has a large follower ratio. For
example, a tweet was addressed to @micaelapapa (Micaela Papa) who is the senior
correspondent of GMA news network from the Philippines. Even if she is not
prominent worldwide, having more than 21,000 followers (at the beginning of
Chapter Four: Manual Analysis 145
2014) suggest that she is potentially a prominent figure in Twitter. Therefore
identifying if a tweet is trying to reach a popular user handle can act as a marker for
emergency services.
Increasing use of #name of place – adding hashtags to amplify name of place
Compared to the #qldlfoods dataset where the number of hashtags used to magnify
a place name was limited, in this dataset this was seen repeatedly. It was extremely
common to read tweets such as “Power lines are slowly breaking and falling off.
Roofs are about to detach #YolandaPH #mactan #cebu” where the user have not
only used the hashtag to inform the audience about the larger area Cebu province,
but also smaller area Mactan. By reading this tweet emergency services can not
only identify that the area “Cebu”, which is more prominent province in Philippines
is affected, it can also narrow down the location to “Mactan”, a densely populated
island near Cebu that is not as widely known.
Therefore just by looking at the tweets it was possible to identify some of the areas
that were affected; such as, Leyte, Capiz, Tacloban, Ormoc. However it is worth
mentioning that not all the named places that had hashtags had only name of the
place. Many of the hashtags were associated with other characters such as “PH”,
which stands for Philippines. Although this is similar to the trend that is seen in
naming other disaster hashtags, such as #qldfloods to suggest flood in Queensland,
that usage of hashtag to suggest the name of affected area has not been seen
widely in previous Twitter datasets.
#Pray‐for‐place hashtag Another common finding was the usage of “pray” in the
hashtag in irrelevant tweets. All the tweets that had this word as part of their
hashtag related to divine support and mental strength. Whether it was “Blessed
Friday everyone! Keep safe!#PrayForThePhilippines” or “God bless the #Philippines
#SuperTyphoon #Prayers”, all tweets with #pray were considered not useful for
emergency services. However, identifying words inside the hashtag was not tested
in this research as it increases the scope of this research.
146
Country name as hashtag Another common component of these tweets were the
use of the word “Philippines” instead of being very specific such as “Cebu” or
“Tacloban”. That could suggest that people who are tweeting those tweets are far
away from the disaster and were well‐wishes. However tweets that had both
“Philippines” as well as the local name of place were relevant for emergency
services as that was one way some users tried to get international media or
celebrities to focus on the area.
4.4.6 Summary of findings
This section summarises the findings that were specific for the Yolanda dataset that
was evaluated manually. They are:
1. High percentage of damage reports and requests for help Similar to the
#qldfloods results, a high percentage of tweets were about damage reports.
However, a large percentage were also requests for help. One potential
reason for this is because the data was collected immediately after the
disaster. Therefore, it was potentially filled with panic stricken tweets.
2. Image and name of place Almost 100% of the higher ranked tweets (three
or four) had either name of a place or an image. This further confirms the
importance of images and location names.
3. Patterns in the keywords Similar to #qldfloods, there was a pattern in the
keywords. Seeking help was mostly associated with location names and
help, asking for information was about a person, friend of family member,
report of damage was about status of their own house and public property,
along with words such as breaking and flying that are related to strong wind.
4. Part of speech In both #qldfloods and Yolanda it was found that it was not
possible to identify disaster relevant tweets based on their part of speech.
Chapter Four: Manual Analysis 147
Therefore part of speech is not included as marker for the automated
analysis phase.
5. Emergence of new behaviour Certain new behaviours were also seen in
this dataset. Two of the most notable were efforts to reach a prominent
figure through their Twitter handle and efforts to amplify location names by
putting hashtags in front. In addition, analysing the location names
demonstrated that tweets that were about very specific locations (such as
Cebu) were more relevant for emergency services than tweets that
mentioned the country in general.
The next section summarises findings from both part one and part two to create
guidelines for next step, the quantitative phase.
4.5 Summary of Findings from Manual Analysis
In majority of previous disaster related Twitter research the aim was to identify
what type of information is available in Twitter and group tweets in their respective
categories. While this has resulted in identifying that Twitter can be used to harness
intelligence for emergency services, emergency services have been slow in adopting
these findings. Therefore this chapter addressed the primary research question
about relevant information for emergency services. As relevant is a subjective term,
it used qualitative methods to create coding categories (see Table 7) by synthesising
literature that groups key needs among disaster response organisations. The coding
themes developed were:
1. Request ‐ which includes requests for material support, medical assistance,
information or generic requests for help.
148
2. Report ‐ which includes reports of damage (public, private or
environmental), change in situation, about community, effort from people,
crime, injuries and deaths.
3. Reaction ‐ which includes tweets from the community regarding emergency
service efforts so that emergency services can identify if their effort is in the
right place.
4. Other ‐ Anything that does not fall into these categories.
Using these coding categories and samples from two different datasets (#qldfloods
and Yolanda) close reading was used to identify the existence and distribution of
the categories in the tweets. The key findings that arose through this coding are
summarised below.
Overall codes and their distribution Among the three themes – Request, Report
and Reaction – the majority of tweets were categorised as damage reports in both
the datasets. In the Yolanda dataset Request and Reaction (Figure 34) also occurred
significantly. Reports of Damage occupied the highest percentage among all the
codes and among damage reports, environmental damage were the highest
category. In the immediate aftermath of the disaster, there were significant a
number of Request tweets. Some of the tweets were specific in asking for material
support, but a larger percentage of tweets were just asking for help without being
specific.
Figure 34: Comparison of distribution of tweets in their coding categories by rank
Relevance and priority A tweet can be relevant if it has any of these three
themes: Request, Report and Reaction. However, it may not be of high priority.
Chapter Four: Manual Analysis 149
Priority is determined based on Urgency and Specificity. Urgency can be identified
based on keywords related to time and action. Specificity is determined based on
extracted metadata such as location or image links. Although urgency can be
difficult to determine due to word sense disambiguation, determining specificity is
easier with the existence of location names or image. From the manual analysis it
was found that more than 75% of the time, location and image indicates that the
tweet is likely to be disaster relevant (Figure 35). It is important to note that in
Figure 35, while the Yolanda statistics show little variation across the ranks, the
Yolanda tweets were already categorised by the MicroMappers as containing
disaster relevant information.
Figure 35: Comparison of image and location in tweets by rank
Keywords Words in the category of Request for Help / Need were similar in both
disasters. Most of the words were related to “please”, “help”, “need” and they can
be seen across all the categories. Although urgent words varied from dataset to
dataset, there was a pattern in the words that was related to the disaster. For
example, words related to flood were “now”, “near” and “rising” depicting water
level, and words related to typhoon, “flying” and “falling” describing the effects of
wind.
150
Categories Thematic analysis Keywords that appeared in both datasets
Request for material support (RF, RS)
Food and water, electricity, lights and candles, animals (dog, cat, horse), cell phone signal, relief not reaching
Animals, badly, bodies, candles, damaged, dead, dire, electricity, flashlight, food, goods, isolated, relief, rescue, signal, seeking
Request for medical assistance (RM)
Unavailability of medicine and injury related words such as getting hit by debris
Medicines, hurt, injured
Request for information (RP, RA, RI)
Family members, friend, relatives, unable to contact
Boyfriend, colleague, contact, families, family, father, find, husband, mum, old, power, situation, son, brother, mother, father, friend
Request for other types of help (RH)
Asking for help without being specific. Types of help often includes material support or request for information
Asking, dog, dire, evacuate, horse
Report of damage (DP, DH, DE, DC, DI)
Words and activity related to disaster. If it is flood, words such as rising water. If cyclone, building parts flying off. Building materials (roof, foundation), vegetation that can fall and cause destruction such as tree trunks. Road status.
Basement, blackout, bldg, block, bridge, brim, cables, casualties, corner, communication, damaged, debris, destroyed, detach, disconnects, door, down, electricity, failed, fallen, ferry, filling, flash, floating, flood, getting, height, hour, house, indistinguishable, impassable, knocks, leaning, lines, midday, near, number, outage, roof, storm, strong, street, surging, swallowed, terminal, trees, winds
Reporting community behaviour (CB, CC)
Donation, looting, evacuation ‐ words that represent community situation as well as mood.
Creeping, donate, families, forced, helpless, homes, looting, lost, morgues, municipalities, near, polluted, power, submerged, temporary, washes, water, wrong
Reaction from community (RE, RC)
Some users tweet providing advice while some users point out if the relief efforts has been successful
Helping, asking, donation, received, send, volunteer, yet
Others (OM, OS, OG, ON, OR)
Spiritual messages, greetings, wish, asking to buy things, pornographic
According, amazing, business, buy, comparisons, ideological, God, Good, heart, hell, heroes, jobs, lord, love, mercy, miracle, pray, prayer, price, psalm, purchase, report, sexy, striking
Table 12: Summary of common and specific keywords in #qldfloods and Yolanda dataset
High importance words were usually found in the long tail distribution. Often these
words were not the top keywords. Table 12 provides a summary of the types of
Chapter Four: Manual Analysis 151
word that appear frequently. A full list of keywords is available in Appendix E. In
terms of part of speech, there was no definite pattern that was identified from the
analysis. Therefore, even though it was deemed as relevant by other researchers,
this is not used for the automated analysis of this research.
Adaptive system As Twitter becomes a mature system with increasing usage, the
effect of complex adaptive system processes were visible in the later dataset
(Yolanda). A lot of users tried to reach prominent Twitter users at the same time
with the hope that they would promote the tweets to their followers to increase
visibility among the people. More people tried to use hashtags to amplify names of
places in the Yolanda dataset compared to the #qldfloods dataset.
4.5.1 Rule based filtering
Based on the findings of the qualitative analysis, the following filtering rules can be
suggested for an incoming tweet:
1. Check for Retweet: If the tweet is a retweet it should be eliminated. It is
better to go to the source and eliminate any other tweet that refers to that
tweet.
2. Look for an image: As it was found in this chapter, a significant
percentage of Reports of Damage included images. A lot of community
reports also had an image in them. Therefore, if it has image, it has higher
chance to be a relevant tweet for emergency services.
3. Find if it has specific name of location: Similar to image, if the tweet has a
specific location name instead of generic, it has higher chance to be a
relevant tweet for emergency services.
152
4. Having desirable (Request, Report, Reaction) keyword: If it contains any
keyword that is in the desirable keyword list, (under request, report or
reaction) it is potentially relevant.
5. Not having undesirable keyword: If a tweet includes keywords such as
God, then it is potentially not relevant for emergency services.
4.5.2 Limitations of the study
There were several limitations to the manual analysis phase. The primary limitation
is that the findings are based on a small sample of a selected hashtag dataset. Even
though a hashtag dataset is an acceptable research sample, identifying the right
hashtag is often a challenging task. In addition, manual evaluation of the #qldfloods
was conducted by a single coder. Although research has often used a single coder
for their first pass in creating coding schema, having only one person’s point of view
may not be sufficient. The dataset evaluated from Yolanda dataset was also a very
small percentage of the whole dataset. However as the objective of this phase was
to identify the features for automated analysis phase, it does not pose a huge
limitation. The next automated analysis phase attempts to address these limitations
by automating the findings from qualitative phase to the larger dataset.
Chapter Five: Automated Analysis 153
Chapter 5: Automated Analysis
The outcomes from Chapter Four (manual analysis phase) were used as a
foundation for the design of the analysis described in Chapter Five (automatic
analysis phase). This second phase of the research addresses the second sub‐
research question, how can relevant information for emergency services be filtered
automatically. In the manual analysis phase, the question of what is relevant for
emergency services was addressed and four features were identified that can
determine if the tweet in question is relevant for emergency services after a natural
disaster. These four features are, a) location, b) image c) having desirable
keywords (keywords that fall under Report, Request and Reaction categories) d)
Not having undesirable keywords (keywords that fall under spam or personal
narrative).
This chapter describes the process taken to develop automated detection
algorithms to find these four features in any given tweet. The process involved
creating a set of tools that used several methods discussed in Chapter Three
(Methodology) to automatically identify if the features exist in a tweet.
After the algorithm was developed, it was tested on the #qldfloods and Yolanda
datasets, which had already been coded manually by the researcher (for
#qldfloods) or the MicroMappers (for Yolanda). Having the tweets already coded in
their groups allowed the researcher to compare the output of the algorithms with
the manual coding, and to test whether the algorithm reliably identified the tweets
which the coders had identified as relevant for emergency services. The flow of
these various tests can be seen in Figure 36.
154
Figure 36: Research design flowchart – automated analysis (phase two)
5.1 Sample Size for Analysis
Although for an automatic analysis there are usually no limitation on the data size,
only the 1,320 tweets from the #qldfloods dataset and 22,084 tweets from the
Yolanda dataset was used for the automatic analysis. The reason for the selection is
described in this section.
Dataset from #qldfloods In the original #qldfloods dataset there were 49,748
tweets collected using the #qldfloods hashtag. However, not all the tweets were
Chapter Five: Automated Analysis 155
coded and therefore it would not be possible to determine if the output from the
algorithm was successfully identifying tweets that were relevant for emergency
services or they were finding tweets at random. Therefore, the same 1,320 tweets
from #qldfloods dataset that was used in manual analysis phase was selected for
automatic analysis. Although this is a small dataset for the automatic analysis, as
they were already coded they could be used to determine the performance of the
algorithm. It should be noted that this dataset already excludes retweets.
Dataset from Yolanda Similarly, the initial Yolanda dataset had more than
230,000 tweets. By selecting tweets that were written during the first 24 hours it
was reduced to 52,548 tweets. Out of that, 22,084 tweets were selected for the
automated analysis. This is because to compare the output from the algorithm any
tweet from the database should be clearly marked as relevant or irrelevant for
emergency services. In order to prevent any confusion, tweets that had at least
50% agreement among MicroMappers were used in this phase. This resulted in
26,068 tweets, which was filtered again to remove any tweets that started with RT.
This resulted in total of 22,084 tweets.
Once the sample sizes were determined, the tweets were evaluated using the
algorithm to identify if they contained the four features. The next section describes
the development of the algorithm, which is followed by the results from the
analysis of each dataset.
5.2 Mapping Features and Methods
This section describes the process of developing the tool set that was used to test
the four features. For each feature identification new scripts were developed which
were built on established frameworks of computer science and information
retrieval. Related scripts and setup methods are listed in Appendix D.
156
5.2.1 Image and URL distribution
To identify image and URL distribution, a combination of regular expression in
Python programming language and URL Resolve framework was used. For each
tweet, the script looks for any URL in the tweet by looking for “http” or “https” and
then once it finds any URL, it then uses the URL Resolve library to convert any short
URL to the full URL.
Another script then was executed to find if a tweet has links from any of the top 25
popular image sharing websites. The list of top 25 image sharing websites was
gathered from Wikipedia, which is often updated by contributors. Since popularity
of an image sharing website may change rapidly, identifying information from
Wikipedia can ensure it covers the currently popular image sharing websites.
5.2.2 Named entity extraction
For the purpose of named entity extraction, there are several competing named
entity analysis and natural language processing frameworks available. Among them,
three of the most notable frameworks are Stanford Named Entity recognition
(Finkel, Grenager, & Manning, 2005) (with updated 2014 classifier), University of
Washington Twitter NLP Tools (Ritter, Clark, & Etzioni, 2011) and Carnegie Mellon
Ark‐Tweet‐NLP (Owoputi et al., 2012). As Stanford NER is the most popular
framework, it was selected to use for this study. A python script was written that
reads the tweets from the database, splits the words of the tweets, removes any
symbols such as @ or # and then calls the Stanford NER tagger to identify if there
are any named entities available. According to the tagger, a named entity can be of
any of the seven classes: Time, Location, Organisation, Person, Money, Percentage,
and Date.
Chapter Five: Automated Analysis 157
5.2.3 Keywords
The experiments using keywords built on the list of desirable (e.g., Report of
Damage) and undesirable (e.g., Spam, personal narrative) keywords developed in
previous chapter (Table 12). However, instead of only looking for the exact word,
each of the words were reduced to their base morphological form to match a
greater number of words. For example, instead of only looking for a word “blocked”
which may have referred to the inability to access a certain road, its root form
“block” was used. Words such as “blocking”, “block” are therefore also covered
under the root term “block”.
Base morphological forms through stemming The most common process of
identifying and correcting words in their base morphological form is via stemming
(Han, Cook, & Baldwin, 2013). By converting words in their root form, stemming
reduces number of times a word needs to be checked for variation. Stemming of
words has been practised in natural language processing for many years (Manning
& Schütze, 1999). For the purpose of this project Porter Stemming (Porter, 2001)
was used as it is the most versatile stemming available. The stemming process was
applied to each of the words in the tweets as well as on the keywords in the list
described next.
Desirable keywords list The list of desirable keywords were built on the list that
was created in Chapter Four. Although the list included categories from Report,
Request and Reaction, for the purpose of automatic analysis words from the Report
of Damage category were tested (Table 13). The reason for picking only this sub
category was that it was the most prominent category in the #qldfloods dataset and
one of the most prominent categories in the Yolanda dataset. Although other
categories such as Request for Information could have been selected there was not
have sufficient data to test from #qldfloods. Therefore, in order to maintain
consistency and academic rigour the Report of Damage category was selected.
158
Category Words
Report of damage
Basement, blackout, bldg, block, bridge, brim, cables, casualties, corner, communication, damaged, debris, destroyed, detach, disconnects, door, down, electricity, failed, fallen, ferry, filling, flash, floating, flood, getting, height, hour, house, indistinguishable, impassable, knocks, leaning, lines, midday, near, number, outage, roof, storm, strong, street, surging, swallowed, terminal, trees, winds
Table 13: Desirable Keywords listed under Report of Damage category that was used for testing
Undesirable keywords list Similarly to the desirable keywords list, keywords from
the Others category contained words from the undesirable keyword list. These
included keywords related to personal narrative, spam, spiritual messages, news
and reports; categories that were identified as not relevant for emergency services.
These are detailed in Table 14, which draws on the Table 12 developed in Chapter
Four.
Category Words
Others According, amazing, business, buy, comparisons, ideological, God, Good, heart, hell, heroes, jobs, lord, love, mercy, miracle, pray, prayer, price, psalm, purchase, report, sexy, striking
Table 14: Undesirable keywords listed under other categories that was used for testing
Matching process As the objective of this step was to automatically identify if a
tweet contains desirable or undesirable keywords in order to automatically identify
tweets relevant for emergency services, the first step was to take each word from
the lists above (Table 13 for desirable keywords and Table 14 for undesirable
keywords), stem it and store in a temporary location. After that the script loops
through the database of tweets and for each word of a tweet the script converts
them into their base form and compares them with the words that are stored in the
temporary location. If the words were a match, that tweet was marked as a match.
After the scripts looped through the samples, the output was exported to a file for
further analysis. The output of this matching process for #qldfloods and Yolanda
dataset are explained and analysed in more detail later in this chapter.
Chapter Five: Automated Analysis 159
5.3 Phase Two Part One: #qldfloods dataset
This section explains the findings from running the tool set on the #qldfloods
dataset for the four selected features. As this dataset was already pre filtered for
retweets, retweet elimination is not included in the discussion of results. Findings
from remaining features and how they compare against the coding categories are
described below.
5.3.1 Image distribution
The findings from the manual analysis phase placed high importance on the
existence of an image in the tweet. Therefore the objective of image identification
was to find out which categories of tweets had more images in them. As discussed
earlier, this was done by first finding the URLs in the tweet and then by identifying
which of those URLs had images that were relevant. As can be seen from Figure 37,
a large number of tweets did not contain any URLs.
For the purpose of analysing this dataset, websites such as twitpic, yfrog, imgur
were marked as third party Twitter images as they were used to link to photos in
tweets. As is demonstrated in Figure 37, one third of Report of Damage tweets had
third party image URLs in them.
160
Figure 37: Distribution of coding categories in image based tweets
One category that stands out is the category of unresolved URLs (shortened URLs
that did not convert to their full form). There are two main reasons for this. The
first is that when people retweeted sometimes the links were truncated in a way
that it missed certain portion of the URL and therefore became unresolvable.
Second reason is this dataset is an old dataset that contained links that no longer
existed. Therefore even though a number of additional images were identified in
the qualitative phase that belonged to the report of damage and request
categories, either the links or the websites were not available any more.
Other notable URLs such as Flickr and Instagram were grouped as one. Although
these are extremely popular websites the popularity of a website often changes
very quickly. Therefore instead of grouping based on a specific website those
websites that were currently popular were grouped into one. This pattern of image
sharing can assist emergency services to look for currently popular image sharing
websites instead of looking for websites that may no longer be popular.
Chapter Five: Automated Analysis 161
Overall it can be seen that the findings from analysis of #qldfloods dataset of the
importance of images was confirmed through the automated tool. Among the
categories it can be seen that Report of Damage had the highest percentage of
image based tweets.
5.3.2 Named entity distribution
In manual analysis phase it was identified that if a tweet contained mention of a
location, the tweet is likely to be relevant for emergency services. Therefore by
using the Stanford Named Entity recognition framework this section automatically
analysed each of the tweets from the #qldfloods dataset to find out what
percentage of tweets in each group contains mention of a location.
Before proceeding to examine the output, it is necessary to briefly explain named
entity extraction. Most of the named entity extraction tools look for specific
information. Depending on the classifier it uses, the tool looks for mentions of
specific information such as location, organisation, name of person. The reason the
initial experiment was not focused only on location was to test the general
distribution of named entities in the dataset.
As can be seen in Figure 38, in most of tweets named entities were either not
present or were not automatically identified. However, Report of Damage had the
highest number of locations followed by request for information and the Other
category. This preliminary result aligns with the findings from the manual analysis
about the importance of location in tweets.
162
Figure 38: Distribution of types of named entity in their coding categories
However, in the manual analysis it was also identified that mention of specific
locations were more relevant to emergency services than generic locations.
Therefore the type of location these tweets included was investigated further. In
order to see the distribution of location names, they were divided into two parts. If
the location name was large area such as Country (Australia), State (Queensland),
City (Brisbane, Sydney) it was grouped as a generic location. If the tweet had a
specific regional location it was grouped under Specific Location. If the tweet did
not have any location named entity, it was grouped as No Location.
As it can be seen from Figure 38, the Other category had more generic locations
such as “Australia”, “Queensland”, “Brisbane”, compared to the report of damage
category which had more specific locations such as “Margaret Street”, “Bulimba” (a
suburb in Brisbane). This is similar to the findings in manual analysis phase that
identified that having a specific location is a good indicator of a relevant tweet.
Chapter Five: Automated Analysis 163
Figure 39: Distribution of specific and country wide location in coding categories
By analysing further it can be seen that regional locations indeed identified tweets
that are likely to be relevant to emergency services. For example, tweets such as
“Corner of Horizon Drive and Dewsbery Street Middle Park @ Midday. #bnefloods
#qldfloods http://twitpic.com/3p8pnu” or “Moggill Road Chapel Hill a good 500m
from Brisbane river (taken 2hrs ago): http://goo.gl/photos/PtG1oNOYG7 #qldfloods
#bnefloods” contains relevant information for emergency services.
However the tool did not always automatically identified something correctly. For
example, the tool identified the word “Seinfeld” as a regional location from the
tweet “@MsDovic @therealzooeyd @amandapalmer @DannyDeVito and Jason
Alexander from Seinfeld ‐ don't have his acc sorry #qldfloods”, which was in the
others category. Similarly, “It must be very humid in Brisbane Karl keeps wiping his
forehead mid interview .... #Qldfloods” was grouped under Specific Location
because it identified “Karl” as a name of a location.
164
Sometimes the tool identified the regional location accurately, but the tweet itself
was not relevant for emergency services. For example, in the Tweet “Federal
Member Capricornia Kirsten Livermore says a study into Yeppen crossing into
#Rockhampton has been underway prior to the #qldfloods”, “Rockhampton” was
identified as a specific regional location, but the tweet itself was not relevant for
emergency services.
Therefore it can be suggested that named entity recognition is indeed a marker to
identify disaster relevant tweets automatically. However, it is not free of errors and
therefore not sufficient to determine if a tweet is disaster related or not. In
addition, the question of whether it only worked for names that are English‐based
needs to be tested. Therefore in the next stage of the analysis the same tool was
applied to the Yolanda data set to see if it could identify the names of places in a
non‐English location, the Philippines.
5.3.3 Keywords distribution
Keywords are integral of any form of information retrieval activity (Brin & Page,
1998; Matsuo & Ishizuka, 2004). Although Twitter only has 140 characters, and
based on the discussions so far, image and named entities have a strong
importance, keywords still play a very important role in identifying the context of a
tweet (Mathioudakis & Koudas, 2010).
In addition, it can also be argued that since the amount of words that can be used
in twitter is minimal, existence of multiple disaster related keywords in a tweet is
likely to indicate that this tweet is potentially relevant for emergency services
(Purohit et al., 2014; Roy Chowdhury, Imran, Asghar, Amer‐Yahia, & Castillo, 2013).
Similarly, if the tweet contains more undesirable words, it is likely to be an
irrelevant tweet for emergency services. To test this assumption, all keywords listed
in Table 13 and Table 14 were tested on the #qldfloods dataset. This section
describes the findings of this test.
Chapter Five: Automated Analysis 165
Desirable keyword distribution Figure 40 shows the problem identified by
researchers with regards to word sense disambiguation (Banerjee & Pedersen,
2002). Although these were the keywords that were identified as relevant for
emergency services while evaluating the tweets manually, and they have appeared
in high percentage in the Report of Damage category, they also appeared in high
numbers in the Others category.
Figure 40: Distribution of coding categories in Report of Damage and Request
For example, the word “destroyed” is a disaster specific and relevant for emergency
services word because it can be in a tweet about a particular building, public
infrastructure or property getting destroyed. However, this tweet “Lord Mayor
Campbell Newman: CityCat ferries and terminals destroyed on the Brisbane River.
#qldfloods #thebigwet” also has the word destroyed and would be marked as
relevant if the relevancy is determined by the word “destroyed”, even though it is
not relevant for emergency services.
Even for something that is even more specific, such as the word “mum” which was
in the request category, the tweets can be in both the relevant as well as irrelevant
group. For example, “Can anyone on #BribieIsland pls confirm conditions? Cannot
166
ctc my 96 year old mum at Bongaree. Pls DM me #qldfloods” is clearly an important
and relevant tweet for emergency services. However, “Just spoke to Mum she's
emptying the fridge before the power turns off at 10am then heading to higher
ground at my sister's home #qldfloods” is more of a personal narrative than a tweet
of disaster relevance.
Common keywords were found to be even more problematic. For example, there
were tweets that mentioned floodwater coming towards the house and were
categorised as a Change of Situation tweet and resulted in the inclusion of the word
“coming” in the keyword list. However this resulted in identification of irrelevant
tweets such as “#qldfloods twitter stream is almost unreadable ‐ simply too many
tweets coming through”, which although mentions the flood, is about the flood of
information and not the flood of water.
The findings indicate that what was thought as desirable keyword during manual
analysis was found to be not desirable in the automatic analysis. Although desirable
keywords that fall under the Report, Request and Reaction remain a necessary
feature, they need to be constantly evaluated to ensure automated analysis does
not identify tweets that are irrelevant. This can be improved by integrating results
from undesirable keywords, which is explained next.
Undesirable keyword distribution Results from the findings detailed in Figure 39
show that undesirable keywords can potentially be more useful to identify if a
tweet is irrelevant for emergency services. As can be seen from Figure 39,
undesirable keywords had a higher percentage in the Others category which has
tweets marked as personal narrative or spam, compared to the categories that has
been marked as relevant for emergency services. Although Reaction from
Community had a higher percentage than Others category, Reaction often contains
personal narratives that share many of the same keywords with Others. Apart from
that, undesirable keywords were found in higher percentages in the Others
category.
Chapter Five: Automated Analysis 167
Figure 41: Distribution of coding categories for undesirable keywords
One exception was “Moggill Road Chapel Hill a good 500m from Brisbane river
(taken 2hrs ago): http://goo.gl/photos/PtG1oNOYG7 #qldfloods #bnefloods” tweet
which is relevant for emergency services and eliminating the tweet based on the
word “good” would eliminate a disaster relevant tweet. Therefore, it can be
suggested that either words such as “good” should not be listed (which was
included as a part of greeting word ‐ “good morning”) or that undesirable keywords
can not be used a sole evaluator either.
Based on the result can be suggested that keywords alone, especially the
undesirable keywords alone would not be able to identify a disaster relevant tweets
on their own. Ultimately they can be used to generate a result set that is a subset of
the total collection of tweets. They can also be used to assign a certain score and
increase the score if desirable keywords exist and undesirable keywords do not
exist. An additional method of using Wikipedia and Wordnet synonym to expand
keywords is included in Appendix F. However, using keywords alone would be
insufficient to determine if a tweet is relevant for emergency services.
168
5.3.4 Summary of findings
This section summarises the findings from using various tools used on the
#qldfloods dataset to find if the features that were selected as markers of relevance
in the qualitative phase one can identify if a tweet is relevant for emergency
services automatically.
This analysis showed that image and URL detection the tools can successfully
identify the existence of images whether it is linked or embedded. In addition, by
scraping the names of top image sharing websites from Wikipedia, it can identify if
a particular URL is an image sharing website or something else. For named entity as
well, the Stanford Named Entity Recognition tool can successfully identify specific
local areas. By providing an additional list of wider area location names that need to
be excluded, it can identify tweets that are likely to be relevant for emergency
services automatically.
When it comes to keyword the success of the tools are rather limited. Although
keywords from the irrelevant keyword list are more successful in determining
tweets that are likely to be not relevant for emergency services, keywords from the
relevant keyword list were not successful in identifying tweets relevant for
emergency services alone.
Overall, the tools and frameworks can successfully identify the features to a level of
success. However none of the tools were found to be able to determine on its own
if a tweet is relevant or not. Rather it appears that a combination of the tools is
likely to create a better identification option than a single tool. However, before
concluding that a combination feature is potentially better, it needs to be tested on
a bigger dataset. Therefore, in the next section the same set of tools were used on
the Yolanda dataset.
Chapter Five: Automated Analysis 169
5.4 Phase Two Part Two: Yolanda dataset
From the discussions of the findings from the #qldfloods dataset it can be seen that
automated tools can successfully identify the features Image, Named Entity and
Desirable and Undesirable keywords from tweets. However to test if the tool set
successfully identifies these features from a much larger dataset, the set of tools
and frameworks were applied to the Yolanda dataset. The findings are described in
the following sections.
5.4.1 Image distribution
Distribution of the image sharing websites in Yolanda tweets (Figure 43) suggests
that tweets in the Damage to Infrastructure category are substantially more likely
to contain images, meaning that tweets with images are likely to be relevant to
emergency services. By grouping all other websites in the same group and
separating only Twitter images and Instagram URLs it can be seen from Figure 43
that Damage to Infrastructure has the highest percentage of images among all
categories.
However from Figure 43 it can also be seen that the Not Relevant category had a
large count of Twitter images as well. In terms of percentages most of the
categories had a similar percentage of images. Therefore what images were shared
was investigated further to understand if there was a certain distinction between
relevant and irrelevant categories and if that could be automatically distinguished
as well.
170
Figure 42: Distribution of coding categories in tweets with images
In depth observation Once the images are evaluated it becomes obvious why the
image was marked as irrelevant or relevant. For example, in Figure 44 it can be seen
that even though the tweets contained either the hashtag or keyword Philippines,
they were clearly not relevant for emergency services.
Chapter Five: Automated Analysis 171
Figure 43: Sample irrelevant tweets for emergency services that has photos
However, there were other images that were clearly relevant for emergency
services. For example, Figure 45 shows some of the images that clearly indicate
reports of damage. The interesting difference between these two groups of images
that can be seen in Figure 44 and Figure 45 is that the relevant images also had
specific names of places as well as keywords that were in the keyword list identified
earlier. On the other hand, irrelevant images had neither a keyword potentially
relevant for emergency services or a specific location.
172
Figure 44: Sample tweets relevant for emergency services that has photos
Therefore, based on these findings it can be suggested that images alone are not a
sufficient identifier of importance. Once an image is identified it needs further
filtering to find those tweets that are relevant for emergency services. Instead,
names of a place as well as keywords might be more appropriate for emergency
services to identify disaster relevant tweets. Therefore these are tested in the next
sections.
5.4.2 Named entity distribution
Once the Stanford Named Entity Recognition was executed on Yolanda dataset, it
can be seen that location was dominant across all categories, except the Not
Chapter Five: Automated Analysis 173
English category (Figure 46). Although the percentage of named locations is similar
to #qldfloods, this dataset included other named entities, notably Person and
Organisation. In addition, a notable difference with #qldfloods is that many tweets
had more than one named entity. For example, it was common to see organisation
or person in the same tweet with a location. However this was later identified as a
mis‐identification by the tool, as will be explained later in this section. However, as
it was identified that the existence of a location is more likely to make a tweet
disaster relevant this was investigated further.
Figure 45: Distribution of categories in each named entities (Yolanda)
Filtering by generic names As it can be seen from the findings from the #qldfloods
dataset, tweets that mention location and are relevant for emergency services are
likely to include specific location names rather than generic names. Therefore
tweets with locations were filtered with generic name filtering. For the purpose of
this filtering, if the location was a large areas such as the Philippines, or
neighbouring countries also impacted by the typhoon including Vietnam,
174
Cambodia, Korea or any other countries, it was regarded as a generic name. If the
named entity was not a location, it was grouped as No Location. For those that
included a location but did not fit in the generic name, they were grouped as a
Specific Location. Once this filtering was applied, the results changed drastically
(Figure 47). Instead of having similar importance based on percentage of location
names across all categories, categories that are relevant for emergency services are
now more prominent due to the increased percentage of specific locations in them.
Figure 46: Distribution of generic and specific locations in tweets with location mention (Yolanda)
However, there was still a large number of tweets that were under the Not
Relevant category but had a specific location in them. Although it was lower than
other categories, in terms of total tweet count it was still significantly large. When
these tweets are analysed it could be seen that although they contained specific
location names they were not relevant for emergency services. For example, some
of the tweets were, “Biliran and Tacloban, Leyte are close to me. I wish for their
Chapter Five: Automated Analysis 175
safety. #YolandaPH #Haiyan”, “Glad to know na okay fam ko in negros but still ds
doesn't stop me in praying 4 d safety of every1..? #YolandaPH
#PrayForThePhilippines”.
This provides an indication that, after the named entity level identification, tweets
still needs to be filtered for other features such as keywords to identify if the tweet
that had a specific location is indeed relevant for emergency services or another
personal narrative that is not useful for emergency services.
Non English words was identified as organisation and person In addition to the
location entity, additional observations could be made based on the analysis. A high
number of tweets in the Yolanda dataset were a mix of English and Tagalog (the
language of Philippines), resulting in words such as “Kagabi”, “Grabe”, “Lang”, “Si”,
“papa” being identified as an Organisation. English words, “Metro”, “Manila”,
“High”, “School”, “OCHA”, “Flash”, “Update”, “NASA” were identified as
Organisation as well. While NASA is indeed an organisation, Manila is a location and
not an organisation.
It should be noted that, in terms of the names of locations there was not a
significant difference in identification between English location names such as
Margaret Street and non‐English location names such as Tacloban. This suggests
that named entity analyses might also work for non English tweets. However this
was not investigated as it falls outside the scope of this dissertation.
Overall, findings from applying the named entity extraction tool to the Yolanda
dataset confirm that named entity recognition is an important marker to identify
disaster relevant tweets automatically. Similarly to the findings from the #qldfloods
dataset, the results here also caution that named entity recognition does not work
perfectly all the time and therefore relying only on this tool to identify disaster
relevant tweets will not generate accurate results. It is therefore likely to be better
suited as a part of a combined toolset, which is discussed in the following chapter.
176
5.4.3 Keywords distribution
As discussed earlier in this chapter with the #qldfloods dataset it was found that
desirable keywords from Report, Reaction, Request categories are not only found in
tweets that are relevant for emergency services but also in those categorised as
irrelevant (e.g., spam, personal narratives). The objective of repeating the same test
on the Yolanda dataset was to find out if the results were similar or if the findings
from #qldfloods were specific to that dataset. The same two sets of keywords were
used in this experiment, with one set that contained Report of Damage keywords
and another set containing Others keywords. This section describes the findings of
applying the tool on Yolanda dataset.
Desirable keyword distribution The findings of the desirable keywords distribution
in the Yolanda dataset were quite different than the #qldfloods dataset. In
#qldlfloods the distribution was almost equally distributed. However in the Yolanda
dataset, there was a large percentage in the Damage of Infrastructure. The rest of
the categories had similar percentages of desirable keywords, similar to #qldfloods.
However, as desirable keywords were present in the Not Relevant category of
tweets, they were evaluated further. Based on a close reading it was found that
although the tweets contained the keywords, the context was different. For
example, the word “damage” was present in the Damage to Infrastructure and Not
Relevant categories very differently. In the Damage to Infrastructure category there
were tweets such as “Typhoon also caused heavy damage on the newly established
hospital Health Centrum. #Capiz #YolandaPH #HelpCapiz
http://t.co/MKHnuXJAmX”. In the Not Relevant category, “damage” was found in
tweets such as “Dont just share what you feel about the damage caused by
Yolanda, MOVE and HELP. #YolandaPH” or “@PeterG_Weather I can't even begin to
imagine what gusts of wind over 200 mph would feel like, let alone what damage
they could do. #Haiyan”. Although both tweets contain the word “damage”, the
context is completely different. This reflects what was found in part one of phase
one.
Chapter Five: Automated Analysis 177
Figure 47: Presence of desirable keywords in their coding category (Yolanda)
The findings were similar for the Request category as well. Even for something very
specific such as, “boyfriend”, there were drastically different tweets. On one hand,
the Request for Help / Needs category had “#rescueph my boyfriend is in Ormoc
and we haven't been able to get in touch. He's in the Villa Hotel if anyone can help”
and on the other hand not related category had “I WISH I'LL MEET ONE DIRECTION
AND HARRY ATYLES WILL BE MY BOYFRIEND!! =D HELLO I'M KT DENISE. FROM
PHILIPPINES!!! =D #wishogram”. As these tweets were collected using hashtag
#yolandaph, #rescueph and keyword Philippines among many other keywords and
hashtags, the tracker collected tweets with various ranges of contexts.
Undesirable keyword distribution Similarly to the desirable keywords, the
distribution of undesirable keywords was different from the #qldfloods distribution
to the Yolanda dataset. As can be seen from Figure 48, although Not Relevant / Skip
/ RTs has the highest percentage of undesirable keywords, almost all other
categories had a similar percentage of undesirable keywords as well.
178
Figure 48: Presence of undesirable keywords in their coding category (Yolanda)
The findings here are different from #qldfloods because in #qldfloods it was found
that the Others category, which included irrelevant tweets such as spam and
personal narratives, had the highest percentage of undesirable keywords. However,
by applying the same keywords list on Yolanda, a different result could be seen.
Therefore eliminating tweets that include keywords from the undesirable category
is likely to eliminate some tweets relevant for emergency services. For example,
“Winds strongly rushing, trees falling, roofs flying, power outing, and heavily raining
here in Ormoc, Leyte. God protect us all! #YolandaPH” is a tweet relevant for
emergency services and if undesirable keywords were used to eliminate this based
on the word “God”, it would have eliminated an otherwise disaster relevant tweet.
Therefore it can be suggested that although not relevant keywords can assist in
identifying irrelevant tweets, they should not be used on their own.
Overall, the findings from keyword distribution in Yolanda dataset is opposite of the
findings from #qldfloods dataset. In #qldfloods it was identified that desirable
Chapter Five: Automated Analysis 179
keywords may not be a strong indicator of a disaster relevant tweet but the
existence of undesirable keywords can be used to differentiate whether a tweet is
relevant or irrelevant for emergency services. Findings from keywords distribution
in the Yolanda dataset suggest that desirable keywords are likely to be an indicator
of relevance and undesirable keywords are likely to be present in all categories.
This difference confirms the issue of word sense disambiguation and it can be
argued that keywords alone would be insufficient to determine if a tweet is
relevant for emergency services.
5.4.4 Summary of findings
After applying the same set of automated tools on the Yolanda dataset it can be
seen that it is difficult to use a single feature set to identify if a tweet is relevant for
emergency services. Although each feature could identify some tweets that are
relevant for emergency services, none of the features were self sufficient.
Images were found to be a very useful tool to separate disaster relevant tweets
from irrelevant ones. Specific location names are also important as they can
successfully identify tweets that are relevant for emergency services. In terms of
keywords, filtering with irrelevant keywords provide better results than filtering
based on relevant keywords as keywords relevant for emergency services also
appear frequently in non relevant tweets.
5.5 Summary of Findings from Automated Analysis
The objective of this chapter was to use a set of tools to automatically identify four
key features (image, location, desirable and undesirable keywords) that can suggest
if a tweet is relevant for emergency services after a natural disaster. The aim of this
tool set was not to completely filter out the tweets but to reduce the number of
180
tweets to small enough number for emergency services to manually look over.
These tools were tested on two datasets, #qldfloods and Yolanda and this section
summarises the findings from these datasets based on each of the four features.
Image Based on the findings from both the datasets, if the tweet had an image
that is shared either from a leading third party image sharing website or embedded
from twitter itself, there was a high chance that the tweet was relevant for
emergency services. However having an image does not necessarily guarantee that
the tweet is relevant for emergency services. It is only useful to suggest that it is
potentially relevant. Even after finding that a tweet has an image, other features
needs to be looked for to determine if the tweet is relevant for emergency services
or not.
Specific locations Specific locations were seen to be a better marker than image
and retweet. However, similar to other markers of relevance, it is not usable as a
single tool. Although the Stanford Named Entity Recogniser was often successful in
identifying various named entities, it still needs to be filtered for country specific
location names. If all location results are taken into consideration without filtering
country level names, it is likely to increase false positives rather than finding
relevant tweets.
Keywords relevant for emergency services Any keyword that is potentially
relevant for emergency services was present in both relevant and not relevant
categories in both datasets. Therefore using disaster relevant keywords as a
filtering feature is likely to include tweets irrelevant for emergency services.
Although keywords still remain a potentially relevant feature for emergency
services to identify disaster related tweets, based on the findings from both the
datasets a list of keywords relevant for emergency services were not proved to be
useful.
Irrelevant keywords for emergency services A list of irrelevant keywords for
emergency services on the other hand was proved to be very useful in filtering
Chapter Five: Automated Analysis 181
irrelevant tweets from both the datasets. However if this is the only filtering tool
used it is likely to eliminate some tweets that are relevant for emergency services.
It is important to note that none of these should be misunderstood as a single
filtering tool. They can be used as part of multi factor coding tool that can
categorise incoming tweets in categories that emergency services deem relevant or
irrelevant. Based on the findings from this phase it can be suggested that a
combination of all the four features can potentially identify which group an
incoming tweet may go to. Therefore in next chapter this multi‐factor combined
tool set is discussed.
182
Chapter 6: Discussion
The dissertation so far has explored if it is possible to identify whether a given
tweet is relevant for emergency services after a natural disaster. This is because the
main goal of the study is to help emergency services to identify disaster relevant
tweets in real time. The objective is, instead of evaluating thousands of tweets
after a natural disaster and getting overwhelmed, emergency services need to
evaluate only a handful of tweets that are likely to be relevant for them.
Before continuing a description of a generic disaster management control room
would be useful to situate this study. Generally a disaster control room will have a
number of screens monitoring various channels related to the event. Some of these
might be data from sensors, some could be reports from other agencies such as
weather departments, and some channels could be media reporting on the
disaster. A recent addition in these monitoring tools is social media monitoring,
which is being used to gather intelligence (such as reports of damage), as well as to
find out who may need help, or the reaction from the community. All of these
channels are used at the same time to assist emergency services to make decisions
that can save peoples lives.
This dissertation is situated in the social media monitoring segment of emergency
services control room that is described above. The problem with using social media
to gather intelligence or find who needs help is that the amount of tweets that get
generated after a natural disaster is far too many for emergency services to
evaluate. In addition, these tweets appear at an extreme pace. Therefore, this
dissertation looked at how the number of tweets can be reduced to a manageable
size so that emergency services can look at them.
In order to do so, Chapter Two evaluated literature to find out what type of
information emergency services consider as relevant after a natural disaster and
Chapter Six: Discussion 183
found three categories (Report, Request and Reaction). Chapter Three discussed
the methods of gathering and analysing Twitter datasets. Chapter Four used
qualitative methods to manually identify how often relevant tweets appear and
what features are likely to be able to identify if a tweet belongs to these three
categories. Chapter Five took these features and applied them to a larger dataset
using automated tools. In the Chapter Four analysis of the dataset it was found that
Report of Damage was the most prominent category among the categories that was
relevant for emergency services. For this reason during the automated analysis in
Chapter Five, the input data was focused on the Report of Damage category.
Based on the findings it can be seen that relevant tweets are likely to contain
mention of specific locations, links, or embedded images. They also contain
desirable keywords, although these keywords are also present in the irrelevant
categories such as spam or personal narrative. The findings also indicate that the
existence of undesirable keywords can be a good indicator of tweets being
irrelevant. In addition, other features such as parts of speech are not good indicator
to identify if a tweet is likely to be relevant for emergency services.
However, based on the findings, it can also be seen that a single feature is
insufficient to automatically identify if a tweet is disaster relevant. Therefore this
chapter combines the features discussed above and tests several combinations to
present a number of subsets of tweets that emergency services can choose from.
Instead of looking only for image, or only for location or keywords, this chapter
combines all four features by assigning a score to each of the features to create a
relevance score for each tweet using multiple linear regression, as described in
Chapter Three. Using this relevance score emergency services can then
operationalise this framework in order to narrow down the number of tweets they
receive. Using this scoring system, each incoming tweets gets a score based on the
formula and emergency services can choose to sort and look at the top 100 tweets
or choose to look at a subset of tweets that reaches a certain relevance score. By
doing this, emergency services can reduce the number of tweets to a manageable
quantity in order to gather intelligence about the status of the disaster or assist
184
people in need. The following section revisits the sub research questions to explain
the findings and why the features are combined.
6.1 Sub RQ1: Identifying Relevant tweet for emergency services
The primary question for this research is what type of tweet is considered relevant
by emergency services after a natural disaster. Since relevance is a subjective term
it is a problematic topic to address. Therefore to explore this, literature related to
emergency services were consulted to identify what is considered relevant
information by emergency services after a natural disaster. Based on the literature,
it can be suggested that there various types of information emergency services look
for after a natural disaster. They include which areas are affected, how much help is
needed, what type of help is needed and is it possible to reach that place with usual
transportation methods. Identifying priority areas are important to ensure help is
reaching in the right areas. It is also a priority for emergency services to be aware of
the early volunteers in order to integrate them into the relief and rescue operation.
. Thus, these are the information that is considered relevant for emergency services
after a natural disaster.
Therefore, obtaining information from social media to assist with such assessments
would be useful. However gathering actionable information is a challenging task.
That is why in recent years emergency services have been looking at social media to
find this information. Unfortunately this is such a new area for emergency services
that present social media guidelines by emergency services only focus on
information dissemination rather than information gathering.
Numerous academic studies however have attempted to address the lack of
guidelines with regards to information gathering from social media (Bruns, Burgess,
Crawford, & Shaw, 2012; Imran, Elbassuoni, Castillo, Diaz, & Meier, 2013; Lau, Tao,
Tjondronegoro, & Li, 2012; Murthy & Longwell, 2013; Panem, Gupta, & Varma,
Chapter Six: Discussion 185
2014; Starbird, Palen, Hughes, & Vieweg, 2010; Vieweg, 2012). This has resulted in
creating various types of information categories and coding categories. Among
them some of the most relevant ones for this research are created by Vieweg
(2012) and Bruns et al. (2012) which were described in Chapter Two. However
these coding categories usually identify what is in the tweet rather than what
information emergency services look for from the tweets. Therefore, during the
course of this research the categories from Bruns et al. (2012) and Vieweg (2012),
as well as the needs from disaster management literature, were combined to create
the coding category, 3R ‐ Request, Report, Reaction, to assist to find tweets that
are relevant for emergency services.
Request deals with information that is related to help seeking behaviour. It can be
seeking basic amenities such as food and water, medical assistance, seeking shelter
or seeking information such as on amissing person. As long as the user is seeking
something, it is grouped under Request.
Report on the other hand is the information provided by people with regards to the
damage caused by the disaster. It can be a report about their personal property,
public property, or environmental destruction.
Reaction is mostly about community self reporting in response to the situation. This
can be of two types; one is about reactions regarding the efforts of emergency
services and the other is about the volunteers who are often the first responders
after a natural disaster. As it is identified by the literature as something emergency
services look for, identifying such reactions is also included as relevant for
emergency services.
However, existence of a Request, Report, or Reaction may not always be relevant if
they do not contain priority or specific information. For example someone reporting
about slight change of the floodwater has less priority then someone reporting
about a building collapsing in the water next to a particular street. Therefore in
order to identify which information is more relevant for emergency services,
Specificity and Urgency were introduced.
186
A strong relationship between existence of four features and the tweet being
relevant for emergency services was found after analysing the tweets from the
#qldfloods and Yolanda datasets. Based on the manual analysis using the coding
categories as well as specificity and urgency, including images, locations and
desirable keywords and not having undesirable keywords were identified as
markers that can determine if a tweet is relevant for emergency services.
In addition it was also found that among the three categories, the Report category,
and especially Report of Damage, had the highest percentage of high ranked
tweets. Therefore in the automated section the focus was to find these features
automatically in order to determine if the tweet was likely to fall into the Report of
Damage category.
6.2 Sub RQ 2: Identifying relevant tweets automatically
The second component of the central research question of this dissertation is to
automatically identify if a tweet is likely to be disaster relevant. In Chapter Four it
was found that identifying existence or non existence of four features indicate
disaster relevance of a given tweet. In order to automatically identify tweets that
are relevant for emergency services, the automated analysis phase employed
various tools to find these four features in the tweets. As mentioned in the previous
section, as Report of Damage had the highest percentage of disaster relevant
tweets among the Report, Request and Reaction categories, the focus was limited
to findings tweets that fall in the Report of Damage category. However when the
set of tools were run through both the #qldfloods and Yolanda datasets for each of
the four features, it resulted in both positive and negative findings. These are
discussed in more detail below.
Chapter Six: Discussion 187
6.2.1 Existence of image
The results of this study indicate that tweets in the Report of Damage category
(damage of infrastructure, environment, public, private property) had a higher
proportion of images compared to other categories. Even though having an image
does not mean that the tweet is relevant for emergency services or belongs to
Report of Damage category, it increases the chances significantly.
The proportion of images is dependent on the type of disaster, and other
circumstantial factors (e.g., the time of day the disaster strikes). In addition, the
presence of images may increase over time as more people have smartphones.
However the findings suggest that the existence of an image is an important marker
of relevance for disaster relevant tweets. In case of the misuse of a hashtag to post
images that might be irrelevant, it should still be scored highly to increase the
chance that it be evaluated by emergency services so that emergency services can
discard those irrelevant tweets.
6.2.2 Specific location
In both datasets that were analysed, finding specific location information proved to
be a good marker of relevance for emergency services. Eliminating generic names
such as country, city or large suburbs improved the chance of finding specific
locations.
However using string generic name filtering may not work in all disasters. In other
disasters such as in a tornado, the locations might need to be filtered by suburbs.
And in the case of floods, named entities may need to include the whole suburb.
Therefore having a fixed formula that identifies or eliminates certain type of
locations is likely to introduce errors into the results.
This can be addressed by introducing a set of rules that uses geographical
information systems to look for locations based on the type of disaster in progress.
188
If the disaster in question covers large areas (such as a tsunami or earthquake), the
system may eliminate country and state names but focus on cities. In the case of a
smaller scale disaster, the system can focus on the suburbs and include cities in the
list of names that is considered generic. Therefore by introducing a dynamic list, it
can include and exclude location names in specific and generic categories.
6.2.3 Desirable keywords for emergency services
Although keywords are the components that puts the tweet into a context, as a
word can have many different meaning, finding the right context based on the
keyword alone is a complex challenge. This was seen from the findings of the
desirable keywords. Keywords that were identified as desirable for emergency
services through manual analysis were found to create mixed results in automated
analysis. From the findings from the Yolanda dataset it was found that desirable
keywords were present in higher percentages in categories that were relevant for
emergency services. However, in the #qldfloods dataset desirable keywords were
not present in high percentage in the relevant category.
However, as Yolanda had a larger number of tweets to evaluate and the existence
of desirable keywords were more prominent in the Report of Damage
(Infrastructure Damage) category, it is possible that existence of desirable keywords
indeed be an important marker of relevance. In addition, the analysis only used a
small set of keywords that were identified through manual analysis to be disaster
relevant. Extending such keywords by introducing a public dictionary where
researchers and emergency services can add relevant words may improve the
results.
Chapter Six: Discussion 189
6.2.4 Undesirable keywords for emergency services
Similarly, undesirable keywords were found to be more suitable to identify
irrelevant tweets in #qldfloods. However in the Yolanda dataset undesirable
keywords were present in all categories in almost equal percentages. On the other
hand, in #qldfloods they were present mostly in categories that had irrelevant
tweets. Therefore similarly to desirable keywords, a public dictionary of undesirable
keywords may enhance the results.
Overall as it can be seen from the findings from the automated analysis in Chapter
Five, none of the features can identify disaster related tweets alone even though
each feature carries certain characteristics that can help to identify if a tweet is
relevant for emergency services. Therefore in the next section, an approach for
combining these features to evaluate the likely relevance of each tweet to
emergency services personnel is presented. By generating a relevance score for
each tweet this approach can be used to select a subset of tweets for closer manual
review.
6.3 Combining Features
In the methodology chapter it was mentioned that for combining multiple features,
multiple linear regression (Culotta, 2010) is as it is used by other researchers to
analyse posts in social networks and search engine queries to predict crisis related
situations (Abel & Houben; Bodnar & Salathé, 2013).
Therefore this section uses the multiple linear regression formula to identify a total
relevance score from each tweet. In order to do so, it multiplies each of the
features with their respective coefficient and combines them to create a score.
190
From the discussions so far in this dissertation the features that can be used as
To have already been identified. They are: RT, image, location, desirable
keywords and undesirable keywords. However, the coefficients to use ( To )
with them is not determined yet. As discussed in the methodology chapter, a
regression coefficient can be identified using the difference between the random
chance of tweet being disaster relevant and the chance of tweet being disaster
relevant when a specific feature is present.
In order to find the regression coefficients, firstly the random chance that a tweet is
likely to be disaster relevant must be identified. This is followed by then finding the
chance of a tweet being relevant if any of the specific features exist in the tweet.
After that, their difference is calculated to identify the regression coefficient.
6.3.1 #qldfloods dataset
As mentioned earlier, the first step in identifying the regression coefficient is to
identify the random chance that a tweet is relevant for emergency services and
then how much improvement each of the features make. Therefore, this section
identifies for the #qldfloods dataset the chances that a tweet is relevant and the
increase or decrease in chances for each of the variables. For the purpose of
coefficient identification the same sample from the automated analysis was used.
As mentioned earlier, retweets were removed from this sample.
Identifying random chance in #qldfloods The #qldfloods dataset that was
analysed in Chapter Four and Five, was divided in four categories. Among them,
three were relevant to emergency services and the rest were grouped under
Others, which included spam, personal narrative or other tweets that were
considered as irrelevant for emergency services. All tweets (without RT) from the
#qldfloods sample could be separated into the following breakdown (Table 15).
Chapter Six: Discussion 191
Theme Coding Categories Tweet Count
Report Report of damage 241
Reporting community behaviour 89
Request Request for information 19
Request for material support 11
Request for other types of help 5
Reaction Reaction from community 145
Others Other not relevant categories 810
Total 1320
Table 15: Tweet counts in their coding categories (#qldfloods)
In order to determine the chances a random tweet belongs to a certain category
this data can be utilised to create a probabilistic estimation. Since the categories
are not dependent on each other, this estimation utilises an independent
probability formula. The probability that any tweet belongs to a certain category
can be calculated by dividing tweets from that category by the total number of
tweets in the dataset. For example, to find out the probability that a random Tweet
is about report of damage it can be written this way:
P (Report of Damage tweet) =
Here, the probability that a given tweet is a tweet about damage is calculated
based on total count of tweets that has been identified as damage tweet divided by
total tweets available. Using the formula, the P (damage tweets) = 18.25% which
means, for the #qldfloods dataset, if a tweet is picked randomly, there is a 18.25%
chance that this tweet is going to be a Report of Damage tweet.
The same calculation is extended to other categories and based on this calculation,
Table 16 shows that, there is a high chance that any random tweet is likely to be a
tweet from another group instead of from the Request for Material Support
category. This is because there is less than 1% chance a tweet is a request for
192
material support while in the irrelevant categories this has a 61.36% chance of
occurring.
Theme Coding Categories Probability calculation
P (tweet in this coding category)
Report Report of damage 241 /1320 = 18.25%
Reporting community behaviour 89 /1320 = 6.74%
Request Request for information 19 /1320 = 1.43 %
Request for material support 11 /1320 = 0.83%
Request for other types of help 5 /1320 = 0.37%
Reaction Reaction from community 145 /1320 = 10.98%
Other Other not relevant categories 810 /1320 = 61.36%
Table 16: Independent probability of a tweet belonging to a certain coding category (#qldfloods).
As mentioned earlier and can be seen from the table above, Report of Damage is
the largest category among all those that are relevant for emergency services.
Therefore the rest of the chapter uses the Report of Damage category as the
benchmark to find if having a specific feature increases the chance of being relevant
to emergency services compared to random chance.
Increasing the chance of being in the Report of Damage category with specific
features Four features have been discussed in detail in this dissertation as
markers that can identify if a tweet is likely to be relevant for emergency services.
The next step is to find out if having these specific features increases the probability
that the tweet is likely to fall in the Report of Damage category. As mentioned in
the methodology chapter, this can be calculated using conditional probability with
dependent events using following formula.
P (E2 | E1) =
Probability increment with the image feature To find the conditional probability,
first it is necessary to understand what is being looked for. In the automated
Chapter Six: Discussion 193
analysis chapter it is already found that it is possible to identify if a tweet has an
image. Therefore the question is, if it is found that the incoming tweet has image,
what are the chances that it will fall in the Report of Damage category?
By putting this information in the formula, it can be seen that E1 is the image and
E2 are the tweets that belong to the Report of Damage category. Therefore the
formula can be re written in this way:
Probability of a tweet being in the Report of Damage category because it has
image = Probability of a tweet that both has an image and is in the Report of
Damage category divided by the probability of a tweet having an image.
Based on the counts in Table 17 it can be seen that the probability of image p(E1) is
153/1320, and P(E2) probability of a tweet that has both image and falls in the
Report of Damage category is 83/1320. Therefore, the probability can be written as:
P (Report of Damage | Image) = = = 54.25%
Type of URL Report of damage
All other groups
Total
Image 83 70 153
Other URL or No URL 158 1009 1167
Total 241 1079 1320
Table 17: Tweet counts based on Report of Damage and images
This means that for a random tweet that is picked from the group of tweets that
has an image in them, there is a 54.25% chance that the tweet is a damage report.
This is better than 18.25%, the random chance that a tweet belongs to the Report
of Damage category and confirms that for the #qldfloods dataset, tweets that have
an image are more likely to be disaster relevant. Similarly, when P (Report of
Damage | Not Image) was calculated, it was found to be 13.25%. The same formula
194
is now applied to the other categories. However for brevity, the entire explanations
are not repeated for each of the features.
Probability increment with Specific Location Similar to image, count of tweets
that have a location is detailed in Table 18. Using the above formula, it can be
calculated that, P (damage tweets | specific location) = 59/132 = 44.06%. And, P
(damage tweets | Generic or no location) = 182/1188 = 15.32%. This confirms that
if the tweet contains mention of a location the probability of that tweet being in
Report of Damage category is higher than random chance of it being in that
category. And if it does not have a mention of a specific location, the probability is
lower than the random chance.
Type of location Report of damage
All other groups
Total
Generic location or no location 182 1006 1188
Specific location 59 73 132
Total 241 1079 1320
Table 18: Tweet counts based on their location
Probability reduction with keywords from the undesirable keyword list Table 19
lists the count of tweets that had any word from the undesirable list of keywords.
Based on the calculation P (damage tweets | undesirable keyword) = 9.26% and P
(damage tweets | not undesirable keywords ) = 19.06% it can be seen that if a
tweet has undesirable keywords, it reduces the probability of it being a tweet about
damage by half.
Chapter Six: Discussion 195
Type of Keywords Report of damage
All other groups
Total
No undesirable keywords 231 981 1212
Undesirable keywords 10 98 108
Total 241 1079 1320
Table 19: Tweet counts based on undesirable keywords list
Probability increment with a keyword from the desirable keyword list Using the
same formula to only keywords that belong to the Report of Damage category
(Table 20), it can be seen that P (damage tweets | damage words) = 21.06% and P
(damage tweets | other words) = 16.44%. This suggests that for the #qldfloods
dataset having desirable keywords did not increase the chance that a tweet is likely
to be a Report of Damage significantly.
Type of Keywords Report of Damage
All other groups
Total
Words from Report of Damage category (desirable keywords)
109408 517
Other words 132 671 803
Total 241 1079 1320
Table 20: Tweet counts based on desirable keywords list
Comparing probability with random chance When all the probabilities are
combined (Figure 49) it can clearly be seen that the image and specific location
features significantly increase the probability of a tweet being in the Report of
Damage category and therefore of being relevant for emergency services. Desirable
keywords do not increase the chance that a tweet is likely to be relevant for
emergency services, but undesirable keywords reduce the probability by almost
half.
196
Figure 49: Comparing probability of tweets with and without features with random chance (#qldfloods)
Calculating regression coefficient Previously in Chapter Three it was mentioned
that one of the way to identify regression coefficients is to find the division
between random chance and conditional probability of each of the features. Table
21 lists all the conditional probability outcomes that have been discussed in this
section. To evaluate the difference from random chance, each conditional
probability was divided by the random chance to find their difference.
As it can be seen from Table 21, by including an image the probability of a tweet
increases significantly and by not having image, it reduces the probability. The
difference between the probability score with image is 2.97 times more than
random chance and 0.72 less than random chance for without an image. Both of
these values can be used as a regression coefficient.
Chapter Six: Discussion 197
Probability a tweet is related to damage
Difference from random chance
Random chance to be tweet about damage 18.25% N/A
With image 54.25% 2.97 ▲
Without image 13.25% 0.72 ▼
With specific location 44.06% 2.41 ▲
Without specific location 15.32% 0.83 ▼
With desirable keywords 21.06% 1.15▲
Without desirable keywords 16.44% 0.9▼
With undesirable keywords 9.26% 0.5 ▼
Without undesirable keywords 19.06% 1.04 ▲
Table 21: Random probability and difference with random chance in #qldfloods
dataset Similarly to the image feature, for a random tweet that is picked from the
group of tweets that has a specific location in them, there is a 44.06% chance that
the tweet is a damage report. This is 2.41 times more than the random chance
identified in Table 21. For tweets that do not have a specific location, the chance
that it belongs to the Report of Damage category is lower than the random chance.
By calculating the values, it can be seen that it is 0.83 times less, which means the
chance is further even reduced. Similarly to the image coefficient, this difference is
used as the regression coefficient in the combined features.
However, having desirable keywords related to damage only increases the
probability by 1.15 times. In comparison, not having desirable keywords from the
damage list reduces the chance very slightly (0.9 times). Based on the calculation it
can be suggested that words from the desirable keywords list introduces a small
positive correction, but does not improve the chance dramatically.
Conversely, having word from the undesirable keyword list reduces the probability
that the tweet is relevant to emergency services. If there is an undesirable keyword
198
in the tweet, it reduces the chance that the tweet may belong to the Report of
Damage category by 0.5 times. However, if there are no undesirable words it does
not increase the probability significantly – the chance increases from 1 to 1.04
times. In order to create a regression coefficient that is not only limited to the
#qldfloods dataset, the same steps were applied to the Yolanda dataset as well.
6.3.2 Yolanda dataset
To identify random chances and regression coefficients from the Yolanda dataset,
the same 22,084 tweets that were used in Chapter Five were used in this section.
The initial 230,000 tweets were reduced to this number based on the agreement
percentage, retweet removal and time of capture as is explained in Chapter Four
and Five. Similar to the #qldfloods dataset, the process was to identify the random
chance, followed by finding conditional probability of each of the features against a
category that matches the coding category of Report of Damage in the Yolanda
dataset, Infrastructure damage.
Identifying random chance in Yolanda Similar to #qldfloods, the first step was to
find out the random chances for a tweet in Yolanda tweets. Using the P (Tweet in
coding category) = the probability of a given tweet to be in
that category can be seen from Table 22.
Once the random chance has been identified, the next step is to find the probability
with or without the identified features. In order to keep it consistent with the
#qldfloods analysis as well as to compare, the coding category used from Yolanda
dataset was Infrastructure Damage, which is also about reports of damage. In the
remainder of this section the conditional probability of a tweet being in the
Infrastructure Damage category is calculated for each the features.
Theme Coding Categories Tweets in the category
Probability calculation
P (tweet in this coding
Chapter Six: Discussion 199
category)
Relevant Infrastructure damage 295 295 / 22,084 = 1.33%
Request for help 420 420 / 22,084 = 1.9 %
Population displacement 67 67 / 22,084 = 0.3 %
Irrelevant Not English 2,303 2,303 / 22,084 = 10.43 %
Relevant but other 1,477 1,477 / 22,084 = 6.68 %
Not relevant / Skip / RT 17,522 17,522 / 22,084 = 79.34%
Total 22,084
Table 22: Independent probability of a tweet belonging to a certain coding category in Yolanda tweets
Once the random chance has been identified, the next step is to find the probability
with or without the identified features. In order to keep it consistent with the
#qldfloods analysis as well as to compare, the coding category used from Yolanda
dataset was Infrastructure Damage, which is also about reports of damage. In the
remainder of this section the conditional probability of a tweet being in the
Infrastructure Damage category is calculated for each the features.
Probability increment with image feature The same formula that is used in
qldfloods dataset is used with images in Yolanda to identify P (infrastructure
damage tweets | image). Using the values listed in Table 23 it can be seen that P
(infrastructure damage tweets | image) = 3.33% and P (damage tweets | not
image or other URL) = 1.2%
Type of URL Infrastructure damage
All other groups
Total
Image 36 1,043 1,079
Other URL or No URL 259 20,746 21,005
Total 295 21,789 22,084
Table 23: Tweet counts based on Infrastructure Damage and image
Probability increment with Specific Location Using the same formula, it can be
seen from Table 24 that, P (infrastructure damage tweets | specific location) =
4.11% and, P (infrastructure damage tweets | Generic or no location) = 0.89 %.
200
Type of location Infrastructure damage
All other groups
Total
Specific location 123 2,804 2,927
Generic location 172 18,985 19,157
Total 295 21,789 22,084
Table 24: Tweet counts based on Infrastructure Damage and location
Probability reduction with undesirable keywords Using the same formula to not
relevant keywords, it can be seen (Table 25) that P (infrastructure damage tweets |
undesirable word) = 0.76% and P (infrastructure damage tweets | other words) =
1.42% .
Type of Keywords Infrastructure damage
All other groups
Total
Undesirable keywords 24 3,103 3,127
No undesirable keywords
271 18,686 18,957
Total 295 21,789 22,084
Table 25: Tweet counts based on Infrastructure Damage and undesirable keywords
Probability increment with desirable keywords Applying the same formula to only
desirable keywords, it can be seen (Table 26) that P (infrastructure damage tweets
| desirable keywords) = 6.4% and P (infrastructure damage tweets | other words)
= 0.55%
Type of keywords Infrastructure damage
All other groups
Total
Desirable keywords 189 2,938 3,127
No desirable keywords
106 18,851 18,957
Total 295 21,789 22,084
Table 26: Tweet counts based on Infrastructure Damage and desirable keywords
Comparing probability with random chance Similar to #qldfloods, when the
probabilities are compared it can clearly be seen that the image and specific
Chapter Six: Discussion 201
location features significantly increase the probability of a tweet being about
infrastructure damage. Although desirable keywords in the #qldfloods dataset did
not result in significant increases in the chance of a tweet being about Report of
Damage, in the Yolanda dataset, it can be seen that tweets that had desirable
keywords are more likely to be disaster relevant. Undesirable keywords on the
other hand were not as good of an indicator as in #qldfloods to identify irrelevant
tweets.
Figure 50: Comparing probability of tweets with and without features with random chance (Yolanda)
Calculating regression coefficient Similar to #qldfloods, the coefficient is
calculated by dividing the conditional probability score of each feature by random
chance. While a random tweet has a 1.3% chance of being in the Infrastructure
Damage category, with images, the chance increases by 2.56 times, while not
having an image reduces the chance by 0.9 times. Both of these values are used as
coefficients.
202
Probability of a tweet to be about infrastructure damage
Regression coefficient
Random chance to be tweet about infrastructure damage
1.3% N/A
With image 3.33% 2.56 ▲
Without image 1.2% 0.92 ▼
With specific location 4.11% 3.16 ▲
Without specific location 0.89% 0.68 ▼
Desirable keywords 6.4% 4.92 ▲
Without desirable keywords
0.55% 0.42 ▼
Undesirable keywords 0.76% 0.58 ▼
Without undesirable keywords
1.42% 1.09 ▲
Table 27: Random probability and regression coefficients of Yolanda dataset
As it can be seen in the Table 27, using specific location improves the probability by
3.16 times. On the other hand, having a generic or no location reduces the
probability by 0.68 times. Although the reduction is close to #qldfloods dataset (0.8
times), the probability of finding an infrastructure damage tweet given it has a
specific location is higher (2.41 times in #qldfloods dataset). This suggests that such
multiplier values need to be adjusted depending on the dataset. Therefore an
average of these scores is used in the final coefficient, which is described in the
next section.
Undesirable keywords however only reduced the chance that the tweet is about
infrastructure damage by 0.58 times. This is different than #qldfloods where the
presence of an undesirable keyword was seen to be a better identifier of irrelevant
tweets as it reduced the probability by 50%. Similar to the #qldfloods dataset, in
Yolanda dataset not having an undesirable keyword in the tweet makes the
probability that a given tweet is about infrastructure damage 1.42%, which is only
Chapter Six: Discussion 203
1.09 times more than the 1.3% random chance. One key point to note is, for the
Yolanda dataset, a lot of the words that are not relevant for emergency services
such as prayer or God were included as a part of the hashtag (e.g.,
#prayForPhilippines). Such words were not counted as they were part of a multi‐
word combination. It is possible that including them will further increase the quality
of the algorithm.
The biggest difference with the #qldfloods dataset is in the category of desirable
keywords. As it can be seen from Table 27 and Figure 50, if there is a desirable
keyword in the tweet, it is 4.92 times more likely to be an infrastructure damage
tweets than by random chance. At the same time, if it does not have desirable
keyword it reduces the chance by 0.42 times. Both of these values are higher than
the #qldfloods dataset as the existence of desirable keywords in that dataset
increased the probability that the tweet is a report of damage by only 1.17 times
more than random chance. The issue with this finding is that word sense
disambiguation is a known and well established problem and relying on keywords is
likely to deliver error prone results. Therefore, using this as a part of the multi
factor combination is likely to result in a more reliable output rather than relying on
the single feature alone.
6.3.3 Combined regression coefficient
A combination of the random probability and regression coefficients is outlined in
Table 28. A few observations can be made from this table. In #qldfloods the random
chance that a tweet is likely to be in the Report of Damage category is much higher
than Yolanda – 18.25% chance in #qldfloods compared to 1.3% chance in Yolanda.
However, when the regression coefficients were calculated it was found that there
is not a significant difference between the coefficients of both datasets. For
example, with image as a feature, there is 2.97 times increase in probability in
#qldfloods and 2.56 time increase in probability in Yolanda that the tweet is likely
to be in the Report of Damage category.
204
The only notable exception was the coefficient for desirable keywords. In the
#qldfloods dataset having desirable keywords only increased the chance by 1.15
times. However in Yolanda it increased the chance by 4.92 times. However, as
discussed earlier, word sense disambiguation is a known problem and using
average of 3.035 as coefficient is likely to introduce error in the result. Therefore
the coefficient for desirable keywords were marked to 2.5. In addition, as the
existence of location was found to be an important marker of relevance for
emergency services, the average is increased to 3 even though the average of
coefficient from Yolanda and #qldfloods is 2.75.
Dataset #qldfloods Regression coefficient
Yolanda Regression coefficient
Regression coefficient for testing
With image 2.97 ▲ 2.56 ▲ 2.75
Without image 0.74 ▼ 0.92▼ 0.8
With specific location 2.41 ▲ 3.16 ▲ 3
Without specific location
0.83 ▼ 0.68 ▼ 0.75
Desirable Keywords 1.15 ▲ 4.92 ▲ 2.5
Without desirable Keywords
0.9 ▼ 0.42 ▼ 0.75
Undesirable keywords 0.5 ▼ 0.58 ▼ 0.55
Without undesirable keywords
1.04 ▲ 1.09 ▲ 1.06
Table 28: Calculating Regression coefficients for final experiment
However, it is important to note that for each event the coefficient is likely to be
different. Given the objective of this research is not to find a specific regression
coefficient that works in all situations but to test the viability of scoring method, the
focus is how well the framework performs.
Chapter Six: Discussion 205
6.4 Result and Evaluation of Combined Features
This section presents the results of the combination of features. It evaluates if the
total relevance score calculated by using the factors established in the previous
section as coefficients in the regression calculation identifies tweets that are likely
to be disaster relevant. In order to do so, this section first demonstrates how
relevant scores are calculated for a given tweet. After that it explores the use of
various cutoff scores to show how the number of tweets presented to emergency
services can be affected by changing settings. This is then followed by an evaluation
of the results based on the crowd coded tweets.
6.4.1 Scoring each tweet
In the earlier section several features were identified. In this section all the
regression coefficients are developed. By applying both the variables and the
regression coefficients, each tweet can now receive a score by using a multiple
regression formula. For example, by using the formula scores of these two tweets
are calculated in Table 29.
206
Tweet Cnr Coro Drv and Hale St. Go‐Between bridge on ramp #aquapocolypse #qldfloods http://twitpic.com/3p9jmq
Score = 1 (specific location) * 3 + 1 (image) * 2.75 + 1 (no desirable keyword) * 0.75 + 1 (no undesirable keyword) * 1.06= 7.56
Tweet Please keep my family friends + everyone in QLD Australia in your prayers. #QLDfloods
Score = 1 (generic location) * 0.75 + 1 (no image) * 0.8 + 1 (desirable keyword) * 2.5 + 1 (undesirable keyword) * 0.55 = 4.6
Table 29: Calculating relevance score of sample tweets
As it can be seen from these two tweets, a tweet that is likely to be relevant for
emergency services receives a higher score compared to a tweet that is likely to be
irrelevant for emergency services. In the first place, this allows incoming tweets to
be ranked according to their likely relevance. For example, tweets with a higher
relevance score could be displayed more prominently to an emergency services
staff member monitoring the full feed of tweets than tweets with a lower score.
Additionally, tweets with a lower relevance score could be excluded from the feed
altogether, enabling the staff member to focus on the most relevant tweets only.
Therefore by creating a cut off score it is potentially possible to reduce the amount
of irrelevant tweets and only present a subset of relevant tweets to emergency
services so that they can manually evaluate and decide which of them are relevant
for them. The following part of this section discusses the effect of the cut off score.
6.4.2 Cut off score
To demonstrate how cut off score may help to reduce the number of tweets to a
manageable amount for emergency services, the scoring is applied on the same
22,084 tweets from Yolanda dataset. As it can be seen in Figure 51, increasing the
cut off score reduces the number of tweets that are considered relevant for
emergency services. Based on the figure, in the first case where the cut off score
was 3.0, the script considered 77% tweet as relevant for emergency services. When
it was increased to 4.0, that number was reduced to 45% of the tweet count. By
Chapter Six: Discussion 207
increasing the cut off even more, it reduced the tweet count even more and when
the score was above 5.0, less than 3% of the tweets were above the cut off score.
And of course, even within this reduced dataset tweets could be further ranked by
their individual relevance score.
Figure 51: Change in count and percentage of tweets from Yolanda dataset based on change of cut‐off score
The way this can help emergency services is that after a disaster when a large
volume of tweets appear, emergency services can use a higher cut of score to limit
the number of tweets they evaluate. If they have enough manpower or time, they
can reduce the score so that they can receive larger subset of tweets, which may
contain irrelevant tweets as well. And if they have even more manpower to read
the tweets, they can reduce the cut off score to an even lower number to see even
more tweet.
Another way emergency services can use this score is by sorting the tweets based
on their scores. Even if they do not use a cut off score, they can identify the high
208
scoring tweets to evaluate. In addition, these two approaches could also be
combined.
6.4.3 Evaluating output of the system using MicroMapper coding
The question remains, are the subset of tweets that were above the cutoff score
actually relevant? Since these 22,084 tweets from Yolanda were already
categorised by MicroMappers, overlaying them on top of the output generated by
the system can show if the algorithm has successfully identified relevant tweets.
For the purpose of this illustration, cut off scores of 4.5 to 4.8 and 5.0 were used.
Once the score is applied, only tweets that were above the score cut off were
presented here.
Figure 52: Change in percentage and count of tweets in above cut off score in their category
Based on Figure 52 it can be seen that when the cut off score was low, a lot of
tweets that were identified as not relevant by MicroMappers were also included in
Chapter Six: Discussion 209
the subset of tweets that require attention from emergency services. The higher
the score, the lesser counts of not relevant tweets appear. For example, by
increasing the cut off scores from 4.0 to 4.8, not relevant tweets were reduced
from 7981 tweets to 1233 tweets.
At the same time, the proportion of tweets from potentially disaster relevant
categories within the remaining dataset increases significantly with higher cut off
scores. This demonstrates that the relevance scores developed in this thesis enable
a targeted selection of potentially relevant tweets from the overall dataset.
It is also important to note that, when the cut off scores are increased tweets that
are relevant, such as those in the infrastructure damage category, were also
reduced. Therefore, the decision of which cut off score to use should be left to
emergency services who can increase the score or decrease it based on the sample
of tweets they would receive. If they see that by increasing the cut off score they
are not receiving many relevant tweets, they can decrease the cut off score.
Although this means increasing the number of tweets they need to look at, they
ensure they do not miss tweets that are likely to be relevant.
At this point it needs to be restated that the objective of this research is not to find
the perfect score. The objective is to provide an operationalisable framework for
emergency services so that, as the experts in the field, they can decide for
themselves what works best for them. If the agency only has a handful of people,
they should increase the cut off score to receive only a small number of tweets but
if they have a large team working with them, or are not pressed for time, they can
reduce it to accept potentially irrelevant tweets as well.
210
6.5 Limitations
As it can be seen from the chart of cut off scores (Figure 52), the algorithm is not
always accurate. Even though the cut off scores reduces irrelevant tweets, they still
appeared in the subset of tweets that received enough scores to be above the
threshold. This section below analyses the limitations and why it might have
occurred.
6.5.1 Infrastructure damage
Some tweets that were classified as irelevant by the scoring method but were
classified under the Infrastructure damage category by MicroMappers and vice
versa. This section discusses some of the cases where such mismatch has occured.
Breaking news were included as infrastructure damage Tweets such as
“#BreakingNews #YolandaPH Brownouts in Tacloban City confirmed by
@cebutechblogger Bert Padilla. Read more updates at:http://_” is problematic
because it was talking about breaking news. As the evaluators were people from all
aspects of life, it is possible that they feel that breaking news about damage should
be included as infrastructure damage. As it had both specific location name and
keyword, it was identified as relevant as well even though breaking news is unlikely
to be relevant for emergency services.
Location name in multi word hashtags was not picked up Another tweet that was
considered as relevant for emergency services but was not picked up by the
automatic scoring was “Typhoon‐damaged Petron Gas Station. #RoxasCity
#YolandaPH #HelpCapiz #RescuePH #Philippines http://t.co/yRJ4iB8uWT”. There
are two issues here, one is the image was not detected due to the deletion of the
referred image and the second is the name of the cities were included in the multi
word hashtag – Roxas City and Help Capiz. Although this issue can be addressed
using other algorithm that separates multi words in their individual words, this
went beyond the scope of this thesis and was not tested here.
Chapter Six: Discussion 211
Insufficient information was not picked up Another tweet that was identified as
relevant was “Again no electricity. #YolandaPH”. This was marked as relevant for
emergency services by many evaluators but was not picked up by the scoring
system as it did not have sufficient information. Tweets such as these are a genuine
issue as they do not contain enough information to be a source of information and
increasing the weight of the words are likely to result in more false positives.
Overall, it can be seen that MicroMappers have occasionally marked irrelevant
tweets as relevant. This can also be seen in the Request for Help category as well,
which is described next.
6.5.2 Requests for help
Tweets that were classified as irrelevant by the scoring method but were classified
under the Request for Help category had both genuine relevant tweets for
emergency services as well as irrelevant tweets
Reaching prominent personnel In Phase One, reaching out to prominent persons
was identified as a potential marker of relevance. However in Phase Two Part Two
it was found that reaching out to prominent personnel may not necessarily result in
tweets relevant for emergency services. This is potentially the reason why many
evaluators have marked tweets such as “@SMARTCares please restore the services
in Samar and Samar areas ASAP.#YolandaPH”, “@TheKhalilRamos #RescuePH
#HelpTacloban help us po!” and “@TheKhalilRamos #RescuePH Ilo‐Ilo needs help”
as relevant for emergency services. These tweets were not identified as relevant
based on their score but was identified as relevant for emergency services by the
MicroMappers.
One adjustment that could be used is, if the tweet is trying to reach prominent user
handles such as the Red Cross, it could be weighted higher. For example,
“@philredcross Please help to find @ReneePatron, Sonny Patron and Remy Patron
#tracingph #easternsamar #guiuan #YolandaPH” is relevant for emergency services
212
and the reason it was not identified as relevant was because the scoring system
only evaluated location names. If it were to calculate other named entities, it is
likely to find this information as well.
This finding is similar to the finding of Part One of Phase Two, which finds that
named entities may identify a place name such as building name as an organisation.
Therefore as long as named entity identifies a word as place, organisation or a
person it should be included as relevant for emergency services.
Uncertainty over inclusion Certain tweets did not have sufficient information or
were vague in nature. For example, “Save the Filipino people's in Visayas
#RescuePH” may appear relevant for emergency services by people but it is likely to
be more of a personal narrative rather than a call for help. Similarly, a tweet which
was classified as a request for help, “#Cebu volunteers needed in repacking relief
goods. For those interested, call Ms. Evelyn Senajon at 254‐7198 and 254‐8397.
#YolandaPH” is not really useful for emergency services because they are the one
likely to be calling for help!
Overall, the approach of combining several features to produce a relevance score
generates good results when evaluated against the work of the MicroMappers. Any
discrepancies between the results produced by the algorithm and the
MicroMappers’ evaluation are just as likely to be caused the MicroMappers as they
are to be a sign of issues with the algorithm presented here. Further evaluation of
this approach would therefore benefit from additional manual evaluation using a
team of coders – but this is outside the scope of this thesis and therefore was not
conducted.
6.5.3 Not relevant
There were interesting findings in the tweets that was marked as Not Relevant by
people but received enough scores to be classified as relevant for emergency
Chapter Six: Discussion 213
services by the scoring system. This section describes some of these tweets as well
as identifies the false positives.
Criminal activity was grouped as not relevant In previous chapters reports of
criminal activity was identified as relevant for emergency services. However there
were several tweets about looting such as this tweet, “Heard about the massive
looting in Gaisano Tacloban. So sad. #YolandaPH” that was identified as not
relevant by MicroMappers. Since the initial guidelines (see Figure 17, pg. 106) did
not ask people to look for such tweets, people might have included these as Not
Related. However as it had enough variables in them, it received a relevance score
to go beyond the cut off threshold.
Mentions of damage and information requests There were tweets that
mentioned damage but that MicroMappers have identified as not relevant. For
example, “my sister‐in‐law's house in brgy fabrica mobo masbate is ruined because
of super typhoon yolanda. manay marites be strong & dont loose HOPE!” should
have been included in the infrastructure damage category but was categorised
under not relevant by MicroMappers.
Similarly, “#YolandaPH / #Haiyan: Power cuts here in our place, they closed the
doors and I can hear crashing objects outside | @mikhaeladeleon in Leyte” also
updates the current situation but was identified as not relevant by MicroMappers.
However, as these tweets had a name of location, as well as words from relevant
categories, they have received enough score to be counted as relevant for
emergency services. Another tweet, “We desperately need updates from our
families in Tacloban City. #YolandaPH #tacloban” was classified as not relevant by
MicroMappers although it was clearly seeking for information, but the algorithm
picked it up as potentially relevant for emergency services by assigning high score.
This indicates that in such cases the automated relevance scoring algorithm may in
fact be more accurate in detecting relevant tweets than the crowdsourced
MicroMapping process.
214
Might be useful tweet One of the tweets, “here in Daet, Camarines Norte we are
experiencing gusty winds and scattered rain showers #YolandaPH .prayers for those
who will directly hit” was classified as relevant by the scoring system. The
interesting part about this tweet is, although it is not relevant at the given moment,
it might indicate a possible turn of the wind direction.
Based on the findings it can be seen that, in some instances the scoring system has
outperformed the human evaluator in identifying tweets that should have been
classified as relevant for emergency services.
6.6 Summary of Discussion
This discussion chapter started with addressing the research questions about
finding what is relevant for emergency services and how these can be filtered
automatically. Based on the findings of previous chapters some features were
identified as markers of relevance for emergency services. This chapter combined
them to create a framework that can filter out tweets that are relevant for
emergency services from irrelevant ones.
By using multiple linear regression it included all the features that were previously
identified to calculate total score of a tweet. After that, the result was compared
with the crowd coded categories to find out how closely they resembled human
coders. As it can be seen from the combination of features, the algorithm
successfully generated a relevance score for each tweet in the dataset. This chapter
has demonstrated that this score can then be used to rank tweets according to
their relevance to emergency services, and to exclude tweets below a certain
threshold score. Although it does not eliminate false positives and false negatives
completely, it mimics the human evaluation closely. In addition, it was also found
that in some instances human evaluators did not follow the instruction correctly as
Chapter Six: Discussion 215
well, making a number of false positives and false negatives in the evaluation data
itself.
Overall, findings from the combination of features suggest that it can be a useful
tool for emergency services to monitor social media and use it to gather
intelligence after a natural disaster. In the next and final chapter, the conclusions
from these findings and potential for future research are discussed.
216
Chapter 7: Conclusion
This thesis set out to answer the research question: How can information relevant
to emergency services be identified from Twitter automatically during and
following a natural disaster. In order to do that, an automated method of
evaluating whether an individual tweet may be relevant for emergency services
following a natural disaster was developed and tested. The new algorithm resulted
from iterative development and testing that assigns a relevance score to each
tweet. This score was based on four extractable features from tweets that were
identified as potential markers of relevance. Assignment of this relevance score
enables emergency services to decrease the number of incoming tweets they need
to review by using a cut off score to create subsets, or to sort them based on their
score and review a certain top percentage of the tweets.
The algorithm was developed and tested using a series of applied research phases
that ensure that the new procedure was developed systematically and iteratively.
the key issues related to identifying information from social media were introduced
in Chapter One. In Chapter Two, key literature was analysed to find out what is
considered relevant by emergency services. Chapter Three discussed various
existing methodological approaches and techniques used in identifying relevant
information from large datasets with manual and automated analysis was selected
to use in this research. The findings from manual analysis was presented in Chapter
Four, through which a new set of coding categories (Request, Report, Reaction) and
ranking (Urgency and Specificity) were proposed that can be used to group disaster
relevant information. In addition to the new coding categories, four features were
also identified that can be used to suggest to emergency services the potential
relevance of an individual tweet. In Chapter Five, the process and results of an
automated test of these four features (including the existence of images, specific
location, desirable and undesirable keywords) using a larger dataset was presented
Chapter Seven: Conclusion 217
in order to determine if these features could successfully identify disaster relevant
tweets. Using the findings presented in Chapter Five, Chapter Six showed how all
four features can be combined using a mathematical formula (multiple linear
regression) to create the framework that can be used by emergency services to
assign scores to each tweet. Using the scores, emergency services can then choose
to evaluate a smaller subset of tweets that are likely to contain disaster relevant
information, or sort incoming tweets based on their score to review top tweets.
In this final chapter, the project outcomes are summarised focusing on how these
key findings contribute to knowledge, this is followed by a discussion of the
limitations and potential directions for future research.
7.1 Implications and Contributions to Knowledge
In order to understand what makes a tweet relevant for emergency services after
natural disaster, this research tapped into various disciplines ranging from crisis
communication to computer science. Frameworks related to needs of emergency
services helped to understand what is relevant for them; theories of media and
communication helped to create coding categories that can be useful to look for
that information through the lens of social media; and tools and frameworks from
computer science helped to understand if this information can be identified
automatically with minimal human intervention. The following subsections explain
these contributions in further detail.
7.1.1 Crisis informatics
While reviewing disaster management literature, the need for actionable
information has been mentioned repeatedly (Acar & Muraki, 2011; Bodenhamer,
218
2011). Suggestions to use social media during disasters to gain critical intelligence
was also highlighted (Rothery, 2012). At the same time it was also mentioned that
the task of finding actionable information from social media is extremely
challenging (UNISDR, 2013). Coding categories by Vieweg (2012) and Bruns et al.
(2012) offered ways to group such information based on where they occur (e.g.,
social environment, built environment) (Vieweg, 2012) or type of information ( e.g.
media sharing, personal narratives) (Bruns., et al., 2012).
By combining the information needs of emergency services and the coding
categories, this research contributes to the current literature by proposing new
coding categories that is not based on specific features or environment and
therefore provide the flexibility of adopting future changes in features introduced
by Twitter or norms adopted by Twitter users. The proposed coding categories
suggest that information that is likely to be relevant for emergency services are
either Report, which includes reports of damage, Request, which includes requests
for help or basic amenities and Reaction, which includes community self reporting
with regards to emergency services effort. These proposed categories extends
current knowledge and understandings of what constitutes disaster relevance and
hopefully can be used by crisis informatics researchers in the future.
7.1.2 Emergency services
The second contribution is the introduction of four key features and the process of
combining these features that can be used by emergency services. The framework
of combining features as well as the tool developed during this research can be
applied by emergency services in their existing social media monitoring systems to
gather important intelligence after a natural disaster.
These features were identified from manual analysis after the tweets were grouped
using the coding categories and ranked based on Urgency and Specificity. Among
these features, the existence of images and specific locations were found to be
Chapter Seven: Conclusion 219
useful marker of relevance across both the datasets. The existence of desirable
keywords were highly relevant in the Yolanda dataset but not so in the #qldfloods
dataset. Similarly, the existence of undesirable keywords found irrelevant tweets in
the #qldfloods dataset but was not effective for the Yolanda dataset.
However, the assignment of relevant score based on the combination of all the
features using multiple linear regression was more effective in identifying disaster
relevant tweets with high accuracy. In some cases it even outperformed crowd
coded evaluation. The results of this study indicate that combining these features it
is possible to automatically identify whether a tweet may be relevant for
emergency services after a natural disaster. Using the output, emergency services
can then choose to evaluate a subset of tweets to find disaster relevant ones.
Depending on the human resources available, they can either lower the cut off
score and evaluate a large number of tweets or increase the cut off score and only
evaluate a small number of tweets. Overall, the algorithm and the framework of
finding features and combining them can assist emergency services to use Twitter
more effectively as a part of their social media monitoring system.
This novel finding contributes to the field of automatic identification of disaster
relevant information from tweets. It extends existing methods of dictionary lookup,
word sense disambiguation, part of speech tagging, counting frequency of unigram,
and bigram (Valero, Gómez, & Pineda, 2009; Verma et al., 2011; Vieweg, Hughes,
Starbird, & Palen, 2010; Vlachos, 2011) with the suggestion of focusing on image,
mentions of specific location, and desirable and undesirable keywords. The
combination procedure also proposes an alternative way of combining features
than suggested by Gupta et al. (2012) or Huang et al. (2014).
7.1.3 Research process
Twitter research in general is increasingly becoming multidisciplinary, and the
process used in this research can act as a guideline for future researchers who want
220
to work in multidisciplinary Twitter research. The process of creating coding
categories by manual evaluation and then applying the findings by developing an
algorithm that performs better than random chance, can be adopted by other
researchers working in the area of crisis communication, social media and large
datasets.
Researchers can also utilise the method of using crowd coded evaluation to set
benchmark and compare that with results from automated analysis in order to find
out how well their system mimics human evaluation. As utilising crowdsourced data
is gaining popularity (Liu, 2014; Rogstadius et al., 2013; Starbird, Muzny, & Palen,
2012), such a method can be useful approach for researchers.
7.2 Practical Uses
As an applied research project this research has a strong practical aspect. The final
outcome of this research can be directly used by emergency services to integrate
into their existing social media monitoring systems. In addition, machine learning
systems that can analyse Twitter data can also use the features identified in this
research to enhance their systems. The coding categories can also be used by
emergency services to group incoming Twitter messages for further study and
evaluation.
7.3 Limitations
The primary limitation of this research is that the method was evaluated on only
two natural disaster events. Applying the method on other types of natural
disasters such as an earthquake would have provided a more generalisable
Chapter Seven: Conclusion 221
approach. Secondly, the manual analysis process was dependent on the
researcher’s coding decisions for one dataset and the crowd’s decisions on another
dataset; both of these can be improved. For example, although the crowd coding
method is in itself innovative, there are no methods developed as yet for evaluating
crowd coded data. Even though there is an increasing interest in the research
community with regards to crowd coding, it is still in the early stages and requires
more research. Thirdly, trend of using Twitter features to perform only specific task
may change quickly. For example, with the increasing usage of the selfie in the
social media, image might be replaced by some other feature that will indicate
relevance. Fourthly, a system like this is always susceptible to trolls and mischief
because it uses hashtags to gather data and hashtags are often trolled. If the trolls
overtake the hashtag then the system is no longer useful, but it is common for
users to create a new hashtag if the previous hashtag is not longer useful. Fifthly,
the automated analysis of the datasets relied heavily on the researcher’s
programming ability and approaches and it is likely this automated phase of the
process may be extended using alternative approaches developed by other
programmers. In making this project open source, it is hoped that the findings of
this research will be adopted by others interested in this area in order to extend
and improve the outcomes. One example of such an improvement includes
development of a more rigorous mathematical model that might reduce the false
positives or false negatives that were seen in the findings from automated analysis
phase. Lastly, as new users join Twitter, new features get introduced, spammers,
scammers get smarter, trolling techniques improve; the current scoring system
needs re‐evaluation. Therefore for this system to be applicable in future, it needs to
go through constant changes so that it is up to date and able to withstand the
issues mentioned.
222
7.4 Future research
This section presents six potential directions for future research that could help
progress the research on uses of social media and crisis informatics further.
7.4.1 Better quality location detection
Identifying specific location names were found to be one of the most important
features to identify if a tweet is likely to be relevant for emergency services.
However, even with the state of the art Stanford Named Entity tool, there were
numerous errors.
One of the biggest issues was if a word was capitalised, it was considered as a
named entity. Therefore in many cases, there were false positives just because
there was a capital letter. In addition, certain locations were identified as a
company or organisation. This is problematic too as places such as building, which
often break in a disaster, would not be identified. Future research in this area
would be valuable.
7.4.2 Automated image recognition
Images were found to be an important marker to identify disaster relevant tweets.
However some of the tweets that had images and received high scores were not
relevant for emergency services. By adding an automated image recognition
algorithm it might be possible to identify if the image in a high score tweet is
actually disaster relevant.
Chapter Seven: Conclusion 223
7.4.3 Keyword detection and expansion
The method of keyword detection and expansion used in this research was
rudimentary. A method for expanding the list of keyword was experimented during
this project and documented in Appendix F. However, the problem with word sense
disambiguation existed throughout the dissertation.
Usage of undesirable keywords was extremely promising. In one dataset it
managed to identify irrelevant tweets in a large quantity but in another dataset it
did not have much success. However, having a curated list of undesirable keywords
may be useful for other systems that attempts to identity disaster irrelevant
tweets.
In addition, the list of desirable keywords can be useful for future research. By
creating a list of desirable keywords based on each disaster, and loading such set of
keywords in the automatic system might provide a more optimal output. Even
though an attempt was made (please see Appendix G, it was not completed as it
increased the scope of the research. However it showed potential and future
research in this area may bring fruitful results.
7.4.4 Hashtag identification and separation
One of the most complicated challenges in Twitter is to find out which hashtag will
become popular. Often it takes hours before knowing that the hashtag followed is
not the dominant hashtag. One potential way to address this is by exploring
contagion theory that was discussed in Chapter Two and was used to justify why
retweets should be eliminated, but has broader potential.
The possible direction is to analyse prominent users’ tweets and correlate multiple
prominent users’ hashtags to find which hashtag is getting popular. Since a
prominent user is likely to know about a disaster earlier or likely to report about it
earlier than others, analysing only selected users’ tweet may be more useful in
224
finding relevant hashtags than streaming all tweets from the API. Multi word
hashtags such as “prayForQld” can be broken down using the vitebri algorithm to
find “pray for qld”. After breaking hashtags it can then be sent to the algorithm to
find if it is in potentially relevant or irrelevant tweets.
7.4.5 Better weighting
Creating a better scoring algorithm to calculate relevance score may be useful as
well. Although this project has used multiple linear regression, there might be
models that are a better fit. In addition to that, at present the regression coefficient
was based on the multiplication of the probabilities based on one type of tweet
(tweets in the damage category). Finding the probability for other types of tweets
and creating an average from them may be more useful.
7.4.6 Twitter users
In this research only texts from the tweets were used to identify potentially disaster
relevant tweets. Users are another important area of Twitter and research into
users was not attempted in this research. However by combining the results of this
research with users, such as finding how users are connected and which type of
connection provides more relevant tweets, it might be possible to create an
algorithm that can better identify disaster relevant tweets.
7.4.7 Different disaster dataset
Last but not least, the findings were evaluated with only two datasets. Using
datasets from other disaster types such as earthquakes is likely to find if the
algorithm can work across all disaster datasets or is only limited to the datasets that
were tested. In addition, during this project various other types of analysis were
Chapter Seven: Conclusion 225
conducted such as sentiment analysis, parts of speech analysis, and co‐occurance of
words analysis. The results of the analysis can be found in the Appendices G to I. As
they were not fruitful they were not included in this thesis. However, they still
showed promise and therefore can be investigated further.
Social media is increasingly becoming a fixture in people’s lives, and the amount of
information that is available after a natural disaster in social media is likely to
continue to increase. The findings of this research can help in identifying actionable
information from these social media streams to assist emergency services
organisations to better target resources, improve response times, and hopefully
reduce the number of causalities.
226
References
Abbasi, A., Hassan, A., & Dhar, M. (2014). Benchmarking Twitter Sentiment Analysis Tools. In The 9th edition of the Language Resources and Evaluation Conference (pp. 823‐829). Reykjavik, Iceland: European Language Resources Association (ELRA)
Abbasi, M.‐A., Kumar, S., Filho, J., & Liu, H. (2012). Lessons Learned in Using Social
Media for Disaster Relief ‐ ASU Crisis Response Game. In S. Yang, A. Greenberg & M. Endsley (Eds.), Social Computing, Behavioral ‐ Cultural Modeling and Prediction (Vol. 7227, pp. 282‐289): Springer Berlin Heidelberg.
Abrahamson, Z. (2012). Gnip Twist, Lick, Dunk: A Tumblr Story | Company Blog.
Retrieved 22 Jan, 2013 from http://blog.gnip.com/oreo‐pride‐social‐media/ Acar, A., & Muraki, Y. (2011). Twitter for crisis communication: lessons learned from
Japan's tsunami disaster. International Journal of Web Based Communities, 7(3), 392‐402.
Aggarwal, C. C. (2011). An Introduction To Social Network Data Analytics. In C. C.
Aggarwal (Ed.), Social Network Data Analytics (pp. 1‐15): Springer US. Altay, N., & Green III, W. G. (2006). OR/MS research in disaster operations
management. European Journal of Operational Research, 175(1), 475‐493. Amari, S.‐I., Murata, N., Muller, K.‐R., Finke, M., & Yang, H. H. (1997). Asymptotic
statistical theory of overtraining and cross‐validation. Neural Networks, IEEE Transactions on, 8(5), 985‐996.
American Red Cross. (2011). More Americans Using Social Media and Technology in
Emergencies. Retrieved 06 July, 2013 from http://www.prnewswire.com/news‐releases/more‐americans‐using‐social‐media‐and‐technology‐in‐emergencies‐128320663.html
Anagnostopoulos, I., Kolias, V., & Mylonas, P. (2012). Socio‐semantic query
expansion using Twitter hashtags. In Semantic and Social Media Adaptation and Personalization (SMAP) (pp. 29‐34): Luxemberg IEEE.
Arel, I., Rose, D. C., & Karnowski, T. P. (2010). Deep machine learning‐a new frontier
in artificial intelligence research. Computational Intelligence Magazine, IEEE, 5(4), 13‐18.
Artman, H., Brynielsson, J., Johansson, B. J., & Trnka, J. (2011). Dialogical Emergency
Management and Strategic Awareness in Emergency Communication. In
References 227
Proceedings of the 8th International ISCRAM Conference (pp. 1‐9). Lisbon, Portugal. ISCRAM
Atkinson, G. M., & Wald, D. J. (2007). “Did You Feel It?” intensity data: A
surprisingly good measure of earthquake ground motion. Seismological Research Letters, 78(3), 362‐368.
Aulov, O., Price, A., Smith, J., & Halem, M. (2013). A Human Sensor Network
Framework in Support of Near Real Time Situational Geophysical Modeling. AGU Fall Meeting Abstracts, 1, A8. Retrieved from http://adsabs.harvard.edu/abs/2013AGUFMIN14A..08A
Bakshy, E., Hofman, J. M., Mason, W. A., & Watts, D. J. (2011). Everyone's an
influencer: quantifying influence on twitter. In Proceedings of the fourth ACM international conference on Web search and data mining (pp. 65‐74). Kowloon, Hong Kong: ACM.
Baldi, P., Brunak, S., Chauvin, Y., Andersen, C. A., & Nielsen, H. (2000). Assessing the
accuracy of prediction algorithms for classification: an overview. Bioinformatics, 16(5), 412‐424.
Bandari, R., Asur, S., & Huberman, B. A. (2012). The Pulse of News in Social Media:
Forecasting Popularity. In The 6th International AAAI Conference on Weblogs and Social Media (pp. 26‐33). Dublin, Ireland: ICWSM.
Banerjee, N., Chakraborty, D., Joshi, A., Mittal, S., Rai, A., & Ravindran, B. (2012).
Towards Analyzing Micro‐Blogs for Detection and Classification of Real‐Time Intentions. In Sixth International AAAI Conference on Weblogs and Social Media (pp. 391‐394). Dublin, Ireland.
Banerjee, S., & Pedersen, T. (2002). An Adapted Lesk Algorithm for Word Sense
Disambiguation Using WordNet. In A. Gelbukh (Ed.), Computational linguistics and intelligent text processing (Vol. 2276, pp. 136‐145): Springer Berlin Heidelberg.
Baym, N. K., Zhang, Y. B., & Lin, M. C. (2004). Social interactions across media. New
Media & Society, 6(3), 299‐318. Becker, H., Naaman, M., & Gravano, L. (2011, 17‐21 July). Beyond Trending Topics:
Real‐World Event Identification on Twitter. In Fifth International AAAI Conference on Weblogs and Social Media (pp. 438‐441). Barcelona, Spain: ICWSM.
Below, R., Wirtz, A., & Guha‐Sapir, D. (2009). Disaster category classification and
peril terminology for operational purposes. Center for Research on the Epidemiology of Disasters (CRED‐MunichRE), Working Paper(264). Retrieved
228
from http://www.cred.be/publication/disaster‐category‐classification‐and‐peril‐terminology‐operational‐purposes.
Bermingham, A., & Smeaton, A. F. (2010). Classifying sentiment in microblogs: is
brevity an advantage? In Proceedings of the 19th ACM international conference on Information and knowledge management (pp. 1833‐1836). New York, USA: ACM.
Berry, D. M. (2011). The computational turn: Thinking about the digital humanities.
Culture Machine, 12, 1‐22. Retrieved from http://people.cs.vt.edu/~kafura/CS6604/Papers/Digital‐Humanities.pdf.
Bindley, K. (2013). Boston Police Twitter: How Cop Team Tweets Led City From
Terror To Joy. Retrieved 10 February, 2014 from http://www.huffingtonpost.com/2013/04/26/boston‐police‐twitter‐marathon_n_3157472.html
Bird, D., Ling, M., & Haynes, K. (2012). Flooding Facebook‐the use of social media
during the Queensland and Victorian floods. Australian Journal of Emergency Management, 27(1), 27‐33.
Bodenhamer, M. (2011). Mid‐Term Review of the Hyogo Framework for Action
(HFA). Retrieved from http://www.unisdr.org/we/inform/publications/18197
Bodnar, T., & Salathé, M. (2013). Validating models for disease detection using
twitter. In Proceedings of the 22nd international conference on World Wide Web companion (pp. 699‐702). Rio de Janeiro, Brazil. : International World Wide Web Conferences Steering Committee.
Bollen, J., Mao, H., & Zeng, X. (2011). Twitter mood predicts the stock market.
Journal of Computational Science, 2(1), 1‐8. Bontcheva, K., & Rout, D. (2014). Making sense of social media streams through
semantics: a survey. Semantic Web, 5(5), 373‐403. Borra, E., & Rieder, B. (2014). Programmed Method: Developing a Toolset for
Capturing and Analyzing Tweets. Aslib Journal of Information Management, 66(3), 3‐3.
Boulos, M. N. K., Resch, B., Crowley, D. N., Breslin, J. G., Sohn, G., Burtner, R., . . .
Chuang, K.‐Y. S. (2011). Crowdsourcing, citizen sensing and sensor web technologies for public and environmental health surveillance and crisis management: trends, OGC standards and application examples. International Journal of Health Geographics, 10(1), 67.
References 229
boyd, d., & Crawford, K. (2012). Critical Questions For Big Data. Information, Communication & Society, 15(5), 662‐679. doi:10.1080/1369118x.2012.678878
Brin, S., & Page, L. (1998). The anatomy of a large‐scale hypertextual Web search
engine. Computer networks and ISDN systems, 30(1), 107‐117. Broniatowski, D. A., Paul, M. J., & Dredze, M. (2014). Twitter: Big data
opportunities. Science, 345(6193), 148. Bruns, A. (2011). How Long Is a Tweet? Mapping Dynamic Conversation Networks
on Twitter Using Gawk and Gephi. Information, Communication & Society 15(9), 1323‐1351.
Bruns, A. (2012). Ad Hoc Innovation by Users of Social Networks: The Case of
Twitter. In Z. für (Ed.), Zentrum für Soziale Innovation (pp. 1‐13). Vienna, Austria.
Bruns, A. (2014). Crisis Communication. In S. Cunningham & S. Turnbull (Eds.), The
Media and Communications in Australia (pp. 351‐355). NSW, Australia: Allen & Unwin.
Bruns, A., & Burgess, J. (2011a). New methodologies for researching news
discussion on Twitter. In The Future of Journalism: Cardiff University. Bruns, A., & Burgess, J. E. (2011b). The use of Twitter hashtags in the formation of
ad hoc publics. In 6th European Consortium for Political Research General Conference (pp. 1‐9). Reykjavik, Iceland.
Bruns, A., & Burgess, J. E. (2012). Local and global responses to disaster:# eqnz and
the Christchurch earthquake. In Disaster and Emergency Management Conference, Conference Proceedings (pp. 86‐103). Brisbane, Australia: AST Management Pty Ltd.
Bruns, A., Burgess, J. E., Crawford, K., & Shaw, F. (2012). CCI Floodsreport: #
qldfloods and@ QPSMedia: Crisis Communication on Twitter in the 2011 South East Queensland Floods. Retrieved from http://eprints.qut.edu.au/48241/
Bruns, A., & Liang, Y. E. (2012). Tools and methods for capturing Twitter data during
natural disasters. First Monday, 17(4‐2). Bruns, A., & Stieglitz, S. (2012). Quantitative approaches to comparing
communication patterns on Twitter. Journal of Technology in Human Services, 30(3‐4), 160‐185.
230
Bunce, S., Partridge, H., & Davis, K. (2012). Exploring information experience using social media during the 2011 Queensland Floods: a pilot study. The Australian Library Journal, 61(1), 34‐45.
Burant, T. J., Gray, C., Ndaw, E., McKinney‐Keys, V., & Allen, G. (2007). The Rhythms
of a Teacher Research Group. Multicultural Perspectives, 9(1), 10‐18. Burgess, J., & Bruns, A. (2012). Twitter Archives and the Challenges of "Big Social
Data" for Media and Communication Research. M/C Journal, 15(5). Burks, L., Miller, M., & Zadeh, R. (2014). Rapid estimate of ground shaking intensity
by combining simple earthquake characteristics with tweets. In Proceedings of the 10th National Conference in Earthquake Engineering (pp. 2‐11). Anchorage, AK: Earthquake Engineering Research Institute.
Burns, A. (2010). Oblique strategies for ambient journalism. M/c journal, 13(2). Byrt, T., Bishop, J., & Carlin, J. B. (1993). Bias, prevalence and kappa. Journal of
clinical epidemiology, 46(5), 423‐429. Cassa, C. A., Chunara, R., Mandl, K., & Brownstein, J. S. (2013). Twitter as a sentinel
in emergency situations: lessons from the Boston marathon explosions. PLOS Currents Disasters, 1. doi:10.1371/currents.dis.ad70cd1c8bc585e9470046cde334ee4b.
Castillo, C., Mendoza, M., & Poblete, B. (2011). Information credibility on twitter. In
Proceedings of the 20th international conference on World wide web (pp. 675‐684). New York, NY: ACM.
Cataldi, M., Di Caro, L., & Schifanella, C. (2010). Emerging topic detection on twitter
based on temporal and social terms evaluation. In Proceedings of the Tenth International Workshop on Multimedia Data Mining (pp. 4:1‐4:10). New York, NY, USA: ACM.
CBCnews. (2010). The world's worst natural disasters: Calamities of the 20th and
21st centuries. Retrieved 10 February, 2013 from http://www.cbc.ca/news/world/the‐world‐s‐worst‐natural‐disasters‐1.743208
Chen, R., & Sakamoto, Y. (2012). Perspective Matters: Sharing of Crisis Information
in Social Media. In Hawaii International Conference on System Sciences (pp. 2033‐2041). Hawaii, USA.
Cheong, F., & Cheong, C. (2011). Social Media Data Mining: A Social Network
Analysis Of Tweets During The 2010‐2011 Australian Floods. Paper presented at Pacific Asia Conference on Information Systems. Retrieved from http://aisel.aisnet.org/pacis2011/46
References 231
Choi, S., & Park, H. W. (2013). An exploratory approach to a Twitter‐based
community centered on a political goal in South Korea: Who organized it, what they shared, and how they acted. New Media & Society, 16(1), 129–148.
Chu, Z., Gianvecchio, S., Wang, H., & Jajodia, S. (2010). Who is tweeting on twitter:
human, bot, or cyborg? In Proceedings of the 26th Annual Computer Security Applications Conference (pp. 21‐30). Austin, Texas USA: ACM.
Collins, K. (2013). How AI, Twitter and digital volunteers are transforming
humanitarian disaster response. Retrieved 12 February, 2014 from WIred, http://www.wired.co.uk/news/archive/2013‐09/30/digital‐humanitarianism
Conover, M., Ratkiewicz, J., Francisco, M., Gonçalves, B., Menczer, F., & Flammini,
A. (2011). Political polarization on twitter. In Proceedings of the Fifth International AAAI Conference on Weblogs and Social Media (pp. 89‐96). Barcelona, Spain: AAAI.
Coombs, W. T. (2011). Ongoing crisis communication: Planning, managing, and
responding: Sage Publications. Corvey, W. J., Vieweg, S., Rood, T., & Palmer, M. (2010a). Twitter in mass
emergency: what nlp techniques can contribute. In Proceedings of the NAACL HLT 2010 Workshop on Computational Linguistics in a World of Social Media (pp. 23‐24). Los Angles, California: Association for Computational Linguistics.
Corvey, W. J., Vieweg, S., Rood, T., & Palmer, M. (2010b). Twitter in mass
emergency: what NLP techniques can contribute. Paper presented at Proceedings of the NAACL HLT 2010 Workshop on Computational Linguistics in a World of Social Media, Los Angeles, California.
Crooks, A., Croitoru, A., Stefanidis, A., & Radzikowski, J. (2013). # Earthquake:
Twitter as a distributed sensor system. Transactions in GIS, 17(1), 124‐147. Crowe, A. (2012). Disasters 2.0: The application of social media systems for modern
emergency management: CRC press. Cullum, B. (2010). What makes a hashtag successful. Retrieved April 8th, 2012 from
movements.org, http://www.movements.org/blog/entry/what‐makes‐a‐twitter‐hashtag‐successful/
Culotta, A. (2010). Towards detecting influenza epidemics by analyzing Twitter
messages. In Proceedings of the first workshop on social media analytics (pp. 115‐122). New York, NY, USA: ACM.
232
Dabner, N. (2012). ‘Breaking Ground’in the use of social media: A case study of a university earthquake response to inform educational design with Facebook. The Internet and Higher Education, 15(1), 69‐78.
Davidov, D., Tsur, O., & Rappoport, A. (2010). Enhanced sentiment learning using
twitter hashtags and smileys. In Proceedings of the 23rd International Conference on Computational Linguistics: Posters (pp. 241‐249). Stroudsburg, PA, USA: Association for Computational Linguistics.
Davis Jr, C. A., Pappa, G. L., de Oliveira, D. R. R., & de L. Arcanjo, F. (2011). Inferring
the Location of Twitter Messages Based on User Relationships. Transactions in GIS, 15(6), 735‐751. doi:10.1111/j.1467‐9671.2011.01297.x
DCS, Q. G. (2011). ‘All Hazards’ Information Management Program. Brisbane,
Australia: Queensland Government Retrieved from http://www.btrc.qld.gov.au/c/document_library/get_file?uuid=a4491bd2‐cfe5‐466b‐a003‐45f86878bc85&groupId=12276.
De Smedt, T., & Daelemans, W. (2012). Pattern for python. The Journal of Machine
Learning Research, 13(1), 2063‐2067. DeGroot, M. H., Schervish, M. J., Fang, X., Lu, L., & Li, D. (1986). Probability and
statistics (Vol. 2): Addison‐Wesley Reading, MA. Deller, R. (2011). Twittering on: Audience research and participation using Twitter.
Retrieved 3 Jan, 2013 from http://www.participations.org/Volume 8/Issue 1/deller.htm
DeMers, J. (2013). Twitter vs. Facebook: How Do They Compare? Retrieved 2nd
March, 2014 from Huffington Post, http://www.huffingtonpost.com/jayson‐demers/twitter‐vs‐facebook_b_3869786.html
Dewan, P., & Kumaraguru, P. (2014). It Doesn't Break Just on Twitter. Characterizing
Facebook content During Real World Events. arXiv preprint arXiv:1405.4820. Dixon, C. (2009). Machine learning is really good at partially solving just about any
problem. Retrieved 05 June, 2014 from http://cdixon.org/2009/08/20/machine‐learning‐is‐really‐good‐at‐partially‐solving‐just‐about‐any‐problem/http://cdixon.org/2009/08/20/machine‐learning‐is‐really‐good‐at‐partially‐solving‐just‐about‐any‐problem/
Dixon, D. (2012). Analysis Tool or Research Methodology: Is There an Epistemology
for Patterns? In Understanding Digital Humanities. Palgrave Macmillan. Dodds, P. S., Harris, K. D., Kloumann, I. M., Bliss, C. A., & Danforth, C. M. (2011).
Temporal patterns of happiness and information in a global social network:
References 233
hedonometrics and Twitter. PloS one, 6(12), e26752. Retrieved from http://journals.plos.org/plosone/article?id=10.1371/journal.pone.0026752. doi:10.1371/journal.pone.0026752
Döhling, L., & Leser, U. (2011). EquatorNLP: Pattern‐based Information Extraction
for Disaster Response. Paper presented at The 10th International Semantic Web Conference. Retrieved from http://iswc2011.semanticweb.org/fileadmin/iswc/Papers/Workshops/Terra/paper11.pdf
Domingos, P. (2012). A few useful things to know about machine learning.
Communications of the ACM, 55(10), 78‐87. Doughty, M., Rowland, D., & Lawson, S. (2012). Who is on your sofa?: TV audience
communities and second screening social networks. In Proceedings of the 10th European conference on Interactive tv and video (pp. 79‐86). New York, NY, USA: ACM.
Dufty, N. (2011). Using social media for natural disaster resilience (booklet). Dunlap, J. C., & Lowenthal, P. R. (2009). Tweeting the night away: Using Twitter to
enhance social presence. Journal of Information Systems Education, 20(2), 129‐135.
Dunning, T. (1994). Statistical identification of language: Computing Research
Laboratory, New Mexico State University. Dwoskin, E. (2014). In a Single Tweet, as Many Pieces of Metadata as There Are
Characters. Retrieved 12 september, 2014 from Wall Street Journal, http://blogs.wsj.com/digits/2014/06/06/in‐a‐single‐tweet‐as‐many‐pieces‐of‐metadata‐as‐there‐are‐characters/
Earle, P. S., Bowden, D. C., & Guy, M. (2012). Twitter earthquake detection:
earthquake monitoring in a social world. Annals of Geophysics, 54(6). Efron, M. (2010). Hashtag retrieval in a microblogging environment. In Proceedings
of the 33rd international ACM SIGIR conference on Research and development in information retrieval (pp. 787‐788). New York, NY, USA: ACM.
Ehrlich, K., & Shami, N. S. (2010). Microblogging inside and outside the workplace.
In Proceedings of the Fourth International AAAI Conference on Weblogs and Social Media (pp. 42‐49). Washington, D.C: AAAI.
Emergency Events Database. (2014). Natural Disaster Trend. Retrieved 20 July 2014
from Centre for Research on the Epidemiology of Disasters (CRED), http://www.emdat.be/natural‐disasters‐trends
234
Emergency Management. (2003). Queensland Emergency Alert Guidelines. Disaster
Management Act 2003. Retrieved from http://www.disaster.qld.gov.au/Disaster‐Resources/Documents/Queensland Emergency Alert Guidelines.pdf
Empson, R. (2012). Twitter: In The Final 3 Minutes Of The Super Bowl, There Were
10,000 Tweets Per Second. Retrieved 2012 from Techcrunch, http://techcrunch.com/2012/02/05/twitter‐in‐the‐final‐3‐minutes‐of‐the‐super‐bowl‐there‐were‐10000‐tweets‐per‐second/
Ezzy, D. (2013). Qualitative analysis: Practice and innovation: Routledge. Facebook. (2014). Facebook Reports Fourth Quarter and Full Year 2013 Results.
Retrieved from http://investor.fb.com/releasedetail.cfm?ReleaseID=821954 Farhi, P. (2009). The twitter explosion. American Journalism Review, 31(3), 26‐31. Fetter, G., & Rakes, T. (2012). Incorporating recycling into post‐disaster debris
disposal. Socio‐Economic Planning Sciences, 46(1), 14‐22. Fillmore, C. J. (1976). The need for a frame semantics within linguistics. In H.
Karlgren (Ed.), Statistical methods in linguistics (pp. 5‐29): Språkförlaget Skriptor.
Finin, T., Murnane, W., Karandikar, A., Keller, N., Martineau, J., & Dredze, M. (2010).
Annotating named entities in Twitter data with crowdsourcing. In Proceedings of the NAACL HLT 2010 Workshop on Creating Speech and Language Data with Amazon's Mechanical Turk (pp. 80‐88). Los Angeles, CA: Association for Computational Linguistics.
Finkel, J. R., Grenager, T., & Manning, C. (2005). Incorporating non‐local information
into information extraction systems by gibbs sampling. In Proceedings of the 43rd Annual Meeting on Association for Computational Linguistics (pp. 363‐370). Stroudsburg, PA, USA: Association for Computational Linguistics.
Fritz, C. E., & Mathewson, J. H. (1957). Convergence behavior in disasters: A
problem in social control: A special report prepared for the Committee on Disaster Studies: National Academy of Sciences National Research Council.
Garcia‐Herranz, M., Egido, E. M., Cebrian, M., Christakis, N. A., & Fowler, J. H.
(2012). Using Friends as Sensors to Detect Global‐Scale Contagious Outbreaks. PLoS ONE, 9(4), e92413. Retrieved from http://arXiv.org/abs/1211.6512. doi:10.1371/journal.pone.0092413
Gerlitz, C., & Rieder, B. (2013). Mining one percent of Twitter: Collections,
baselines, sampling. M/C Journal, 16(2).
References 235
Gilbert‐Knight, A. (2013). Social media, crisis mapping and the new frontier in
disaster response. Retrieved 12 May, 2014 from The Guardian http://www.theguardian.com/global‐development‐professionals‐network/2013/oct/08/social‐media‐microtasking‐disaster‐response?CMP=twt_gu
Ginsberg, J., Mohebbi, M. H., Patel, R. S., Brammer, L., Smolinski, M. S., & Brilliant,
L. (2008). Detecting influenza epidemics using search engine query data. Nature, 457(7232), 1012‐1014.
Glasgow, K., & Fink, C. (2013). Hashtag lifespan and social networks during the
london riots. In Social Computing, Behavioral‐Cultural Modeling and Prediction (pp. 311‐320): Springer.
Go, A., Bhayani, R., & Huang, L. (2009). Twitter sentiment classification using distant
supervision. CS224N Project Report, Stanford, 1‐12. González‐Bailón, S., Wang, N., Rivero, A., Borge‐Holthoefer, J., & Moreno, Y. (2012).
Assessing the bias in communication networks sampled from twitter. Social Networks, 38, 16‐27. doi:10.1016/j.socnet.2014.01.004
Goyet, D. C. d. V. d., & Morinière, L. C. (2006). The role of needs assessment in the
tsunami response. Retrieved from https://docs.unocha.org/sites/dms/Documents/TEC_Needs_Report.pdf
Gupta, A., Joshi, A., & Kumaraguru, P. (2012). Identifying and characterizing user
communities on Twitter during crisis events. In Proceedings of the 2012 workshop on Data‐driven user behavioral modelling and mining from social media (pp. 23‐26) Maui, Hawaii, USA.
Gupta, A., & Kumaraguru, P. (2012). Credibility ranking of tweets during high impact
events. In Proceedings of the 1st Workshop on Privacy and Security in Online Social Media (pp. 2:1‐2:8). New York, NY, USA: ACM.
Gupta, A., Lamba, H., Kumaraguru, P., & Joshi, A. (2013). Faking Sandy:
characterizing and identifying fake images on Twitter during Hurricane Sandy. In Proceedings of the 22nd international conference on World Wide Web (pp. 729‐736). Rio de Janeiro, Brazil International World Wide Web Conferences Steering Committee.
Gupta, P., Goel, A., Lin, J., Sharma, A., Wang, D., & Zadeh, R. (2013). Wtf: The who
to follow service at twitter. In Proceedings of the 22nd international conference on World Wide Web (pp. 505‐514). Rio de Janeiro, Brazil: International World Wide Web Conferences Steering Committee.
236
Guskin, E., & Hitlin, P. (2012). Hurricane sandy and twitter. Retrieved 12 May, 2014 from http://www.journalism.org/2012/11/06/hurricane‐sandy‐and‐twitter/
Haddow, G., Bullock, J., & Coppola, D. P. (2010). Introduction to Emergency
Management: Elsevier Science. Hale, S., Gaffney, D., & Graham, M. (2012). Where in the world are you?
Geolocation and language identification in Twitter. In Proceedings of ICWSM’12, pp (518‐521). Dublin, Ireland
Hall, P. (2007). Early warning systems: reframing the discussion. Australian Journal
of Emergency Management, The, 22(2), 32. Han, B., Cook, P., & Baldwin, T. (2013). Lexical normalization for social media text.
ACM Transactions on Intelligent Systems and Technology (TIST), 4(1), 5. Hannigan, J. (2013). Disasters Without Borders: The International Politics of Natural
Disasters: Wiley. Harcup, T., & O'neill, D. (2001). What is news? Galtung and Ruge revisited.
Journalism studies, 2(2), 261‐280. Harrald, J. R. (2006). Agility and discipline: critical success factors for disaster
response. The annals of the American Academy of political and Social Science, 604(1), 256‐272.
Harrigan, N., Achananuparp, P., & Lim, E.‐P. (2012). Influentials, novelty, and social
contagion: The viral power of average friends, close communities, and old news. Social Networks, 34(4), 470‐480.
Harrington, S., Highfield, T., & Bruns, A. (2012). More than a backchannel: Twitter
and television. In Audience Interactivity and Participation, (pp. 13‐17). Brussels, Belgium
Harris, B. (2013). Diplomacy 2.0: The Future of Social Media in Nation Branding.
Exchange: The Journal of Public Diplomacy, 4(1), 3. Harvey, D. (2014). The strangeness of scale at Twitter. Retrieved 2014 from TED,
http://www.ted.com/talks/del_harvey_the_strangeness_of_scale_at_twitter
Heath, S. E., Kass, P. H., Beck, A. M., & Glickman, L. T. (2001). Human and pet‐
related risk factors for household evacuation failure during a natural disaster. American journal of epidemiology, 153(7), 659‐665.
Helbing, D., & Balietti, S. (2011). From social data mining to forecasting socio‐
economic crises. The European Physical Journal ‐ Special Topics, 195(1), 3‐
References 237
68. Retrieved from http://dx.doi.org/10.1140/epjst/e2011‐01401‐8. doi:10.1140/epjst/e2011‐01401‐8
Hendrickson, S. (2012a). Gnip The Social Cocktail, Part 2 Expected vs. Unexpected
Events. Retrieved from http://blog.gnip.com/expected‐vs‐unexpected‐events‐in‐social‐media/
Hendrickson, S. (2012b). Social Media Pulse: The shape of breaking news on social
media. 1‐5. Retrieved from http://gnip.com.s3.amazonaws.com/ScottHendrickson/SocialMediaPulse.pdf
Hermida, A. (2013). Twitter as an Ambient News Network. In K. Weller, A. Bruns & J.
Burgess (Eds.), Twitter and Society (pp. 359‐372): Peter Lang. Hermida, A., Siapera, E., & Veglis, A. (2012). Social journalism: exploring how social
media is shaping journalism. The Handbook of Global Online Journalism, 309‐328.
Hossmann, T., Legendre, F., Carta, P., Gunningberg, P., & Rohner, C. (2011). Twitter
in disaster mode: Opportunistic communication and distribution of sensor data in emergencies. In Proceedings of the 3rd Extreme Conference on Communication: The Amazon Expedition (pp. 1‐6). New York, NY, USA: ACM.
Hovy, E., Navigli, R., & Ponzetto, S. P. (2013). Collaboratively built semi‐structured
content and Artificial Intelligence: The story so far. Artificial Intelligence, 194, 2‐27.
Hu, X., Zhang, X., Lu, C., Park, E. K., & Zhou, X. (2009). Exploiting Wikipedia as
external knowledge for document clustering. In Proceedings of the 15th ACM SIGKDD international conference on Knowledge discovery and data mining (pp. 389‐396). Paris, France: ACM.
Hu, M., Liu, S., Wei, F., Wu, Y., Stasko, J., & Ma, K. L. (2012, May). Breaking news on
twitter. In Proceedings of the SIGCHI Conference on Human Factors in Computing Systems (pp. 2751‐2754). ACM.
Huang, C.‐M., Chan, E., & Hyder, A. A. (2010). Web 2.0 and internet social
networking: A new tool for disaster management?‐Lessons from Taiwan. BMC medical informatics and decision making, 10(1), 57.
Huang, J., Thornton, K. M., & Efthimiadis, E. N. (2010). Conversational tagging in
twitter. In Proceedings of the 21st ACM conference on Hypertext and hypermedia (pp. 173‐178). Toronto, ON, Canada: ACM.
238
Huang, Y., Liu, Z., & Nguyen, P. (2015). Location‐based event search in social texts. In Proceedings of 2015 Computing, Networking and Communications (ICNC) (pp. 668‐672). California, USA: IEEE.
Huang, Z., Liu, S., Du, P., & Cheng, X. (2014). Ranking Tweets with Local and Global
Consistency Using Rich Features. In Advances in Knowledge Discovery and Data Mining (pp. 298‐309). Tainan, Taiwan: Springer.
Hughes, A. L., & Palen, L. (2009). Twitter adoption and use in mass convergence and
emergency events. International Journal of Emergency Management, 6(3), 248‐260.
Huston, C., Weiss, M., & Benyoucef, M. (2011). Following the Conversation: A More
Meaningful Expression of Engagement. In G. Babin, K. StanoevskaSlabeva & P. Kropf (Eds.), E‐Technologies: Transformation in a Connected World (Vol. 78, pp. 199‐210). Berlin: Springer‐Verlag Berlin.
Iakovou, E., & Douligeris, C. (2001). An information management system for the
emergency management of hurricane disasters. International Journal of Risk Assessment and Management, 2(3), 243‐262.
Imran, M., Castillo, C., Lucas, J., Meier, P., & Vieweg, S. (2014). AIDR: Artificial
intelligence for disaster response. In Proceedings of the companion publication of the 23rd international conference on World wide web companion (pp. 159‐162). Seoul, Republic of Korea: International World Wide Web Conferences Steering Committee.
Imran, M., Elbassuoni, S., Castillo, C., Diaz, F., & Meier, P. (2013a, 13‐17 May).
Practical Extraction of Disaster‐Relevant Information from Social Media. In WWW 2013 Companion (pp. 1021‐1024). Rio de Janeiro, Brazil.
Imran, M., Elbassuoni, S. M., Castillo, C., Diaz, F., & Meier, P. (2013b). Extracting
information nuggets from disaster‐related messages in social media. In Proceedings of the 10th International ISCRAM Conference (pp. 1‐10). Baden‐Baden, Germany.
Instagram. (2014). Instagram Press and Stats. Retrieved from
http://instagram.com/press/ Isaac, M. (2013). At D11, Twitter CEO Dick Costolo Talks TV, Ads and the Beauty of a
Simple Product. Retrieved 11 November, 2014 from All Things Digital, http://allthingsd.com/20130529/next‐up‐at‐d11‐its‐twitter‐ceo‐dick‐costolo/
ISDR, U. (2005). International strategy for disaster reduction ‘‘Hyogo framework for
action 2005–2015: building the resilience of nations and communities to
References 239
disasters. In extract from world conference on disaster reduction, Kobe, Hyogo, Japan (pp. 1‐22). Kobe, Japan, United Nations
Ishii, A., Koguchi, H., & Uchiyama, K. (2013). Mathematical Model of Hit Phenomena
as a theory for human interaction in the society. In Complex Sciences (pp. 159‐164): Springer.
Jansen, B. J., Zhang, M., Sobel, K., & Chowdury, A. (2009). Twitter power: Tweets as
electronic word of mouth. Journal of the American society for information science and technology, 60(11), 2169‐2188.
Java, A., Song, X., Finin, T., & Tseng, B. (2007). Why we twitter: understanding
microblogging usage and communities. In Proceedings of the 9th WebKDD and 1st SNA‐KDD 2007 workshop on Web mining and social network analysis (pp. 56‐65): San Jose, California. ACM.
Jensen, K., Heidorn, G. E., & Richardson, S. D. (2013). Natural language processing:
the PLNLP approach: Springer. Jordaan, M. (2013). Poke me, I'm a journalist: The impact of Facebook and Twitter
on newsroom routines and cultures at two South African weeklies. Ecquid Novi: African Journalism Studies, 34(1), 21‐35.
Jung, J. J. (2012). Online named entity recognition method for microtexts in social
networking services: A case study of twitter. Expert Systems with Applications, 39(2012), 8066–8070.
Karandikar, A. (2010). Clustering short status messages: A topic model based
approach. University of Maryland. Kavanaugh, A. L., Fox, E. A., Sheetz, S. D., Yang, S., Li, L. T., Shoemaker, D. J., . . . Xie,
L. (2012). Social media use by government: from the routine to the critical. Government Information Quarterly, 29(4), 480‐491.
Kim, A. E., Hansen, H. M., Murphy, J., Richards, A. K., Duke, J., & Allen, J. A. (2013).
Methodological considerations in analyzing Twitter data. JNCI Monographs, 2013(47), 140‐146.
Kinsella, S., Murdock, V., & OHare, N. (2011). "I'm Eating a Sandwich in Glasgow":
Modeling Locations with Tweets. In Proceedings of the 3rd international workshop on Search and mining user‐generated contents (pp. 61‐68). New York, NY, USA.
Kitchin, R. (2014). The Data Revolution: Big Data, Open Data, Data Infrastructures
and Their Consequences: SAGE Publications.
240
Klein, D., Smarr, J., Nguyen, H., & Manning, C. D. (2003). Named entity recognition with character‐level models. In Proceedings of the seventh conference on Natural language learning at HLT‐NAACL 2003 (Vol. 4, pp. 180‐183). Stroudsburg, PA, USA: Association for Computational Linguistics.
Kramer, W. M. (2009). Disaster Planning and Control: PennWell/Fire Engineering. Krippendorff, K. (2012). Content analysis: An introduction to its methodology: Sage. Kumar, S., Morstatter, F., Zafarani, R., & Liu, H. (2013). Whom Should I Follow?
Identifying Relevant Users During Crises. Kwak, H., Lee, C., Park, H., & Moon, S. (2010). What is Twitter, a social network or a
news media? In Proceedings of the 19th international conference on World wide web (pp. 591‐600). NY, USA: ACM.
Kwon, J., & Han, I. (2013). Information Diffusion with Content Crossover in Online
Social Media: An Empirical Analysis of the Social Transmission Process in Twitter. In System Sciences (HICSS), 2013 46th Hawaii International Conference on (pp. 3292‐3301). Hawaii, USA: IEEE.
Larsson, A. O., & Moe, H. (2012). Studying political microblogging: Twitter users in
the 2010 Swedish election campaign. New Media & Society, 14(5), 729‐747. Lau, C. H., Li, Y., & Tjondronegoro, D. (2011). Microblog Retrieval Using Topical
Features and Query Expansion. In Proceedings of The Twentieth Text REtrieval Conference (pp. 1‐6). Gaithersburg, Maryland, USA: National Institute of Standards and Technology.
Lau, C. H., Tao, X., Tjondronegoro, D., & Li, Y. (2012). Retrieving information from
microblog using pattern mining and relevance feedback. In Data and Knowledge Engineering (pp. 152‐160): Springer.
Lau, J. H., Collier, N., & Baldwin, T. (2012). On‐line Trend Analysis with Topic
Models:\# twitter Trends Detection Topic Model Online. In COLING (pp. 1519‐1534).
Launer, J. (2013). The age of Twitter. Postgraduate medical journal, 89(1057), 675‐
676. Lavalle, S., Lesser, E., Shockley, R., Hopkins, M. S., & Kruschwitz, N. (2011). Big data,
analytics and the path from insights to value. MIT Sloan Management Review, 52(2), 21‐32.
Lee, C.‐H., Yang, H.‐C., Chien, T.‐F., & Wen, W.‐S. (2011). A novel approach for event
detection by mining spatio‐temporal information on microblogs. In
References 241
Proceedings of the 2011 International Conference on Advances in Social Networks Analysis and Mining (pp. 254‐259). Washington, DC, USA: IEEE.
Lee, K., Eoff, B. D., & Caverlee, J. (2011). Seven Months with the Devils: A Long‐
Term Study of Content Polluters on Twitter. In Proceedings of the Fifth International AAAI Conference on Weblogs and Social Media (pp. 185‐192). Barcelona, Catalonia, Spain: AAAI Press.
Lee, K., Palsetia, D., Narayanan, R., Patwary, M. M. A., Agrawal, A., & Choudhary, A.
(2011). Twitter trending topic classification. In Proceedings of the 2011 IEEE 11th International Conference on Data Mining Workshops (pp. 251‐258). Washington, DC, USA: IEEE.
Leetaru, K., Wang, S., Cao, G., Padmanabhan, A., & Shook, E. (2013). Mapping the
global Twitter heartbeat: The geography of Twitter. First Monday, 18(5). Lehmann, J., Gonçalves, B., Ramasco, J. J., & Cattuto, C. (2012). Dynamical classes of
collective attention in twitter. In Proceedings of the 21st international conference on World Wide Web (pp. 251‐260). New York, NY, USA ACM.
Lenhart, A., & Fox, S. (2009). Twitter and status updating. Retrieved 04 April, 2012
from Pew Internet & American Life Project Washington, DC, http://www.pewinternet.org/2009/02/12/twitter‐and‐status‐updating/
Li, C., Weng, J., He, Q., Yao, Y., Datta, A., Sun, A., & Lee, B.‐S. (2012). Twiner: Named
entity recognition in targeted twitter stream. In Proceedings of the 35th international ACM SIGIR conference on Research and development in information retrieval (pp. 721‐730). New York, NY, USA: ACM.
Lin, J., & Mishne, G. (2012). A Study of "Churn" in Tweets and Real‐Time Search
Queries In Proceedings of the Sixth International Conference on Weblogs and Social Media (pp. 503‐506). Dublin, Ireland: AAAI Press.
Lin, Y.‐R., Margolin, D., Keegan, B., Baronchelli, A., & Lazer, D. (2013). #Bigbirds
Never Die: Understanding Social Dynamics of Emergent Hashtags. In Proceedings of the Seventh International AAAI Conference on Weblogs and Social Media (pp. 370‐375). Massachusetts, USA: AAAI Press.
Ling, R., Palen, L., Sundsøy, P., Canright, G., Bjelland, J., & Engø‐Monsen, K. (2014).
Safety, Sensemaking & Solidarity: Mobile Communication in the Immediate Aftermath of the 22 July 2011 Oslo Bombing. Linguistic and Material Intimacies of Mobile Phones, In Press.
Lipsman, A. (2009). What Ashton vs. CNN Foretold About the Changing
Demographics of Twitter. Retrieved 03 July, 2013 from Comscore, http://www.comscore.com/Insights/Blog/What‐Ashton‐vs.‐CNN‐Foretold‐About‐the‐Changing‐Demographics‐of‐Twitter
242
Liu, S. B. (2010). Grassroots heritage in the crisis context: a social media probes
approach to studying heritage in a participatory age. In CHI '10 Extended Abstracts on Human Factors in Computing Systems (pp. 2975‐2978). Atlanta, Georgia, USA: ACM.
Liu, S. B. (2014). Crisis Crowdsourcing Framework: Designing Strategic
Configurations of Crowdsourcing for the Emergency Management Domain. Computer Supported Cooperative Work (CSCW), 23(4‐6), 389‐443.
Liu, X., Wei, F., Zhang, S., & Zhou, M. (2013). Named entity recognition for tweets.
ACM Transactions on Intelligent Systems and Technology (TIST), 4(1), 3. Liu, Z., Liu, L., & Li, H. (2012). Determinants of information retweeting in
microblogging. Internet Research, 22(4), 443‐466. Lorch, R. (2005). What lessons must be learned from the tsunami? Building
Research & Information, 33(3), 209‐211. Lotan, G., Graeff, E., Ananny, M., Gaffney, D., Pearce, I., & Boyd, D. (2011). The
Revolutions Were Tweeted: Information Flows During the 2011 Tunisian and Egyptian Revolutions. International Journal of Communication, 5, 1375–1405.
Ma, Z., Sun, A., & Cong, G. (2012). Will this #hashtag be popular tomorrow? In
Proceedings of the 35th international ACM SIGIR conference on Research and development in information retrieval (pp. 1173‐1174). New York, NY, USA: ACM.
MacEachren, A. M., Robinson, A. C., Jaiswal, A., Pezanowski, S., Savelyev, A.,
Blanford, J., & Mitra, P. (2011). Geo‐twitter analytics: Applications in crisis management. In 25th International Cartographic Conference (pp. 3‐8). Paris, France: ICC.
Machin, D. (2011). Twitter: The pulse of the planet? Business Review‐Deddington,
17(3), 16. Macias, W., Hilyard, K., & Freimuth, V. (2009). Blog functions as risk and crisis
communication during Hurricane Katrina. Journal of Computer‐Mediated Communication, 15(1), 1‐31.
Macskassy, S. A., & Michelson, M. (2011). Why do people retweet? anti‐homophily
wins the day! In Proceedings of the Fifth International AAAI Conference on Weblogs and Social Media (pp. 209‐216). Barcelona, Catalonia, Spain.
Malhotra, A., Kubowicz, C. M., & See, A. (2012). How to Get Your Messages
Retweeted. MIT Sloan Management Review ,53 (2), 61‐66.
References 243
Mandel, B., Culotta, A., Boulahanis, J., Stark, D., Lewis, B., & Rodrigue, J. (2012). A
demographic analysis of online sentiment during hurricane irene. In Proceedings of the Second Workshop on Language in Social Media (pp. 27‐36). Stroudsburg, PA, USA: Association for Computational Linguistics.
Manning, C. D., & Schütze, H. (1999). Foundations of statistical natural language
processing: MIT press. Manovich, L. (2011). Trending: the promises and the challenges of big social data. In
M. K. Gold (Ed.), Debates in the Digital Humanities (pp. 460‐476). Minnesota, USA: Univ Of Minnesota Press.
Marcus, M. P., Marcinkiewicz, M. A., & Santorini, B. (1993). Building a large
annotated corpus of English: The Penn Treebank. Computational linguistics, 19(2), 313‐330.
Marwick, A. (2013). Ethnographic and Qualitative Research on Twitter. In K. Weller,
A. Bruns, J. E. Burgess, M. Mahrt & C. Puschmann (Eds.), Twitter and society: an introduction (pp. 109‐121). New York, USA: Peter Lang.
Mathioudakis, M., & Koudas, N. (2010). Twittermonitor: trend detection over the
twitter stream. In Proceedings of the 2010 ACM SIGMOD International Conference on Management of data (pp. 1155‐1158). New York, USA: ACM.
Matsuo, Y., & Ishizuka, M. (2004). Keyword extraction from a single document using
word co‐occurrence statistical information. International Journal on Artificial Intelligence Tools, 13(01), 157‐169.
Maxwell, D., Raue, S., Azzopardi, L., Johnson, C., & Oates, S. (2012). Crisees: Real‐
Time Monitoring of Social Media Streams to Support Crisis Management. In Proceedings of the 34th European conference on Advances in Information Retrieval (pp. 573‐575). Heidelberg, Germany.
Mayer‐Schönberger, V., & Cukier, K. (2013). Big data: A revolution that will
transform how we live, work, and think: Houghton Mifflin Harcourt. McConnan, I. (1998). Humanitarian charter and minimum standards in disaster
response: The Sphere Project. McElroy, A. (2014). ‘Useful and used’ data key to building resilience. Retrieved 23
April, 2014from United Nations Office for Disaster Risk Reduction (UNISDR), http://www.unisdr.org/archive/36203
McGuinness, C. (2013). Search API vs Streaming API. Retrieved 02 February, 2014
from Twitter, https://dev.twitter.com/discussions/10783
244
McNutt, K. (2014). Public engagement in the Web 2.0 era: Social collaborative technologies in a public sector context. Canadian Public Administration, 57(1), 49‐70.
Meier, P. (2012). Collaborative Mapping Platforms: Crowdsourced Crisis Response.
Retrieved from http://www.trendhunter.com/keynote/patrick‐meier Meier, P. (2013). Early Results of MicroMappers Response to Typhoon Yolanda
Retrieved 05 January 2014 from http://irevolution.net/2013/11/13/early‐results‐micromappers‐yolanda/
Meier, P., Lucas, J., & Mack, J. (2013). MicroMappers: Digital Disaster Response.
With a Single Click! Retrieved 14 August, 2014 from http://micromappers.org
Mendoza, M., Poblete, B., & Castillo, C. (2010). Twitter Under Crisis: Can we trust
what we RT? In Proceedings of the First Workshop on Social Media Analytics (pp. 71‐79). New York, NY, USA: ACM.
Messias, J., Schmidt, L., Oliveira, R., & Benevenuto, F. (2013). You followed my bot!
Transforming robots into influential users in Twitter. First Monday, 18(7). Messina, C. (2011). How did the idea for hashtags originate on Twitter? Retrieved
2014 from Quora, http://www.quora.com/Hashtags/How‐did‐the‐idea‐for‐hashtags‐originate‐on‐Twitter
Miller, G. A. (1995). WordNet: a lexical database for English. Communications of the
ACM, 38(11), 39‐41. Miller, J. H., & Page, S. E. (2004). The standing ovation problem. Complexity, 9(5), 8‐
16. Mitchell, A., Rosenstiel, T., & Christian, L. (2012). What Facebook and Twitter Mean
for News. Retrieved from http://stateofthemedia.org/2012/mobile‐devices‐and‐news‐consumption‐some‐good‐signs‐for‐journalism/what‐facebook‐and‐twitter‐mean‐for‐news/
Miyabe, M., Miura, A., & Aramaki, E. (2012). Use trend analysis of twitter after the
great east japan earthquake. In Proceedings of the ACM 2012 conference on Computer Supported Cooperative Work Companion (pp. 175‐178). New York, NY, USA: ACM.
Montejo‐Ráez, A., Martínez‐Cámara, E., Martín‐Valdivia, M. T., & Ureña‐López, L. A.
(2014). Ranked WordNet graph for Sentiment Polarity Classification in Twitter. Computer Speech & Language, 28(1), 93‐107.
References 245
Morris, M. R., Counts, S., Roseway, A., Hoff, A., & Schwarz, J. (2012). Tweeting is believing?: understanding microblog credibility perceptions. In (pp. 441‐450). New York, NY, USA: ACM.
Morse, J. M. (2012). Readme first for a user's guide to qualitative methods: Sage
publications. Morstatter, F., Pfeffer, J., Liu, H., & Carley, K. M. (2013). Is the sample good
enough? comparing data from twitter’s streaming api with twitter’s firehose. In International Conference on Weblogs and Social Media (pp. 400‐408). Massachusetts, USA.
Morton, K., Balazinska, M., Grossman, D., Kosara, R., & Mackinlay, J. (2014). Public
Data and Visualizations: How are Many Eyes and Tableau Public Used for Collaborative Analytics? SIGMOD Record, 43(2), 17.
Muralidharan, S., Rasmussen, L., Patterson, D., & Shin, J. H. (2011). Hope for Haiti:
An analysis of Facebook and Twitter usage during the earthquake relief efforts. Public Relations Review, 37(2), 175‐177. doi:10.1016/j.pubrev.2011.01.010
Murthy, D. (2011). Twitter: Microphone for the masses? Media Culture and Society,
33(5), 779. Murthy, D., & Longwell, S. A. (2013). Twitter and Disasters: The uses of Twitter
during the 2010 Pakistan floods. Information, Communication & Society, 16(6), 837‐855.
Nadeau, D., & Sekine, S. (2007). A survey of named entity recognition and
classification. Lingvisticae Investigationes, 30(1), 3‐26. National Governors Association. (1979). Comprehensive Emergency Management: A
Governor's Guide: Department of Defense, Defense Civil Preparedness Agency.
Neuberger, C., Vom Hofe, A., & Nuernbergk, C. (2013). The use of Twitter by
Professional Journalists: Results of a Newsroom Survey in Germany. In Twitter and society: an introduction (pp. 345‐359): Peter Lang.
Noreña, D., Yamín, L., Akhavan‐Tabatabaei, R., & Ospina, W. (2011). Using discrete
event simulation to evaluate the logistics of medical attention during the relief operations in an earthquake in Bogota. In Proceedings of the Winter Simulation Conference (pp. 2666‐2678). Phoenix, AZ: Winter Simulation Conference.
Norheim‐Hagtun, I., & Meier, P. (2010). Crowdsourcing for crisis mapping in Haiti.
innovations, 5(4), 81‐89.
246
Nowak, S., & Rüger, S. (2010). How reliable are annotations via crowdsourcing: a
study about inter‐annotator agreement for multi‐label image annotation. In Proceedings of the international conference on Multimedia information retrieval (pp. 557‐566). New York, NY, USA ACM.
Oh, O., Kwon, K. H., & Rao, H. R. (2010). An exploration of social media in extreme
events: Rumor theory and twitter during the Haiti earthquake 2010. In International Conference on Information Systems (pp. 231). St. Louis, Missouri, USA.
Osborne, M., Petrovic, S., McCreadie, R., Macdonald, C., & Ounis, I. (2012). Bieber
no more: First story detection using Twitter and Wikipedia. In Proceedings of the Workshop on Time‐aware Information Access. TAIA (pp. 1‐4). Portland, Oregon, USA.
Owoputi, O., O’Connor, B., Dyer, C., Gimpel, K., Schneider, N., & Smith, N. A. (2012).
Part‐of‐speech tagging for Twitter: Word clusters and other advances. Retrieved from http://www.cs.cmu.edu/~nschneid/twpos‐tr.pdf
Palen, L., & Liu, S. B. (2007). Citizen communications in crisis: anticipating a future
of ICT‐supported public participation. In (pp. 727‐736): ACM. Palen, L., Starbird, K., Vieweg, S., & Hughes, A. (2010). Twitter based information
distribution during the 2009 Red River Valley flood threat. Bulletin of the American Society for Information Science and Technology, 36(5), 13‐17.
Panem, S., Gupta, M., & Varma, V. (2014). Structured Information Extraction from
Natural Disaster Events on Twitter. In Proceedings of the 5th International Workshop on Web‐scale Knowledge Representation Retrieval & Reasoning (pp. 1‐8). New York, NY, USA: ACM.
Pang, B., Lee, L., & Vaithyanathan, S. (2002). Thumbs up?: sentiment classification
using machine learning techniques. In Proceedings of the ACL‐02 conference on Empirical methods in natural language processing‐Volume 10 (pp. 79‐86). Stroudsburg, PA, USA: Association for Computational Linguistics.
Paul, A., & Bruns, A. (2013). Usability of small crisis data sets in the absence of big
data. In Proceedings of the 2013 International Conference on Information, Business and Education Technology (ICIBET 2013), (pp. 718‐721) Beijing, China: Atlantis Press.
Pennacchiotti, M., & Popescu, A.‐M. (2011). A machine learning approach to twitter
user classification. In Fifth International AAAI Conference on Weblogs and Social Media (ICWSM) (pp. 281‐288). Barcelona, Spain.
References 247
Perera, R. D. W., Anand, S., Subbalakshmi, K. P., & Chandramouli, R. (2010). Twitter Analytics: Architecture, Tools and Analysis. In Military Communications Conference (pp. 2186‐2191). San Jose, CA: IEEE.
Petrovic, S., Osborne, M., & Lavrenko, V. (2011). RT to Win! Predicting Message
Propagation in Twitter. In Proceedings of the Fifth International Conference on Weblogs and Social Media (pp. 586‐589). Barcelona, Catalonia, Spain.
Petrovic, S., Osborne, M., McCreadie, R., Macdonald, C., Ounis, I., & Shrimpton, L.
(2013). Can twitter replace newswire for breaking news. In Seventh International AAAI Conference on Weblogs and Social Media (pp. 713‐716). Boston, MA, USA: AAAI Press.
Phillips, B. D., Neal, D. M., & Webb, G. (2011). Introduction to Emergency
Management: Taylor & Francis. Pipek, V., Liu, S. B., & Kerne, A. (2014). Crisis Informatics and Collaboration: A Brief
Introduction. Computer Supported Cooperative Work (CSCW), 23(4‐6), 339‐345.
Pipek, V., Palen, L., & Landgren, J. (2012). Workshop summary: collaboration &
crisis informatics. In Collaboration & Crisis Informatics (CCI'2012) (pp. 13‐14). Seattle, WA, USA: ACM.
Platt, A., Hood, C., & Citrin, L. (2011a). From Earthquakes to "#morecowbell":
Identifying Sub‐topics in Social Network Communications. In Privacy, Security, Risk and Trust (PASSAT), 2011 IEEE Third International Conference on and 2011 IEEE Third International Confernece on Social Computing (SocialCom) (pp. 541 ‐ 544). Boston, MA.
Platt, A., Hood, C., & Citrin, L. (2011b). Organization of Social Network Messages to
Improve Understanding of an Evolving Crisis. In Intelligence and Security Informatics (ISI), 2011 IEEE International Conference (pp. 230 ‐ 230). Beijing, China.
Porter, M. (2001). Snowball: A language for stemming algorithms. Retrieved from
http://snowball.tartarus.org/texts/introduction.html Postle, D. (1980). Catastrophe theory: predict and avoid personal disaster:
HarperCollins Publishers Ltd Potts, L., Seitzinger, J., Jones, D., & Harrison, A. (2011). Tweeting disaster: hashtag
constructions and collisions. In Proceedings of the 29th ACM international conference on Design of communication (pp. 235‐240). NY, USA: ACM.
248
Pratto, F., & John, O. P. (1991). Automatic vigilance: the attention‐grabbing power of negative social information. Journal of personality and social psychology, 61(3), 380.
Purohit, H., Hampton, A., Bhatt, S., Shalin, V. L., Sheth, A. P., & Flach, J. M. (2014).
Identifying Seekers and Suppliers in Social Media Communities to Support Crisis Coordination. Computer Supported Cooperative Work (CSCW), 23(4‐6), 513‐545.
Puschmann, C., & Burgess, J. (2013). The politics of Twitter data. In Weller, Katrin,
Bruns, Axel, Burgess, Jean, Puschmann, Cornelius, & Mahrt, Merja (Eds.) Twitter and Society. (pp. 43‐54) Peter Lang, New York,
Qu, Y., Huang, C., Zhang, P., & Zhang, J. (2011). Microblogging after a major disaster
in China: a case study of the 2010 Yushu earthquake. In Proceedings of the ACM 2011 conference on Computer supported cooperative work (pp. 25‐34). New York, NY, USA: ACM.
Queensland Government. (2012a). All Hazards Information Management Blueprint.
Retrieved May 20, 2012, from http://www.emergency.qld.gov.au/publications/
Queensland Government. (2012b). Rebuilding a stronger, more resilient
Queensland. Queensland Australia: Queensland Government Retrieved from http://www.qldreconstruction.org.au/u/lib/cms2/rebuilding‐resilient‐qld‐full.pdf.
Ramage, D., Dumais, S. T., & Liebling, D. J. (2010). Characterizing Microblogs with
Topic Models. In Proceedings of the Fourth International AAAI Conference on Weblogs and Social Media (pp. 130‐137). Washington, D.C.: AAAI.
Rangrej, A., Kulkarni, S., & Tendulkar, A. V. (2011). Comparative study of clustering
techniques for short text documents. In Proceedings of the 20th international conference companion on World wide web (pp. 111‐112). New York, NY, USA: ACM.
Rasid, H., & Paul, B. (2013). Climate Change in Bangladesh: Confronting Impending
Disasters: Lexington Books. Reddit. (2015) About Reddit. Retrieved 27th September 2015 from
https://www.reddit.com/about/ Reips, U.‐D., & Garaizar, P. (2011). Mining twitter: A source for psychological
wisdom of the crowds. Behavior research methods, 43(3), 635‐642. Reyners, M. (2011). Lessons from the destructive Mw 6.3 Christchurch, New
Zealand, earthquake. Seismological Research Letters, 82(3), 371‐372.
References 249
Reynolds, B., & Seeger, M. (2012). Crisis and Emergency Risk Communication.
Retrieved from http://emergency.cdc.gov/cerc/pdf/CERC_2012edition.pdf. Reynolds, B. S., Galdo, J. H., & Sokler, L. (2002). Crisis and emergency risk
communication: Centers for Disease Control and Prevention Atlanta, GA. Ritter, A., Clark, S., & Etzioni, O. (2011). Named entity recognition in tweets: an
experimental study. In Proceedings of the Conference on Empirical Methods in Natural Language Processing (pp. 1524‐1534). Stroudsburg, PA, USA Association for Computational Linguistics.
Robinson, B., Power, R., & Cameron, M. (2013). A sensitive Twitter earthquake
detector. In Proceedings of the 22nd international conference on World Wide Web companion (pp. 999‐1002). Rio de Janeiro, Brazil.: International World Wide Web Conferences Steering Committee.
Roche, J (2015). Here's how a no‐name company found Twitter's earnings
announcement early without breaking any rules. Retrieved 06 October, 2015 from Business Insider, http://www.businessinsider.com.au/selerity‐leaked‐twitter‐earnings‐2015‐4
Rogers, S. (2013). The Boston Bombing: How journalists used Twitter to tell the
story. Retrieved 15 August, 2014from https://blog.twitter.com/2013/the‐boston‐bombing‐how‐journalists‐used‐twitter‐to‐tell‐the‐story
Rogstadius, J., Vukovic, M., Teixeira, C., Kostakos, V., Karapanos, E., & Laredo, J.
(2013). CrisisTracker: Crowdsourced social media curation for disaster awareness. IBM Journal of Research and Development, 57(5), 4: 1‐4: 13.
Romero, D. M., Meeder, B., & Kleinberg, J. (2011). Differences in the mechanics of
information diffusion across topics: idioms, political hashtags, and complex contagion on twitter. In Proceedings of the 20th international conference on World wide web (pp. 695‐704). New York, NY, USA: ACM.
Rothery, M. (2012). National progress report on the implementation of the Hyogo
Framework for Action (2011‐2013) ‐ Interim Report Retrieved from http://www.preventionweb.net/files/28668_aus_NationalHFAprogress_2011‐13.pdf
Roy Chowdhury, S., Imran, M., Asghar, M. R., Amer‐Yahia, S., & Castillo, C. (2013).
Tweet4act: Using incident‐specific profiles for classifying crisis‐related messages. In 10th International ISCRAM Conference (pp. 1‐5). Baden‐Baden, Germany.
Sabou, M., Bontcheva, K., & Scharl, A. (2012). Crowdsourcing research
opportunities: lessons from natural language processing. In Proceedings of
250
the 12th International Conference on Knowledge Management and Knowledge Technologies (pp. 17‐25). New York, NY, USA: ACM.
Sakaki, T., Okazaki, M., & Matsuo, Y. (2010). Earthquake shakes Twitter users: real‐
time event detection by social sensors. In Proceedings of the 19th international conference on World wide web (pp. 851‐860). New York, NY, USA: ACM.
Sakaki, T., Toriumi, F., & Matsuo, Y. (2011). Tweet trend analysis in an emergency
situation. In Proceedings of the Special Workshop on Internet and Disasters (pp. 3:1‐3:8). New York, NY, USA: ACM.
Sakamoto, M., & Nakajima, T. (2014). Gamifying Intelligent Daily Environments
through Introducing Fictionality. International Journal of Hybrid Information Technology, 7(4).
Saldana, J. M. (2012). The Coding Manual for Qualitative Researchers: SAGE
Publications. Sankaranarayanan, J., Samet, H., Teitler, B. E., Lieberman, M. D., & Sperling, J.
(2009). Twitterstand: news in tweets. In Proceedings of the 17th ACM SIGSPATIAL International Conference on Advances in Geographic Information Systems (pp. 42‐51). New York, NY, USA: ACM.
Sasongko, J., & Tjondronegoro, D. (2010). Automatic Visualization of Story Clusters
in TV Series Summary. Lecture Notes in Computer Science, 5916, 656‐661. Schatz, B. R., Johnson, E. H., Cochrane, P. A., & Chen, H. (1996). Interactive term
suggestion for users of digital libraries: Using subject thesauri and co‐occurrence lists for information retrieval. In Proceedings of the first ACM international conference on Digital libraries (pp. 126‐133). New York, NY, USA: ACM.
Seo, E., Mohapatra, P., & Abdelzaher, T. (2012). Identifying rumors and their
sources in social networks. In Proc. SPIE 8389, Ground/Air Multisensor Interoperability, Integration, and Networking for Persistent ISR III (Vol. 8389, pp. 83891I‐83813).
Shklovski, I., Burke, M., Kiesler, S., & Kraut, R. (2010). Technology adoption and use
in the aftermath of Hurricane Katrina in New Orleans. American Behavioral Scientist, 53(8), 1228‐1246.
Shklovski, I., Palen, L., & Sutton, J. (2008). Finding community through information
and communication technology in disaster response. In Proceedings of the 2008 ACM conference on Computer supported cooperative work (pp. 127‐136). New York, NY, USA: ACM.
References 251
Shore, J., & Bice, E. (2012). USPTO Patent No. US8145472 B2. Shvaiko, P., & Euzenat, J. (2013). Ontology matching: state of the art and future
challenges. Knowledge and Data Engineering, IEEE Transactions on, 25(1), 158‐176.
Si, X.‐S., Wang, W., Hu, C.‐H., & Zhou, D.‐H. (2011). Remaining useful life
estimation–A review on the statistical data driven approaches. European Journal of Operational Research, 213(1), 1‐14.
Sikdar, S. K., Kang, B., O'Donovan, J., Hollerer, T., & Adal, S. (2013). Cutting Through
the Noise: Defining Ground Truth in Information Credibility on Twitter. HUMAN, 2(3), pp. 151‐167.
Silva, J. A., Faria, E. R., Rodrigo C. Barros, Eduardo R. Hruschka, Andre ́C. P. L. F. De
Carvalho, & Gama, J. (2013). Data Stream Clustering: A Survey. ACM Computing surveys, 46, 13:11‐13:31.
Simpson, N., & Hancock, P. (2009). Fifty years of operational research and
emergency response. Journal of the Operational Research Society, 60, S126‐S139. doi:10.1057/jors.2009.3
Smelser, N. J. (2011). Theory of collective behavior: Quid Pro Books. Smith, B. G. (2010). Socially distributing public relations: Twitter, Haiti, and
interactivity in social media. Public Relations Review, 36(4), 329‐335. Smith, K. (2013). Environmental hazards: assessing risk and reducing disaster:
Routledge. Speriosu, M., Sudan, N., Upadhyay, S., & Baldridge, J. (2011). Twitter polarity
classification with label propagation over lexical links and the follower graph. In Proceedings of the First workshop on Unsupervised Learning in NLP (pp. 53‐63). Stroudsburg, PA, USA: Association for Computational Linguistics.
Sriram, B., Fuhry, D., Demir, E., Ferhatosmanoglu, H., & Demirbas, M. (2010). Short
text classification in twitter to improve information filtering. In Proceedings of the 33rd international ACM SIGIR conference on Research and development in information retrieval (pp. 841‐842). New York, NY, USA: ACM.
Starbird, K., Muzny, G., & Palen, L. (2012). Learning from the crowd: Collaborative
filtering techniques for identifying on‐the‐ground Twitterers during mass disruptions. In L. Rothkrantz, J. Ristvej & Z. Franco (Eds.), Proceedings of the Conference on Information Systems for Crisis Response and Management (ISCRAM 2012) (pp. 1‐10). Vancouver, Canada.
252
Starbird, K., & Palen, L. (2010). Pass it on?: Retweeting in mass emergency. In Proceedings of the 7th International ISCRAM Conference (pp. 1‐10). Seattle, USA.: ISCRAM.
Starbird, K., & Palen, L. (2011). "Voluntweeters": self‐organizing by digital
volunteers in times of crisis. In Proceedings of the SIGCHI Conference on Human Factors in Computing Systems (pp. 1071‐1080). New York, NY, USA: ACM.
Starbird, K., & Palen, L. (2012). (How) will the revolution be retweeted?:
information diffusion and the 2011 Egyptian uprising. In Proceedings of the ACM 2012 conference on Computer Supported Cooperative Work (pp. 7‐16). New York, NY, USA: ACM.
Starbird, K., Palen, L., Hughes, A. L., & Vieweg, S. (2010). Chatter on the red: what
hazards threat reveals about the social life of microblogged information. In Proceedings of the 2010 ACM conference on Computer supported cooperative work (pp. 241‐250). New York, NY, USA: ACM.
Stassen, W. (2010). Your news in 140 characters: exploring the role of social media
in journalism. Global Media Journal‐African Edition, 4(1), 116‐131. Stephens, K. K., & Malone, P. C. (2009). If the organizations won't give us
information: The use of multiple new media for crisis technical translation and dialogue. Journal of Public Relations Research, 21(2), 229‐239.
Sternberg, S. (2011). Japan crisis showcases social media's muscle. Retrieved 11
July, 2013 from http://usatoday30.usatoday.com/tech/news/2011‐04‐11‐japan‐social‐media_N.htm
Stieglitz, S., & Dang‐Xuan, L. (2012). Social media and political communication: a
social media analytics framework. Social Network Analysis and Mining, 3(4), 1277‐1291.
Strauss, A. L. (1987). Qualitative analysis for social scientists: Cambridge University
Press. Stutzman, F. D., Boyd, D., Marwick, A. E., Lampe, C., & Ellison, N. (2008). Okay,
Facebook me: Exploring behavior, motivations and uses in Social Network Sites. In iConference 2008 Wildcards (pp. 1‐4): University of Illinois.
Tao, K., Hauff, C., Abel, F., & Houben, G.‐J. (2013). Information Retrieval for Twitter
Data. In K. Weller, A. Bruns, J. E. Burgess, M. Mahrt & C. Puschmann (Eds.), Twitter and Society (pp. 195‐206): Peter Lang Publishing Inc.
Taylor, R. (1990). Interpretation of the correlation coefficient: a basic review.
Journal of diagnostic medical sonography, 6(1), 35‐39.
References 253
Telford, J., Cosgrave, J., & Houghton, R. (2006). Joint evaluation of the international
response to the Indian Ocean tsunami. Retrieved from http://www.alnap.org/resource/3535
Terpstra, T., de Vries, A., Stronkman, R., & Paradies, G. (2012). Towards a realtime
Twitter analysis during crises for operational crisis management. In ISCRAM’12: Proceedings of the 9th International ISCRAM Conference (pp. 1‐9). Proceedings of International ISCRAM Conference 2012.
Tesch, R. (1990). Qualitative research: Analysis types and software tools: Psychology
Press. Thaiprayoon, S., Kongthon, A., Palingoon, P., & Haruechaiyasak, C. (2012). Search
result clustering for Thai Twitter based on Suffix Tree Clustering. In Proceedings of 9th International Conference on Electrical Engineering/Electronics, Computer, Telecommunications and Information Technology (ECTI‐CON), 2012 (pp. 1‐4). Hua Hin, Thailand: IEEE.
Thomson, R., Ito, N., Suda, H., Lin, F., Liu, Y., Hayasaka, R., . . . Wang, Z. (2012).
Trusting Tweets: The Fukushima Disaster and Information Source Credibility on Twitter. In Proceedings of the 9th International ISCRAM Conference (pp. 1‐10). Vancouver, Canada: ISCRAM
Tjong Kim Sang, E. F., & De Meulder, F. (2003). Introduction to the CoNLL‐2003
shared task: Language‐independent named entity recognition. In Proceedings of the seventh conference on Natural language learning at HLT‐NAACL 2003‐Volume 4 (pp. 142‐147). Stroudsburg, PA, USA: Association for Computational Linguistics.
Todd, D., & Todd, H. (2011). Natural Disaster Response Lessons from Evaluations of
the World Bank and Others. Vol. 1. Retrieved from http://documents.worldbank.org/curated/en/2011/01/15512809/natural‐disaster‐response‐lessons‐evaluations‐world‐bank‐others
Tonkin, E., Pfeiffer, H. D., & Tourte, G. (2012). Twitter, information sharing and the
London riots? Bulletin of the American Society for Information Science and Technology, 38(2), 49‐57.
Tsur, O., & Rappoport, A. (2012). What's in a hashtag?: content based prediction of
the spread of ideas in microblogging communities. In Proceedings of the fifth ACM international conference on Web search and data mining (pp. 643‐652). Seattle, Washington, USA: ACM.
Tufekci, Z. (2008). Can you see me now? Audience and disclosure regulation in
online social network sites. Bulletin of Science, Technology & Society, 28(1), 20‐36.
254
Tufekci, Z. (2014). Big Questions for Social Media Big Data: Representativeness,
Validity and Other Methodological Pitfalls. In Proceedings of the 8th International AAAI Conference on Weblogs and Social Media (pp. 505‐514). Ann Arbor, Michigan: AAAI Press.
Tumasjan, A., Sprenger, T. O., Sandner, P. G., & Welpe, I. M. (2010). Predicting
Elections with Twitter: What 140 Characters Reveal about Political Sentiment. In Proceedings of the Fourth International AAAI Conference on Weblogs and Social Media (Vol. 10, pp. 178‐185). Washington, D.C.: AAAI Press.
Twitter. (2010). Twitter Blog: To Trend or Not to Trend. Retrieved 2 Feb, 2013 from
http://blog.twitter.com/2010/12/to‐trend‐or‐not‐to‐trend.html Twitter. (2012). Developer Rules of the Road | Twitter Developers. Retrieved 26
Jan, 2013 from https://dev.twitter.com/terms/api‐terms Twitter. (2013). A field guide to Twitter Platform objects. Retrieved 2014 from
Twitter, https://dev.twitter.com/docs/platform‐objects Twitter. (2015). Rate Limits: Chart. Retrieved 15 April, 2015from
https://dev.twitter.com/rest/public/rate‐limits Twitter Inc. (2015). About us: Twitter. Retrieved 05 January, 2015 from Twitter,
https://about.twitter.com/company Uprichard, E. (2013). Focus: big data, little questions?. Discover Society, (1), 1‐6. UNISDR, I., ITU, OHCHR, UNESCO, UNEP, UNFPA, WMO (2013). Building resilience
to disasters through partnerships Lessons from the Hyogo Framework for Action. UN system task team, 8. Retrieved from http://www.preventionweb.net/files/30374_thinkpieceondrmfinal.pdf
Utani, A., Mizumoto, T., & Okumura, T. (2011). How geeks responded to a
catastrophic disaster of a high‐tech country: rapid development of counter‐disaster systems for the great east Japan earthquake of March 2011. In Proceedings of the Special Workshop on Internet and Disasters (pp. 9:1‐9:8). New York, NY, USA: ACM.
Valero, A. T. l., Gómez, M. M. y., & Pineda, L. V. o. (2009). Using Machine Learning
for Extracting Information from Natural Disaster News Reports. Computación y Sistemas (Computers and Systems), 13(1), 33‐44.
Van Ginneken, J. (2003). Collective behavior and public opinion: rapid shifts in
opinion and communication: Routledge.
References 255
Verma, S., Vieweg, S., Corvey, W. J., Palen, L., Martin, J. H., Palmer, M., . . .
Anderson, K. M. (2011). Natural Language Processing to the Rescue?: Extracting 'Situational Awareness' Tweets During Mass Emergency. In Proceedings of the Fifth International AAAI Conference on Weblogs and Social Media (pp. 385‐392). Barcelona, Spain: AAAI Press.
Vieweg, S. (2012a). Twitter communications in mass emergency: contributions to
situational awareness. In Proceedings of the ACM 2012 conference on Computer Supported Cooperative Work Companion (pp. 227‐230). Seattle, WA, USA: ACM.
Vieweg, S., Hughes, A. L., Starbird, K., & Palen, L. (2010). Microblogging during two
natural hazards events: what twitter may contribute to situational awareness. In Proceedings of the SIGCHI Conference on Human Factors in Computing Systems (pp. 1079‐1088). NY, USA: ACM.
Vieweg, S., Palen, L., Liu, S. B., Hughes, A. L., & Sutton, J. N. (2008). Collective
intelligence in disaster: examination of the phenomenon in the aftermath of the 2007 Virginia tech shooting. In Proceedings of the 5th International ISCRAM Conference (pp. 1‐11): AAAI Press.
Vieweg, S. E. (2012b). Situational awareness in mass emergency: A behavioral and
linguistic analysis of microblogged communications PhD. University of Colorado at Boulder. Retrieved from http://works.bepress.com/vieweg/15
Vitale, D., Ferragina, P., & Scaiella, U. (2012). Classification of short texts by
deploying topical annotations. Advances in Information Retrieval Lecture Notes in Computer Science, 7224, 376‐387.
Vivacqua, A. S., & Borges, M. R. (2012). Taking advantage of collective knowledge in
emergency response systems. Journal of Network and Computer Applications, 35(1), 189‐198.
Vlachos, A. (2011). Evaluating unsupervised learning for natural language
processing tasks. In Proceedings of the First Workshop on Unsupervised Learning in NLP (pp. 35‐42). Edinburgh, Scotland: Association for Computational Linguistics.
Wagner, C., Liao, V., Pirolli, P., Nelson, L., & Strohmaier, M. (2012). It's Not in Their
Tweets: Modeling Topical Expertise of Twitter Users. In 2012 International Confernece on Social Computing (SocialCom) (pp. 91‐100). Sydney, Australia.
Wagner, K. (2015). The ‘Monthly Active User’ Metric Should Be Retired. But What
Takes Its Place? Retrieved 02 January, 2015 from Recode, http://recode.net/2015/02/09/the‐monthly‐active‐user‐metric‐should‐be‐retired‐but‐what‐takes‐its‐place/
256
Wang, W., Chen, L., Thirunarayan, K., & Sheth, A. P. (2012). Harnessing twitter" big
data" for automatic emotion identification. In 2012 International Confernece on Social Computing (SocialCom) (pp. 587‐592). Sydney, Australia: IEEE.
Weichselbraun, A., Gindl, S., & Scharl, A. (2013). Extracting and grounding context‐
aware sentiment lexicons. IEEE Intelligent Systems, 28(2), 39‐46. Westlake, E. (2008). Friend me if you Facebook: Generation Y and performative
surveillance. TDR/The Drama Review, 52(4), 21‐40. Williams, S. A., Terras, M. M., & Warwick, C. (2013). What do people study when
they study Twitter? Classifying Twitter related academic papers. Journal of Documentation, 69(3), 384‐410.
Wolcott, H. F. (1994). Transforming qualitative data: Description, analysis, and
interpretation: Sage. Woodford, D., Walker, S., & Paul, A. (2013). Slicing Big Data. In Selected Papers of
Internet Research 14.0 (pp. 10‐13). Denver, USA: AOIR. Xia, R., Zong, C., & Li, S. (2011). Ensemble of feature sets and classification
algorithms for sentiment classification. Information Sciences, 181(6), 1138‐1152.
Yang, F., Yu, X., Liu, Y., & Yang, M. (2012). Automatic Detection of Rumor on Sina
Weibo. In Proceedings of the ACM SIGKDD Workshop on Mining Data Semantics (pp. 13:11‐13:17). New York, NY, USA: ACM.
Yang, S., & Kavanaugh, A. L. (2010). Half‐Day Tutorial: Collecting, Analyzing and
Visualizing Tweets using Open Source Tools. In The Proceedings of the 12th Annual International Conference on Digital Government Research (pp. 374‐375). New York, NY, USA.
Youtube. (2015) Statistics Youtube. Retrieved 27th September 2015 from
https://www.youtube.com/yt/press/statistics.html Yin, J., Lampert, A., Cameron, M., Robinson, B., & Power, R. (2012). Using Social
Media to Enhance Emergency Situation Awareness. IEEE Intelligent Systems, 1541(1672), 52‐59.
Z. Wei, L. Z., B. Li, K.‐F. Wong, W. Gao, K.‐F. Wong, . (2011). Exploring Tweets
Normalization and Query Time Sensitivity for Twitter Search. In E. M. Voorhees & L. P. Buckland (Eds.), Proceedings of The Twentieth Text REtrieval Conference (Vol. 295, pp. 1‐10). Gaithersburg, Md. USA: National Institute of Standards and Technology (NIST) USA.
References 257
Zak, E. (2013). How Twitter’s Hashtag Came to Be. Retrieved 12 Janurary, 2014
from http://blogs.wsj.com/digits/2013/10/03/how‐twitters‐hashtag‐came‐to‐be/
Zhang, D., Islam, M. M., & Lu, G. (2012). A review on automatic image annotation
techniques. Pattern Recognition, 45(1), 346‐362. Zhang, Y., & Wildemuth, B. M. (2009). Qualitative analysis of content. Applications
of social research methods to questions in information and library science, 308‐319.
Zhao, D., & Rosson, M. B. (2009). How and why people Twitter: the role that micro‐
blogging plays in informal communication at work. In Proceedings of the ACM 2009 international conference on Supporting group work (pp. 243‐252). New York, NY, USA ACM.
Zhao, W. X., Jiang, J., Weng, J., He, J., Lim, E.‐P., Yan, H., & Li, X. (2011). Comparing
twitter and traditional media using topic models. In Advances in Information Retrieval (pp. 338‐349). Heidelberg, Germany: Springer.
Zhong, N., Li, Y., & Wu, S.‐T. (2012). Effective pattern discovery for text mining.
Knowledge and Data Engineering, IEEE Transactions on, 24(1), 30‐44. Zhou, Q., Huang, W., & Zhang, Y. (2011). Identifying critical success factors in
emergency management using a fuzzy DEMATEL method. Safety Science, 49(2), 243‐252.
Zi, C., Gianvecchio, S., Haining, W., & Jajodia, S. (2012). Detecting Automation of
Twitter Accounts: Are You a Human, Bot, or Cyborg? Dependable and Secure Computing, IEEE Transactions on, 9(6), 811‐824. doi:10.1109/TDSC.2012.75
Zikopoulos, P., Parasuraman, K., Deutsch, T., Giles, J., & Corrigan, D. (2012). Harness
the Power of Big Data The IBM Big Data Platform: McGraw Hill Professional. Zuckerberg, M., Sanghvi, R., Bosworth, A., Cox, C., Sittig, A., Hughes, C., . . . Corson,
D. (2010). USPTO Patent No. US7669123 B2.
258
Appendices
Appendix A: Sample Json file
Sample JSON file for twitter entities { "id": 411031503817039874, "id_str": "411031503817039874", "text": "test $TWTR @twitterapi #hashtag http://t.co/p5dOtmnZyu https: //t.co//ZSvIEMOPb8", "created_at": "Thu Dec 12 07:15:21 +0000 2013", "entities": { "hashtags": [{ "text": "hashtag", "indices": [23, 31] }], "symbols": [{ "text": "TWTR", "indices": [5, 10] }], "urls": [{ "url": "http://t.co/p5dOtmnZyu", "expanded_url": "http://dev.twitter.com", "display_url": "dev.twitter.com", "indices": [32, 54] }, { "url": "https://t.co/ZSvIEMOPb8", "expanded_url": "https://ton.twitter.com/1.1/ton/data/dm/411031503817039874411031503833792512cOkcq9FS.jpg", "display_url": "pic.twitter.com/ZSvIEMOPb8", "indices": [55, 78] }], "user_mentions": [{ "screen_name": "twitterapi", "name": "Twitter API", "id": 6253282, "id_str": "6253282", "indices": [11, 22] }], "media": [{ "id": 411031503833792512, "id_str": "411031503833792512", "indices": [55, 78],
Appendices 259
"media_url": "https://ton.twitter.com/1.1/ton/data/dm/411031503817039874411031503833792512cOkcq9FS.jpg", "media_url_https": "https://ton.twitter.com/1.1/ton/data/dm/411031503817039874411031503833792512cOkcq9FS.jpg", "url": "https://t.co/ZSvIEMOPb8", "display_url": "pic.twitter.com/ZSvIEMOPb8", "expanded_url": "https://ton.twitter.com/1.1/ton/data/dm/411031503817039874411031503833792512cOkcq9FS.jpg", "type": "photo", "sizes": { "medium": { "w": 600, "h": 450, "resize": "fit" }, "large": { "w": 1024, "h": 768, "resize": "fit" }, "thumb": { "w": 150, "h": 150, "resize": "crop" }, "small": { "w": 340, "h": 255, "resize": "fit" } } }] } ... }
260
Appendix B: Data Collection Process
The setup process of yTK involves setting up a computer as a web server and
then install the program into the web server. The details of the system architecture
as well as the setup process can be found in this URL:
http://jobrieniii.tumblr.com/post/15240403050/how‐to‐install‐
yourtwapperkeeper‐on‐a‐rackspace‐cloud .
Once it is installed, a list of twitter accounts that is allowed to enter tracking
keywords or hashtags are included into the system. After that it needs to be
authorised from an existing twitter account before someone wants to track a
particular keyword.
Collection process: The data collection process with yTK involves manually
entering the hashtag or the keyword into yTK. The process to do is to open that
URL of yTK with browser, authenticate with Twitter account and then enter the
keyword that needs to be tracked (Figure 53).
Figure 53: yTK initial screen and archiving steps
Appendices 261
Appendix C: Setting up development platform
The development platform consists of database and the programming
environment.
Database Setup
MySQL database was used for this project as it is an open source database
platform. To integrate SQL development, administration and design MySQL
workbench was used as an integrated development environment. Both MySQL and
the workbench is downloadable from their respective website for free. For this
project, MySQL was downloaded along with the server under XAMPP package.
Once the database was installed, entire Yolanda dataset was inserted in the
database. All related Sql scripts are included in appendix D.
Server setup
Although this project did not involve real‐time data integration from twitter, to
enable web‐based output, Apache server was installed. Both the server and the
database was downloaded from XAMPP website.
Importing and making connections
Once the setup was completed, a new database was created in the MySQL
database. In that database, a new tabled called typhoon was created and was
populated with the yolanda dataset. The script to create the table and importing
csv file is available in another Appendix.
Programming environment setup
Various research has used Python (Aggarwal, 2011; Helbing & Balietti, 2011;
Lavalle, et al., 2011) and awk (Bruns, 2011) to analyse Twitter data. However as
natural language processing was used in this phase Python was the preferred
choice due to its popularity as data mining language as well as existing libraries
that deals with natural language. Once Python is downloaded and integrated with
the database, required packages were downloaded. The list of the packages and the
reason for choosing them is outlines in Table 30.
Name Versio
n
Description
Python 2.7.6 Although this is not the latest version, this is the most compatible
version that works with all the packages.
MySQL‐ 1.2.5 It is extremely important to install the correct version because failure
262
Python to do so results in various problems. It is recommended that MySQL is
installed with an EXE file for windows or via macport in mac.
Alternatively it could also be installed using MySQL python connector.
nltk 2.0.4
This is the latest version of Natural Language Toolkit. Once installed, all
the related components such as “english stop words” needs to be
downloaded via nltk as well.
stemming 1.0 To remove plural, adjective, adverb etc in order to only export the
basic word.
twython 3.1.2 To connect and find additional information on twitter
virtualenv 1.11.4
Virtual environment allows creating an isolated working copy of
Python with specific versions so that it can be distributed and installed
in another machine correctly.
wikipedia 1.1 To search for Wikipedia entries related to a specific keyword
Table 30: List of python packages used in this project.
IDE setup
Although setting up an integrated development editor is not an essential
component of the project, it is extremely useful to set up an IDE that works well
with the programming environment. For the purpose of this project, an IDE
named “Sublime text” was used due to it’s support of various file types and speed
of working with large file sizes.
Appendices 263
Appendix D: SQL Queries & Python Scripts
All available scripts related are hosted in Github as an open source project.
Please visit https://github.com/cdtavijit/krisisdetect for the source codes.
In general the source code includes
1. MySQL scripts
2. Python scripts that uses
a) URL resolve
b) Image detect from a wikipedia list
c) Named entity script that connects with stanford named entity list
d) Other related script.
264
Appendix E: List of Keywords
This is the list of keywords that requires curation in the future as different crisis
and different system emerges.
Coding Categories #qldfloods Keywords Yolanda Keywords
Request for
material support
(RF, RS)
Seeking, help, flood, animals, roof Also, any, badly, bodies, candles,
damaged, dead, dire, electricity,
everything, flashlight, food, from,
goods, haven't, help, isolated, need,
no, out, please, pls, received, relief,
rescue, running, School, send, signal,
update, water
Request for
medical assistance
(RM)
None available Please, need, medicines
Request for
information (RP,
RA, RI)
Anyone, contact, current, have,
know, mum, old, power, safe,
situation
Any, anyone, anything, boyfriend,
bring, check, colleague, contact,
families, family, father, find, finding,
for, friend, help, husband, knows,
looking, lost, mother, out, people, plz,
relatives, relief, rescue, son, still,
update, yet
Request for other
types of help (RH)
animal, anyone, can, dog, evacuate,
looking, offer, organise
Please, send, relief, goods, dire, need,
asking, help
Report of damage
(DP, DH, DE, DC,
DI)
50 cm, across, another, area, at,
basement, been, braces, bridge,
brim, closed, closes, Coming, corner,
crocodile, debris, destroyed,
direction, door, down, ferry, filling,
flash, flat, floating, flood,
floodbound, flooded, flooding , flow,
from, full, getting, gone, good,
height, high, higher, hour, house,
indistinguishable, lake, large, later,
line, low, massive, meant, midday,
near, nearly, next, no , now, on, our,
out , peak, quickly, raw, rising, river,
riverside, roads, rise, scene, second,
serene, sewage, someone, soon,
spewing, still, street, surging,
swallowed, terminal, tide, time,
after, almost, badly, blackout, bldg,
block, bridge, cables, casualties, city,
communication, damaged, destroyed,
detach, disconnects, down, electrical,
electricity, failed, fallen, falling, giant,
help, hit, hitting, houses, impassable,
knocks, leaning, lines, lost, need,
number, outage, please, power, roads,
roof, storm, strong, supply, their,
trees, winds
Appendices 265
towers, under, underwater, Water,
waterfront, were, worst
Reporting
community
behaviour (CB, CC)
creeping, donate, evacuating, fever,
flood, grim, helpless, homes,
information, located, looting, lost,
morgues, near, polluted, power,
river, safe, sandbag, shot,
submerged, temporary, washes,
water, wrong
200, electricity, evacuating,
evacuation, evacuees, families, forced,
municipalities, out, residents, waters
Reaction from
community (RE,
RC)
amazing, anyone, asking, avoid, back,
call, charger, check, donate, donated,
extraordinary, floodwater, follow,
great, help, list, needs, offer, out,
pack, people, phenomenal, photo,
picture, please, proud, really, safe,
session, suffering, superb, together,
try, volunteer, when
badly, haven't, help, need, now,
please, reaching, received, send, yet
Others (OM, OS,
OG, ON, OR)
According, business, buy,
comparisons, ideological, God, lord,
love, mercy, miracle, pray, prayer,
price, purchase, sexy
analyst, article, beautiful, believe,
bless, breaking, calm, charts,
discussion, glad, God , heart, hell,
heroes, jobs, lord, love, mercy,
mighty, miracle, pray, prayer,
psalm,report, sex
Table 31: Common keywords in qldfloods and Yolanda dataset based on their
coding categories
266
Appendix F: Extending with Wikipedia & Wordnet
Expansion of the keywords often falls under query expansion strategy
(Anagnostopoulos, et al., 2012; Lau, et al., 2011). This is generally conducted using
various methods that include searching for synonym via designated lexical
database, looking for other Lexemes or word forms, fixing spelling mistakes (such as
pls to please). This section describes the method and findings related to this .
Using Wordnet to find Synonym
In order to expand the queries, it is a common practice to use wordnet
(Banerjee & Pedersen, 2002; Montejo‐Ráez, Martínez‐Cámara, Martín‐Valdivia, &
Ureña‐López, 2014) as it hosts the synonyms based on their “senses” or “Lexemes”.
For example, if the word “brother” is searched through wordnet, it returns the
following “senses” ‐ blood brother, buddy, chum, crony, pal, sidekick, comrade. As
it can be seen from the example, all the senses carry different meaning. Among
these senses, even though “blood brother” is potentially what people would look
for in the tweet, it is unlikely to type “blood brother” in the tweet. Similarly, they
are not likely to write about their “chum”. However, it is possible that they may
look for their “pal” or “buddy” which are common language to look for friend.
Therefore usage of Wordnet still remains relevant.
Using wikipedia to find related keywords
Using wikipedia categories on the other hand has not been used often in
disaster context. However when the same word “brother” is searched through
wikipedia an interesting observation can be made. According to the wikipedia
template, “brother” is grouped under “Family” which also lists related words such
as “sister”, “son”, “daughter” etc. Therefore by looking for words that belongs to
the same group, it is possible to expand the list of keywords better than wordnet.
Figure 54 demonstrates an example wikipedia template category (often located at
the bottom of the page) which lists all possibly related words that wikipedia
contributors though is related to the word Roof.
Appendices 267
Figure 54 : Wikipedia group for the word roof
Comparing wikipedia and wordnet
Table 32 lists the keywords that can be identified through both wordnet and
wikipedia based on the two words “brother” and “roof”. From the table it can be
seen that even though wikipedia categories are not synonyms, they belong to the
same group that is likely to be searched for. For example, when someone tweets
about roof blowing away, someone else might talk about bedroom getting flooded.
Instead of looking for exact synonyms through Wordnet or other lexical categories,
identifying which group the word belongs to and finding other words from the
same group is likely to generate better filtered tweet.
extractio
n method
Brother Roof
Wikipedia Spouse, Husband, Wife,
Parents, Father, Mother,
Children, Son, Daughter,
Siblings, Sister, Uncle, Aunt,
Nephew, Niece,
Grandchildren, Grandson,
Granddaughter,
Grandparents, Grandfather,
Grandmother, Great‐
grandchildren, Great‐
grandson, Great‐
granddaughter, Great‐
grandparents, Great‐
grandfather, Great‐
grandmother, Great‐uncles,
Granduncle, Grandaunt,
Arch, Baluster, Ceiling, Colonnade, Column,
Floor, Gate, Lighting, Medaillon, Ornament,
Portico, Vault, Ballroom, Buttery,
Conservatory, Courtyard, Drawing room,
Lumber, Parlour, Saucery, Sauna, Scullery,
Servant room, Smoking room, Solar room,
Spicery, State, Swimming pool, Undercroft,
Bathroom, Bedroom, Boudoir, Cabinet, Jack,
Nursery, Suite, Toilet, Attic, Basement, Box,
Cloakroom, Closet, Electrical, Equipment,
Furnace, Garage, Janitorial, Larder, Laundry,
Mechanical, Pantry, Root, Semi‐basement,
Spear, Storm, Studio, Wardrobe, Wine,
Wiring, Workshop, Alcove, Atrium, Balcony,
Breezeway, Conversation, Deck, Elevator,
Entryway, Foyer, Hallway, Loft, Loggia, Patio,
268
Great‐nephews,
Grandnephew, Grandniece,
Cousin, Parents‐in‐law,
Mother‐in‐law, Father‐in‐law,
Sister‐in‐law, Brother‐in‐law,
Siblings‐in‐law, Son‐in‐law,
Daughter‐in‐law, Children‐in‐
law
Porch , screened, sleeping, Ramp, Secret,
Stairs, Terrace, Veranda, Vestibule, Billiard,
Bonus, Common, Den, Dining, Ell, Family,
Garret, Great, Hearth, Home, Kitchen,
Kitchenette, Living, Man, Private, Recreation,
Shrine, Study, Sunroom
Wordnet
brother, blood brother,
buddy, chum, crony, pal,
sidekick, comrade
ceiling, cap
Table 32: Related keywords based on two given keywords
Findings with expanded queries
As it can be seen from Figure 55, inclusion of expanded queries resulted in
improved performances. On top of 4 entries under request for help category with
the brother keyword (Fig 67), wikipedia entries registered additional 122 entries. By
evaluating further it reveals that it indeed finds crucial tweets such as
“@ANCALERTS #RescuePH My grandparents need an urgent help, thou we do not
have any connections with them yet. (cont) http://t.co/9DZaYaHS0h:” or “Looking
to help a friend find news of her husband working in the Ormoc area of Leyte.If
anyone knows anything.Please let me know #YolandaPH”. Although tweets under
not related category still remains the biggest category, findings from this expansion
finds lot more important tweets. Words from the Worndet category however did
not find any important tweet as expected.
Tweets related to damage also added another 286 tweets that had other words
found from wikipedia category for the word “roof”. And these tweets were
genuinely important for emergency services. For example, “AKLAN: Kalibo Airport
still closed, damaged roofs. Fair weather. Uprooted trees and posts on highways.
#YolandaPH @philredcross” or “No water or electric supply in #Bohol Most of
affected municipalities are Alicia, Buenavista, Carmen, and Trinidad #Haiyan
@SC_Humanitarian” had genuine reports of the situation. Word from the Wordnet
category also resulted in tweets about a ceiling collapse ‐ “UP Town Center ceiling
collapses, injures 3 http://t.co/e95cHeTOdh #YolandaPH”; which also suggests
useful tweet.
However, the biggest issue remained is the large section of unimportant tweets.
Once these tweets were evaluated it can be seen that, a large section of the tweets
Appendices 269
also contains unimportant words. For example, tweets with “brother” also had
keyword from the unimportant category list, such as “All my prayers to our
brothers and sisters that our affected by Yolanda there in Tacloban. Keep safe!
#PrayForThePhilippines #YolandaPH”. On top of having country level name of the
place, it is the spiritual word in the tweet that makes it unimportant for emergency
services.
Figure 55 : Expanding query for two keywords
Similar patterns was seen in the extended queries as well. For example,
“Praying my little cousin stays she and away from be typhoon hitting the
#philippines #PrayForThePhilippines #family”, and “Abba Father, embrace our dear
land, the Philippines. May your love, grace, mercy and compassion be upon Your
people. #Haiyan #YolandaPH” both were found in the Fig 62 result and fell under
“not relevant” category and both had words that was in the negative list.
With regards to the expanded search that used groups related to “roof” also
had similar pattern. For example, one of the related word was “home”, which
270
resulted in tweets such as “Reporters are always braving the elements in the line of
duty. Bravo to all of you.May God bring you home safely to your
families.#YolandaPH”. Once again, it had the word “God” from the unimportant
keyword list.
As including the expansion list increases the scope of the project, it was not
executed further but it suggests that including wikipedia and wordnet can be a
viable keyword list extension tool.
Appendices 271
Appendix G: Using Co‐occurance of keywords
One of the way to address the issue that occurs with single keyword is to use
co‐occurence of keywords (Matsuo & Ishizuka, 2004; Schatz, Johnson, Cochrane, &
Chen, 1996). For example, “please help” is extremely different than “please RT”
because in one tweet someone might be asking for help and therefore important
for emergency services but in another tweet they are asking to promote an existing
tweet and is not important for emergency services.
Stop words removal
However, there are additional issues when co‐occurance is extracted from
twitter using an automated system. The first problem is conjunctions such as “and”.
For example, if a tweet is asking for food and water, and co‐occured words with
“food” is search, it will generate “food and” as the answer. However in this case,
identifying “food water” will be more meaningful as that will have stronger
indication of importance. Therefore by removing all Stop words based on NLTK
database, tweets were processed to identify which keywords are associated with
the words “help” and “please”.
Removal of stop words is a commonly used practice in natural language
processing and is commonly used in search engines to identify key words people
are asking (Manning & Schütze, 1999). Although various research has used
different variety of n‐grams (n number of words) to identify co‐occurred words in
discovering topics with natural language processing, for this part bi‐grams were
used to find out which two words are often‐assocaited in the important tweets.
Introducing Stemming
Once again, all the words were stemmed to ensure they match the root form in
order to eliminate variations. Therefore, helped, helping, help will all be counted as
one instead of three separate words.
From the list of co‐occurred words in Fig 68 (sorted based on request for help
category after stop words were eliminated and words were reduced to their basic
form), it can be seen that “please help” was the highest co‐occurred words that
included either “please” or “help”. Although “help victim” was the second most co‐
occurred keyword pair, it also appeared highly in the “not relevant” category.
Similarly, “help typhoon” and “help Philippines” was high in both lists. Further
analysis reveals that this is due to many tweets that were asking for generic help
who may not actually be in the affected area.
272
Figure 56 : Presence of same word across multiple categories
When the list of keyword is expanded beyond the top keywords to something
more important, such as food, the results were similar (Fig 69 with limiting data to
at least 4 occurrence). Top co‐occurred words “food” & “water” were present in
both important and not important categories. However, when the tweets were
evaluated, the contents showed a clear difference of why one of the tweet was
inside important category and why the other was not. For example, “Bogo City,
Appendices 273
Cebu is also in dire need of food and water. Dinadaan‐daanan lang. They haven't
received any relief goods yet. #ReliefPH #kristv” was in the in the Request for help
category but “Concerns Grow Over Pace of Aid to #Philippines, situation grows
more desperate, supplies food & water running low http://t.co/WL2jrWkvIe” was
rightly in the not relevant category as it was merely pointing to the New York times
report.
Figure 57 : Presence of food & water across two categories
Again, the results in Figure 56 and Figure 57 reflects the same findings as other
keyword related findings that it is extremely difficult to identify important tweet
based on the keyword alone. Therefore the next section looks at part of speech to
find out if finding part of speech will be able to determine is the tweet was
important or not.
274
Appendix H: Using Sentiment Analysis
Although sentiment analysis was not addressed in the Phase 1, it is often a
feature used by various twitter researchers. Therefore it was tested to see if this
can identify important tweets. Two sentiment analysis module was used for this
test. One is “Pattern Analyzer” based on Pattern library (De Smedt & Daelemans,
2012) and the other is “Naive Bayes Analyzer” which was trained using NLTK movie
corpus review.
Pattern Analyzer
Pattern has been used for opinion mining and sentiment analysis in various
projects, notably to analyse tweets in Belgian elections in 2010. By calculating
sentiment analysis of each word and then combining the scores of tweet it delivers
a score ranging from −1 (nega ve) to +1 (posi ve). For analysing sen ment of
Yolanda tweets, pattern library was used for the entire dataset and which resulted
in a score that ranged from the positive to negative.
Naive Bayes Analyzer
The default training set Naive Bayes Analyzer that was used for this test was
trained with a movie review dataset. Although for In an ideal situation a Naive
Bayes classifier should be trained using dataset that is suitable for the task, it has
been reported to perform well for other situations as well (Weichselbraun, Gindl, &
Scharl, 2013; Xia, Zong, & Li, 2011). Therefore the default option was used to test
how well it performs.
Appendices 275
Figure 58 : Overall Findings from sentiment analysis using Pattern and Naive
Bayes Analyzer
As it can be seen from Figure 58, the results are anything but consistent. From
the pattern based sentiment analysis most of the tweets were classified as neutral.
On top of that there were more positive sentiment then negative sentiment.
Naive Bayes analyses rather performed better as it can be seen from the figure.
However as the focus is to understand if these can be used to determine important
tweets, the three important categories were separated (Figure 59).
276
Figure 59 : Sentiment analysis using Pattern and Naive Bayes Analyzer on tweets
from 3 categories
According to both pattern and naive bayes analysis, categories under
infrastructure damage, request for help or population displacement has a large
percentage of positive as well as neutral sentiments. For example, “Roofs flying,
trees uprooted, fallen at 6am. Catastrophic is an understatement for #YolandaPH
#Haiyan #PHSaveChildren #SC_Humanitarian” was classified under “neutral” with
pattern analyser (score of 0.00) although this is definitely an important tweet.
Similar to that, “Oh no! Hope everyone in the #Philippines is OK! Super typhoon
Haiyan just broke all scientific intensity scales http://t.co/hx5nKZuxgz” have been
classified as negative with the naive bayes, “No electricity now here at Gandara
Samar so dark outside and only the strong wind and rains can be heard plus the
frogs kokak @philredcross” was identified as positive.
Based on the results it can be suggested that sentiment analysis, at least with
the default options is unable to identify important tweets, rather using sentiment
analysis for disaster tweet is likely to to create more noise. Although training Naive
Bayes dataset with specific disaster related tweet may be able to identify important
278
Appendix I: Using part of speech
Phase 1 results also indicates that certain parts of speech such as verb,
adjective, adverb are usually more prominent in important categories. In addition
to that, Part of speech has been used by various research to analyse crisis related
twitter dataset (Corvey, et al., 2010; Imran, et al., 2013b; Panem, et al., 2014;
Verma, et al., 2011) as well. However each research project have focused on
various part of speech. Some have focused on verb, while some other looked at
personal pronoun, adverb, determiner.
Since the data set used in this research was pre‐evaluated, part of speech
detection algorithm was applied on each tweet to see if there is any specific pattern
in the tweets. For example, if the tweets with infrastructure damage has more verb,
then verb should be looked for in the tweet. And for the purpose of this research,
Carnegie Mellon Ark‐Tweet‐NLP (Chris & Schneider, 2012) was used. Similar to
named entity, there are various competing part of speech tagger available. Among
them, notables ones are : Stanford Named Entity recognition (Finkel, et al., 2005) ,
University of Washington Twitter NLP Tools (Ritter, et al., 2011) and Carnegie
Mellon Ark‐Tweet‐NLP (Chris & Schneider, 2012).
Figure 60 : Overall distribution of Part of Speech in Yolanda tweets from 4
categories
Appendices 279
Based on that analyses in Figure 60, it can be seen that as a single feature part
of speech is also unable to determine important tweet. However there is indeed
more percentage of verb in the request for help on needs category compared to
other categories.
In Phase 1, addressing to a prominent user was found to be a marker of
importance. However, Figure 61 suggests that, that itself is not a good indication as
well because a large number of not related tweets were addressed to someone else
as well. Position of hashtag was tested as well and based on the result it can be
seen that, hashtag positions were also unable to provide a conclusive answer.
Figure 61 : Position of at mention and hashtag in different categories.