Identifying Software Project Risks: An International Delphi Study ROY SCHMIDT, KALLE LYYTINEN, MARK KEIL, AND PAUL CULE ROY SCHMIDT is Assistant Professor of Business Computer Systems in ihe Foster College of Business Administration, Bradley University. He also served as a founding faculty member of the Hong Kong University of Science and Teclinology. His re- search interests include support of the strategic decision process, executive informa- tion use. information systems project management, and information systems project risk management. He has presented his research in Communications of the ACM. Decision Sciences Journal. Information Systems Management. International Confer- ence on Infonnation Systems, and at tnajor international and national conferences. He also serves as a member of the editorial board of the Journal of Information Technol- ogy. Before entering academia. Dr. Schmidt managed several large-scale software development projects during a 22-year career in the U.S. Air Force. KALLE LYYTINEN is a full professor in Information Systems at the University of JyvSskyla, Finland. He currently serves on the editorial boards of Information Sys- tems Journal. European Journal of Itiformation Systems, Accounting, Management and Infonnation Tecfmology. Infonnation Systems Research. Infonnation Technology & People, Requirements Engineering Journal, and Jounial of Strategic Information Systems. Since 1997 he has been a Senior Editor of MIS Quarterly. He has published over 70 articles and edited or written six books. His research interests include infor- mation system theories, system design metbod.s and tools, system failures and risk assessment, electronic commerce, computer-supported cooperative work, decision- making theories, and diffusion of complex standardized technologies. MARK KEIL is Associate Professor in the Department of Computer Information Sys- tems at Georgia State University. His research focuses on software project manage- ment, with particular emphasis on understanding and preventing software project escalation. His research is also aimed at providing better tools for assessing software project risk and removing barriers to software use. Keil's research has been published in MIS Quarterly, Joumat of Management Information Systems. Shan Management Review, Communications of the ACM. IEEE Transactions on Engineering Manage- ment, Decision Support Systems, and other journals. He currently serves as coeditor oi Database and as an Associate Editor for the MIS Quarterly. PAUL CULE is an assistant professor of Management in tbe College of Business Ad- ministration at Marqueite University. His research interests are in organizations in transition, information technology, reengineering, software development methods, and management, as well as the roles of IT in changing societies. He bas been pub- lished in Communications of tfie ACM, Database. Infonnation Systems Management, and tbe proceedings of ICIS and AIS. Prior to embarking on an academic career he spent 33 years in industry in Britain, Canada, and Ibe United States. His experience Joumat of Management Inforttiaiion Synettu / Spring 2001, Vol. 17. No, 4. pp. 5-36, 3 2001 ME, Shanx.Inc. 0742-1222/2001 $9.50 + 0.00.
Transcript
Identifying Software Project Risks:An International Delphi Study
ROY SCHMIDT, KALLE LYYTINEN,MARK KEIL, AND PAUL CULE
ROY SCHMIDT is Assistant Professor of Business Computer Systems in ihe FosterCollege of Business Administration, Bradley University. He also served as a foundingfaculty member of the Hong Kong University of Science and Teclinology. His re-search interests include support of the strategic decision process, executive informa-tion use. information systems project management, and information systems projectrisk management. He has presented his research in Communications of the ACM.Decision Sciences Journal. Information Systems Management. International Confer-ence on Infonnation Systems, and at tnajor international and national conferences. Healso serves as a member of the editorial board of the Journal of Information Technol-ogy. Before entering academia. Dr. Schmidt managed several large-scale softwaredevelopment projects during a 22-year career in the U.S. Air Force.
KALLE LYYTINEN is a full professor in Information Systems at the University ofJyvSskyla, Finland. He currently serves on the editorial boards of Information Sys-tems Journal. European Journal of Itiformation Systems, Accounting, Managementand Infonnation Tecfmology. Infonnation Systems Research. Infonnation Technology& People, Requirements Engineering Journal, and Jounial of Strategic InformationSystems. Since 1997 he has been a Senior Editor of MIS Quarterly. He has publishedover 70 articles and edited or written six books. His research interests include infor-mation system theories, system design metbod.s and tools, system failures and riskassessment, electronic commerce, computer-supported cooperative work, decision-making theories, and diffusion of complex standardized technologies.
MARK KEIL is Associate Professor in the Department of Computer Information Sys-tems at Georgia State University. His research focuses on software project manage-ment, with particular emphasis on understanding and preventing software projectescalation. His research is also aimed at providing better tools for assessing softwareproject risk and removing barriers to software use. Keil's research has been publishedin MIS Quarterly, Joumat of Management Information Systems. Shan ManagementReview, Communications of the ACM. IEEE Transactions on Engineering Manage-ment, Decision Support Systems, and other journals. He currently serves as coeditoroi Database and as an Associate Editor for the MIS Quarterly.
PAUL CULE is an assistant professor of Management in tbe College of Business Ad-ministration at Marqueite University. His research interests are in organizations intransition, information technology, reengineering, software development methods,and management, as well as the roles of IT in changing societies. He bas been pub-lished in Communications of tfie ACM, Database. Infonnation Systems Management,and tbe proceedings of ICIS and AIS. Prior to embarking on an academic career hespent 33 years in industry in Britain, Canada, and Ibe United States. His experience
Joumat of Management Inforttiaiion Synettu / Spring 2001, Vol. 17. No, 4. pp. 5-36,
3 2001 ME, Shanx.Inc.0742-1222/2001 $9.50 + 0.00.
6 SCHMIDT, LYYTINEN, KEtL, AND CULE
Spans manufacturing, marketing, software developnfient, global product planning, andstrategy development.
ABSTRACT: Advocates of software risk management claim that by identifying andanalyzing threats to success (i.e., risks) action can be taken to reduce the cbance offailure ofa project. The first step in theriskmanagement process is to identify tbe riskitself, so tbat appropriate countermeasures can be taken. One problem in this task,however, is that no validated lists are available to help the project manager under-stand the nature and types of risks typically faced in a software project. This paperrepresents a first step toward alleviating this problem by developing an authoritativelist of common risk factors. We deploy a rigorous data collection metbod called a*'ranking-type" Delpbi survey to produce a rank-order list of risk factors. This datacollection method is designed to elicit and organize opinions of a panel of expertsthrough iterative, controlled feedback. Three simultaneous surveys were conductedin three different settings: Hong Kong, Finland, and tbe United Stales. This u'as doneto broaden our view of the types of risks, rather than relying on tbe view of a singleculture—an a.spect tbat has been ignored in past risk management research. In form-ing (he tbree panels, we recruiled experienced project managers in each country. Thepaper presents the obtained risk factor list, compares it with other published riskfactor lists for completeness and variation, and analyzes common features and differ-ences in risk factor rankings in tbe three countries. We conclude by discussing impli-cations of our findings for both research and improving risk management practice.
KEY WORDS AND PHRASES; Delphi technique, IS project risk management, IS riskmanagement, risk assessment.
IT REMAINS A SAD STATISTIC that too many software development projects end infailure [1!, 26,39,40|. Fully 25 percent of all software projects are cancelled outrigbt111]. As many as 80 percent of all software projects run over their budgets [40], withthe "average" software project exceeding its budget by 50 percent [11. 18]. It is esti-mated tbat three-fourths of all large systems are "operational failures"" because theyeither do not function as specified or are simply not used f 11]. Hence it is no surprisethat avoidance of failure is a dominant tbeme in the Information systems (IS) literature(although it is often couched in more positive terms). Since a large proportion of tbecauses for late, over-budget delivery of software are management-related (39], thesearch for appropriate managerial action to solve this problem bas been intense. Amongadvocated methods for improving software project management, the concept of soft-ware project risk management has gained prominence (see [4, 13, 19,311). Advocatesof software project risk management claim thai by identifying and analyzing threats tosuccess, action can be taken to reduce the chance of failure |5, 6, 7].
The obvious first step in software project risk management is ihe identification ofthe risks to be controlled. Software project risk bas been defined as ihe product ofuncertainty associated with project risk factors and the magnitude of potential lossdue to project failure [3]. Thus tbe key elements to be controlled are the project risk
IDENTtFYlNG SOFTWARE PROJECT RISKS 7
factors [19]. Consistent with the views of March and Shapira [28] regarding manage-ment risk, we define a risk factor as a condition that can present a serious threat lo thesuccessful completion of a software development project.
Three questions about risk factors stand in the way of developing a more disci-plined approach to software project risk management:
1. What are the typical risk factors software project managers face?2. Which risk factors do software project managers consider more deserving of
their attention?3. Which countermeasures are the most effective in mitigating risk, given a par-
ticular set of risk factors?
In this paper, we address the first two questions, in order to lay a foundation forfurther research and the development of theory that might help us answer the thirdquestion. None of these questions has been adequately treated in the past literature.Though several lists of risk factors have been published in the literature (e.g.. [2, 3,4,14,29, 30, 321), our understanding of the typical risk factors is still inadequate. Mostof the published lists are relatively old and vary too much in their level of detail andscope to provide a foundation for more systematic risk detection and theory building.Two reasons for this are that they have been derived using limited samples, and therigor of the data collection and analysis procedures used is questionable. Further-more, the data collection has relied on samples taken from a single culture, possiblybiasing findings. In addition, we currently lack knowledge of the relative importanceof different risk factors, because previous studies have not been based on methodsdesigned to yield valid and reliable rankings. In this paper, we begin to address theseissues by developing a ranked risk factor list using a rigorous data collection andanalysis prtKedure. The investigation was carried out in three different countries tolessen the effect of a single-culture bias and to broaden our view of risk factors andtheir ranking. These three countries not only represent different cultures, bul alsodifferent socioeeonomic contexts.
The remainder of the paper is organized as follows. First, we describe the back-ground and motivation for our research. Second, we discuss the research design andmethodology used in conducting the empirical study. Third, we present the majorfindings of the study by: (1) reporting a new list of risk factors and comparing this listwith other risk factor lists (i.e., [3,4,5,30]) for coverage and novelty, and (2) discuss-ing the relative ranking of the risk factors. Next, in our discussion section, we specu-late as to the source of some of lhe differences that were observed across the threepanels and discuss the implications of our study for both research and practice. Fi-nally, we discuss the limitations of the study, consider the potential for future re-search, and summarize the conclusions that can be drawn from our study.
Background
DIRECTLY OR INDIRECTLY, both the software project management literature and the ISimplementation literature deal with the subject of project risk, but there has been only
8 SCHMIDT. LYYTINEN. KEIL. AND CULE
limited cross-fertilization between these iwo streams of literature. Although the uni-fication of these two streams is beyond the scope of this paper, we lay the ground-work for further research to bring them together
The software project management literature views risk management as a two-stageprocess: assessing the risk, and taking action to control it 14, 7, 19]. The first stage,risk assessment, consists of three steps: (1) identification of risk factors, (2) estima-tion of the likelihood for each risk factor to occur, along with potential damage fromthe risk, and (3) an evaluation of total risk exposure. The sticking point here is theidentification of the risk factors that need to be controlled, if there are no gtHxl mecha-nisms 10 help project managers identify all pertinent risk factors, the value of any riskmanagement exercise is low. Several methods for identifying risk factors have beensuggested, such as scenarios, examination of past or analogous situations, brainstomi-ing, or other creative methods (see e.g.. |4, 7, 14]). Most of these methods assumethat managers have the requisite experience to be aware of all pertinent risk factors.However, this is not necessarily the case. Moreover, many of these methods can betime-consuming and thus too costly to use on a regular basis.
One popular method for identifying risk factors, therefore, has been the use ofchecklists. With a risk factor checklist, project managers can avoid overlooking somerisk factors. Many such checklists can be found in the software project managementliterature. Boehm 14, 5| provides one typical checklist based on his informal discus-sions within TRW. Barki et al. [3] developed a comprehensive list of risk factors fromthe literature (including the implementation literature to that date) and organized theminto five general risk categories by factor analyzing a composite list administered inthe form of a survey. However, the studies upon which Barki et al. based their com-posite list have been shown to be flawed in their data collection methods 127]. Point-ing up the flaws, Moynihan |30] showed some gaps in the Barki et al. list through aninformal survey of 14 Irish software project managers.
The IS implementation literature represents another stream of research that hasfocused on the identification of factors that can affect project success. This body ofliterature includes two distinct substreams: "factor research" and "process research"121. 24, 25]. Here, our focus will be on the factor research stream, since it is moredirectly related to the identification of project risk factors.
The factor research stream emerged in the late 1960s, in response to the growingnumber of implementation failures [37]. Both management scientists and IS researchersbecame interested in understanding the factors associated with success or failure inImplementing systems. Factor research led to the identification of many variables thatcould potentially influence implementation. Alter 11 ]. Davis [9|, McFarlan 129], andothers contributed their own evaluations of success and risk factors. Zmud [41 ] groupsthese variables into four categories: organizational characteristics, environmental char-acteristics, task characteristics, and individual characteristics. To these. Lucas [25]adds technical characteristics, client actions (e.g., top management support and userinvolvement), and attitudes toward the system. While the factor research stream hasled to the nomination of hundreds of specific candidate factors, top management
IDENTIFYING SOFTWARE PROJECT RISKS 9
support is the one that appears to be most consistent across multiple studies [ 12,21 ].Factor research has also emphasized high-quality system design and developer-userinteraction |24].
The lack of cross-fertilization between the IS implementation factor stream and therisk management stream is somewhat puzzling considering the similarities in the twobranches of research. Prior research in both of these streams has contributed to ourunden;tanding of project risk factors. However, there is still a lack of consensus re-garding the risks that can affect software projects and their relative importance. Thereis also a lack of synthesis of previous findings. So, we believe that there are at leastfour compelling reasons for reexamining this topic.
First, in most previous studies the identification of risk factors was either not prop-erly grounded or was based on a review of prior literature that is somewhat dated.When we say some prior studies were not properly grounded, we mean that eitherthey did not collect data from project managers or they did not collect their data inatiy sort of systematic or scientifically rigorous way. Furthermore, the most widelycited studies on software risk (i.e.. [2. 4. 9. 29]) drew their data from large, main-frame-based projects undertaken during the 1970s and 1980s. The organizational andtechnological landscape, however, has changed considerably during recent years: Neworganizational forms and systems development environments have emerged, newmechanisms have evolved for acquiring systems (e.g., outsourcing and strategic alli-ances), and the centralized, mainframe-centric systems architecture has given way toclient/server computing [20, 33]. Hence the very dynamics of the software develop-ment environment may have rendered previous risk checklists obsolete. Today's ap-plications often reach outside the organization and their development involvesnumerous parties and complicated organizational structures IIO]. At the same time,techniques and technologies available for developing software have undergone sig-nificant improvements, which may have reduced the importance of some risk items(such as performance issues).
Second, none of the previous studies on software project risks systematically ad-dress the relative importance of various risk factors. Thus the inclusion criteria forfactors that should be on a risk checklist and their ranking in terms of relative impor-tance have remained nebulous.
Third, previous attempts to produce a comprehensive list have been limited by thelack of a cross-cultural perspective. Therefore, published lists may be biased by aspecific culture's way of channeling management perception and its propensity tohandle and manage risky situations. That is, almost all earlier studies are based onU.S. data alone. We believe it is necessary to widen our view and therefore conductsimultaneous surveys on risk factors in culturally different settings.
Finally, the research community would benefit from the unification of the softwareproject risk research stream and the risk factor implementation research stream. Con-sequently, by comparing our findings to both streams, we can contribute to this unifi-cation. For all of the above reasons, there is ample justification for developing a fresh,up-to-date risk checklist.
10 SCHMIDT. LYYTINEN, KEIL. AND CULE
Table 1. Cultural Dimensioti Scores for Panel Settings [15, 16]
Cultural Dimension
SettingsPower Uncertainty
Distance Avoidance Individualism Masculinity
FinlandHong KongUnited Stales\4edian ol 53 countries
33684062
59294670
63259136
26576250
Design of the Study and Research Method
THE AIM OF THIS STUDY IS TO DEVELOP an authoritative list of risk factors, and todetermine which of those risk factors are most important. An obvious source for suchinformation is an expert in the field with years of experience in managing softwaredevelopment projects. However, a single expert is not likely to have the personalexperience of all development situations needed to yield a comprehensive list of fac-tors. To ensure a reliable and validated data collection process we must open ourinquiry to divergent opinions and seek feedback-based convergence and closure onthe factors that really count in software development. Therefore a ranking-type Delphisurvey [36], designed to elicit the opinion of a panel of experts through iterativecontrolled feedback, was chosen as the research method for this study. We formed ourpanel of experts by recruiting project managers with many years of experience fromthree different socioeeonomic environments. We also used systematic procedures toelicit and rank risk factors.
Composition of the Panels
To achieve variation in respondents' background and cultural settings. Hong Kong(HKG). Finland (FIN), and the United States (USA) were chosen as the target popu-lations from which the panelists were drawn. These choices were not merely ones ofconvenience. On Hofstede's 115, 16] four-dimension scale of cultural differences(which includes uncertainty avoidance, individualism, power distance, and masculin-ity) HKG, the USA, and FIN differ markedly, as shown in Table I. Given such differ-ences, our sample provides the means to transcend the monocultural view of softwareproject risk that dominates the literature. In addition to the cultural differences iden-tified by Hofstede, the three countries also provide a contrast in socioeeonomic con-ditions in that HKG represents extreme laissez-faire capitalism, FIN is a Scandinavianwelfare state with considerable state intervention, and the USA is a managed marketeconomy. In spile of these differences, all three countries are very similar in terms ofadvanced uses of information and communication technologies and each has a rela-tively long history of exploiting computing applications, which helps to ensure thatthe findings have some general validity.
TDENTIFYING SOFTWARE PROJECT RISKS 11
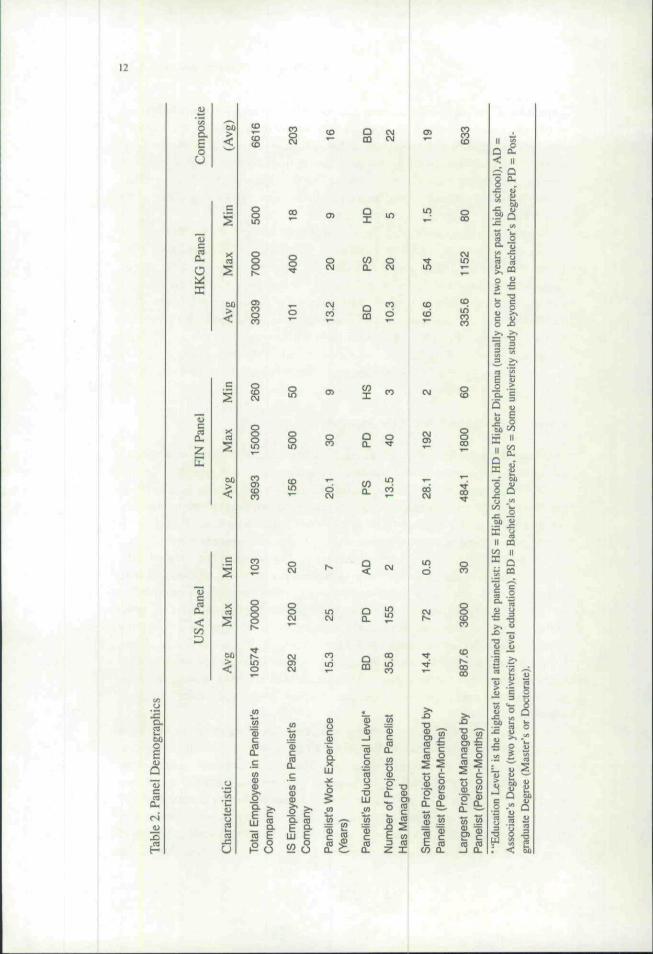
We recruited the members of the three expert panels from among experienced projectmanagers in each culture. We asked senior IS executives in major corporations ineach locale to identify their most experienced and successful project managers. Fromamong ihose candidates, we solicited participation from managers with at least fiveyears of experience in project management. The demographics of the three panels(shown in Table 2) indicate that all of the panelists had impressive experience in thearea of software project management.
The panels were formed on the basis of their cultural background. For example, wetried to avoid expatriate panelists in Hong Kong. We started with 11 panelists in HKG,13 panelists in FIN, and 21 panelists in the USA. Since the analyses of the panels'responses would not be affected by panel size [36]. there was no need to match thesizes of the panels. The aim was to form panels that were large enough to allowdiversity of opinion, but small enough to allow the panelists to handle the volume offeedback. After the first phase, two panelists in HKG emigrated, reducing the panelsize to nine. Two USA panelists also dropped out before the ranking phase, leavingthe panel size at 19. The FIN panel remained stable throughout the survey.
Data Collection and Analysis Method
Data collection and analysis were based on Schmidt's [361 method, in which theDelphi survey process is divided into three phases, as shown in Figure I. In the firstphase, a brain-stonning round is conducted to elicit as many items as possible fromthe paneUs). All panels participate cooperatively in the first phase to ensure that [heyare all working from a common list of items with common definitions. Each panelistwas asked to submit at least six factors, and to provide short descriptions of the fac-tors, to aid the researchers in their collation effort. Two of the authors worked inde-pendently to collate the responses. Then the two independently constructed lists werecompared and reconciled by all authors working together. Exact duplicates were re-moved, and an explanation of the groupings was provided to the panelists. The com-bined list was circulated to all panelists for corrections, additions, and eventuallyvalidation. This sort of validation has not been present in any previous study. Thus,we started with a common list with common definitions that we could analyze sepa-rately within each of the three panels. Thus we could be assured that when the samefactor was selected by more than one panel it would indeed be the same factor, notjust a "similar" factor.
In the second phase of the study, we separated the panels by country, allowing eachpanel to independently pare down the list of risk factors. We sought to narrow the listof factors to a manageable number (a target of about 20 factors has been suggested136]) so that they could be meaningfully ranked by each panel. Rather than force thesize of the list ("top ten," etc.) we let the panelists decide how many factors should beincluded. Working from a randomized list of risk factors, the panelists were asked tochoose (but not to rank) at least ten factors that they considered most deserving oftheir attention and resources. Our criterion for narrowing the list was that factors
12
oU
io4
Q .
o
II
2
art<
CDOCNJ
ooo
CO
8
If
inO
<0ctaQ.
cCO
LU
O)
CJCO
Pan
el
ZE
i
X
>
260
000
i n
COenCOCO
oin
oc
s oCM
Q OJCQ CM
OX
U) OQ. OJ
CO " ^
X
P 2 ^
(00
oCM
Q<
Q.
LU
iO ^
oCO
152
toiri
8o
ears
two
y
QCL.
JJ
«ouu
u
o
ooCO
00
CT3
in
ooCO
CD
CO f L
I "
M O
(13 C
c o
If
0) ™p ^C (A3 (0
Z X
ject
2n
0)
mal
t
CO
son
cu
anel
1^
arge
son
0)
a.
anel
Q.
Q
i 1E «
I!
CQ
2^ Q^ CQ
s
c O
s o u• - ^ ra
-< Q ao
IDENTIFYING SOFTWARE PROJECT RISKS 13
Phase 1:Brain storming
• risk items are soliciled from all 3 panels (yielding >150 ilems)• exaci duplicaics are removed (leaving 150 remaining ilems)• remaining items are combined and grouped (yielding 53 unique factors)• list of grouped factors is validated by panelists
f
Phase 2:Narrowing Down
1
• each panel, operating independenlly of the others, pares the list down• each panelist selects his/her most important risk factors• risk factors selected by a majority of the panelists are retained• thus, each panel reduces the list of 53 factors lo a more manageable size• HKG panel retains 15 factors; FIN pane! 23: and USA panel 17
Phase 3:Ranking
•each panel, operating independently of the others, produces a ranked list• each panelist rank orders the risk factors on his/her panel• a niean rank is calculated for each item• degree of consensus within ihe panel is assessed using Kendall's W• feedback is shared with panelists who again are asked to rank the risks• process continues until strong consensus is reached or consensus plateaus
Figure 1. Descripuon of Delphi Survey Process Used in This Study
chosen as important by over half the panelists were retained for the ranking phase.Through this simple majority vote, the panels effectively reduced the lists to manage-able sizes and the resulting lists reflected a majority opinion of the importance ofthese items within each panel. Through this process, the HKG panel reduced the listto 15 factors, the FIN panel chose 23 factors, and the USA panel pared the list to 17factors (see Appendix 1).
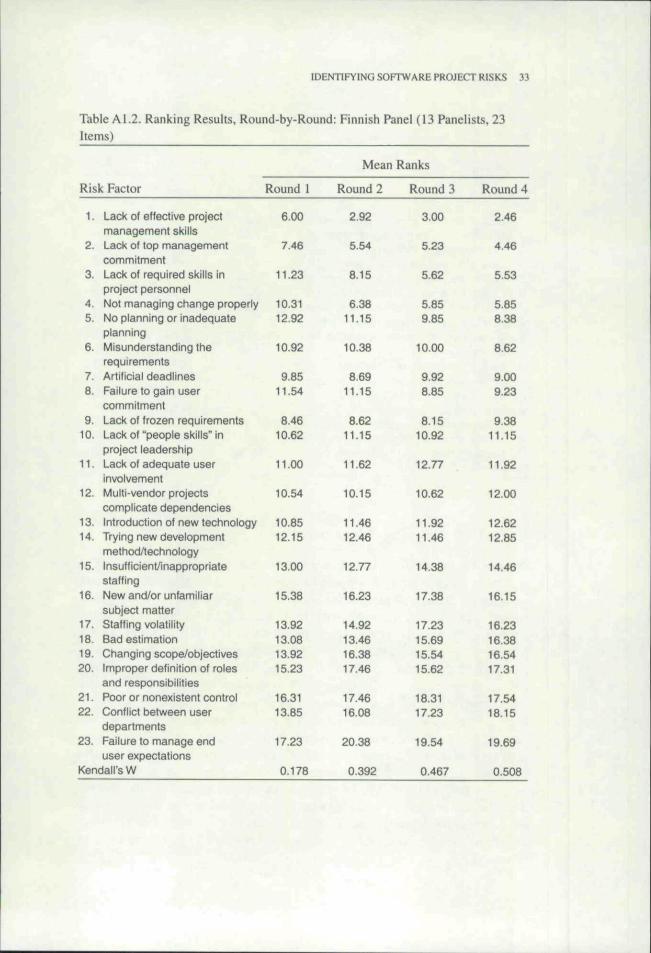
The ranking of the selected factors was done in the third phase. Here panels rankedthe risk factors in order of priority—that is, the top-ranked factor would he the factormost deserving of the project manager's attention. The panelists were also asked torate the risk factors according to their relative importance to the successful comple-tion of a project. The importance ratings were used in a separate analysis of riskmanagement behavior, which was reported elsewhere [23]. Multiple ranking roundswere conducted until each panel reached an acceptable level of consensus. In thisstudy we measured the degree of consensus among the panelists using Kendall's co-efficient of concordance (W) [36.38]. To minimize bias in ranking for the first round,the factors to be ranked were provided in a different random order for each panelist.In subsequent rounds the factors were listed in the order of their average receivedranks within each panel. The ranking rounds stopped when either: (1) the coefficientof concordance indicated a strong consensus (W>0,70), or (2) the level of consensusfor the panel leveled off in two successive rounds. Round-by-round results are shownin Appendix 1, Tables Al.l , A1.2, and A1.3. The USA panel reached strong agree-ment (W>0.70) after three rounds, the HKG panel had moderate agreement for thesecond and third rounds (W>0.50), and the FIN panel required four rounds beforetheir consensus plateaued at the moderate level (W>0.50).
14 SCHMIDT. LYYTINEN. KEIL. AND CULE
Results
New Risk Factor List i
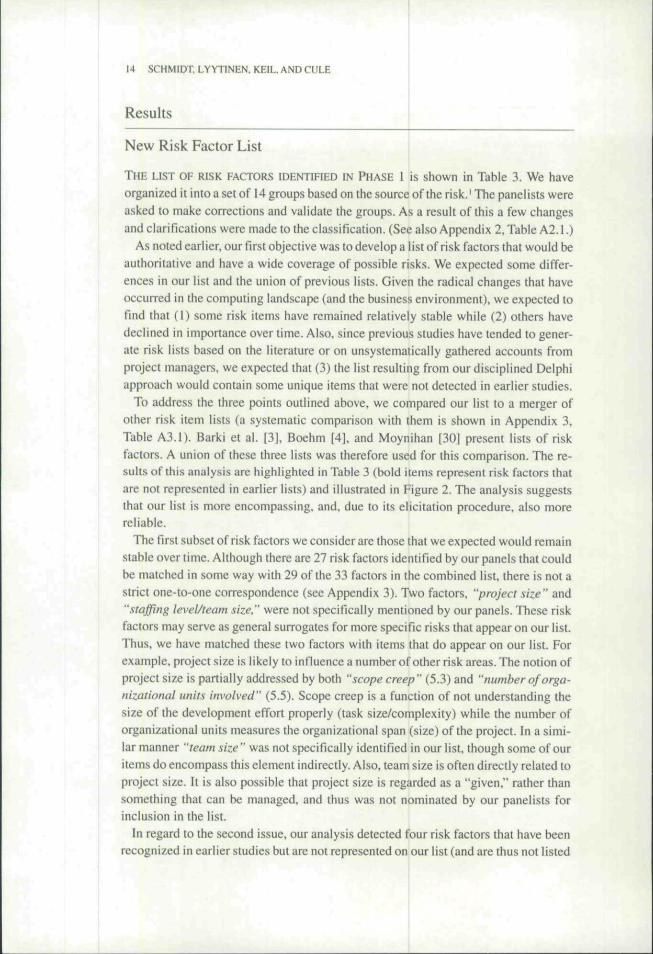
THE LIST OF RISK FACTORS fDENTiFiED IN PHASE 1 is shown in Table 3. We haveorganized it into a set of 14 groups based on tbe source of the risk.' The panelists wereasked to make corrections and validate the groups. As a result of this a few changesand clarifications were made to the classification. (See also Appendix 2, Table A2.1.)
As noted eariier. our first objective was to develop a list of risk factors that would beautborilative and have a wide coverage of possible risks. We expected some differ-ences in our list and the union of previous lists. Given the radical changes that haveoccurred in the computing landscape (and the business environment), we expected tofmd that (I) some risk items have remained relatively stable while (2) others havedeclined in importance over time. Also, since previous studies have tended to gener-ate risk lists based on the literature or on unsystematically gathered accounts fromproject managers, we expected that (3) the list resulting from our disciplined Delphiapproach would contain some unique items that were not detected in earlier studies.
To address the three points outlined above, we compared our list to a merger ofother risk item lists (a systematic comparison with them is shown in Appendix 3,Table A3.1). Barki et al. [3], Boehm [4], and Moynihan [30] present lists of riskfactors. A union of these three lists was therefore used for this comparison. The re-sults of this analysis are highlighted in Table 3 (bold items represent risk factors thatare not represented in earlier lists) and illustrated in Figure 2. The analysis suggeststhat our list is more encompassing, and, due to its elicitation procedure, also morereliable.
The first subset of risk factors we consider are those thai we expected would remainstable over time. Although there are 27 risk factors identified by our panels that couldbe matched in some way with 29 of the 33 factors in the combined list, there is not astrict one-to-one correspondence (see Appendix 3). Two factors, "project size" and"staffing level/team size," were not specifically mentioned by our panels. These riskfactors may serve as general surrogates for more specific risks that appear on our list.Thus, we have matched these two factors with items that do appear on our list. Forexample, project size is likely lo influence a number of other risk areas. The notion ofproject size is partially addressed by both "scope creep" (53) and "number of orga-niza/ional units involved" (5.5). Scope creep is a function of not understanding thesize of the development effort properly (task size/complexity) while the number oforganizational units measures the organizational span (size) of the project. In a simi-lar manner "team size" was not specifically identified in our list, though some of ouritems do encompass this element indirectly. Also, team size is often directly related toproject size. It is also possible that project size is regarded as a "given." rather thansomething that can be managed, and thus was not nominated by our panelists forinclusion in the list.
In regard to the second issue, our analysis detected four risk factors that have beenrecognized in earlier studies but are not represented on our list (and are thus not listed
IDENTIFYING SOFTWARE PROJECTRISKS \5
Table 3. Full List of Risk Factors
1. Corporate Environment
1.1 A climate of change in the business and organizational environment that createsinstability in the project.
1.2 Mismatch between company culture and required business process changesneeded for new system. A mismatch between the corporate culture and thechanges required by the new system.
1.3 Projects that are intended to fail: Projects started for political reasons thatcarry no clear business value, but serve to divert the organization's focusfrom actual needed change. Such projects are underfunded, not supported,and are not intended to succeed. Projects have no business vaiue and areused as diversionary tactics to avoid facing the real change needs.
1.4 Unstable corporate environment: Competitive pressures radically alter userrequirements, sometimes making the entire project obsolete.
1.5 Change in ownership or senior management: New owners and/or managersset new business direction that causes mismatch between corporate needsand project objectives.
2. Sponsorship/Ownership
2.1 Lad< of top management commitment to the project.Th'ts includes oversight byexecutives and visibility of their commitment, committing required resources,changing policies as needed.
2.2 Lack of client responsibility, ownership, and buy-in of the project and its deliveredsystem(s).
2.3 Failure to gain user commitment: Laying blame for "lack of client responsibil-ity" on the project leader rather than on the users.
2.4 Conflict between user departments: Serious differences in project goals,deliverabies, design, etc., caiis into question concept of shared ownership.
2.5 Failure to get project plan approval from all parties.
3. Relationship Management
3.1 Failure to manage end-user expectations: Expectations determine the actualsuccess or failure of a project. Expectations mismatched with deliverable—too high or too low—cause problems. Expectations must be correctlyidentified and constantly reinforced in order to avoid failure.
3.2 Lack of adequate user involvement: Functional users must actively participate inthe project team, and commit to their deliverabies and responsibilities. User timemust be dedicated to the goals of the project.
3.3 Lack of cooperation from users: Users refuse to provide requirements and/orrefuse to do acceptance testing.
3.4 Failure to identify all stakeholders:Tunnei vision leads project managementto ignore some key stakeholders in the project, affecting requirementsdefinition, implementation, etc.
3.5 Growing sophistication of users leads to higher expectations: Users aremore knowledgeable, have seen sophisticated applications, apply previousobservations to existing project.
3.6 Managing multiple relationships with stakeholders: Some "clients" are also"partners" in producing deliverabies in other projects. Leads to confusion ofroles and responsibilities.
3.7 Lack of appropriate experience of the user representatives: Users assigned wholack necessary knowledge of the application or the organization.
Continued
16 SCHMIDT, LYYTINEN. KEIL. AND CULE
Table 3. Full List of Risk Factors (Continued)
4. Project Management
4.1 Not managing change properly: Each project needs a process to managechange so that scope and budget are controlled. Scope creep is a function ofineffective change management and of not clearly identifying what equalssuccess.
4.2 Lack of effective project management skills: Project teams are formed andthe project manager does not have the power or skills to succeed. Projectadministration must be properly addressed.
4.3 Lack of effective project management methodology:The team employs nochange control, no project planning or other necessary skills or processes.
4.4 improper definition of roles and responsibiiities: Members of the project team andthe organization are unclear as to their roles and responsibilities. This includesoutsourcers and consultants.
4.5 Poor or nonexistent control: No sign-offs, no project tracking methodology,unaware of overall project status, "lost in the woods."
4.6 Poor risk management: Countering the wrong risks.4.7 Choosing the wrong development strategy: e.g. waterfall, prototyping, etc.
5. Scope
5.1 Unclear/misunderstood scope/objectives. It is impossible to pin down the realscope or objectives due to differences or (uzziness in the user community.
5.2 Changing scope/objectives: Business changes or reorganizes part waythrough the project.
5.3 Scope creep: Not thoroughly defining the scope of the new system and therequirements before starting, consequently not understanding the true work effort,skill sets and technology required to complete the project.
5.4 Project not based on sound business case: Users and developers ignore businessrequirements, develop system for sake of technology.
5.5 Number of organizationai units involved: increased number of lines of communica-tion and conflict potential expands the scope of the system.
6. Requirements
6.1 Lack of frozen requirements. Because the needs of the users change, the require-ments change. Consequently the system will never be moved into productionbecause none of the requirements are ever completed. Atternativeiy, freezing asubset of the functionality and delivering allows for the completion of the systemand update releases as required,
6.2 Misunderstanding the requirements. Not thoroughly defining the requirements ofthe new system before starting, consequently not understanding the true workeffort, skill sets and technology required to complete the project.
6.3 New and/or unfamiliar subject matter for both users and developers: Lack ofdomain knowledge leads to poor requirements definition.
7. Funding
7.1 Underfunding of development: Setting the budget for a development effort beforethe scope and requirements are defined or without regard to them (i.e.. picking anumber out of the air).
7.2 Underfunding of maintenance: Support for products in the maintenance phase. Ifthe customer is unprepared or does not budget for this, the project can be judged afailure even if successful in all other aspects.
IDENTIFYING SOFTWARE PROJECT RISKS 17
7.3 Bad estimation: Lack of effective tools or structured techniques to properlyestimate scope of work. Unrealistic cost estimates cause illogical or suboptimalplanning, strategy, and decisions.
7.4 "All or nothing": Requires budgeting entire project at the outset, leading to underfunding in later years of project.
8. Scheduling
8.1 Artificial deadlines. Presence of unrealistic deadlines or functionality expectationsin given time period. "Crash projects" in which test time or training time is re-duced—using something other than work effort required to determine when thenew system should move into production.
8.2 "Preemption" of project by higtier priority project: fAanagement \jnab\e toresolve conflicting schedule demands.
9. Development Process
9.1 Lack of effective development process/methodofogy: Leading to qualityproblems—Documentation, Software and Testing—poor estimating—insufficient time for up-front work, for example, design—little flexibility forchange—insufficient testing.
9.2 7>y/ng new developtnent method/technology during important project.
10. Personnel
10.1 Lack of required knowledge/skills in the project personnel: for example, technology,business knowledge, and experience.
10.2 Lack of "people skills" in project leadership: PM tries to "manage" schedules,technology, requirements, etc., ignoring that management Is dealing withpeople on the team.
10.3 Poor team relationships: Strains existing in the team due to such things as burnoutor conflicting egos and attitudes.
11. Staffing
11.1 Insufficient/inappropriate staffing: Not enough people or people with wrong skills/insufficient skills assigned to project, regardless of availability.
.1,2 Staffing volatility: At some point in the project, losing the key project manager,analysts or technicians (especially in new technology).
11.3 Excessive use of outside consultants: Can lead to a conflict of interest, forexample, billable hours vs. budget, or resulting in the internal staff nothaving significant involvement
11.4 Lack of available skilled personnel: People with the right skills are notavailable when you need them.
12. Technology
12.1 Introduction of new technology: Using new, or "bleeding edge," technology that hasnot been used successfully at other companies, or major technological shift occursduring the project.
12.2 Stability of technical architecture: Has to be done before comparableapplications.
13. External Dependencies
13.1 External dependencies not met: The project's consultants or vendors do notdeliver, go out of business, or are unclear as to their roles and responsibilities.
Continued
18 SCHMIDT. LYYTINEN. KEIL, AND CULE
Table 3. Full List of Risk Factors (Continued)
13.2 Multi-vendor projects complicate dependencies: Integration of packages frommultiple vendors hampered by incompatibilities and lack of cooperation betweenvendors.
13.3 Lack of control over consultants, vendors, and subcontractors: Schedule orquality problems beyond control of project manager. No legal recourse dueto poor contract specification.
14. Planning
14.1 No planning or inadequate planning: Attitude that planning is unimportant orimpractical.
in Table 3). Interestingly, among these are the only two risks appearing on the com-bined list that directly relate to technological problems—namely "real time perfor-mance shortfalls " and "developing wrong itxterface." These two items are from Bochm[4). It appears that the importance of these technological risk factors may have dimin-ished over the last 10 years, perhaps due to better performance and scalability ofhardware and software, and the widespread adoption of graphical user interfaces.
The other two risk factors that were not matched with any factors mentioned by thepanelists in our study were "team members have not worked together before" and"type of users." But these two factors were not validated by Barki et al. [3], and thuswere dropped from their final list after they had completed their survey.
The third issue involves the risk factors not mentioned in previous studies. As noted,the panels brought up 26 new faclors (as indicated by the hold items in Table 3). Thusour list greatly increases the coverage of known risk factors and also suggests thatsome new elements of risk have emerged during the last decade. Three major groups
IDENTIFYING SOFTWARE PROJECT RISKS 19
of risks and several new, unexplored facets of software project management surfacefrom these 26 new factors.
A large number of the new risk factors relate to managing user relationships anduser expectations. Though user-related risks have been recognized in the past ("un-willing users," "user resistance") the level of detail in clarifying user-related risks inthis study is considerably higher. For example, today users must take responsibilityfor system development and the resulting system. If this is not possible, the projectbecomes more risky (Factor 2.3). Users must also be more involved in developmentactivities (Factor 3.2). Moreover, users' expectations must be set realistically (Factor3.1). Interestingly, many of these findings are similar to those obtained from imple-mentation research [8. 24].
A second major topic deals with inadequate project mamtgement methodologiesand project management skills. This is an interesting finding, as it points out theawareness and need for disciplined management practices and recognizes their ab-sence as an important source of risk (Factors 4.2, 9.1, 9.2).- Although such factorshave not been recognized in previous risk management research, they have been raisedin process improvement research (e.g., [17]). The implementation literature has alsostressed the need for better project management skills (e.g.. [8]).
The third major topic of new risk items deals with the turbulence oftlie businessenvimntnents in which systems development takes place. This topic represents a largelyunexplored area in software risk management, software project management, andimplementation research as well, though it received partial mention by Moynihan'sproject managers [30]. Nowadays, systems can become obsolete overnight due tochanges in business strategy. Therefore the demand for short delivery times is high(Factor 5.2). Also associated wiih the turbulence in the business environment werechanges in business ownership or senior management (Factor 1.5) and impacts of thebusiness environment (Factor 1.1).
Although organizational politics and organizational culture (Factors 1.1, 1.2, 1.3)were nol reflected in the previous risk lists, these issues have long standing in the ISliterature [8, 241, and thus do noi represent new findings per se.
The remainder of the new risk factors address largely unexplored areas in softwareproject risk management. These deal with such topics as the diversity and multiplicityof stakeholders and user communities (Factors 3.4, 3.5, 3.6); critical aspects in thematiagement environment (Factors 4.6, 4.7, 14.1); and the evolution of the IT itifra-structure (Factor 12.2). Many of these are not just new factors—they are new themesthai invite research and that refiect the dynamic nature of IS development and ihechallenges it creates for project managers.
Given the number of "new" risks identified in this study, it is important to ask thequestion, "'Are these risks really new?" Had earlier risk studies been conducted in asystematic manner similar to this study, it is conceivable that such risk factors wouldhave surfaced. But it is more likely that the increasing pervasiveness of IT in allaspects of our daily lives has sensitized executives to the need to exercise much moreoversight on IS projects. This, in turn, has pushed these risks to prominence in theminds of project managers.
20 SCHMIDT. LYYTINEN, KEIL. AND CULE
Ranking of Risk Factors
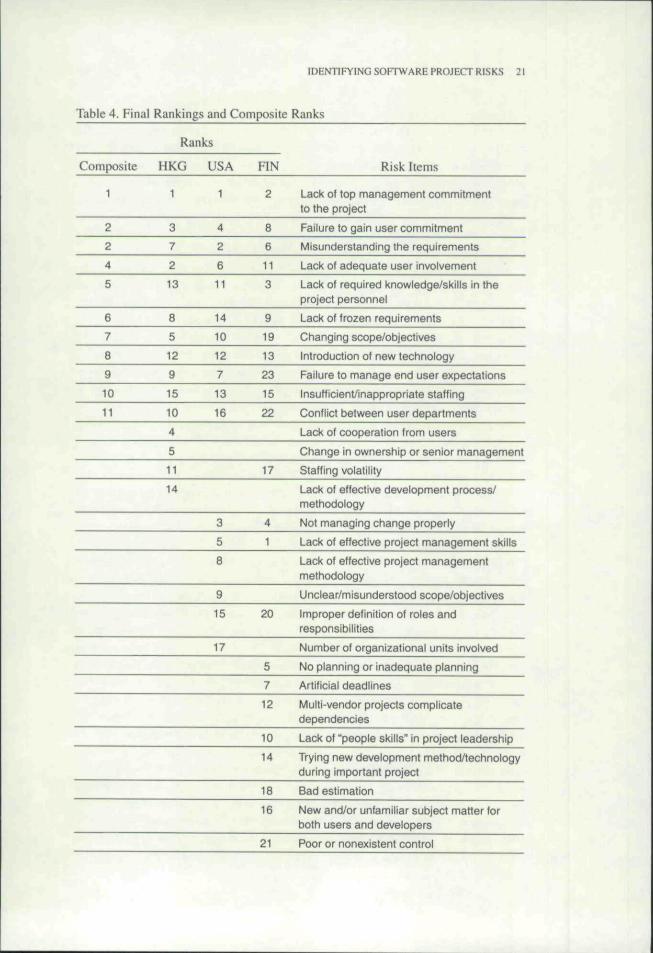
In Table 4 we summarize the eleven facton; common to all three panels in the order oftheir average relative ranks. It is derived from the final results of all rankings, asexhibited in Appendix I. The table also shows final rankings for the 29 factors rankedby all three panels in whole ranks. Some factors that one or two panels felt to be moredeserving of attention were not ranked by others. For example, the top-ranked factorfor the FIN panel was "lack of effective project management skills." This was alsoranked fifth by the USA pane!, but the HKG panel did not select this item for rankingat all. This supports our assumption that sampling from a single culture would tend toleave us blind to many important risk factors. These factors are situation-dependent,so it is difficult to generalize a "top-ten" risk factor list across different cultural set-tings. For example, if we restrict ourselves to the top five factors for each panel, thenthe three panels have only one item in common.
If we are looking for something that all three panels had in common, then we shouldlook at the entire list of 53 items in Table 3. A common unifying theme in this list, asnoted above, is that not a single one of the risk factors included has much to do withthe traditional "technical" aspects of software development, such as choice of pro-gramming language, operating system compatibility, equipment constraints, or userinterfaces. One major technical concern relates to architectural stability. Another itemwe can classify as being "technology" combines aspects of managerial choices abouttechnology and the management of change entailed bjf its introduction into the orga-nization (Factor 12.1). I
The ranking exercise, overall, confirms that the lack of top management commit-ment is the factor that software project managers felt was most deserving of theirattention (ranked first for the USA and HKG panels, second for the FIN panel). Al-though this is not a novel finding (top management support is a recurring theme in theimplementation literature), it is an issue that has been ignored in some eariier rankings(e.g., Boehm's list). The emphasis placed on this factor was prominent to the extentthat some panelists referred to it as a "fatal" factor in its own right. They chose theterm "commitment" rather than "support" to indicate the strong, active role top man-agement must play in the project from initiation through implementation. Given theimportance ascribed to this factor, there is certainly justification for further researchto determine the means by which project managers can ensure that they have theappropriate type and level of commitment from senior management [35].
Beyond this obvious consensual top choice, it is difficult to order the remainingfactors universally across all three panels with much statistical confidence. The pan-elists were also asked to rate risk factors on a sliding scale of "importance." In doingso they were allowed to assign the same rating to more than one risk factor. Theseresults were not useful for ranking purposes, but did help us group some risk factorsaccording to their relative importance. Using this scale, three factors stood out asreceiving a high rating from all three panels: (1) lack of top management commit-ment. (2) failure to gain user commitment, and (3) misunderstanding the require-ments [23].
[DENTrFYlNG SOFTWARE PROJECT RISKS 21
Table 4. Final
Composite
1
2
2
4
5
6
7
8
9
10
11
Rankings and Composite
Ranks
HKG
1
3
7
2
13
8
5
12
9
15
10
4
5
11
14
USA
1
4
2
6
11
14
10
12
7
13
16
3
5
8
9
15
17
FIN
2
8
6
11
3
9
19
13
23
15
22
17
4
1
20
5
7
12
10
14
18
16
21
Ranks
Risk Items
Lack ot top management commitmentlo the project
Failure to gain user commitment
Misunderstanding the requirements
Lack of adequate user involvement
Lack of required knowledge/skills in theproject personnel
Lack of frozen requirements
Changing scope/objectives
Introduction of new technology
Failure to manage end user expectations
Insufficient/inappropriate staffing
Conflict between user departments
Lack of cooperation from users
Change in ownership or senior management
Staffing volatility
Lack of effective development process/methodology
Not managing change properly
Lack of effective project management skills
Lack of effective project managementmethodology
Unclear/misunderstood scope/objectives
Improper definition of roles andresponsibilities
Number of organizational units involved
No planning or inadequate planning
Artificial deadlines
Multi-vendor projects complicatedependencies
Lack of "people skills" in project leadership
Trying new development method/technologyduring important project
Bad estimation
New and/or unfamiliar subject matter forboth users and developers
Poor or nonexistent control
22 SCHMrOT. LYYTINEN. KEIL. AND CULE
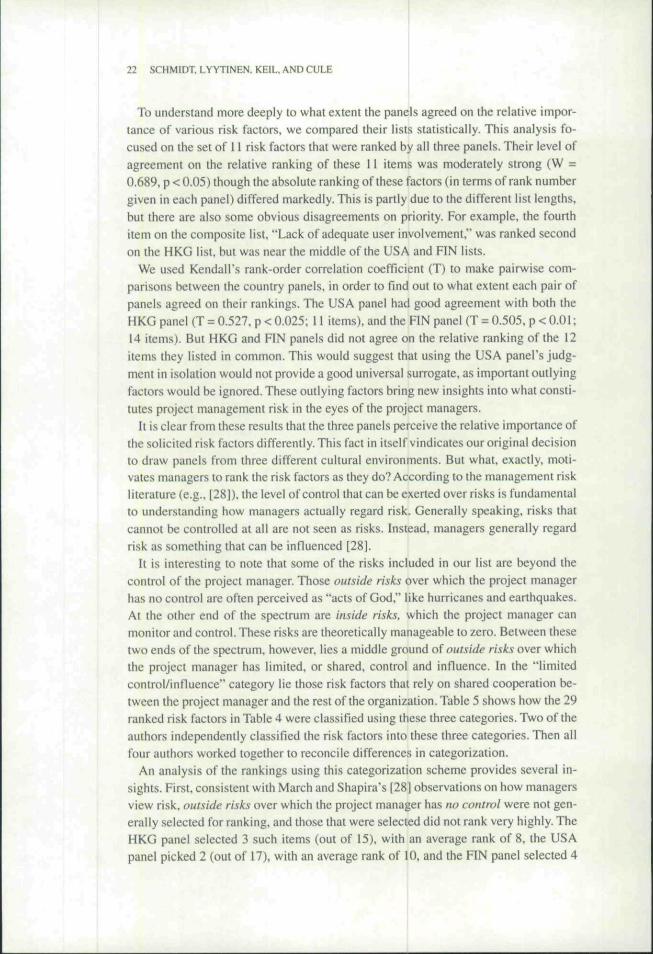
To understand more deeply to what extent the panels agreed on the relative impor-tance of various risk factors, we compared their lists statistically. This analysis fo-cused on the sei of 11 risk factors that were ranked by all three panels. Their level ofagreement on the relative ranking of these 11 items was moderately strong (W =0.689, p < 0.05) though the absolute ranking of these factors (in terms of rank numbergiven in each panel) differed markedly. This is partly due to the different list lengths,but there are also some obvious disagreements on priority. For example, the fourthitem on the composite list, "Lack of adequate user involvement," was ranked secondon the HKG list, but was near the middle of the USA and FIN lists.
' We used Kendall's rank-order correlation coefficient (T) to make pairwise com-parisons between the country panels, in order to find out to what extent each pair ofpanels agreed on their rankings. The USA panel had good agreement with both theHKG panel {T = 0.527. p < 0.025; 11 items), and the RN panel {T = 0.505, p < 0.01;14 items). But HKG and FIN panels did not agree on the relative ranking of the 12items they listed in common. This would suggest that using the USA panel's judg-ment in isolation would not provide a good universal surrogate, as important outlyingfactors would be ignored. These outlying factors bring new insights into what consti-tutes project management risk in the eyes of the project managers.
It is clear from these results that the three panels perceive the relative importance ofthe solicited risk factors differently. This fact in itself vindicates our original decision
' to draw panels from three different cultural environments. But what, exactly, moti-vates managers to rank the risk factors as they do? According to the management risk
' literature (e.g., 128]). the level of control that can be exerted over risks is fundamentalto understanding how managers actually regard risk. Generally speaking, risks thatcannot be controlled at all are not seen as risks. Instead, managers generally regardrisk as something that can be influenced [28].
It is interesting to note that some of the risks included in our list are beyond thecontrol of the project manager. Those outside risks over which the project managerhas no control are often perceived as "acts of God." like hurricanes and earthquakes.At the other end of the spectrum are inside risks, which the project manager canmonitor and control. These risks are theoretically manageable to zero. Between thesetwo ends of the spectrum, however, lies a middle ground of outside risks over whichthe project manager has limited, or shared, control and influence. In the "limitedcontrol/influence" category lie those risk factors that rely on shared cooperation be-tween the project manager and the rest of the organization. Table 5 shows how the 29ninked risk factors in Table 4 were classified using these three categories. Two of theauthors independently classified the risk factors into these three categories. Then allfour authors worked together to reconcile differences in categorization.
An analysis of the rankings using this categorization scheme provides several in-sights. First, consistent with March and Shapira's [28] observations on how managersview risk, outside risks over which the project manager has no control were not gen-erally selected for ranking, and those that were selected did not rank very highly. TheHKG panel selected 3 such items (out of 15), with an average rank of 8. the USApanel picked 2 (out of 17), with an average rank of 10, and the FIN panel selected 4
II
23
ou"SCOly;
O
CQU.v:
oftw
ar
toococs.E
"a—
'o
irvil
tSc
'ithi
:SP V
a.o
E3• o
Uts
i
O
ot ico
U
plel
EoU
ence
3
C
o
1coU•o
1
u
enc
3
c
o
trol
c
Uo
2:
ro
i
0.Q.
ro
=3m L L
15
03
E
ra
O
CL •= i i « cr
^ £ 8 o oCD :?
cu raX E -^
LJ .
I
ro o cC 05 OC Q. CC — 1-ro o o°- "̂ oO ffl O
111ro "o w
^ C Q)
c .i ro3 5 CO
c
E0)ra
^ e IO *^ roj= -p ra
l|iillo TD a.0 ) <D <U
11
*- u.F, X
42 S
11£ o
B
D-
roB
0) c
3 c c :•= .Q) 2;
u.LL i O
3 ^* O
c "o c
E-5ia) 0) ^. t -^ (0= 5 05
Q) roo-ffi ro9 CS CD
o o ^ _ ^ ^ _O <U r; "o 9- Q- B
o to O O
-J 0; < I J £
pan
a• o
(D(0
etw
een
nflic
t
oO
o
>eni
oQ .
x:tn
n ow
ner
• —
rocra
6
u.^ X
emen
t hD
iatil
ity
ro >
nana
iffin
g
• - rain
c3
1(0
)f or
gan
mbe
r
z
u.CO
dU
dor
proj
gj c^ a>o ^- "5
w
ra
13CO
3<uZ
24 SCHMIDT. LYYTINEN. KEIL, AND CULE
{out of 23), with an average rank of 17. Further analysis reveals that the paneliststended to select and rank highly those risk items over which they had limited controlor influence. The HKG panel picked 8 such items (out of 15). the FIN panel selected9 iiems (out of 23), and the USA panel picked 8 items (out of 17). Consistent withwhat March and Shapira's [28] observations would suggest, the relative ranks of theseitems were much higher (HKG 4.7, USA 8.3, and FIN 6.5). Finally, risk items underthe direct control of project managers (inside risks) were ranked lower than outsiderisks over which project managers had only limited control or influence. The HKGpanel picked four such items (out of 15), the USA panel 7 (out of 17), and FIN 10 (outof 23). Here a much higher variation between panels could be observed, as discussedin the next section. This finding is also in consonance with March and Shapira'sobservations in that the managers appear to be looking at the magnitude of loss asso-ciated with the risks and not the expected loss, since the probabilities associated withsome of the risks would argue against the relative rankings as assigned by the panels.
Discussion and Implications
IN THIS SECTION, WE FIRST DISCUSS SOME CULTURAL FACTORS that may have contrib-uted to the differences among the panels in their relative ranking of risk factors. Thenwe examine some of the implications of our findings in terms of research and practice.
Differences Between Risk Factor Rankings
There is a clear need for some explanation of the wide variations between panelswhen the risks are categorized according to level of control. Although no specificloliow-up research has yet been done to seek rigorous explanations, the authors candraw upon their own considerable knowledge of the three cultures to speculate on anumber of possibilities as a basis of discussion on the differences in ranking.
Perceived level of control relates clearly with cultural differences in individualism,power distance, and uncertainty avoidance. Cultures with a collectivist philosophycan be expected to avoid attributing risks to an individual. When the project manageris also in a position of pronounced subservience, the perceived loss of control overoutside risks is strong. As we might expect, the HKG panel selected 8 of their 15factors from among those beyond tbe purview of the project manager (see Table 5). Incontrast, both the FIN panel (15 factors) and the USA panei (11 factors) placed a clearmajority of their choices among those that were attributable to the project manager.
If we narrow our view to those factors with a mean rank less than 10, we find thatthe FIN and USA panels chose 6 out of 9 and 7 out of 10, respectively, in the categoryunder the purview of the project manager. The HKG panel placed only 3 out of 11 inthis category. This suggests that the choices of risk factors in the HKG panel may bepartly attributable to the culturally based philosophy of HKG managers. It thus sug-gests a fundamental difference between the FIN/USA and the HKG panels in terms ofrisk factor perception. Furthermore, the HKG panel identified most threats to success
IDENTIFYING SOFTWARE PROJECT RISKS 25
as being due to outside agencies not under ihe control of the individual. We believethis is also consistent with Hofstede's characterization of cultural differences amongthe countries in our study on his "individualism" dimension. HKG managers workunder the assumption that responsibility is shared. This may also help explain whythe HKG panel tended to ignore those risks that are within the purview of the projectmanager. Finally, the choice of risks outside the purview of the project manager pos-sibly reflects the greater power distance that exists in HKG society, which is influ-enced by Confucian ethics. Factors that depend on the actions of superiors areconsidered very risky by HKG managers because they feel at a loss to influence theirsuperiors' actions.
Another possible cultural difference in the selection and ranking of risk factors isseen in the focus on the capabilities of the project manager by tbe FIN panel, and tbelack of such risk factors on tbe HKG panel's list. The HKG panel (and to a certainextent tbe USA panel) represents a "masculine" culture, where personal inadequaciesare not readily admitted. On tbe other hand, tbe FIN panel represents a culture withvery low masculinity and a strong Protestant ethic. It is in tbe nature of people in thisculture to be very self-critical, so their focus on their own lack of project managementskills makes sense in this light.
In addition to possible cultural biases in the evaluation of risk factors, we must alsonote that other differences in tbe socioeconomic environments of the three countriesmay have affected the choice and ranking of risk factors. Here, some specific aspectsstand out. For example, HKG managers have bad to cope with a very dynamic staff-ing situation due to the very mobile population of the territory. Emigration regularlysiphoned off experienced people from the workforce. Tbus HKG managers may havebecome more sensitized to the risks posed by personnel turnover as well as suddenchanges in ownership or senior management. Accordingly, the HKG managers lookon these risks as something they can manage through proper preparation, whereasFIN and USA managers perceive these more as "acts of God."
In sum, the introduction of the possible effects of differences in cultural backgroundand socioeconomic conditions on tbe three panels enriched our results by wideningtbe scope of risk factors under consideration. Furthermore, the differences in list com-position and ranking of factors help us understand tbe roies responsibility and controlplay In tbe perception of the relative importance of risk factors and the fact that theydo vary across cultures.
Implications for Research
One of our objectives in conducting tbis research was to build a foundation for theory-building about IS project risk management. With over 30 years of intensive research,we still lack a basic understanding of w/iy certain managerial actions serve to mitigatemultiple risks, and under what conditions these actions are no longer effective. Whensetting about to discover what practicing managers do, if researchers overlook somerisk factors, then tbe subjects of their studies are not asked to respond to tbose factors.Thus some of their practices are not captured (see, e.g., 134]). By developing a more
26 SCHMIDT. LYYTINEN. KEIL. AND CULE
comprehensive list of risk factors, we provide a basis for a more complete investiga-tion of risk mitigation strategies.
Another objective of tbis study was to show that by opening inquiry to multiculturalsources we can broaden our understanding of specific problems. The differences inthe contributions of specific risk factors by each country panel, as well as their differ-ences in ranking risk factors, demonstrate that the multicultural research approachcontributed significantly to the value of our findings.
A third research objective was to contribute to the unification of the software projectrisk stream and the implementation stream. Our risk factor-oriented research actuallyconfirms many of the factors found to be important in the implementation literature-Many of these factors have not been adequately treated in the risk management litera-ture. The implementation literature continues to expand its set of factors by examin-ing specific application domains, such as client/server computing (e.g.. 181). Thecollection of a complete set of risk factors is thus a continuous task with a potentiallyhigh payoff. In this study, we have shown that both the risk factor stream and theimplementation stream can profit from cross-feed of results to provide a broader un-derstanding of software project risk and management practice.
I
Implications for Practice
This study bas several implications for practitioners. First, the list of 53 risk factorsidentified by our panelists provides managers with a more comprehensive checklistthat can be used in developing software project risk assessment guidelines. Boehm14, 5] and others have argued that risks must be identified before they can be ad-dressed. The value of such a checklist was made clear to us when several of ourpanelists requested our permission to use the output of this research for exactly thispurpose. As a result of such requests, several companies that participated in the studyhave now incorporated the risk checklist into their software development methodol-ogy and other companies can follow suit. The checklist (Table 3) has the merit ofheing more comprehensive and grounded compared to earlier lists due to its deriva-tion method: It was created by three panels of practicing, experienced project manag-ers using a rigorous methodology. Our list includes some new factors, but also anumber of risk factors that have been reported in the implementation literature butnot highlighted in the risk management literature.
Second, our study suggests that managers are biased in their attention to particularrisk factors at the expense of other factors. IS project managers appear to be spendingmore of their mitigation efforts on risk factors that are outside their own immediatecontrol, but over which they have some degree of influence. They tend to ignore riskfactors that they perceive to be "acts of God," considering these factors to be unman-ageable. They also are not worried about risk factors arising from activities undertheir direct control, which they can "manage to zero." Another factor causing bias inattention to particular risk factors is the fact that our panelists appeared to evaluate themagnitude of a potential loss due to a risk, without regard to the probability of tbe riskactually having an effect on their project. Rational models of decision-making, such
IDENTIFYING SOFTWARE PROJECT RISKS 27
as the model used by Cbarette 17], assume that managers evaluate risk factors byassigning them a value based on tbe product of magnitude of loss and tbe probabilityof tbe event occurring. Tbe actual bebavior of our panelists likely reflects the atti-tudes of most practicing IS project managers, and confirms tbe findings of March andShapira [28]. Managers should be aware of tbis bias, and make a conscious effort toproperly evaluate risk factors before prioritizing tbe risks for management attention.
Third, our data suggest tbat managers should be aware of possible cultural or envi-ronmental factors that affect both tbe identification and perceived importance of vari-ous risks. Project managers should seek to overcome such bias. Higbly ranked itemsin each country will in all likeiibood be the ones receiving the greatest managementfocus. Since managers can be unduly influenced by their own cultural background,this may lead to a potential shortfall in risk recognition, resulting in ineffective riskmanagement as some risk factors will go unnoticed. Thus, IS project managers indifferent countries/cultures may tend to focus their risk mitigation energies differ-ently. One way to combat this is to use an extensive risk factor list like the one sug-gested in Table 3, as opposed to relying on a country-specific list ibat is both narrowerand subject to cultural bias.
There is, however, a cost associated with relying on a risk checklist that contains 53separate items. Such a list may prove too cumbersome and complicated to use inpractice both because of its size and its lack of a coberenl structure. To overcomethese two limitations (i.e., size and structure), researchers have pointed out tbat riskmanagement can be facilitated if long detailed lists could be grouped by their source[5| into a more systematic framework. In Appendix 2 we show bow tbe risk factorssolicited in tbis study were grouped by source. Managers could use tbis list of 14groups to reduce the cognitive complexity of dealing with a large list of risk items.
For many managers, however, even a list of 14 risk groups can be cumbersome todeal witb. A simpler classification, wbich suggests appropriate risk mitigation bebav-iors, was presented in another, practitioner-oriented paper [23]. However, that frame-work was developed through speculation based on our collective managerialexperiences. Further research is needed to develop a theoretically sound classification.
Conclusions
PRIOR LITERATURE SUGGESTS THAT AN ADEQUATE ASSESSMENT of software projectrisk is a major source of problems in IS development projects [3,5, 19, 291. Keil [22]suggests tbat in order to reduce an organization's exposure to failure in IS projects,managers should assess risks early and constantly throughout the software develop-ment process. However, proper risk assessment and the development of strategies tocounter tbe risks requires an understanding of (1) what the actual risks are. (2) wbichof these risks managers perceive to be more deserving of tbeir attention, and (3) bowthese risk perceptions differ from one culture to another. In this paper, we have takensome steps toward addressing each of these points.
First we used a systematic and rigorous procedure to identify software projectrisks, developing for the first lime an authoritative list of risk factors upon which
28 SCHMIDT, LYYTTNEN. KEIL. AND CULE
further study and theory development can be based. Since the list was based on inputfrom a multicultural set of 41 practicing project managers, we can be fairly confi-dent that it is comprehensive and well grounded. Second, we have identified thoserisk factors that the Delphi panelists ranked as being the most deserving of theirattention in a software project. Third, we have demonstrated that while there is asubstantial area of agreement across different cultures on what .wme of lhe majorrisks are. there are also discernible differences in the identification and perceivedimportance of certain risks.
Since our study employed a different methodology than previous research, thisimpedes our making direct and strong comparisons with earlier studies. Nevertheless,it is interesting to note how our findings compare with previously published literaturein the areas of software project risk and implementation success factors. A compari-son of the list of risk factors generated in this study with those reported in previousstudies (i.e.. [3, 5. 30]) suggests that the current list is a fairly comprehensive one.More risk factors were identified in this study than were validated in previous studiesand (with very few exceptions) our list of risk factors includes practically all of themajor risk elements that were previously identified.
Further comparisons between the risks identified in this study and those reported inprevious studies suggest that project managers' risk concerns may have changed some-what during the last decade, but of course it is difficult to say this with certaintybecause of differences in how the studies were conducted. Where we do find a markedsimilarity, however, is with the contingent success factors reported in the IS imple-mentation literature. These results suggest that project managers are more concernedthan ever before with implementation-related risks, such as commitment from topmanagement as well as users (i.e.. relationship management). In addition, risks asso-ciated with requirements determination, estimation and scheduling, and personnelhave remained high on the management agenda. Furthermore, as we noted earlier, therisk factors identified and ranked were almost exclusively nontechnical.
Limitations of the Study
As with any Delphi-type study, the results are based on a limited number of subjects.While subjects were chosen for their experience in managing software projects andtheir cultural background, we can make no claim about the representativeness of oursample. Our panelists were not chosen randomly and we did not attempt to control foreither the type of industry or type of project. Having said this, we believe that thesample is relatively diverse in that it includes project managers with extensive expe-rience managing both small and large projects working for companies in a wide rangeof industries with both medium and large information systems departments.
Another limitation of the study is that it focuses on three specific countries. There-fore it is difficult to know the extent to which our findings generalize to other coun-tries throughout the world. Furthermore, we can only rely on our own personalknowledge of the cultures involved to speculate as to the differences observed acrossthe three country panels that were included in our study. We also relied upon cultural
IDENTIFYING SOFTWARE PROJECT RISKS 29
differences measured by Hofstede [15, 161 and did not actually make these measure-ments ourselves.
Another significant limitation is the lack of theory to suppon our investigation. Thesoftware project risk literature provides little help in this regard. We look on the cur-rent work as the foundation for developing theory that is specific to software projectrisk management. Only with the rigorous collection and analysis of the data pre-sented in this paper can we proceed to the next step of trying to tie specific manage-ment coping behaviors to the known risk factors. We have confined our theoreticaldiscussions in this paper to an attempt to understand how the panelists perceive riskand how various things may have influenced their relative ranking of the risk factors.
Finally, we chose to conduct our study entirely in English, raising the possibility ofvarying interpretations in a multilingual sample such as ours. Although this decisiondid not pose a problem for our USA or HKG panelists, some of our FIN panelists hadlimited fluency in English and chose to respond in Finnish, necessitating translationof their responses. In spite of the aforementioned limitations, we believe that theresults of the study have important implications for both research and practice.
Directions for Future Research
Although we believe the results of this study will prove useful {as they already havelo some of our panelists), we believe there are many avenues for further research intoIS project risk. Onefeature that distinguishes this study from previous research is thatwe have developed systematic indications of what the most important risks are fromthe perspective of practicing project managers. Thus the results reported here providea useful foundation for other researchers seeking to improve our empirical under-standing of software project risk factors and their variation across time and space.The list of 53 risk factors identified by the three panels (shown in Table 3) provides auseful starting point. Moreover, the 29-factor list representing the union of the rankedcountry lists of risk factors (shown in Table 4) provides a fruitful means of targetingnormative and descriptive IS research into high-risk areas so that effective counter-measures can be developed. Questions worth asking are: "What are the countermea-sures that project managers can employ against each highly ranked risk factor? Whichof these are deemed most effective, and why? What interactions among risk factorsand countermeasures can improve or hinder risk management efforts?" Another in-teresting angle for future research will be to extend this study by examining percep-tions of software project risk from the vantage point of other .stakeholders, such asfunctional area managers and senior executives. It is quite possible that different stake-holders will have divergent opinions regarding what the risk factors are, as well astheir relative importance [34], Finally, the list of risk factors identified in this studyprovides an excellent baseline for future researchers who wish to investigate the ex-tent to which perceptions of software project risks change over time. Here we includeboth changes over time to the risk profile for a particular project as well as whatproject managers perceive to be important risk factors as the field of software devel-opment continues to mature.
30 SCHMIDT. LYYTINEN. KEIL. AND CULE
The study also breaks new ground in providing systematic evidence that risk per-ception is affected by both cultural and environmental factors. Based on this evi-dence, we postulate that cultural elements associated with individualism, masculinity,power distance, and uncertainty avoidance—along with philosophical differences suchas Taoist beliefs and the Protestant sense of guilt—may be related to the way riskitems are recognized and ranked. Similarly, the frequency of some risks (like person-nel turnover) may vary across economic environments, thus affecting their recogni-tion and ranking. This clearly calls for model development and empirical studies thatwould seek to account for observed variation in risk perception and ranking due tocultural, environmental, and individual factors.
Another direction for future research would be to investigate systematically thelinks between various risk factors and their countermeasures at the behavioral andsource level. The results of ihis study, coupled with recent theory development forrisk management (see e.g. 113]). provide a good foundation for further IS research.
As we note above, we still lack theory of risk domains and associated risk behav-iors. There is also a need to investigate how managers today are actually managingriskS'—what works, what does not. and why. Finally, we need to gain a greater con-gruence in the research streams of IS project risk and IS implementation. Althoughwe touch on this issue here, it clearly warrants more in-depth study.
Atknowleiigmeni.s: This project was funded in part by grants from the University Grants Coun-cil of Hong Kong, the College of Business Administration at Georgia State University, and lheAcademy of Finland.
NOTES
1. This organization of the risk factors was not, however, used to select lhe risk factors forranking or during ranking exercises, This strategy was purposefully chosen in order to avoidbias in selecting and ranking the factors. The grouping scheme was developed to organize therisk factor list in a meaningful way.
To accomplish ihis goal two of the four authors Independently assigned our 53 risk factorsinto a set of common groups. Thereafter, all four authors worked together to reconcile differ-ences in these groupings.
2. As will be discussed later, the HKG panel was an exception in this regard.
REFERENCES
1. Alter. S. Implementation risk analysis. TIMS Studies in Management Sciences, 13. 2(April 1979), 1(^-119.
2. Alter, S., and Ginzberg, M. Managing uncertainty in MIS implementation. Sloan Man-ugemem Review, 20. 1 (Fall 1978). 23-31.
3. Barki. H.; Rivard. S.; andTalbot. J. Toward an assessmentof software development risk.Joumal of Managemenl hifonnuiion Systems, 10, 2 (Fall 1993), 203-225.
5. Boehm, B. Software risk management: principles and practices. IEEE Software. 8, I(January 1991), 32-41.
IDENTIFYING SOFTWARE PROJECT RISKS 31
6. Boehm, B., and Ross. R. Theory W software project management: principles and ex-amples. IEEE Transactions on Software Engineering, 15. 7 (July 1989), 902-916.
7.Charette, K. Software Engineering Risk Anahsis and Management. New York: McGraw-Hill. 1989.
8. Chengalur-Smith. L., and Duchessi, P. Client-server implementaiion: some managementpointers. IEEE Transaclion.i on Engineering Management, 47. 1 {February 2000). 127-145.
9. Davis, G. Strategies for information requirements detemiination. IBM Systems Joumal,21, 1 (March 1982), 4-30.
10. Drummond, H. Tlie politics of risk: trials and iribulatiuns of Ihe Taurus project. Joumalof Information Tedinology. J J. 4 {December 1996), 347-357.
12. Ginzberg, MJ. A detailed look at implementation research. Working paper #753/4, MITSloan School of Management, 1974.
13. Griffiths, C , and Newman, M. {eds). Joumal of Infonnation Technology, special issueon software risk management. / / , 4 {December 1996).
14. Heemstra. R. and Kusters, R. Dealing with risk: a practical approach. Journal of Infor-mation Teciinology, 11. 4 (December 1996). 333-346.
15. Hofstede, G. Culture's Consequences: International Differences in Work-Related Val-ues. Beverly Hills: Sage. 1980.
16. Hofstede, G. Cultures and Organizations: Software of die Mind. London: McGraw-Hill.1991.
17. Humphrey, W.S. Managing the Software Pnness. Reading. MA: Addison-Wesley. 1989.18. Johnson. J. Chaos: ihe dollar drain of IT project failures. Application Development Trends.
2. I (January 1995), 41^7 .19. Karolak, D.W. Software Engineering Risk Management. Los Alamitos. CA: IEEE Com-
puter Society Press, 1996.20. Keen. P.G.W. Every Manager's Guide to Infonnation Technology. Cambridge, MA:
Harvard Business School Press. 1991.21. Keen. P.G.W.. and Scott-Morton. M.S. Decision Support Systems: An Organizational
Perspective. Reading, MA: Addison-Westey, 1978.22. Keil. M. Pulling the plug: software project management and the problem of project
escalation. MIS Quarterly. 19. 4 {December 1995). 421-447.23. Keil, M.: Cule, P.; Lyytinen, K.; and Schmidt, R. A framework for identifying software
project risks. Communications of die ACM. 41, 11 (November 1998). 76-83.24. Kvvon. T.H.. and Zmud, R.W. Unifying the fragmented mcxJels of information systems
implementation. In R.J. Boland and R.A. Hirschheim (eds.). Critical Issues in InformationSystems Research. Chichester. UK: John Wiley & Sons, 1987. pp. 227-251.
25. Lucas, H.C. Implementation: The Key to Successful Information Systems. New York:Columbia University Press, 1981.
26. Lyytinen. K.L., and Hirschheim, R. Infonnation systems failures—a survey and classifi-cation of the empirical literature. In P.I. Ztirkoczy {ed.), Oxford Sur\'evs in Information Tech-nology. Vol. 4. Oxford: Oxford University Press. 1987. pp. 257-309, '
27. Lyytinen. K.L.: Mathiassen. L.; and Ropponen, J. Attention shaping and software risk: acategorical analysis of four classical risk management approaches. Infomiation Systems Re-searrh. 9. 3 (September 1998). 233-255.
28. March, J., and Shapira, Z. Managerial perspectives on risk and risk taking. ManagementScience, 33. U (November 1987), 1404-1418.
29. McFarlan, F.W. Portfolio approach to information systems. Harvard Business Review.59. 5 (September/October 1981), 142-150.
30. Moynihan, T. How experienced project managers assess risk. IEEE Software, 14, 3 {May/June 1997). 3 5 ^ 1 .
31. Nidumolu, S. The effect of coordination and uncertainty on software project perfor-mance: residual performance risk as an intervening variable. Information Systems Research, 6,3 (September 1995). 191-219.
32. Offenbeek. M.. and Koopman. P. Scenarios for system development: matching contextand strategy. Behaviour & Information Technology. 15, 4 (1996), 250-265.
32 SCHMIDT. LYYTINEN. KEIL, AND CULE
33. Oz, E. Management Information Systems. Cambridge. MA: Course Technology, 1998,pp. 277-279.
34. Ropponen,}. Software Risk Managernenl—Foundations, Principles, and Empirical Find-ings. Jyvaskyla: Jyvaskylii University Printing House, 1999.
35. Sauer. C. Understanding support - lessons from a case siudy. Australian Journal of Infor-mation Systems. I, I {September 1993), 63-74.
36. Schmidt, R. Managing Delphi surveys using nonparametrie statistical techniques. Deci-sion Sciences. 28. 3 (Summer 1997), 763-774.
37. Schultz, R.L., and Slevin, D.P. Introduction: the itnplementation problem. In R. Doktor.R.L. Schultz. and R.P. Slevin (eds.), Tbe Implementation of Management Science, Volume 13.Amsterdam: North-Holland, 1979, pp. I-I5.
38. Seigel, S.. and Castellan, N. Nonparametrie Statistics for the Behavioral Sciences. NewYork: McGraw-Hill. 1988.
39. van Genuchten. M. Why is software late? An empirical study of the reason for delay insoftware development. IEEE Transactions on Software Engineering. 17. 6 (June 1991), 582-590.
40. Walkerden, F., and Jeffery. R. Software cost estimation: a review of models, processes,and practice. Advances in Computers. Vol. 44. San Diego: Academic Press, 1997, pp. 62-94.
41. Zmud. R.W. Individual differences and MIS success: areview of the empirical literature.Management Science, 25. 10 {October 1979). 966-979.
Appendix 1. Risk Item Ranking by Country and by Round
Table Al.l . Ranking Results, Round-by-Round; Hong Kong Panel (9 Panelists.15 Items)
Mean Ranks
Risk Factor Round 1
3.895.446.227.336.78
8.006.787.568.67
10.009.229.339.78
Round 2
1.564.444.565.225.00
7.447.338.118.899.56
11.6710.4411.44
Round 3
1.334.115.566.006.33
6.337.008.118.89
10.679.89
10.8911.00
1. Lack of top management commitment2. Lack of adequate user involvement3. Failure to gain user commitment4. Lack of cooperation from users5. Change in ovi'nership or senior
management6. Changing scope/objectives7. Misunderstanding the requirements8. Lack of frozen requirements9. Failure to manage end user expectations
10. Conflict between user departments11. Staffing volatility12. Introduction of new technology13. Lack of required knowledge/skills in
project personnel14. Lack of effective development
process/methodology15. insufficient/inappropriate staffingKendall's W
9.89
10.440.192
11.56
12.330.539
11.78
13.330.511
IDENTIFYING SOFTWARE PROJECT RISKS 33
Table A 1.2. Ranking Results, Round-by-Round:Items)
Finnish Panel (13 Panelists, 23
Risk Factor
1.
2.
3,
4.5.
6.
7.8.
9.10.
11.
12.
13.14.
15.
16.
17.18.19.20.
21.22.
23.
Lack of effective projectmanagement skillsLack of top managementcommitmentLack of required skilis inproject personnelNot managing change properlyNo planning or inadequateplanningMisunderstanding therequirementsArtificial deadlinesFailure to gain usercommitmentLack of frozen requirementsLack of "people skills" Inproject leadershipLack of adequate userinvolvementMulti-vendor projectscomplicate dependenciesIntroduction of new technologyTrying new developmentmethod/technologyInsufficient/inappropriatestaffingNew and/or unfamiliarsubject matterStaffing volatilityBad estimationChanging scope/objectivesImproper definition of rolesand responsibilitiesPoor or nonexistent controlConflict between userdepartmentsFailure to manage enduser expectations
Kendall's W
Round 1
6.00
7.46
11.23
10.3112.92
10.92
9.8511.54
8.4610.62
11.00
10.54
10.8512.15
13.00
15.38
13.9213.0813.9215.23
16.3113.85
17.23
0.178
Mean
Round 2
2.92
5.54
8.15
6,3811.15
10.38
8.6911.15
8.6211.15
11.62
10.15
11.4612.46
12.77
16.23
14.9213.4616.3817.46
17.4616.08
20.38
0.392
Ranks
Round 3
3.00
5.23
5.62
5.659.85
10.00
9.928.85
8.1510.92
12.77
10.62
11.9211.46
14.38
17.38
17.2315.6915.5415.62
18.3117.23
19.54
0.467
Round 4
2.46
4.46
5.53
5.858.38
8.62
9.009.23
9.3811.15
11.92
12.00
12.6212.85
14.46
16.15
16.2316.3816.5417.31
17,5418.15
19,69
0.508
34 SCHMIDT. LYYTINEN. KEIL. AND CULE
Table A1.3. Ranking Results. Round-by-Round: USA Panel (19 Panehsts, 17Items)
Risk Factor
1. Lack of top management commitment2. Misunderstanding the requirements3. Not managing change properly4. Failure to gain user commitment5. Lack of effective project management skills6. Lack of adequate user involvement7. Failure to manage end user expectations8. Lack of effective project management9. Unclear/misunderstood scope/objectives
10. Changing scope/objectives11. Lack of required knowledge/skills12. tntroduction of new technology13. Insufficient/inappropriate staffing14. Lack of frozen requirements15. Improper roles and responsibilities16. Conflict between user departments17. Number of organizational units involvedKendall's W
Round 1
2.795.586.847.376.847.538.007.379.008.539.74
10.5311.4211.9511.7913.2114.790.355
Mean Ranks
Round 2
1.743.634.586.425.796.688.167.479.849.58
10.2111.0512.0012.6312,2614.3716.110.601
Round 3
1,372.634.585.585.637.167.218.118.168.95
11.1112.0512.3213.5313.6315.3715.580,735
Appendix 2. Grouping of Risk Items
One result of the study was to develop a set of risk factor groups. This set could beused in the future in theory development and for more detailed prescriptions for riskmanagement. Barki et al. [3| used factor analysis to establish Five risk groups basedon a set of 23 of the risk factors derived from the literature. In their interpretation theyattribute each of the Five groups to a particular source of risk. Analysis of our riskfactor list (Table 3) shows that it covers all Five of these risk groups. The Barki et al.groups of "technological newness" and "organizational environment" have directanalogs in our groups of "technology" and "corporate environment," respectively.Their "application size" group is covered by our "scope" group. Factors relating toBarki et al.'s "expertise" are broken down into project personnel expertise ("person-nel" and "staffing"), and project management expertise ("project management"). Fi-nally, we treat the issue of "application complexity" as described by Barki et al. underour groups of "scope" and "requirements." Six of our groups are unique in that theyare not in the Barki et al. list. Two of them (i.e., project scheduling, and externaldependencies) are covered in Boehm's top ten risk factors list. The others, focusingon relationship management (sponsorship/ownership, funding), and process planningand control (development process/planning) have been understudied by informationsystems re.searchers.
IDENTIFYING SOFTWARE PROJECT RISKS 35
Table A2.1. Risk Groups by Source of Risk
Risk Group Source of Risk, Nature of Risk
1. Corporate Environment
2. Sponsorship/Ownership
3. Relationship Management
4. Project Management
5. Scope
6. Requirements
7. Funding
8. Scheduling
9. Development Process
10. Personnel
11. Staffing
12. Technology
13. External Dependencies
14. Planning
Environment: Changes in the business or politicalenvironment or poor alignment of the system with theorganizational culture.
Mandate: Lack of mandate for the PM to execute theproject plan. Lack of trust or poor relationships withthe owners of the system.
User Relationships: Lack of trust and inadequate userinvolvement. Unclear roles and expectations amongusers or other stakeholders.
Management: Poor or inefficient managementstrategy and execution.
System Scope: Unclear, changing, or partial under-standing of the system scope and mission.
Requirements: Inadequate or poor management ofsystem requirements; poor validation of systemrequirements.
Resource management: Too little or badly estimatedresources for SD.
Resource control: Poor management of resourceconsumption and needs. Poor timing.
Process: Inappropriate or lacking process approach.
Skills: Inadequate personnel skills in development andprocess management.
Staffing: Changes in personnel or staffing levels,unavailability of key personnel resources.
Technology: Inadequate understanding of the chosentechnology.
Development environment: Poor management orcontrol over dependencies with external agents.
Planning: No interest or inadequate skills to plan theproject.
36 SCHMIDT. LYYTINEN, KEIL. AND CULE
Appendix 3. Comparison with Prior Lists
Table A3.1
Factors from prior literature(Items 1-10 are Boehm's "Top Ten" 14])
Factors fromthis study'
Composite Rankin this study**
1. Personnel shortfalls [4]2. Unrealistic schedules and budgets [4, 30]3. Developing the wrong functions and
properties [4, 30]4. Developing the wrong user interface [4]5. Gold-plating [4]6. Continuing stream of requirements
changes [4]7. Shortfalls in externally furnished
components [3. 4]8. Shortfalls in externally performed tasks [3, 4]9. Real-time performance shortfalls [4]
10. Straining computer-science capabilities [4]11. Size [3, 30]12. Multiple implementers [3. 30]13. Staffing level/team size 13]14. New technology/experience with
technology [3. 30]15. Application novelty (ease of solution) [3, 30]16. Lack or loss of resources [3]17. Unclear task/specifications [3, 30]18. Team turnover [3]19. Team members have not worked together
before 13]20. Team experience/knowledge [3. 30]21. Number of users [3, 30]22. User turnover [3]23. Number of user departments [3, 30]24. Type of users [3]25. Unwilling users [3. 30]26. Resistance to change 13]27. Users' feeling of responsibility 13]28. Conflicting preferences 13]29. Interpersonal conflicts (3]30. Lack of top management support 13. 30]31. Source of control over project [30]32. Stability of client's business environment [30]33. Developer's knowledge of the business [30]