Identifying Sources of Organic Matter to Benthic Organisms in the Beaufort and Chukchi Outer Continental Shelves Principal Investigator: Matthew J. Wooller 1 Co-PI: Katrin Iken 1 , Diane O’Brien 2 1 College of Fisheries and Ocean Sciences, University of Alaska Fairbanks 2 Institute of Arctic Biology, University of Alaska Fairbanks Final Report OCS Study BOEM 2019-030 May 2019
Transcript
Identifying Sources of Organic Matter
to Benthic Organisms in the Beaufort and Chukchi
Outer Continental Shelves
Principal Investigator: Matthew J. Wooller1
Co-PI: Katrin Iken1, Diane O’Brien2
1College of Fisheries and Ocean Sciences, University of Alaska Fairbanks
2Institute of Arctic Biology, University of Alaska Fairbanks
Final Report OCS Study BOEM 2019-030
May 2019
Contact Information:
Coastal Marine Institute College of Fisheries and Ocean Sciences University of Alaska Fairbanks P. O. Box 757220 Fairbanks, AK 99775-7220 [email protected] Phone: 907.474.6782
This study was funded by the U.S. Department of the Interior, Bureau of Ocean Energy Management (BOEM) Alaska OCS Region (Cooperative Agreement M16AC00005) and the University of Alaska Fairbanks. This report, OCS Study BOEM 2019-030, is available through the Coastal Marine Institute and select federal depository libraries. Electronic access is available at http://www.boem.gov/Alaska-Scientific-Publications.
The views and conclusions contained in this document are those of the authors and should not be interpreted as representing the opinions or policies of the U.S. Government. Mention of trade names or commercial products does not constitute their endorsement by the U.S. Government.
Table of Contents List of Figures ................................................................................................................................ iii
List Tables ...................................................................................................................................... iv
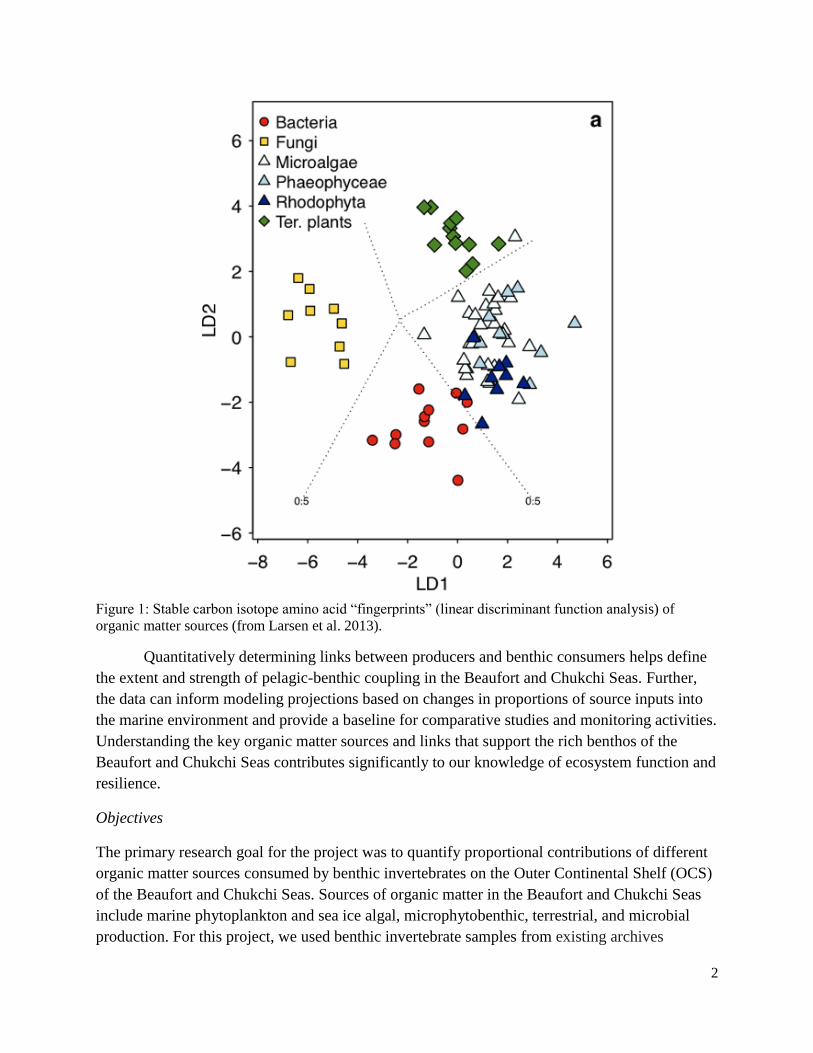
List of Figures Figure 1: Stable carbon isotope amino acid “fingerprints” (linear discriminant function analysis) of organic matter sources (from Larsen et al. 2013) ........................................................................2
Figure 2: Locations of the Beaufort and Chukchi Seas and their major oceanographic influences (courtesy of Seth Danielson) ............................................................................................................4
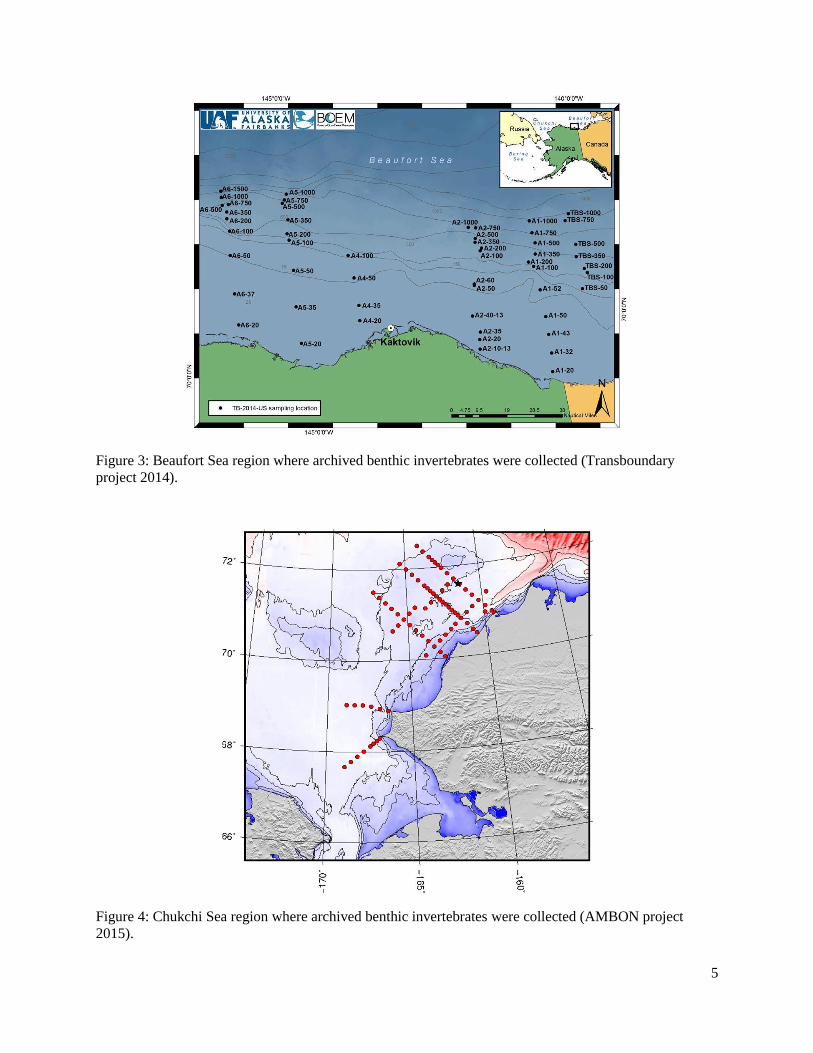
Figure 3: Beaufort Sea region where archived benthic invertebrates were collected (Transboundary project 2014) ..........................................................................................................5
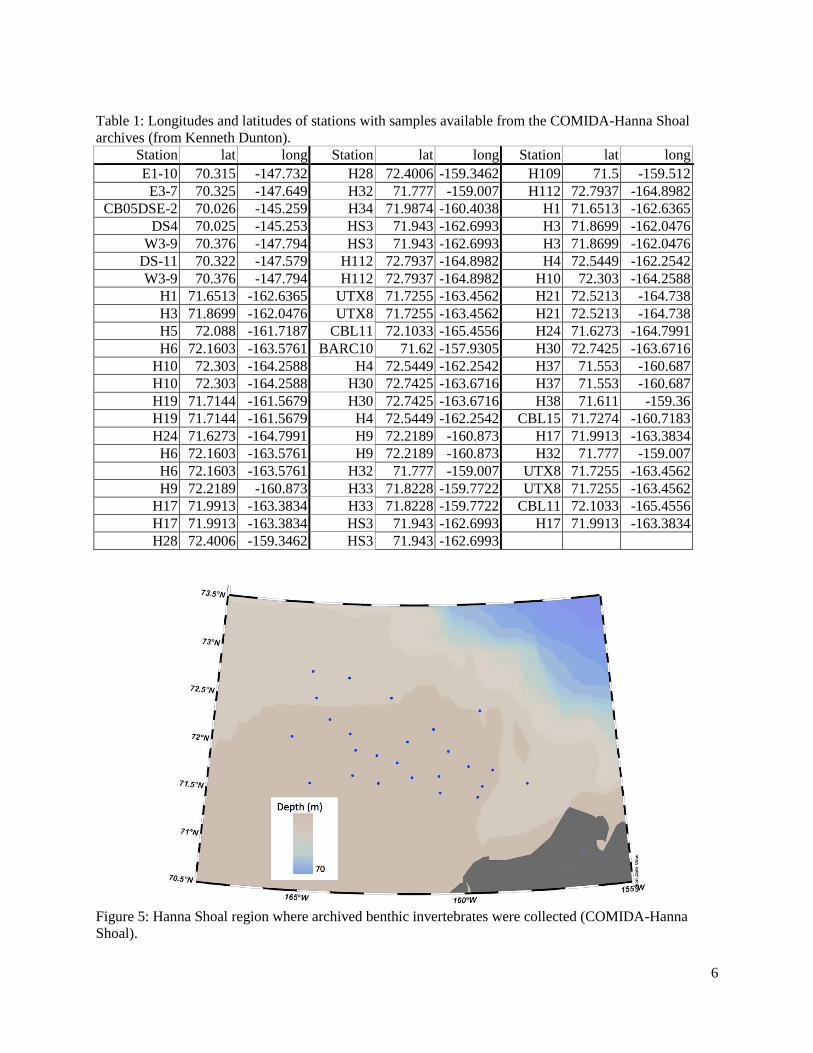
Figure 4: Chukchi Sea region where archived benthic invertebrates were collected (AMBON project 2015) ....................................................................................................................................5
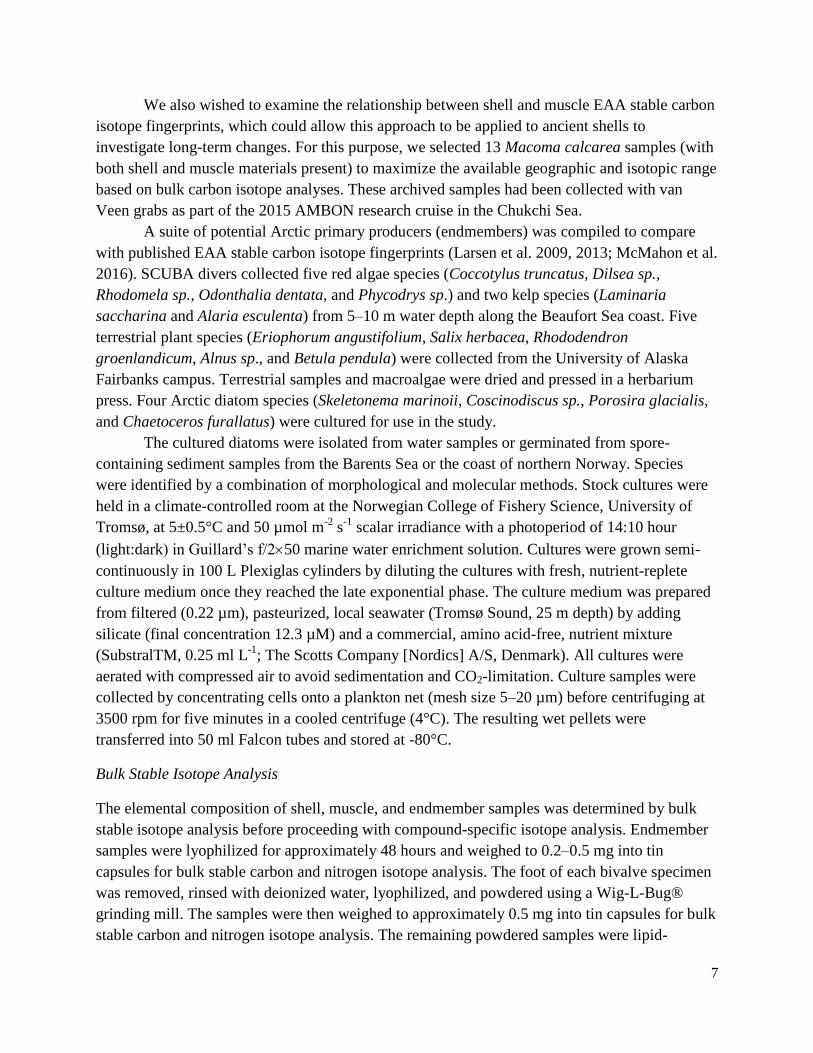
Figure 5: Hanna Shoal region where archived benthic invertebrates were collected (COMIDA-Hanna Shoal) ....................................................................................................................................6
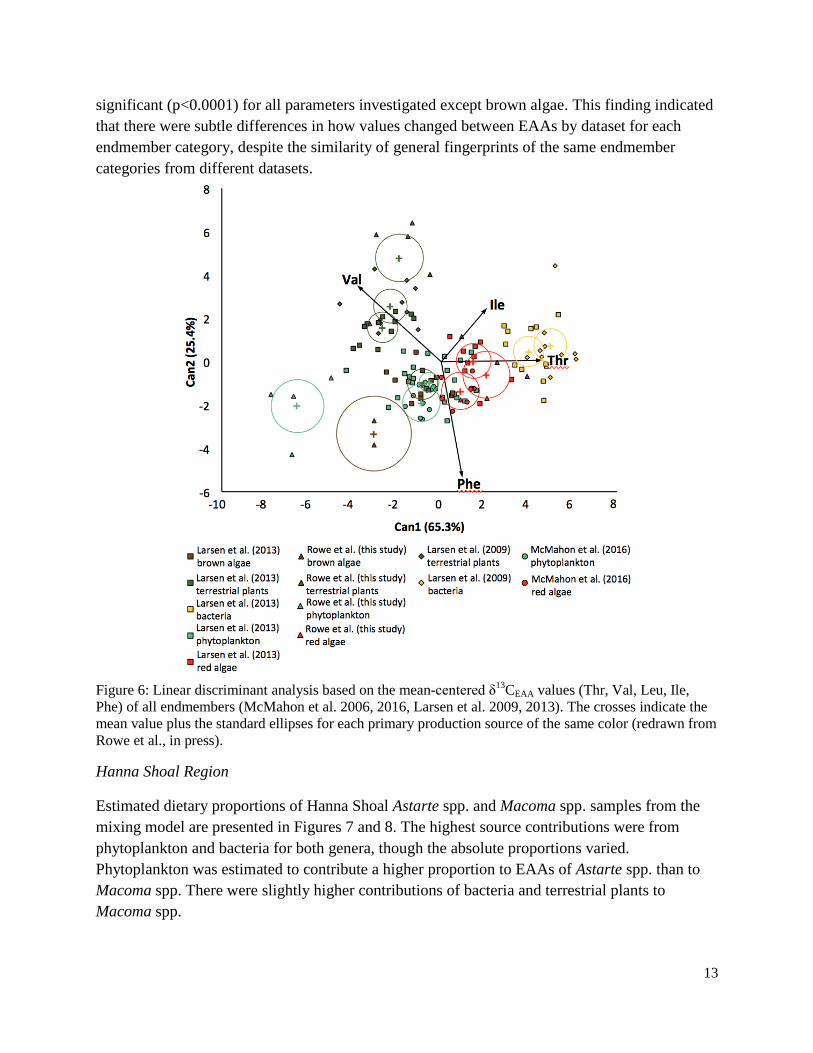
Figure 6: Linear discriminant analysis based on the mean-centered δ13CEAA values (Thr, Val, Leu, Ile, Phe) of all endmembers ...................................................................................................13
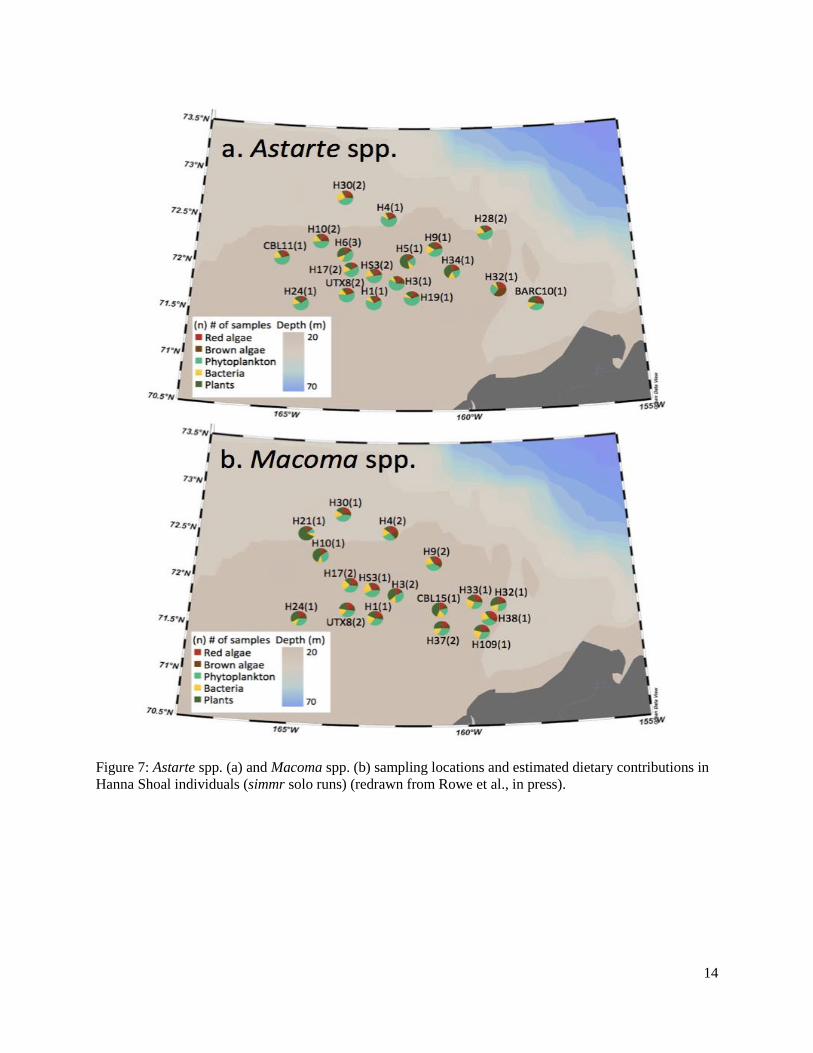
Figure 7: Astarte spp. and Macoma spp. sampling locations and estimated dietary contributions in Hanna Shoal individuals (simmr solo runs) ...............................................................................14
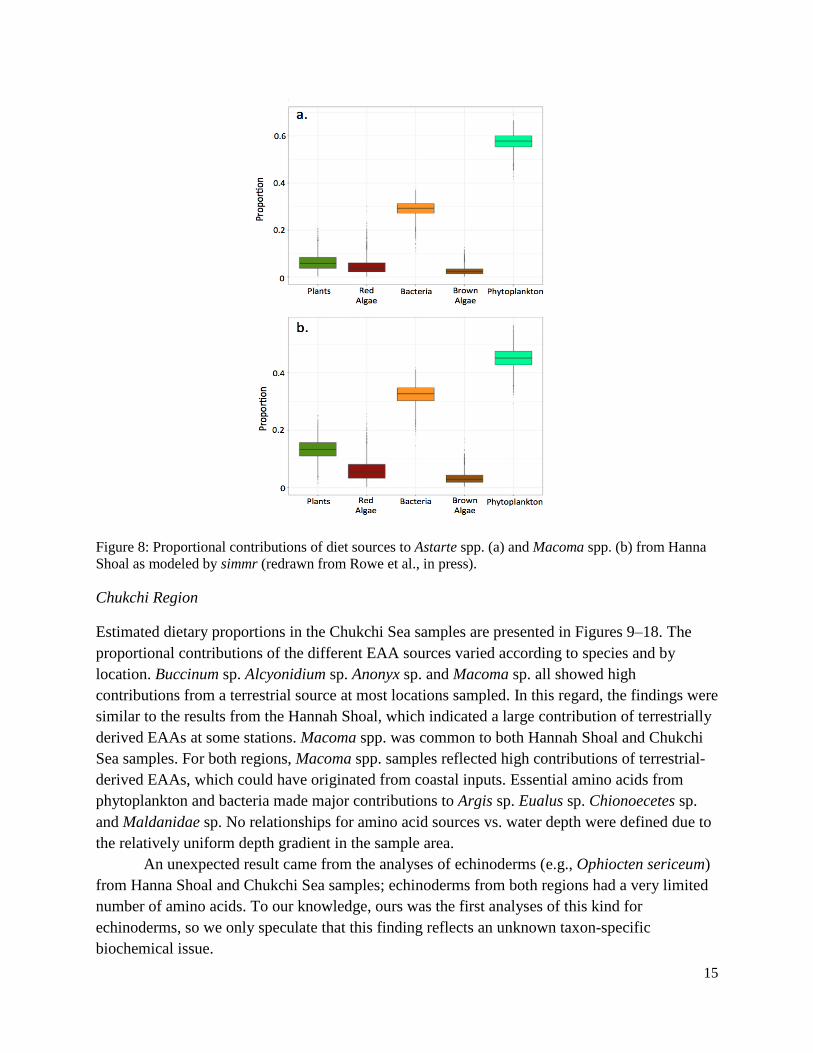
Figure 8: Proportional contributions of diet sources to Astarte spp. and Macoma spp. from Hanna Shoal as modeled by simmr ...........................................................................................................15
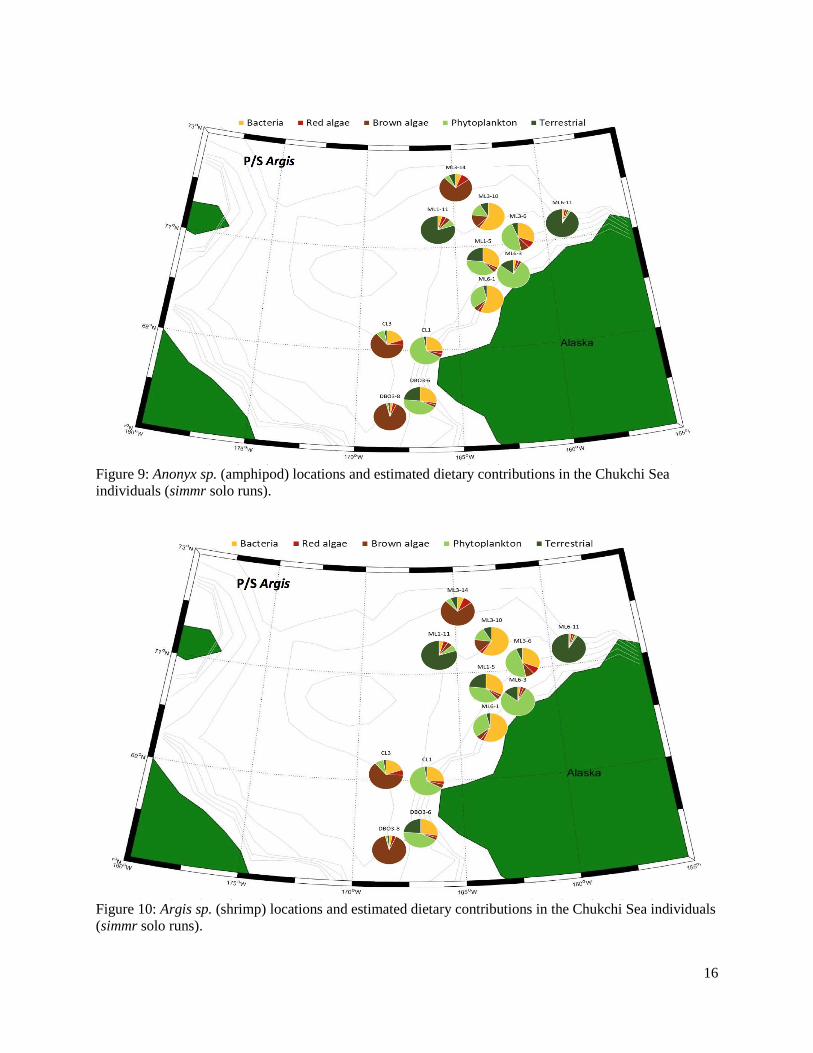
Figure 9: Anonyx sp. (amphipod) locations and estimated dietary contributions in the Chukchi individuals (simmr solo runs).........................................................................................................16
Figure 10: Argis sp. (shrimp) locations and estimated dietary contributions in the Chukchi individuals (simmr solo runs).........................................................................................................16
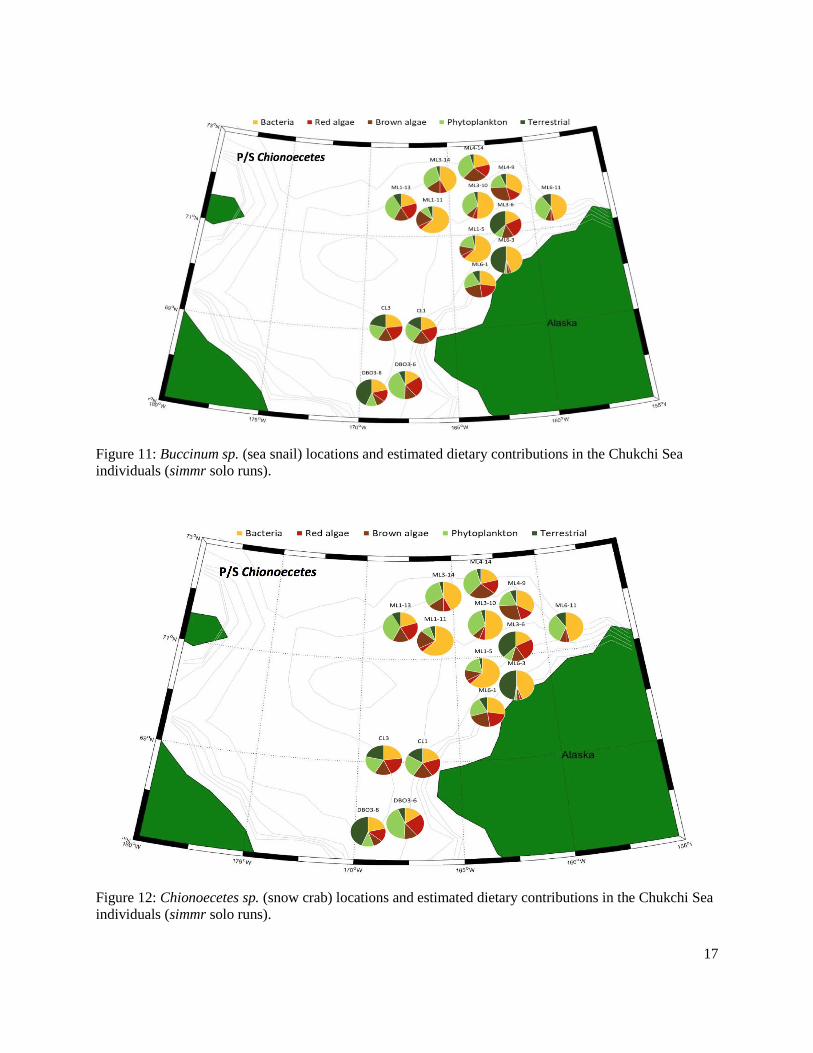
Figure 11: Buccinum sp. (sea snail) locations and estimated dietary contributions in the Chukchi individuals (simmr solo runs).........................................................................................................17
Figure 12: Chionoecetes sp. (snow crab) locations and estimated dietary contributions in the Chukchi individuals (simmr solo runs) ..........................................................................................17
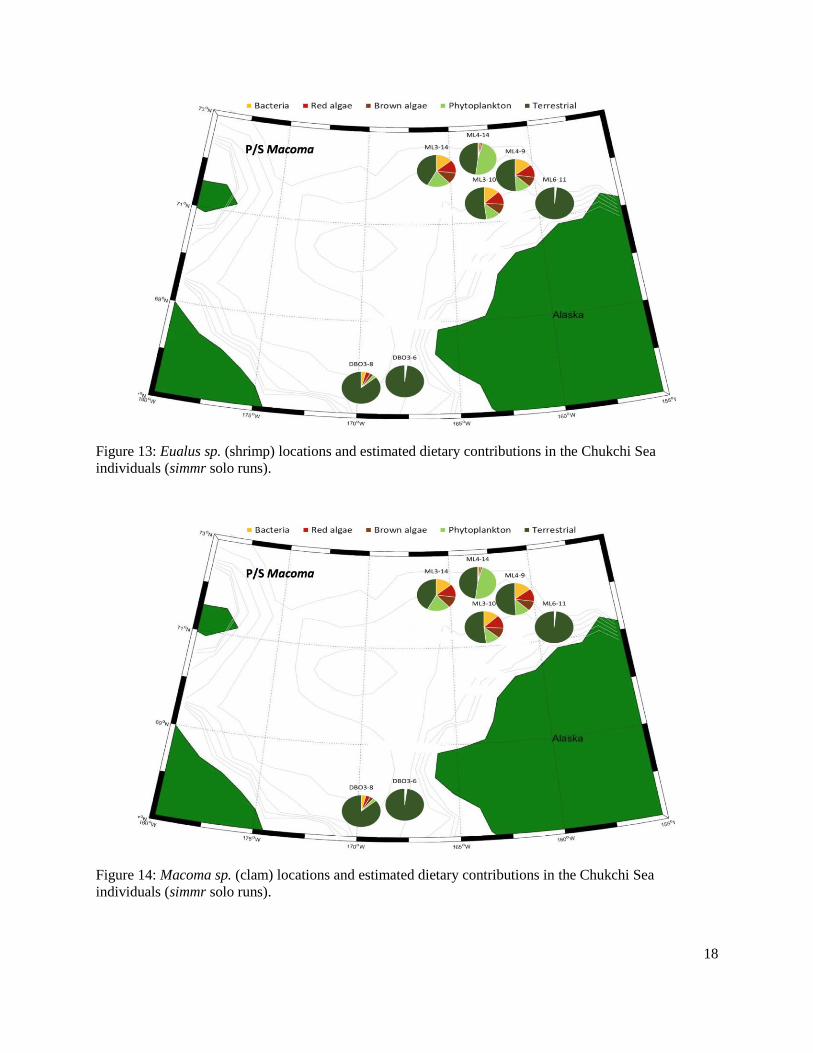
Figure 13: Eualus sp. (shrimp) locations and estimated dietary contributions in the Chukchi individuals (simmr solo runs).........................................................................................................18
Figure 14: Macoma sp. (clam) locations and estimated dietary contributions in the Chukchi individuals (simmr solo runs).........................................................................................................18
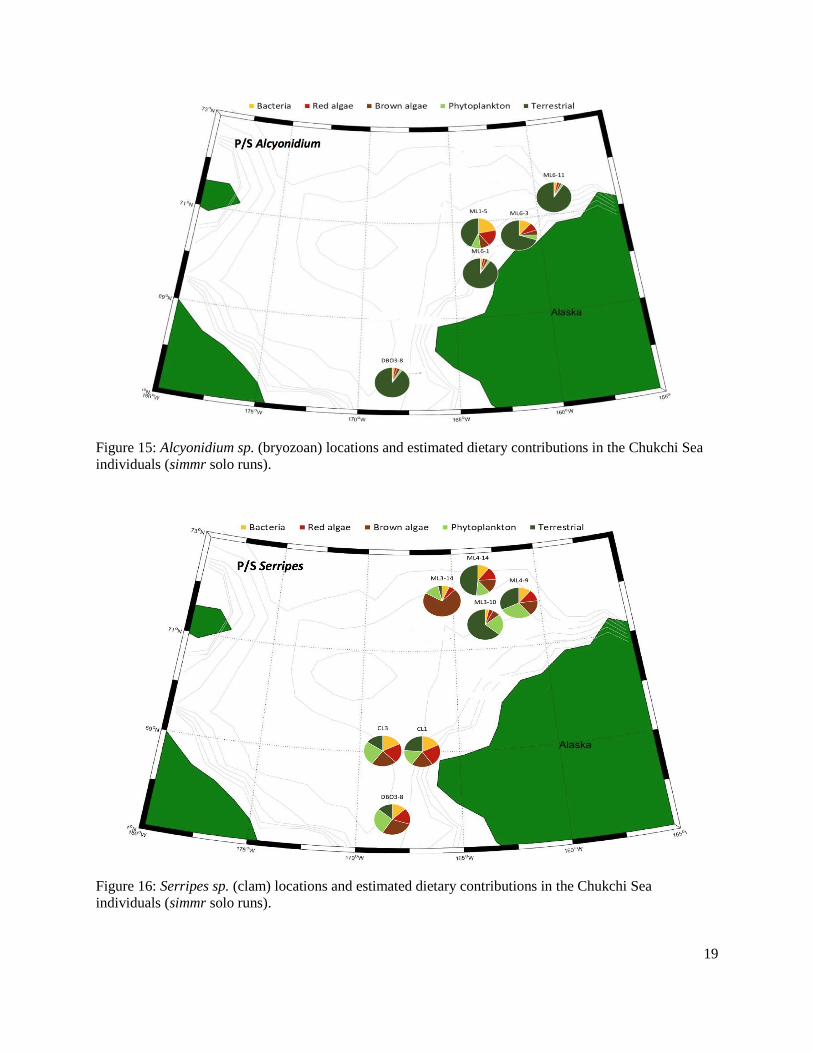
Figure 15: Alcyonidium sp. (bryozoan) locations and estimated dietary contributions in the Chukchi individuals (simmr solo runs). .........................................................................................19
Figure 16: Serripes sp. (clam) locations and estimated dietary contributions in the Chukchi individuals (simmr solo runs).........................................................................................................19
Figure 17: Nuculana sp. (clam) locations and estimated dietary contributions in the Chukchi individuals (simmr solo runs).........................................................................................................20
Figure 18: Maldanidae sp. (worms) locations and estimated dietary contributions in the Chukchi individuals (simmr solo runs).........................................................................................................20
iv
Figure 19: Eualus sp. (shrimp) locations and estimated dietary contributions in the Beaufort Sea individuals (simmr solo runs).........................................................................................................21
Figure 20: Astarte spp. (clam) locations and estimated dietary contributions in the Beaufort Sea individuals (simmr solo runs).........................................................................................................22
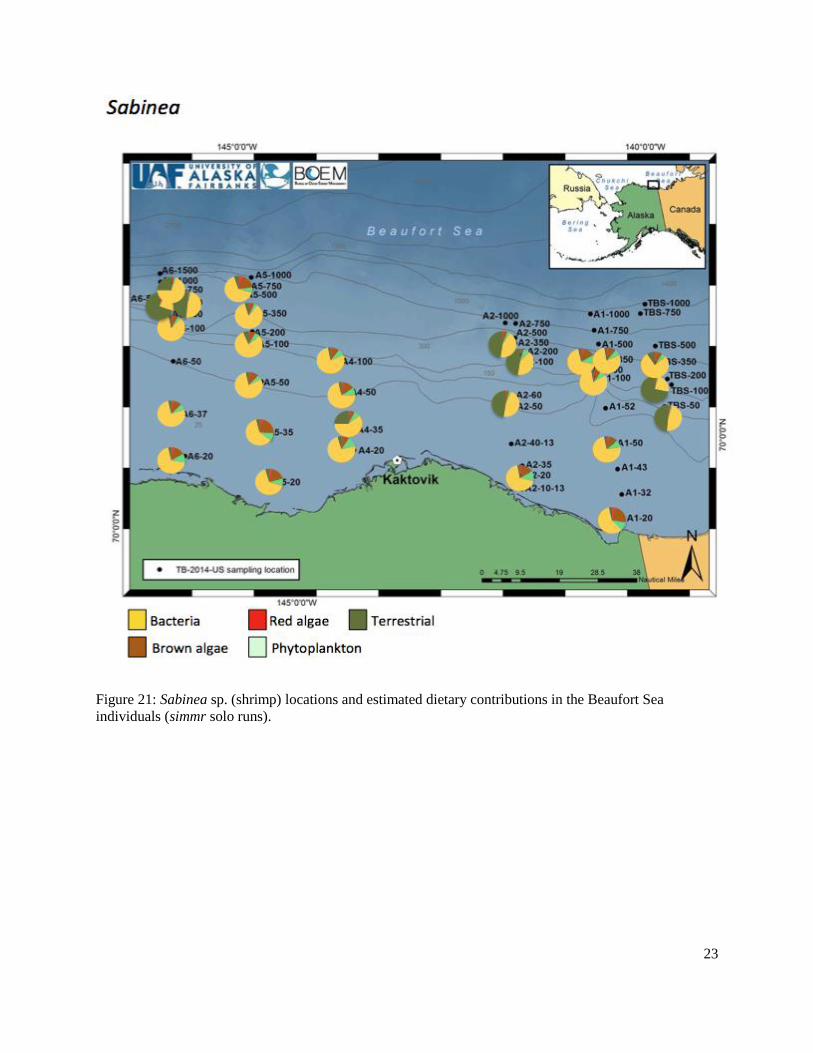
Figure 21: Sabinea sp. (shrimp) locations and estimated dietary contributions in the Beaufort Sea individuals (simmr solo runs).........................................................................................................23
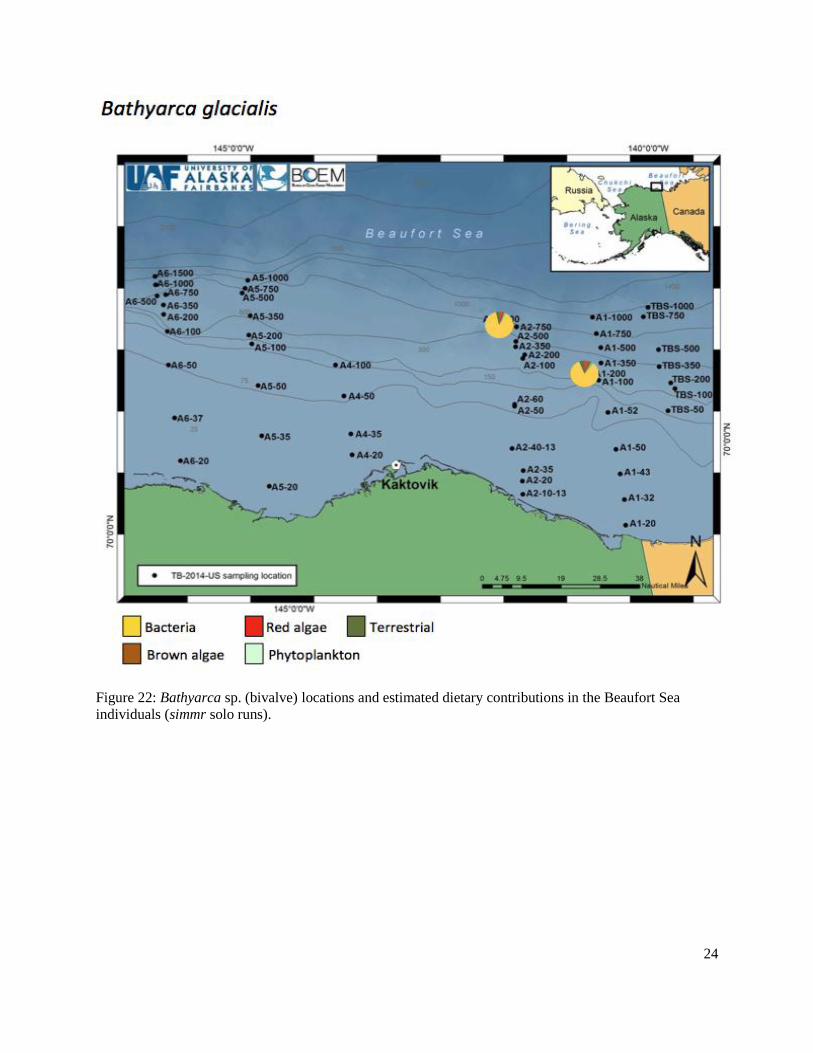
Figure 22: Bathyarca sp. (bivalve) locations and estimated dietary contributions in the Beaufort Sea individuals (simmr solo runs) ..................................................................................................24
Figure 23: Leucine to isoleucine indexes of inverts from the Beaufort Sea vs. station depth .......25
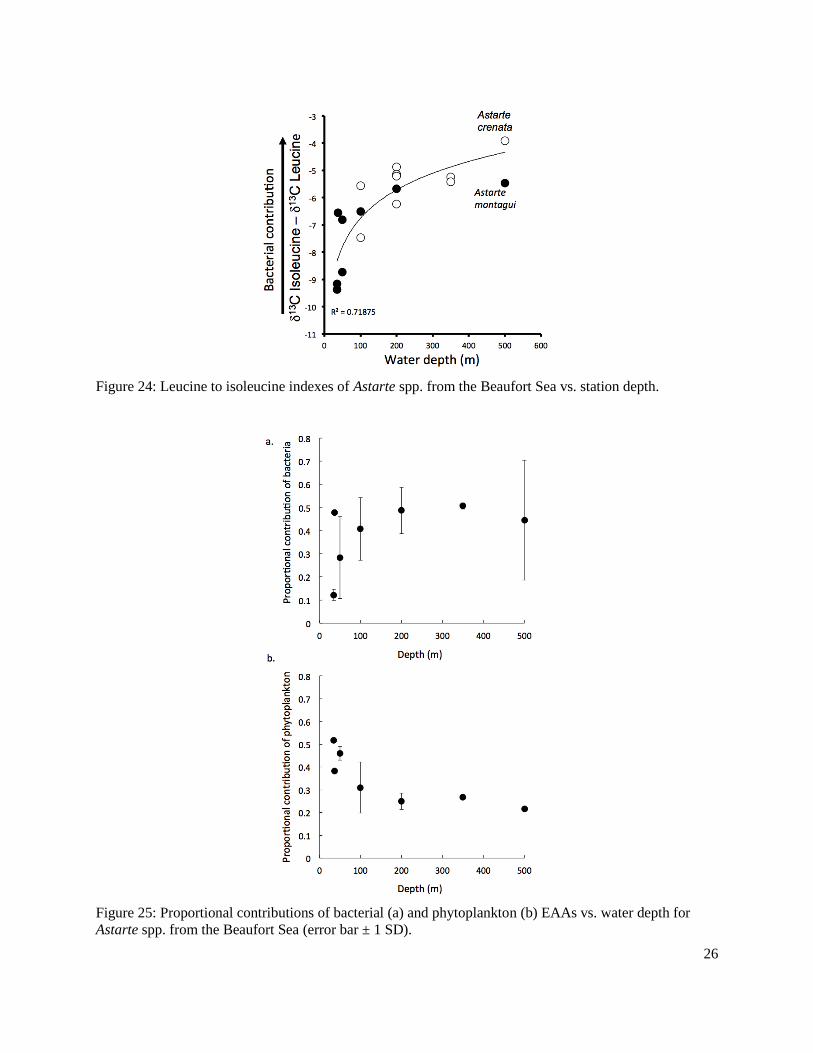
Figure 24: Leucine to isoleucine indexes of Astarte spp. from the Beaufort Sea vs. station depth ...............................................................................................................................................26
Figure 25: Proportional contributions of bacterial and phytoplankton EAAs vs. water depth for Astarte spp. from the Beaufort Sea ................................................................................................26
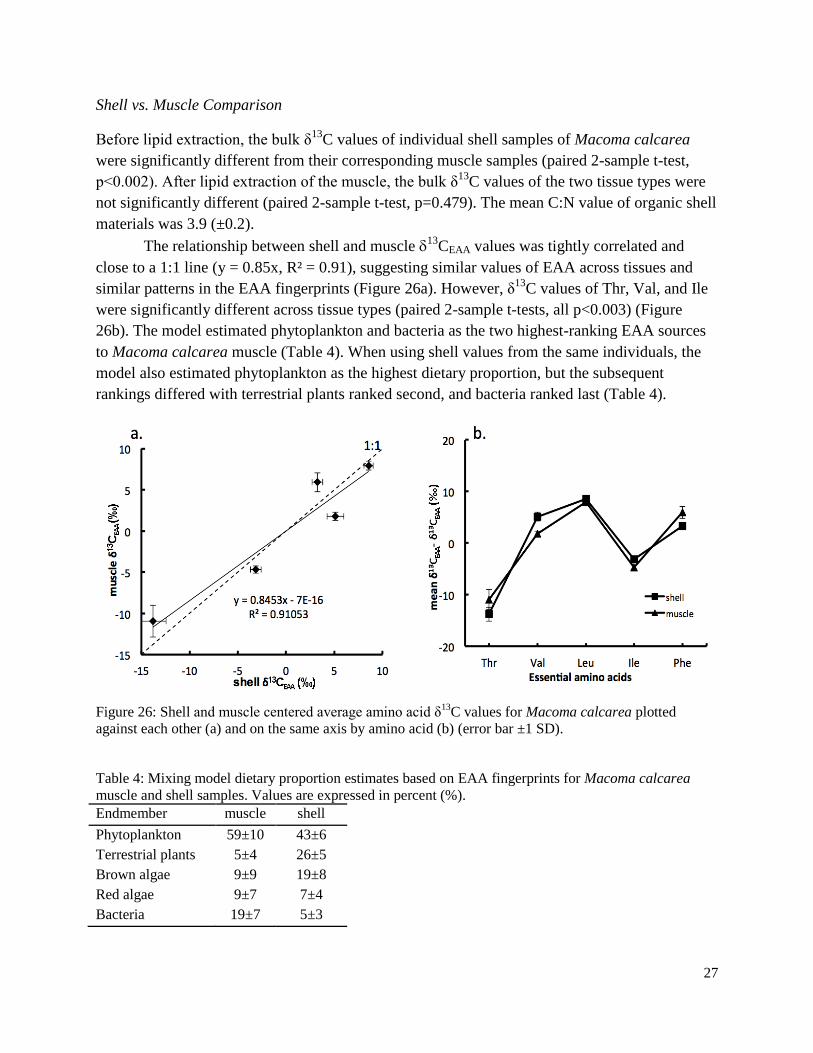
Figure 26: Shell and muscle centered average amino acid δ13C values for Macoma calcarea plotted against each other and on the same axis by amino acid .....................................................27
Figure 27: Proportional contributions of diet sources to Macoma calcarea muscle and shell as modeled by simmr ..........................................................................................................................28
List of Tables Table 1: Longitudes and latitudes of stations with samples available from the COMIDA-Hanna Shoal archives (from Kenneth Dunton) ...........................................................................................6
Table 2: Datasets used for mixing model endmember inputs ........................................................12
Table 3: Mixing model results (dietary proportions) based on EAA fingerprints for endmember-source dataset sensitivity tests .......................................................................................................12
Table 4: Mixing model dietary proportion estimates based on EAA fingerprints for Macoma calcarea muscle and shell samples ................................................................................................27
v
Abstract
Benthic invertebrate communities are an essential ecosystem component in Arctic food webs in terms of energy transfer to higher trophic levels and mineralization. Currently, the proportional contributions of different sources of organic matter (marine, terrestrial, or microbial production) that sustain benthic organisms in the Arctic are unclear. This project provided a better understanding of the organic matter sources consumed by benthic organisms using a state-of-the-art essential amino acid (EAA) “fingerprinting” approach. Unlike non-essential amino acids, the term “essential” means that they only originate from the organisms that synthesized them (e.g., photosynthetic or microbial organisms) and cannot be synthesized by consumers. The EAAs have specific stable carbon isotope fingerprints, depending on the producer type, and they differ between marine, terrestrial, and microbial producers. The EAA fingerprints are incorporated into and conserved within consumers, creating a pattern or “stable isotope fingerprint,” which can be statistically compared with the EAA fingerprints of the primary producers. “Fingerprints” allow the separation of microbial and terrestrial carbon sources from marine production, filling a gap identified in previous benthic food web work involving systems in the Arctic. This is a particularly powerful tool to quantify the proportional contribution by microbial, terrestrial plant, and marine primary producers to consumers.
We found that EAA fingerprints in the soft tissues of clams from the Arctic marine environment were reflected in the signatures preserved in the shells of these organisms. This important methodological finding will allow future application of the approach to analyses of archeological and geological clam samples. We compared results from our analyses of primary producers (endmembers in terrestrial plants and phytoplankton) with literature values and found that most endmembers of the same category had very similar EAA fingerprints. This suggests that EAA isotope fingerprints of primary producers are taxon-specific and driven by broad and deep phylogenetic differences in EAA synthesis rather than environmental and geographic differences.
Archived benthic invertebrates were analyzed from three regions, Hanna Shoal, Chukchi Sea, and the Beaufort Sea. In the Hanna Shoal and Chukchi samples, which came from a relatively uniform water depth, we found that phytoplankton and terrestrial derived EAAs made the greatest proportional contributions to benthic invertebrates. This finding supports observations of highly productive phytoplankton blooms in the region. The Hanna Shoal bivalve model estimated that bacteria made up the next highest proportion of bivalve EAAs, which may reflect the reworking and ecological availability of more refractory organic matter. There appeared to be some differences between the two bivalve species analyzed from the Hanna Shoal. Phytoplankton was estimated to contribute a higher proportion of EAAs, and terrestrial organic matter and bacteria less, to Astarte spp. than found with Macoma spp. These differences are likely due to their different feeding modes.
In contrast to the Chukchi region and Hanna Shoal, the results from the Beaufort region indicated a greater contribution of EAAs from sources other than phytoplankton and terrestrial organic matter. Most notably, there appeared to be a greater contribution of bacterial and
vi
macroalgal sources of EAAs in the invertebrates. Additionally, water depth influenced the source of the proportional contributions, with more bacterial-derived EAAs at greater depth. A future direction would be to apply compound-specific amino acid and fatty acid analyses on the same sample. This would allow the determination of the proportional contribution of marine photosynthetic sources as a whole (vs. terrestrial and bacterial sources), and the determination of proportional contributions of ice algae and phytoplankton based on the fatty acids data.
1
Introduction
Background
Arctic shelf systems are often considered benthic-dominated systems because much of the
primary production from phytoplankton and sea ice (i.e., ice algal production) goes ungrazed by
zooplankton and sinks to the seafloor (Grebmeier et al. 2007b, a). Tight pelagic-benthic coupling
results in rich invertebrate communities dominating the benthic marine ecosystems in the Arctic
(Piepenburg 2005; Dunton et al. 2006). Benthic invertebrates are important in remineralization
processes and as prey for higher trophic levels (Seymour et al. 2014a, b).
The nature of the Arctic benthic communities is likely to be affected by changes in the
climate, environment, and human use of the Arctic system. For example, changes in the organic
matter sources supporting the complex benthic food webs could alter energy flow through the
system (Iken et al. 2005, 2010; McTigue and Dunton 2014, 2017; Divine et al. 2015; Kȩdra et al.
2015). The Chukchi Sea, in particular, experiences dramatic sea-ice dynamics and, possibly,
fluctuations in the overall quantity of marine primary production. Benthic food webs in the
Chukchi Sea are also sensitive to hydrographic conditions (Iken et al. 2010; Feder et al. 2011; Tu
et al. 2015), which increases the probability that climate warming will have an impact. Currently,
the proportional contributions of organic matter sources (phytoplankton, microphytobenthos, ice
algae, terrestrial sources, and microbial production) that sustain these benthic organisms through
food web links are unclear (McTigue and Dunton 2014, 2017 ).
Depending on the specificity of the analysis, fatty acids and their stable isotope
composition can be used to distinguish sources of organic matter (Graham et al. 2014; Wang et
al. 2015; Wang et al. 2016). To date, Arctic food web research has largely employed bulk stable
isotope analysis of the total organic carbon and nitrogen in tissue samples (Bentzen et al. 2007,
2014; Feder et al. 2011; Savory et al. 2014; Seymour et al. 2014a, b). This project used a novel
approach, “stable isotope fingerprinting,” to identify and quantify links between organic matter
sources and benthic organisms in the Arctic marine environment. Stable isotope fingerprinting
provides greater organic matter source specificity and differentiation by examining the isotopic
signatures of individual essential amino acids (EAAs) originating from the food sources
consumed by an organism (Larsen et al. 2009, 2013). Unlike non-essential amino acids, EAAs
cannot be synthesized by consumers; rather, EAAs are synthesized by photosynthetic or
microbial organisms and transferred to consumers. The EAAs have specific stable isotope values
depending on whether the producer is marine photosynthetic (EAAs derived from dissolved
organic carbon), terrestrial photosynthetic (EAAs derived from atmospheric carbon dioxide), or
microbial (Figure 1). Isotope values are conserved within a consumer, so the stable carbon
isotopic values of the eight EAAs (phenylalanine, valine, threonine, tryptophan, methionine,
leucine, isoleucine, and lysine) can be individually measured. The relative isotopic difference
between these values creates a “stable isotope fingerprint,” which can be used to identify the
source and calculate source-specific proportional contributions of EAAs to a consumer organism
(Larsen et al. 2009, 2013).
2
Figure 1: Stable carbon isotope amino acid “fingerprints” (linear discriminant function analysis) of
organic matter sources (from Larsen et al. 2013).
Quantitatively determining links between producers and benthic consumers helps define
the extent and strength of pelagic-benthic coupling in the Beaufort and Chukchi Seas. Further,
the data can inform modeling projections based on changes in proportions of source inputs into
the marine environment and provide a baseline for comparative studies and monitoring activities.
Understanding the key organic matter sources and links that support the rich benthos of the
Beaufort and Chukchi Seas contributes significantly to our knowledge of ecosystem function and
resilience.
Objectives
The primary research goal for the project was to quantify proportional contributions of different
organic matter sources consumed by benthic invertebrates on the Outer Continental Shelf (OCS)
of the Beaufort and Chukchi Seas. Sources of organic matter in the Beaufort and Chukchi Seas
include marine phytoplankton and sea ice algal, microphytobenthic, terrestrial, and microbial
production. For this project, we used benthic invertebrate samples from existing archives
3
containing representatives of all benthic biomass-dominating taxa (crustaceans, mollusks, and
echinoderms) in the region. We analyzed a subset of samples drawn from more than 5,000
specimens collected across the Beaufort and Chukchi shelf systems, which allowed us to cost-
effectively estimate the proportional contribution of organic matter sources to a range of benthic
invertebrates with different feeding modes and lifestyles.
Objective 1: Measure the stable carbon isotope compositions of EAAs from archived
benthic organisms that contribute substantially to benthic biomass and have a variety of
feeding types and mobility in the Beaufort Sea OCS.
Objective 2: Perform EAA fingerprinting of archived benthic samples from the Chukchi
Sea OCS.
Objective 3: Quantify the proportional contribution of marine photosynthetic, terrestrial
photosynthetic, and microbial-derived EAAs in benthic organisms from the Beaufort and
Chukchi Seas.
Hypotheses
There is significant terrestrial matter imported into the Beaufort Sea region through major river
turnover and allocation to reproduction in Lepidoptera. Proc Natl Acad Sci. doi:
10.1073/pnas.072346699
Oxtoby LE, Budge SM, Iken K, et al (2016) Feeding ecologies of key bivalve and polychaete
species in the Bering Sea as elucidated by fatty acid and compound-specific stable
isotope analyses. Mar Ecol Prog Ser. doi: 10.3354/meps11863
Parnell AC, Phillips DL, Bearhop S, et al (2013) Bayesian stable isotope mixing models.
Environmetrics. doi: 10.1002/env.2221
Piepenburg D (2005) Recent research on Arctic benthos: Common notions need to be revised.
Polar Biol. doi: 10.1007/s00300-005-0013-5
Rowe A, Blanchard A, Iken K, O’Brien D, Uradnikova M, Osvik RD, Wooller MJ (in press).
Estimates of primary production sources to Arctic bivalves using amino acid stable
carbon isotope fingerprinting. Stable Isotopes in Environmental and Health Studies.
Savory, GA, Hunter, CM, O’Brien DM (2014) Anthropogenic food use and diet overlap between
red foxes (Vulpes vulpes). Can J Zool. doi: 10.1139/cjz-2013-0283
Schell DM (1983) Carbon-13 and carbon-14 abundances in Alaskan aquatic organisms: Delayed
production from peat in arctic food webs. Science. doi: 10.1126/science.219.4588.106
Seymour J, Horstmann-Dehn L, Wooller MJ (2014a) Proportion of higher-trophic-level prey in
the diet of Pacific walruses (Odobenus rosmarus divergens). Polar Biol. doi:
10.1007/s00300-014-1492-z
Seymour J, Horstmann-Dehn L, Wooller MJ (2014b) Inter-annual variability in the proportional
contribution of higher trophic levels to the diet of Pacific walruses. Polar Biol. doi:
10.1007/s00300-014-1460-7
Tu KL, Blanchard AL, Iken K, Horstmann-Dehn L (2015) Small-scale spatial variability in
benthic food webs in the northeastern Chukchi Sea. Mar Ecol Prog Ser. doi:
10.3354/meps11216
Wang SW, Budge SM, Iken K, et al (2015) Importance of sympagic production to Bering Sea
zooplankton as revealed from fatty acid-carbon stable isotope analyses. Mar Ecol Prog
Ser. doi: 10.3354/meps11076
40
Wang SW, Springer AM, Budge SM, et al (2016) Carbon sources and trophic relationships of ice
seals during recent environmental shifts in the Bering Sea. Ecol Appl. doi:
10.1890/14.2421/suppinfo
Young JK, Black BA, Clarke JT, et al (2017) Abundance, biomass and caloric content of
Chukchi Sea bivalves and association with Pacific walrus (Odobenus rosmarus
divergens) relative density and distribution in the northeastern Chukchi Sea. Deep Res
Part II Top Stud Oceanogr. doi: 10.1016/j.dsr2.2017.04.017
The Department of the Interior Mission
As the Nation’s principal conservation agency, the Department of the Interior has responsibility for most of our nationally owned public lands and natural resources. This includes fostering the sound use of our land and water resources, protecting our fish, wildlife and biological diversity; preserving the environmental and cultural values of our national parks and historical places; and providing for the enjoyment of life through outdoor recreation. The Department assesses our energy and mineral resources and works to ensure that their development is in the best interests of all our people by encouraging stewardship and citizen participation in their care. The Department also has a major responsibility for American Indian reservation communities and for people who live in island communities. The Bureau of Ocean Energy Management
The Bureau of Ocean Energy Management (BOEM) works to manage the exploration and development of the nation's offshore resources in a way that appropriately balances economic development, energy independence, and environmental protection through oil and gas leases, renewable energy development and environmental reviews and studies.


![Organic Portals Theory - Sources - Library AHlibrary.abundanthope.org/index_htm_files/opsources.pdf · Organic Portals Theory: Sources John Baines The Stellar Man (1985). [p 41] ...](https://static.documents.pub/doc/80x56/5bb81a3209d3f2930f8b7ec1/organic-portals-theory-sources-library-organic-portals-theory-sources-john.jpg)


