In epilepsy surgery, it is essential to determine the preciselocation and the extent of the epileptogenic zone (EZ),which is the cortical area involved in seizure generation thatshould be resected to control the epileptic seizures (Rose-
now & Luders, 2001). The elucidation of the EZ is a chal-lenging task, especially in patients with extratemporalepilepsy, because a widespread EZ, rapid spreading of ictalelectroencephalographic changes, and large areas inaccessi-ble to the scalp electroencephalography (EEG) often char-acterize this type of epilepsy (Roper, 2009; Ansari et al.,2010). Because of these limitations, a significant proportionof patients with presumed extratemporal epilepsy have toundergo invasive EEG recordings (Spencer, 1998).
In this context, the precise study of the cortical sourcesinvolved in the generation of the interictal epileptiform
Accepted December 5, 2012; Early View publication January 30, 2013.Address correspondence to Antonio Donaire, Epilepsy Comprehensive
activity (IEA) proves crucial. These cortical areas containintrinsic epileptogenicity and constitute an indirect markerof the brain region involved in seizure generation. There-fore, the region of seizure onset should be found within thearea where the IEA is recorded, the so-called irritative zone(IZ) (Asano et al., 2003; Brodbeck et al., 2009). In thatrespect, simultaneous electroencephalography (EEG)recording and functional magnetic resonance imaging(EEG-fMRI) has emerged as a useful and noninvasive tech-nique that provides valuable information concerning thelocation of the regions generating IEA (Bagshaw et al.,2005; Salek-Haddadi et al., 2006; Benar et al., 2006;Thornton et al., 2011; Vulliemoz et al., 2011).
Recently, more flexible methods of analysis, such as thedynamic or sequential analysis of the EEG-fMRI data(Tyvaert et al., 2009; Donaire et al., 2009a,b), based on thesuccessive contrast of fixed-width blocks of fMRI scans,have enabled the determination of the temporal developmentof changes in the blood oxygen level–dependent (BOLD) sig-nal induced by epileptic seizures. These methods allow theprecise and noninvasive location of the seizure-onset zone aswell as the structures involved in seizure propagation.
In this scenario, we propose to study the cortical sub-strates of the interictal bursts of repetitive spiking or runs ofIEA by using sequential analysis of EEG-fMRI data. Theseinterictal epileptiform events would result in a larger andlonger BOLD response than would an individual spike,making them suitable for sequential analysis (Friston et al.,1998; Bagshaw et al., 2004; Jacobs et al., 2008). By assum-ing that the initial changes in BOLD signal involved in thegeneration of the IEA represent the cortical substrates of theIEA and that these cortical sources could be intimatelyrelated to the EZ, we could noninvasively gather valuabledata regarding the location of the EZ.
The aims of this study were the following: (1) To utilizethe sequential analysis of the EEG-fMRI data in order tofind the cortical sources involved in the generation of the in-terictal epileptiform discharges; (2) to compare the resultsby the EEG-fMRI sequential analysis with those foundusing the [18F]-fluorodeoxyglucose (FDG) positron emis-sion tomography (PET) to assess whether regions of IEA-related BOLD signal change are spatially related to thefunctionally disabled brain regions depicted by FDG-PETin patients with extratemporal epilepsy; and (3) to comparethe presurgical IEA-related areas of activation and the surgi-cal outcome.
Material and MethodsThis study included 21 refractory epilepsy young patients
from the epilepsy unit in the Hospital Sant Joan de D�eu andHospital Clinic (Barcelona, Spain) recruited during 2009–2010. The inclusion criteria were the presence of pharmaco-resistant extratemporal focal epilepsy with or without anMRI lesion and frequent IEA that was defined as more than
10 interictal epileptiform discharges (bursts or runs of inte-rictal epileptic activity) in 10 min of previously recordedlong-term video-EEG evaluation.
During the study period, 36 patients were recruited forEEG-fMRI scanning, of whom 21 met the criteria. Allpatients underwent a comprehensive presurgical evaluationthat included an interictal FDG-PET.
The median age of the patients was 14 years (5–25 years). The most common type of epilepsy was frontal-lobe epilepsy (11/21, 52.38%), followed by parietal-lobeepilepsy (7/21, 33.33%). The structural MRI showed noclear structural abnormality in 14 patients, whereas a mal-formation of cortical development was found in 5, and aperinatal ischemic insult in 2 patients. Clinical characteris-tics and preoperative evaluation of each patient are summa-rized in Table 1.
Written, informed consent was submitted by all patientsor family relatives. The ethics committees of both institu-tions approved the study protocol.
Acquisition of the fMRI dataSeventeen subjects and four subjects underwent fMRI
in a Signa 1.5-T (General Electric Medical Systems, Mil-waukee, WI, U.S.A.) and TIM TRIO 3-Tesla (Siemens,Erlangen, Germany) scanners respectively. Acquisitionparameters for the fMRI images are summarized in TableS1. Three runs of continuous BOLD fMRI acquisitionwere scheduled per patient. The duration of the runs ran-ged between 11 min 20 s for those registered in a 1.5 TMRI scan and 14 min 36 s for those registered in a 3 Tscanner.
Thirty-two EEG channels were continuously acquiredinside the MRI scanner using a magnetic resonance (MR)–compatible system (BrainAmp MR; Brain Products GMbH,Munich, Germany). Data were transmitted from the Brain-Amp amplifier (sampling rate, 5 kHz; 250 Hz low-pass and0.03 Hz high-pass filters) via an optic-fiber cable to theEEGmonitor located outside the scanner room.
The EEG sets were filtered offline using Brain Visio-nAnalyzer software (Brain Products). The gradient arti-facts were corrected offline following (Allen et al.,2000). Two experienced epileptologists (MC and AD)reviewed the filtered EEGs. The IEA and subclinical orclinical seizures registered during fMRI scanning weremanually marked. The spatial distribution, duration, andtiming of the IEA were considered for further analysis.The IEA was classified according to their potential fielddistribution detected on the scalp EEG. When recorded,the subclinical and clinical seizures were classified basedon their seizure-onset patterns and were also included inthe study. According to the IEA frequency and duration,the interictal discharges were classified as follows: iso-lated sharp waves, where only one interictal epileptiformdischarge (IED) was registered in a scan (TR: 2 s); aburst of IEA, where more than two epileptic discharges
occurring in temporal proximity were registered in ascan; runs of IEA, where repetitive sharp waves lastedmore than 2 s and <10 s; and prolonged runs of IEA,where repetitive discharges lasted for more than 10 s.
One antiepileptic drug was reduced by 50% to facilitatethe recording of prolonged runs of IEA or subclinical sei-zures, and all patients were sleep deprived 24 h prior tothe scan. In seven children, sleep was induced by oral
administration of 3 mg of melatonin 30 min before thescan to facilitate lying still during the scan.
fMRI analysisThe fMRI was processed and analyzed applying sequen-
tial fMRI analysis (Donaire et al., 2009a) by means ofseqfMRI, a homemade SPM8 (Institute of Neurology,University College London, United Kingdom) toolbox
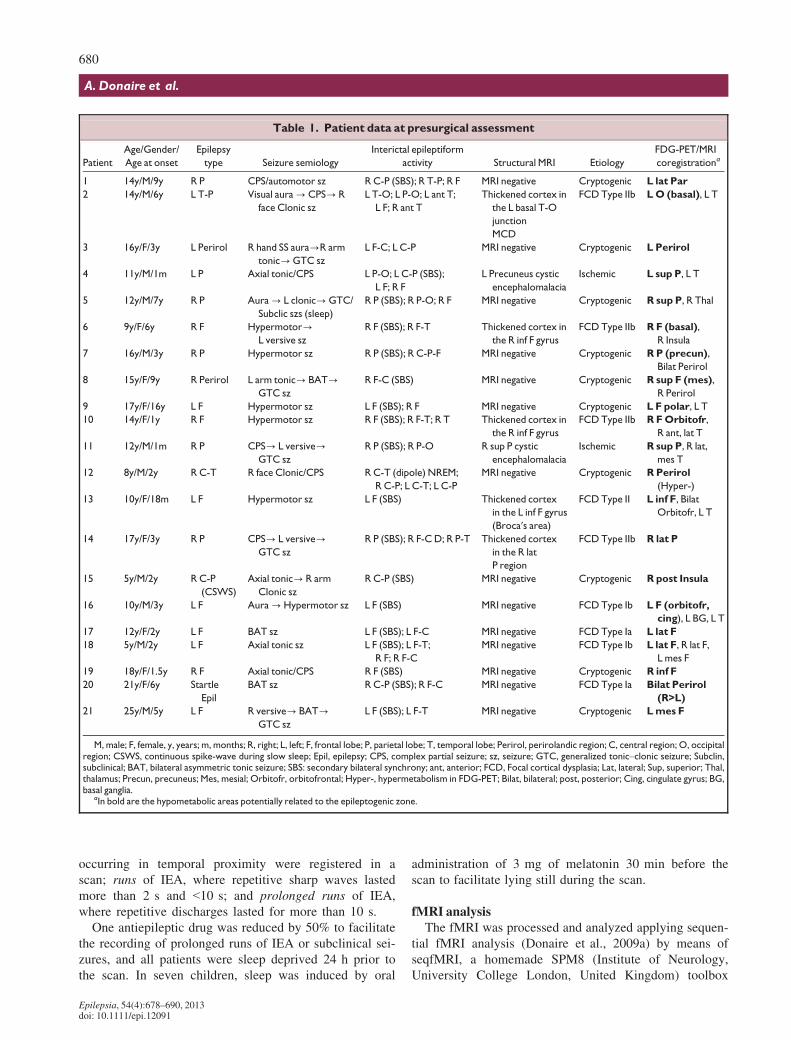
Table 1. Patient data at presurgical assessment
Patient
Age/Gender/
Age at onset
Epilepsy
type Seizure semiology
Interictal epileptiform
activity Structural MRI Etiology
FDG-PET/MRI
coregistrationa
1 14y/M/9y R P CPS/automotor sz R C-P (SBS); R T-P; R F MRI negative Cryptogenic L lat Par
2 14y/M/6y L T-P Visual aura?CPS? R
face Clonic sz
L T-O; L P-O; L ant T;
L F; R ant T
Thickened cortex in
the L basal T-O
junction
MCD
FCDType IIb LO (basal), L T
3 16y/F/3y L Perirol R hand SS aura?R arm
tonic?GTC sz
L F-C; L C-P MRI negative Cryptogenic L Perirol
4 11y/M/1m L P Axial tonic/CPS L P-O; L C-P (SBS);
L F; R F
L Precuneus cystic
encephalomalacia
Ischemic L sup P, L T
5 12y/M/7y R P Aura? L clonic?GTC/
Subclic szs (sleep)
R P (SBS); R P-O; R F MRI negative Cryptogenic R sup P, R Thal
6 9y/F/6y R F Hypermotor?L versive sz
R F (SBS); R F-T Thickened cortex in
the R inf F gyrus
FCD Type IIb R F (basal),
R Insula
7 16y/M/3y R P Hypermotor sz R P (SBS); R C-P-F MRI negative Cryptogenic RP (precun),
Bilat Perirol
8 15y/F/9y R Perirol L arm tonic? BAT?GTC sz
R F-C (SBS) MRI negative Cryptogenic R sup F (mes),
R Perirol
9 17y/F/16y L F Hypermotor sz L F (SBS); R F MRI negative Cryptogenic L F polar, L T
10 14y/F/1y R F Hypermotor sz R F (SBS); R F-T; R T Thickened cortex in
the R inf F gyrus
FCD Type IIb R FOrbitofr,
R ant, lat T
11 12y/M/1m R P CPS? L versive?GTC sz
R P (SBS); R P-O R sup P cystic
encephalomalacia
Ischemic R sup P, R lat,
mes T
12 8y/M/2y R C-T R face Clonic/CPS R C-T (dipole) NREM;
R C-P; L C-T; L C-P
MRI negative Cryptogenic RPerirol
(Hyper-)
13 10y/F/18m L F Hypermotor sz L F (SBS) Thickened cortex
in the L inf F gyrus
(Broca′s area)
FCD Type II L inf F, Bilat
Orbitofr, L T
14 17y/F/3y R P CPS? L versive?GTC sz
R P (SBS); R F-CD; R P-T Thickened cortex
in the R lat
P region
FCD Type IIb R lat P
15 5y/M/2y R C-P
(CSWS)
Axial tonic? R arm
Clonic sz
R C-P (SBS) MRI negative Cryptogenic R post Insula
16 10y/M/3y L F Aura?Hypermotor sz L F (SBS) MRI negative FCD Type Ib L F (orbitofr,
cing), L BG, L T
17 12y/F/2y L F BAT sz L F (SBS); L F-C MRI negative FCD Type Ia L lat F
18 5y/M/2y L F Axial tonic sz L F (SBS); L F-T;
R F; R F-C
MRI negative FCD Type Ib L lat F, R lat F,
L mes F
19 18y/F/1.5y R F Axial tonic/CPS R F (SBS) MRI negative Cryptogenic R inf F
20 21y/F/6y Startle
Epil
BAT sz R C-P (SBS); R F-C MRI negative FCD Type Ia Bilat Perirol
(R>L)
21 25y/M/5y L F R versive? BAT?GTC sz
L F (SBS); L F-T MRI negative Cryptogenic Lmes F
M, male; F, female, y, years; m, months; R, right; L, left; F, frontal lobe; P, parietal lobe; T, temporal lobe; Perirol, perirolandic region; C, central region; O, occipitalregion; CSWS, continuous spike-wave during slow sleep; Epil, epilepsy; CPS, complex partial seizure; sz, seizure; GTC, generalized tonic–clonic seizure; Subclin,subclinical; BAT, bilateral asymmetric tonic seizure; SBS: secondary bilateral synchrony; ant, anterior; FCD, Focal cortical dysplasia; Lat, lateral; Sup, superior; Thal,thalamus; Precun, precuneus; Mes, mesial; Orbitofr, orbitofrontal; Hyper-, hypermetabolism in FDG-PET; Bilat, bilateral; post, posterior; Cing, cingulate gyrus; BG,basal ganglia.
aIn bold are the hypometabolic areas potentially related to the epileptogenic zone.
running on MATLAB (MathWorks Incorporated, Natick,MA, U.S.A.). Preprocessing involved realignment of thefMRI images for motion correction, spatial normalization tothe Montreal Neurological Institute (MNI) template, andspatial smoothing with a Gaussian kernel of 8 mm.
For each subject, we selected an fMRI run with a highnumber of IEAs for further statistical analysis. Sequentialanalysis was performed by comparing two consecutiveblocks within the analysis windows. The analysis windowsize used in this work was of 44 s (22 scans), split in 10 sfixed-width blocks (five scans). This analysis window wasshifted one scan further (2 s) along the entire run in order toobtain the relative variations of consecutive blocks resultingin something like a smoothed temporal derivative of brainactivity.
Significant responses were defined as the clusters of 5 ormore contiguous voxels with at least one voxel within thecluster with an /t/>9.7 (p < 0.05, FWE corrected) (Fristonet al., 1995), time-locked to the IEA recorded on the scalpEEG. T-maps for each contrast were coregistered on thepatient-normalized T1-weighted MRI.
In addition, significant responses at slightly lower but sig-nificant threshold (/t/>5; p < 0.001), which were consis-tently time-related to the IEA and concordant with thepotential location of the irritative zone/EZ, were also con-sidered for further analysis.
In the case of runs or prolonged runs of IEA, and in thecase of clinical or subclinical seizures, the relationshipbetween the topographies of the ictal onset foci and the inte-rictal foci (sites where interictal spikes showed significantBOLD signal changes) depicted by sequential analysis wasalso analyzed.
We selected in each patient the most representative typeof IED, such as the IEDs that best represent the location ofthe EZ based on the previous clinical, neurophysiological,and structural information. We focused mainly on the initialpositive responses (activations) related to each epileptic dis-charge, as we presumed that the positive BOLD providesmore information about the cortical substrates of the IEA.Nevertheless, the negative responses (deactivations) relatedto the IEA were also analyzed.
18F-FDG-PET/MRI coregistrationThe PET images were acquired in three-dimensional
mode using Siemens PET/CT (computed tomography) Bio-graph equipment. Reconstruction was performed using anOSEM (Ordered Subset Expectation Maximisation) algo-rithm with a matrix of 128 9 128 9 64 and 2.6 mm3 voxelsize.
Both PET and 3D MRI volumes were normalized to thestandardMNI space and coregistered. We applied the SPM8coregistration algorithm based on the optimization of theNormalized Mutual Information function.
The qualitative visual interpretation was performed by anuclear-medicine expert (XS). Each study was considered
for further analysis when it showed at least one, well-defined, hypometabolic area consistent with the location ofthe epileptogenic zone.
For each subject, the activation t-maps related to the IEAwere coregistered, in turn, to the coregistered 18F-FDGPET-MRI to compare the location of the significant regionsof IEA-related BOLD signal change in relation to the abnor-mal metabolic cortical regions depicted by FDG-PET.
The activations were classified as concordant when theyoverlapped totally or partially with the hypometabolicregion. Furthermore, we made a distinction between activa-tions that were embedded within the hypometabolic regionand activations that were related to the limits of the hypo-metabolic region. The latter were further subdividedbetween activations located at the margins of the hypometa-bolic region (at the boundary line but immediately insidethe boundary) and activations located close by (activationsfound within 2 cm of the hypometabolic region boundaryline).
Activations that were located more than 2 cm from theboundary line or in another cerebral lobe other than wherethe potential EZ was located were considered nonconcor-dant.
Epilepsy surgeryIn patients who underwent a cortical resection, we exam-
ined whether the IEA-related activations were included inthe resected tissue and correlated these results with the sei-zure outcome after the epilepsy surgery. In our study, theEEG-fMRI results were not used in the planning of invasiveEEG recordings or resections in those that underwentepilepsy surgery.
ResultsSimultaneous EEG-fMRI: EEG findings
For all patients, their typical IEDs were recorded duringthe fMRI scanning (Table S2). Even in those patients wheresleep was induced with melatonin, the epileptic dischargesregistered were similar to the discharges recorded duringthe long-term video-EEG evaluation. A total of 21 IEA setswere analyzed.
The number of bursts of IEA analyzed on each run offMRI ranged from 6 to 219 (mean 40.14), the number ofIEA runs ranged 2–25 (mean 8.23; mean duration 6.19 s),and the number of prolonged IEA runs ranged from 1 to 11(mean 4; mean duration 18.02 s). Notice that most of theruns and prolonged runs of IEA corresponded to secondarybilateral synchrony.
Unexpectedly, in eight patients, epileptic seizures wererecorded. Four patients had a single ictal event, threepatients had two ictal events and one patient with
continuous spikes and waves during slow sleep (CSWS) had12 subclinical seizures. Overall, the duration of the ictalevents ranged from 4 to 69 s. Most of the events were sub-clinical ictal EEG events. A clinical seizure consisting of aright-hand somatosensory aura was registered (duration16 s) in Patient 3, who had left perirolandic epilepsy.
Simultaneous EEG-fMRI: changes in the IEA-relatedBOLD signal
After the sequential analysis, all patients showed at leastone cluster of significant increase in IEA-related BOLD sig-nal, corresponding to the initial changes in BOLD signalassociated with the generation of the interictal epileptiformevents, concordant with the IEA topography and potentiallyrelated to the brain region involved in the generation of epi-leptic activity. The activation areas were synchronous withthe interictal epileptiform discharges recorded on the EEGs,but sometimes the changes in BOLD signal preceded theepileptic discharges by 2–4 s.
In 19 (95%) patients, more than one area of signifi-cant increase in BOLD signal concordant with the spa-tial distribution of the IEDs was found at the initialstages of the IEA generation process (Figs. 1, 2; seealso Figs. S1 and S3). The number of areas of BOLDactivation ranged from 2 to 4 (median 3). The locationof the clusters of IEA-related activation within the brainwas consistent throughout the interictal epileptiformevents analyzed in each patient. However, these activa-tion areas did not occur simultaneously with each inte-rictal epileptic event, but rather each was associatedmainly with an interictal event, with each time beingindependent from the other activations. The significantBOLD IEA-related activation areas initially involved in
the generation of the IEA, in each patient, are summa-rized in Table 2. The activations with the highest t-val-ues were selected. In addition, in 15 patients, activationsinvolving regions remote from the presumed EZ overthe contralateral hemisphere homonymous region werefound.
The proportion of bursts of IEAs that showed a positiveBOLD response was 11.62% for bursts of IEA, 45.60% forruns of IEA, 59.10% for prolonged runs, and 81.81% forepileptic seizures.
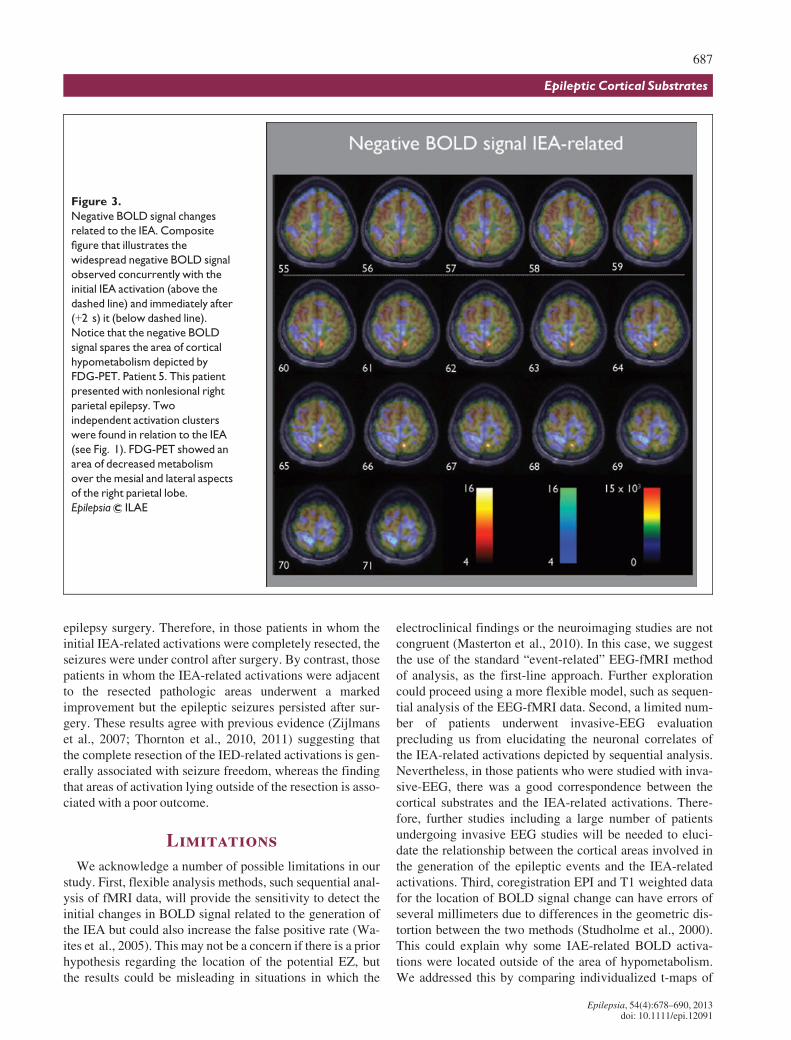
Concomitantly or immediately after the initial increase inIEA-related BOLD signal was seen, a widespread decreasein BOLD signal involving both hemispheres was observed.The BOLD negative signal was distributed in a constantway around the hypometabolic region depicted by FDG-PET, but without entering the hypometabolic area, and inthe contralateral homotopic cortical region. Other regionsinvolved were the mesial aspects of the frontal, parietal, andoccipital lobes, as well as, bilaterally, the perirolandic cor-tex (Fig. 3; see also Fig. S4).
In the eight patients for whom seizures were recordedduring EEG-fMRI scanning, a cluster of seizure-relatedBOLD signal increase was found at seizure onset. In all ofthe patients, the maximal seizure-related increase in theBOLD signal corresponded to one of the IEA-related activa-tion areas that had previously been depicted by sequentialanalysis (Figs. 1 and 2).
In two patients (17 and 21), an invasive EEG evaluationwith subdural electrodes was performed. In Patient 17, fourregions of the IEA were detected, located along the primarymotor and prefrontal cortex. The location of these regionsagreed with the anatomic distribution of the areas of theIEA-related activation (Fig. S1). In addition, three areas of
Figure 1.
Patient 5. Sequence of changes in BOLD signal associated with the generation of the interictal epileptiform activity (IEA) (A, B). Com-
parison of the changes in IEA-related BOLD signal and the signal changes related to a subclinical seizure (C). This patient presented
with nonlesional right parietal epilepsy. The discharges analyzed were located over the right parietal lobe. Two independent clusters
of activation were found in relation to the IEA. In the upper panel (A), the figure illustrates the changes in BOLD signal related to a run
of spike and waves of 5 s in duration, corresponding to �2, 0, and +2 s after the onset to the epileptiform discharge, respectively. In
the lower panel (B,C), the figure illustrates the successive changes in BOLD signal (at 0, +2, +4 s after the EEG onset) associated with
a prolonged run of spike and waves over the right hemisphere of 14 s in duration (B) and the signal changes related to a subclinical epi-
leptic seizure (C) of 16 s in duration (at �2, 0, +2 s after seizure onset) are displayed. As observed, the area of seizure-related
increase in BOLD signal corresponds to the run of the IEA-activation area (lower panel). The activations are displayed as t-statistics
thresholded at p < 0.001 and uncorrected for multiple comparisons superimposed over the FDG-PET-MRI coregistration. The clus-
ters of IEA-related BOLD signal were consistent with the FDG hypometabolism: one was located at the margins (A) and the other
within the hypometabolic region (B). A graphic representation of the IEA recorded during fMRI scanning is also provided. In the y-axis,
the IEA is represented as follows: (1) Isolated sharp waves, (2) Burst of IEA, (3) Runs of IEA, and (4) Subclinical epileptic seizures. The
black arrows highlight the epileptic events illustrated in the figure. Time courses of the BOLD signal changes over the whole recording
of the initial clusters of activation associated to the IEA illustrated in (A, B) are also provided (blue line). The time series were
extracted from a region of interest from the initial IEA-related activation, defined by the voxel with the highest t-value in the region
and the six voxels adjacent to the six surfaces of the voxel with the highest t-value. The image is shown in neurologic convention (i.e.,
ictal onset were identified by invasive EEG, and these areascolocalized with three of four IEA-related activationsdepicted by the sequential analysis.
In Patient 21, the invasive EEG recording revealed twoextensive regions of interictal epileptiform activity. Oneinvolved 10 contacts and was located over the lateral aspectof the frontal lobe; the other one involved six contacts andwas located over the mesial aspect of the frontal lobe. Avery extensive ictal-onset zone comprising all of the elec-trodes involved in the interictal epileptiform activity wasfound by the invasive EEG evaluation. The areas of seizureonset depicted by the invasive EEG were also consistent
with the IEA-related activation depicted by the sequentialanalysis.
Coregistration of FDG-PET andMRIVisual assessment showed that at least one area of focal
cortical hypometabolism on the FDG-PET agreed with thepresumed EZ. In 17 patients, between 2 and 4 (median 2)areas of focal decreases in cerebral metabolism were found(Table 1). These regions were distributed in the contiguouslobules or in the homonymous contralateral region and therewas no MRI abnormality associated with them. In thepatient who presented with CSWS, the FDG-PET showed
an area of increased metabolism over the perisylvian region,which was consistent with the location of the regioninvolved in epileptic activity generation.
Coregistration of FDG-PET/MRI and EEG-fMRI resultsCoregistration of the IEA-related changes in the BOLD
signal to the FDG-PET findings showed that the activationsassociated with the cortical sources of the IEA for eachpatient were in concordance with the hypometabolic regionpotentially related to the EZ. Invariably, for each patient, theIAE-related activations were smaller than the hypometabolicregion and in 18 patients were located mostly at the marginsof the cortical area of decreased metabolism. In just twopatients the activations were located exclusively close to thehypometabolic region. The distribution of the clusters ofIEA-related BOLD signal in relation to the hypometabolicregion depicted by FDG-PET is summarized in Table 2. Inthe patient showing CSWS, the IEA-related activations werelocated within the area of increasedmetabolism (Fig. S3).
Surgery outcomeEight patients underwent resective epilepsy surgery. Of
those, four patients showed a clear MRI lesion consistentwith a malformation of cortical development, whereas fourdid not show a clear MRI lesion. A further 13 patients didnot undergo surgery owing to an extensive EZ (n = 2) oroverlap with eloquent cortical areas (n = 8) or because theywere awaiting further evaluation (n = 3). After epilepsysurgery, five patients remained seizure-free for a periodranging from 1.1 to 2 years. Four of five seizure-freepatients showed an MRI structural abnormality consistentwith a malformation of cortical development. In all seizure-free patients but one, the resection included the malforma-tion of cortical development and the IEA-related activationsdepicted by the sequential analysis. In one patient with an
extensive malformation of cortical development near theprimary sensory cortex, a limited resection of the malforma-tion was performed to prevent further functional deficits. Inthis subject, the IEA sequential analysis showed two activa-tions close to the cerebral structural abnormality. One ofthese activations, located over the primary sensory cortex,remained adjacent to the resected pathological areas(Fig. S2). The patient remains seizure-free 10 months afterthe surgery; however, very frequent and repetitive epilepticdischarges were found postoperatively over the operatedregion in the scalp EEG. In all seizure-free patients, the his-tology of the resected tissue cortex confirmed the presenceof a focal cortical dysplasia type IIb as the pathologyresponsible for the epilepsy (Blumcke et al., 2011).
The remaining three patients who underwent epilepsysurgery manifested improvement with a significant reduc-tion of more than 50% in seizure frequency after surgery. Inno case was there a clear lesion on the MRI before surgery,and some IEA-related activations were found just adjacentto the resected pathologic areas (Fig. S1). In all of thepatients who experienced seizures after epilepsy surgery,the histology of the resected tissue cortex confirmed thepresence of a focal cortical dysplasia type I.
DiscussionThis is the first report available to investigate BOLD signal
changes related to IEA in children, adolescents, and youngadults with extratemporal epilepsy using sequential analysisof the EEG-fMRI data. The main findings in this study were,firstly, that sequential analysis enabled us to map the initialchanges in IEA-related BOLD signal in patients with pro-longed bursts or a run of spikes recorded during fMRI scan-ning. Secondly, these changes in IEA-related BOLD signalwere spatially consistent with the pattern of FDG-PET–
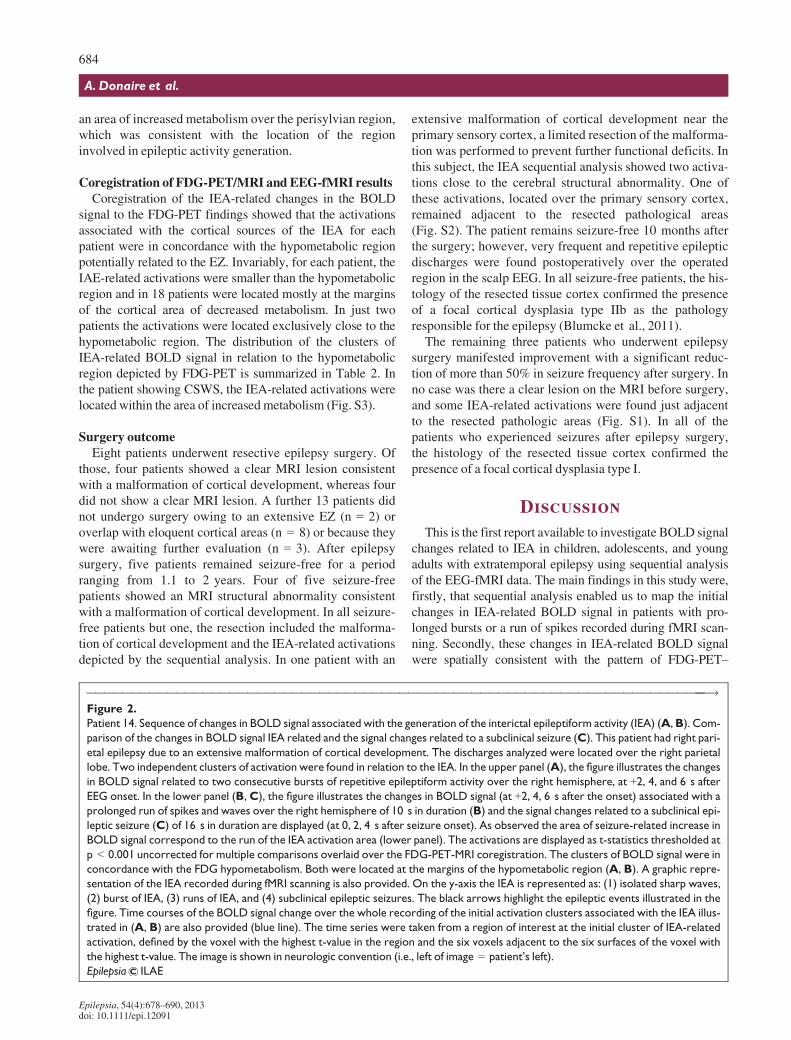
Figure 2.
Patient 14. Sequence of changes in BOLD signal associated with the generation of the interictal epileptiform activity (IEA) (A,B). Com-
parison of the changes in BOLD signal IEA related and the signal changes related to a subclinical seizure (C). This patient had right pari-
etal epilepsy due to an extensive malformation of cortical development. The discharges analyzed were located over the right parietal
lobe. Two independent clusters of activation were found in relation to the IEA. In the upper panel (A), the figure illustrates the changes
in BOLD signal related to two consecutive bursts of repetitive epileptiform activity over the right hemisphere, at +2, 4, and 6 s after
EEG onset. In the lower panel (B,C), the figure illustrates the changes in BOLD signal (at +2, 4, 6 s after the onset) associated with a
prolonged run of spikes and waves over the right hemisphere of 10 s in duration (B) and the signal changes related to a subclinical epi-
leptic seizure (C) of 16 s in duration are displayed (at 0, 2, 4 s after seizure onset). As observed the area of seizure-related increase in
BOLD signal correspond to the run of the IEA activation area (lower panel). The activations are displayed as t-statistics thresholded at
p < 0.001 uncorrected for multiple comparisons overlaid over the FDG-PET-MRI coregistration. The clusters of BOLD signal were in
concordance with the FDG hypometabolism. Both were located at the margins of the hypometabolic region (A, B). A graphic repre-
sentation of the IEA recorded during fMRI scanning is also provided. On the y-axis the IEA is represented as: (1) isolated sharp waves,
(2) burst of IEA, (3) runs of IEA, and (4) subclinical epileptic seizures. The black arrows highlight the epileptic events illustrated in the
figure. Time courses of the BOLD signal change over the whole recording of the initial activation clusters associated with the IEA illus-
trated in (A, B) are also provided (blue line). The time series were taken from a region of interest at the initial cluster of IEA-related
activation, defined by the voxel with the highest t-value in the region and the six voxels adjacent to the six surfaces of the voxel with
the highest t-value. The image is shown in neurologic convention (i.e., left of image = patient’s left).
detected hypometabolism and, finally, the complete resectionof the brain regions corresponding to the clusters of increasedIEA-related BOLD signal, rendered the patients seizure-free.Therefore, these clusters may represent the initial metabolicresponse to the epileptiform activity and therefore representtheir cortical substrates. These findings are discussed in sepa-rate sections below.
Sequential analysis of the EEG-fMRI data: changes inthe IEA-related BOLD signal
Sequential analysis of the EEG-fMRI enabled us tostudy individual interictal events, this being of particular
interest in allowing the direct linkage of an individual in-terictal discharge to the associated changes in BOLD sig-nal (Krakow et al., 2001). As shown in the present study,different cortical foci may be involved in the generationof similar surface interictal events, as we found that simi-lar interictal epileptic events could be independently asso-ciated with different activation areas distributed along theIZ. These results are in line with previous EEG-fMRIstudies (Federico et al., 2005; Jacobs et al., 2007; Zijl-mans et al., 2007; Thornton et al., 2010) that have dem-onstrated the existence of one or more regions of IED-related BOLD signal change in regions tightly coupled
with the area of the brain potentially involved in the gen-eration of the IEA.
In fact, in the patients who underwent invasive EEG stud-ies, the IAE-related activations depicted by the sequentialanalysis showed a consistent spatial relationship with thecortical areas that displayed frequent and high-amplitudespiking on the subdural EEG evaluation, in agreement withprevious EEG-fMRI studies (Bagshaw et al., 2004; Benaret al., 2006; Zijlmans et al., 2007; Thornton et al., 2011).Therefore, our results further demonstrate that the sequen-tial analysis of the fMRI data could be capable of accuratelyand reliably locating the regions responsible for the IEAgeneration. However, further studies with more patientsundergoing invasive EEG studies are necessary to confirmwhether the IEA-related activations depicted by thesequential analysis represent an alternative to locate theepileptogenic zone and help guide the presurgical planningand the invasive EEG-electrode placement for patients withextratemporal epilepsy.
In addition, an unexpected finding was that eight patientsexperienced brief electroencephalographic or clinical sei-zures, during EEG-fMRI scanning, The recording of interic-tal and ictal events in the same MRI session offered theopportunity to determine the relationship between the IEA-related activations, and those activations that were related tothe ictal-onset zone (IOZ) (Tyvaert et al., 2008). In thesepatients, who experienced epileptic seizures during fMRIscanning, a subset of the clusters of increases in BOLDsignal corresponding to the IEA zone overlapped with clus-ters corresponding to the IOZ, suggesting common neuronalgenerators. Taking into account that the IOZ constitutes thebest marker of the epileptogenic zone, sequential analysis ofthe IEA could indirectly provide useful information regard-ing the location of the EZ.
Correlation between the IEA-related areas of activationand FDG-PET
To the best of our knowledge, no systematic compari-son of the findings of EEG-fMRI with FDG-PET hasbeen performed to date. Our results show a consistentrelationship between the IEA-related areas of activationand the hypometabolic regions depicted by FDG-PET.The activation areas potentially related to the corticalsources of the IEA coincided when superimposed, withthe cortical metabolic abnormalities determined usingthe FDG-PET.
Therefore, in view of the high sensitivity depicted byFDG-PET (da Silva et al., 1997; Theodore et al., 1997;Chassoux et al., 2010) for defining areas of corticalhypometabolism that correspond to structural and functionalabnormalities involved in the generation of the epileptiformactivity, our findings reveal that the activations initiallyinvolved in IAE generation found by the sequential analysiscould in fact reflect the potential cortical substrates of theIEA recorded on scalp EEG.
In addition, we found that the hypometabolic region wasinitially spared from the widespread decrease in BOLD sig-nal related to the IEA. Assuming that the negative BOLDsignal surrounding the area of decreased metabolismdepicted by FDG-PET could reflect reduced synaptic activ-ity or greater c-aminobutyric acid (GABA)ergic inhibition(Logothetis, 2003; Stefanovic et al., 2005) in order to pre-vent the epileptic discharges from spreading (Kobayashiet al., 2006), we infer that the hypometabolic region repre-sents a site where the inhibitory mechanisms devoted torestraining epileptic activity are compromised. In thisrespect, there is some evidence from chronic animal modelsthat the inhibitory restraint is impaired around the regioninvolved in seizure generation (Sloviter, 1987; Cossartet al., 2001). It bears noting that any functional disturbanceinduced by epileptogenic insults or local pathology aroundthe IEA-cortical sources, particularly any that compromisedinhibition there, leads to the recruitment of the different cor-tical sources involved in IEA and seizure generation moreefficient (Trevelyan & Schevon, 2012). Therefore, the areaof decreased metabolism depicted by FDG-PET could rep-resent a proepileptic brain region where the generation ofthe epileptic discharges is facilitated.
The location of the IEA-related activations in relation tothe hypometabolic cortical regions was striking because inthe vast majority of the patients the activations were locatedwithin the hypometabolism but over the margins, in the areaimmediately inside or around the boundary of the hypomet-abolic area. From these results, we infer that the interictal-ictal epileptic events could be generated mostly from theinterface between the hypometabolic/normometabolicregion, in agreement with previous studies that specificallyaddressed the extent of cortical hypometabolism on theFDG-PET findings and the spatial relationship to the inva-sive EEG recordings (Juhasz et al., 2000; Alkonyi et al.,2009). These results could have significant implicationsregarding the invasive EEG and epilepsy surgery planningbecause only some well-defined areas of the hypometabolicregion prove to be epileptogenic, and these areas are locatedmostly in the margins of the area of decreased metabolism.Recordings with intracranial electrodes have demonstratedthat the EZ often extends beyond the lesion identifiable byMRI (Tassi et al., 2002; Widdess-Walsh et al., 2007).Therefore, these specific areas of decreased metabolismconcordant with the IEA-related activations should beassessed by invasive EEG to find the specific regionsinvolved in seizure generation and, subsequently, to delin-eate the cortical regions that should be further resected torender the patient seizure-free.
Correlation between the IEA-related areas of activationand surgery outcome
This study found a good correspondence between thelocation of the IEA-related activations, the area of resection,and surgery outcome in patients that finally underwent
epilepsy surgery. Therefore, in those patients in whom theinitial IEA-related activations were completely resected, theseizures were under control after surgery. By contrast, thosepatients in whom the IEA-related activations were adjacentto the resected pathologic areas underwent a markedimprovement but the epileptic seizures persisted after sur-gery. These results agree with previous evidence (Zijlmanset al., 2007; Thornton et al., 2010, 2011) suggesting thatthe complete resection of the IED-related activations is gen-erally associated with seizure freedom, whereas the findingthat areas of activation lying outside of the resection is asso-ciated with a poor outcome.
LimitationsWe acknowledge a number of possible limitations in our
study. First, flexible analysis methods, such sequential anal-ysis of fMRI data, will provide the sensitivity to detect theinitial changes in BOLD signal related to the generation ofthe IEA but could also increase the false positive rate (Wa-ites et al., 2005). This may not be a concern if there is a priorhypothesis regarding the location of the potential EZ, butthe results could be misleading in situations in which the
electroclinical findings or the neuroimaging studies are notcongruent (Masterton et al., 2010). In this case, we suggestthe use of the standard “event-related” EEG-fMRI methodof analysis, as the first-line approach. Further explorationcould proceed using a more flexible model, such as sequen-tial analysis of the EEG-fMRI data. Second, a limited num-ber of patients underwent invasive-EEG evaluationprecluding us from elucidating the neuronal correlates ofthe IEA-related activations depicted by sequential analysis.Nevertheless, in those patients who were studied with inva-sive-EEG, there was a good correspondence between thecortical substrates and the IEA-related activations. There-fore, further studies including a large number of patientsundergoing invasive EEG studies will be needed to eluci-date the relationship between the cortical areas involved inthe generation of the epileptic events and the IEA-relatedactivations. Third, coregistration EPI and T1 weighted datafor the location of BOLD signal change can have errors ofseveral millimeters due to differences in the geometric dis-tortion between the two methods (Studholme et al., 2000).This could explain why some IAE-related BOLD activa-tions were located outside of the area of hypometabolism.We addressed this by comparing individualized t-maps of
BOLD signal change with each subject’s three-dimensionalT1-weighted image, ensuring accurate anatomic location ofthe area of BOLD signal change. Finally, the low number ofpatients that underwent epilepsy surgery in this study pre-cluded us for generalizing to a wider sample. Further studieswith a higher number of surgical procedures will be neededto establish the relationship between the IEA-related activa-tions depicted by sequential EEG-fMRI analysis and thesurgical outcome.
ConclusionsThe present study shows that the IEA activations are
related to the FDG-PET hypometabolism and that theyoccur mostly at the margins of the hypometabolic area.Knowing the spatial distribution of the cortical sources andtheir representation with respect to the regions of structuralor functional abnormalities could be of great benefit toguide the invasive EEG-electrode placement and/or surgicalplanning in children, adolescents, and young adults withextratemporal epilepsy.
The sequential analysis of EEG-fMRI data may become anoninvasive means to depict the cortical substrates relatedto the IED generation.
AcknowledgmentsFunding support was provided by grants from the Spanish Fondo de In-
vestigaciones Sanitarias (FIS-PI0890278; FIS-PI080122; FIS-PI060077),ISCIII-MICINN. This work was jointly financed with FEDER funds, Euro-pean Union. Many thanks go to Rosario Guirao, Nuria Couto, VanessaGuzm�an, and Cristina C�amara, EEG-techs from Hospital Cl�ınic and Hospi-tal Sant Joan de Deu Epilepsy Units. In addition, we would like to recognizeto C�esar Garrido, Gemma Lasso, Susana Hern�andez, and Ram�on Garc�ıa,RM-techs from both institutions. Their hard work and dedication wereinvaluable in the completion of this study. The authors also thank CarlesFalc�on for his important help and advice.
DisclosureNone of the authors has any conflict of interest to disclose. We
confirm that we have read the Journal’s position on issues involvedin ethical publication and affirm that this report is consistent withthose guidelines.
ReferencesAlkonyi B, Juhasz C, Muzik O, Asano E, Saporta A, Shah A, Chugani HT.
(2009) Quantitative brain surface mapping of an electrophysiologic/metabolic mismatch in human neocortical epilepsy. Epilepsy Res 87:77–87.
Allen PJ, Josephs O, Turner R. (2000) A method for removing imagingartifact from continuous EEG recorded during functional MRI.Neuroimage 12:230–239.
Ansari SF, Maher CO, Tubbs RS, Terry CL, Cohen-Gadol AA. (2010)Surgery for extratemporal nonlesional epilepsy in children: a meta-analysis.Childs Nerv Syst 26:945–951.
Asano E, Muzik O, Shah A, Juhasz C, Chugani DC, Sood S, Janisse J,Ergun EL, Ahn-Ewing J, Shen C, Gotman J, Chugani HT. (2003)Quantitative interictal subdural EEG analyses in children withneocortical epilepsy. Epilepsia 44:425–434.
Bagshaw AP, Aghakhani Y, Benar CG, Kobayashi E, Hawco C,Dubeau F, Pike GB, Gotman J. (2004) EEG-fMRI of focal epilepticspikes: analysis with multiple haemodynamic functions andcomparison with gadolinium-enhanced MR angiograms. Hum BrainMapp 22:179–192.
Bagshaw AP, Hawco C, Benar CG, Kobayashi E, Aghakhani Y, Dubeau F,Pike GB, Gotman J. (2005) Analysis of the EEG-fMRI response toprolonged bursts of interictal epileptiform activity. Neuroimage24:1099–1112.
Benar CG, Grova C, Kobayashi E, Bagshaw AP, Aghakhani Y, Dubeau F,Gotman J. (2006) EEG-fMRI of epileptic spikes: concordance withEEG source localization and intracranial EEG. Neuroimage 30:1161–1170.
Blumcke I, Thom M, Aronica E, Armstrong DD, Vinters HV, Palmini A,Jacques TS, Avanzini G, Barkovich AJ, Battaglia G, Becker A, CepedaC, Cendes F, Colombo N, Crino P, Cross JH, Delalande O, Dubeau F,Duncan J, Guerrini R, Kahane P, Mathern G, Najm I, Ozkara C,Raybaud C, Represa A, Roper SN, Salamon N, Schulze-Bonhage A,Tassi L, Vezzani A, Spreafico R. (2011) The clinicopathologicspectrum of focal cortical dysplasias: a consensus classificationproposed by an ad hoc Task Force of the ILAE Diagnostic MethodsCommission. Epilepsia 52:158–174.
Brodbeck V, Lascano AM, Spinelli L, Seeck M, Michel CM. (2009)Accuracy of EEG source imaging of epileptic spikes in patients withlarge brain lesions.Clin Neurophysiol 120:679–685.
Cossart R, Dinocourt C, Hirsch JC, Merchan-Perez A, De Felipe J, Ben-AriY, Esclapez M, Bernard C. (2001) Dendritic but not somaticGABAergic inhibition is decreased in experimental epilepsy. NatNeurosci 4:52–62.
da Silva EA, Chugani DC, Muzik O, Chugani HT. (1997) Identification offrontal lobe epileptic foci in children using positron emissiontomography. Epilepsia 38:1198–1208.
Donaire A, Bargallo N, Falc�on C, Maestro I, Carreno M, Setoain J, Rumi�aJ, Fern�andez S, Pintor L, Boget T. (2009a) Identifying the structuresinvolved in seizure generation using sequential analysis of ictal-fMRIdata.NeuroImage 47:173–183.
Donaire A, Falcon C, Carreno M, Bargallo N, Rumia J, Setoain J, MaestroI, Boget T, Pintor L, Agudo R, Falip M, Fernandez S. (2009b)Sequential analysis of fMRI images: a new approach to study humanepileptic networks. Epilepsia 50:2526–2537.
Federico P, Archer JS, Abbott DF, Jackson GD. (2005) Cortical/subcorticalBOLD changes associated with epileptic discharges: an EEG-fMRIstudy at 3 T.Neurology 64:1125–1130.
Friston KJ, Holmes AP, Poline JB, Grasby PJ, Williams SC, FrackowiakRS, Turner R. (1995) Analysis of fMRI time-series revisited.Neuroimage 2:45–53.
Friston KJ, Fletcher P, Josephs O, Holmes A, Rugg MD, Turner R. (1998)Event-related fMRI: characterizing differential responses. Neuroimage7:30–40.
Jacobs J, Kobayashi E, Boor R, Muhle H, Stephan W, Hawco C, Dubeau F,Jansen O, Stephani U, Gotman J, Siniatchkin M. (2007) Hemodynamicresponses to interictal epileptiform discharges in children withsymptomatic epilepsy. Epilepsia 48:2068–2078.
Jacobs J, Levan P, Chander R, Hall J, Dubeau F, Gotman J. (2008)Interictal high-frequency oscillations (80–500 Hz) are an indicator ofseizure onset areas independent of spikes in the human epileptic brain.Epilepsia 49:1893–1907.
Juhasz C, Chugani DC, Muzik O, Watson C, Shah J, Shah A, Chugani HT.(2000) Is epileptogenic cortex truly hypometabolic on interictalpositron emission tomography? Ann Neurol 48:88–96.
Kobayashi E, Bagshaw AP, Grova C, Dubeau F, Gotman J. (2006)Negative BOLD responses to epileptic spikes. Hum Brain Mapp 27:488–497.
Krakow K, Messina D, Lemieux L, Duncan JS, Fish DR. (2001) FunctionalMRI activation of individual interictal epileptiform spikes.Neuroimage13:502–505.
Logothetis NK. (2003) The underpinnings of the BOLD functionalmagnetic resonance imaging signal. J Neurosci 23:3963–3971.
Masterton RA, Harvey AS, Archer JS, Lillywhite LM, Abbott DF, SchefferIE, Jackson GD. (2010) Focal epileptiform spikes do not show acanonical BOLD response in patients with benign rolandic epilepsy(BECTS).Neuroimage 51:252–260.
Roper SN. (2009) Surgical treatment of the extratemporal epilepsies.Epilepsia 50(Suppl. 8):69–74.
Rosenow F, Luders H. (2001) Presurgical evaluation of epilepsy. Brain124:1683–1700.
Salek-Haddadi A, Diehl B, Hamandi K, MerschhemkeM, Liston A, FristonK, Duncan J, Fish D, Lemieux L. (2006) Hemodynamic correlates ofepileptiform discharges: an EEG-fMRI study of 63 patients with focalepilepsy. Brain Res 1088:158–166.
Sloviter RS. (1987) Decreased hippocampal inhibition and a selective lossof interneurons in experimental epilepsy. Science 2:73–76.
Spencer SS. (1998) Substrates of localization-related epilepsies: biologicimplications of localizing findings in humans. Epilepsia 39:114–123.
Stefanovic B,Warnking JM, Kobayashi E, BagshawAP, Hawco C, DubeauF, Gotman J, Pike GB. (2005) Hemodynamic and metabolic responsesto activation, deactivation and epileptic discharges.Neuroimage 28:205–215.
Studholme C, Constable RT, Duncan JS. (2000) Accurate alignment offunctional EPI data to anatomical MRI using a physics-based distortionmodel. IEEE Trans Med Imaging 19:1115–1127.
Tassi L, Colombo N, Garbelli R, Francione S, Lo Russo G, Mai R, CardinaleF, Cossu M, Ferrario A, Galli C, Bramerio M, Citterio A, Spreafico R.(2002) Focal cortical dysplasia: neuropathological subtypes, EEG,neuroimaging and surgical outcome. Brain 125:1719–1732.
Theodore WH, Sato S, Kufta CV, Gaillard WD, Kelley K. (1997) FDG-positron emission tomography and invasive EEG: seizure focusdetection and surgical outcome. Epilepsia 38:81–86.
Thornton R, Laufs H, Rodionov R, Cannadathu S, Carmichael DW,Vulliemoz S, Salek-Haddadi A, McEvoy AW, Smith SM, Lhatoo S,Elwes RD, Guye M, Walker MC, Lemieux L, Duncan JS. (2010) EEGcorrelated functional MRI and postoperative outcome in focal epilepsy.J Neurol Neurosurg Psychiatry 81:922–927.
Thornton R, Vulliemoz S, Rodionov R, Carmichael DW, Chaudhary UJ,Diehl B, Laufs H, Vollmar C, McEvoy AW,Walker MC, Bartolomei F,Guye M, Chauvel P, Duncan JS, Lemieux L. (2011) Epileptic networksin focal cortical dysplasia revealed using electroencephalography-functional magnetic resonance imaging. Ann Neurol 70:822–837.
Trevelyan AJ, Schevon CA. (2012) How inhibition influences seizurepropagation.Neuropharmacology Jun 18 [Epub ahead of print].
Tyvaert L, Hawco C, Kobayashi E, Levan P, Dubeau F, Gotman J. (2008)Different structures involved during ictal and interictal epileptic
activity in malformations of cortical development: an EEG-fMRI study.Brain 131:2042–2060.
Tyvaert L, Levan P, Dubeau F, Gotman J. (2009) Noninvasive dynamicimaging of seizures in epileptic patients. Hum Brain Mapp 30:3993–4011.
Vulliemoz S, Carmichael DW, Rosenkranz K, Diehl B, Rodionov R,Walker MC, McEvoy AW, Lemieux L. (2011) Simultaneousintracranial EEG and fMRI of interictal epileptic discharges in humans.Neuroimage 54:182–190.
Waites AB, Shaw ME, Briellmann RS, Labate A, Abbott DF, Jackson GD.(2005) How reliable are fMRI-EEG studies of epilepsy? Anonparametric approach to analysis validation and optimization.Neuroimage 24:192–199.
Zijlmans M, Huiskamp G, Hersevoort M, Seppenwoolde JH, van HuffelenAC, Leijten FS. (2007) EEG-fMRI in the preoperative work-up forepilepsy surgery. Brain 130:2343–2353.
Supporting InformationAdditional Supporting Information may be found in the
online version of this article:Figure S1. Presurgical EEG-fMRI sequential analysis
results in a patient with nonlesional left frontal lobe epilepsy(Case 17).
Figure S2. Patient 14. Postoperative T1-weighted imageshowing the resected region.
Figure S3. Patient 15. EEG-fMRI sequential analysisresults in a patient with continuous spikes and waves duringslow sleep (CSWS).
Figure S4.Decrease in BOLD signal IEA related.Table S1. Acquisition parameters for the acquired fMRI