2014 AARS, All rights reserved. * Corresponding author: [email protected]Identifying the Process of Environmental Changes of Churu District, Rajasthan (India) Using Remote Sensing Indices Arnab Kundu 1* , Dipanwita Dutta 2 , N. R. Patel 3 , S. K. Saha 3 and A. R. Siddiqui 4 1 K. Banerjee Centre of Atmospheric and Ocean Studies, Institute of Interdisciplinary Studies, University of Allahabad, Uttar Pradesh, India 2 Department of Remote Sensing and GIS, Vidyasagar University, West Bengal, India 3 Indian Institute of Remote Sensing, Indian Space Research Organization, Uttarakhand, India 4 Department of Geography, University of Allahabad, Uttar Pradesh, India Abstract The ongoing environmental changes as well as in situ statistics have been adopted for the present study. An environmental change is a slow& gradual process and is hard to identify without long term historical data. The Landsat TM/ETM+ data along with historical crop acreage statistics was used to monitor the spatio-temporal changes in soil salinity, vegetation condition and cropping pattern of the area. Several remote sensing based indices like NDVI, NDSI and NDWI were employed to extract spatial information on vegetation health, soil salinity and canopy water content of the study area respectively. The soil salinity in terms of NDSI increased in the study area. The NDSI values were compared with the soil samples of the respective year with satellite data and a strong correlation (r2=0.86) was found between NDSI values and sand percentage of soil samples. The cropping pattern of the study area has been changed gradually since 1980 to 2008. Acreage of some major kharif (monsoonal) crops like jawar, bajra and moth has decreased whereas the area under rabi (winter) crops that is solely based on irrigational water, increased rapidly within this period. As a result, the area is highly vulnerable due to environmental degradation. Key words: Environmental Changes, NDVI, NDSI, NDWI. 1.Introduction During the century, environmental degradation has occurred worldwide and become a serious matter of concern. The process of environmental degradation has been identified in different ecosystem in different forms (Chen and Qu, 1992; Umar et al., 2001; Xiao et al., 2006; Wang et al., 2008). Environmental changes caused by human activities and regional climate changes have long been recognized throughout the world (Chen and Qu, 1992; Ye et al., 1998; Hadeel et al., 2011). Environmental degradation is a term used to describe a situation in which a part of the natural environment is damaged. It can be used to refer the damage of the land, to water or the air. Environmental degradation includes the loss of biodiversity and a loss of natural resources in an area. The process of environmental changes is very slow and hard to identify without having prior information regarding environmental components. Several studies adopted landuse landcover change detection as a useful technique to monitor the process of environmental degradation (Ram et al., 2003). Kundu and Dutta (2011) also addressed the long term vegetal degradation status of Churu district. According to them, the study reveals that more than half of the district has undergone a declining trend of vegetation cover indicating the ongoing process of desertification. Within this, about 64.54% area is experiencing this due to climatic processes and 35.46% area has undergone human activities Kundu and Dutta (2011). Siddiqui (2009) also showed the various environmental indicators which are able to diagnose the desertification of the risk zone of Churu district. The western part of India is characterized by semi arid climate, desert ecosystem and saline soil. Over the years this
Transcript
2014 AARS, All rights reserved.* Corresponding author: [email protected]
Identifying the Process of Environmental Changes of Churu District, Rajasthan (India) Using Remote Sensing Indices
Arnab Kundu1*, Dipanwita Dutta2, N. R. Patel3, S. K. Saha3 and A. R. Siddiqui4
1K. Banerjee Centre of Atmospheric and Ocean Studies, Institute of Interdisciplinary Studies, University of Allahabad, Uttar Pradesh, India
2Department of Remote Sensing and GIS, Vidyasagar University, West Bengal, India3Indian Institute of Remote Sensing, Indian Space Research Organization, Uttarakhand, India
4Department of Geography, University of Allahabad, Uttar Pradesh, India
Abstract
The ongoing environmental changes as well as in situ statistics have been adopted for the present study. An environmental change is a slow& gradual process and is hard to identify without long term historical data. The Landsat TM/ETM+ data along with historical crop acreage statistics was used to monitor the spatio-temporal changes in soil salinity, vegetation condition and cropping pattern of the area. Several remote sensing based indices like NDVI, NDSI and NDWI were employed to extract spatial information on vegetation health, soil salinity and canopy water content of the study area respectively. The soil salinity in terms of NDSI increased in the study area. The NDSI values were compared with the soil samples of the respective year with satellite data and a strong correlation (r2=0.86) was found between NDSI values and sand percentage of soil samples. The cropping pattern of the study area has been changed gradually since 1980 to 2008. Acreage of some major kharif (monsoonal) crops like jawar, bajra and moth has decreased whereas the area under rabi (winter) crops that is solely based on irrigational water, increased rapidly within this period. As a result, the area is highly vulnerable due to environmental degradation.
During the century, environmental degradation has occurred worldwide and become a serious matter of concern. The process of environmental degradation has been identified in different ecosystem in different forms (Chen and Qu, 1992; Umar et al., 2001; Xiao et al., 2006; Wang et al., 2008). Environmental changes caused by human activities and regional climate changes have long been recognized throughout the world (Chen and Qu, 1992; Ye et al., 1998; Hadeel et al., 2011). Environmental degradation is a term used to describe a situation in which a part of the natural environment is damaged. It can be used to refer the damage of the land, to water or the air. Environmental degradation includes the loss of biodiversity and a loss of natural resources in an area. The process of environmental changes is very slow and hard to identify without having prior
information regarding environmental components. Several studies adopted landuse landcover change detection as a useful technique to monitor the process of environmental degradation (Ram et al., 2003). Kundu and Dutta (2011) also addressed the long term vegetal degradation status of Churu district. According to them, the study reveals that more than half of the district has undergone a declining trend of vegetation cover indicating the ongoing process of desertification. Within this, about 64.54% area is experiencing this due to climatic processes and 35.46% area has undergone human activities Kundu and Dutta (2011). Siddiqui (2009) also showed the various environmental indicators which are able to diagnose the desertification of the risk zone of Churu district.
The western part of India is characterized by semi arid climate, desert ecosystem and saline soil. Over the years this
Asian Journal of Geoinformatics, Vol.14,No.3 (2014)
area has experienced constant increase of population and livestock with a growing demand of food and fodder. As a consequence,the natural resources have been exploited as much as to meet the growing demands without concerning about its capacity. The present study seeks to find out the spatio-temporal changes in land use and land cover of Churu district of Rajasthan through long term remotely sensed data. This area is adjacent to the great Indian Thar desert and characterized by longitudinal sand dunes stretching from southwest to northeast. The major portion of the district is covered by erosional and depositional features of wind. The region is highly vulnerable to desertification and related problems. According to (Ram et al., 2003), the area under cultivable waste of Churu district has declined by 93.81 %, other fallow lands and current fallow lands by 67.8 % and 43.61 % respectively from the year 1957-58 to 1998-99. They also found that the net sown area is increased by 47.60 % within this period besides a sharp increase of net irrigated area from 123 ha to 48,502 ha by sinking more wells in interdunal areas specially in Sardarshahr, Sujangarh, Dungargarh and Churu tehsils. The increasing population pressure as well as increasing number of livestock turning the sand dunes into agricultural land. These significant changes in landuse and landcover are making the area more vulnerable to desertification.
The objective of this study is to investigate the long term changes in landuse landcover over the Churu district as well as measuring the changes in soil salinity, biomass, topsoil water content through different indices based on remote sensed information. The several processes and stages of environmental degradation can not be measured unless using long term series data. In this study some Remote sensing based indices have been used. Remote sensing and GIS technologies are widely used and enormously promote people to understand a series of theoretical and practical problems in land degradation and dryland study (Wu and Ci, 2002; Basso et al., 2000). Remote sensing technique has been recommended by several studies (De Jong, 1994; Raina et al.,1993; Sabins et al.,1987; Sommer et al.,1998; Sujatha et al.,2000; Enne and Zucca, 2000; Dawelbait and Morari, 2012; Dasgupta et al., 2013; Li et al., 2013) and used as a reliable tool for monitoring desertification and land degradation from spatio-temporal aspect. Satellite based images has become popular in environmental studies for its large coverage, synoptic view, accurate and timely spatial information. In the present study, multi-temporal images of Landsat TM and ETM+ data has used for investigating the environmental condition. The spectral information of earth surface lies in several bands extracted through different remotely sensed indices. The Normalize Difference Vegetation Index (NDVI) is a very common and useful technique for monitoring vegetation condition. The science behind this index is that reflectance of healthy vegetation is high in infrared band whereas it is low in red band of electromagnetic spectrum. The Normalized Difference Salinity Index (NDSI) is just opposite to this condition. Dry
soil containing higher sand particles has higher reflection in red band and less in infrared band. Thus the normalized difference between these two bands has become helpful for measuring the salinity of soil and detecting the salt affected areas (Tilley et al., 2007; Wang et al., 2002). Another index, Normalized Difference Water Content (NDWI) based on reflected near-infrared radiation and visible green light has used to demarcate the presence of water as well the open water features exist in remotely sensed imagery. This index successfully used for different geo-spatial and environmental application such as water extraction, vegetation water content evaluation, wetland mapping, environmental change etc. (Gao, B. C., 1996; Mcfeeters, S. K., 1996; Ouma and Tateishi, 2006; Xu, 2006; Qiao et al., 2012). In their study (Japper et al., 2007) found that NDWI is highly related to the chlorophyll and moisture content.
2. Study Site
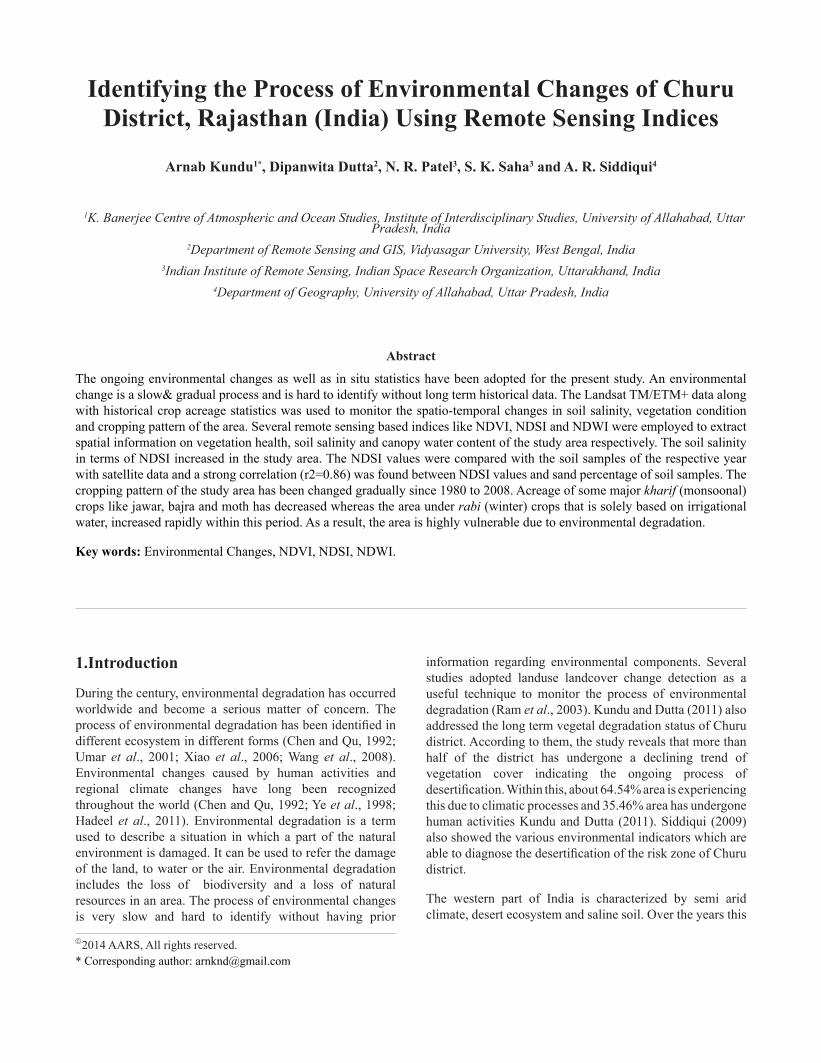
Churu district with a total geographical area of 13,85,889 hectares is located between 73051’49’’ to 75040’20’’ east longitudes and between 27024'39’’ to 29000’00’’ north latitudes. The district was reorganized on 1st April, 2001 by segregating its Sri Dungargarh tehsil from Bikaner district. It is bounded by Mahendragarh and Hissar districts of Haryana towards east; Hanumangarh district towards north; Nagaur, Sikar and Jhunjhunun districts towards south and south east; and Bikaner in the west. The district has 7 towns and 908 villages with a total population of 19,22,908 persons as per 2001 census. Its physiography is marked by vast stretches of sandy flats and undulating sandy plains with their height ranging from 6 to 50 meters above mean ground level. The altitudes vary from 213 to 400 meters above Mean Sea Level and the terrain in general slopes from south to north. The district falls in arid climate zone with aridity index varying from 75% to 83%. Light brown sandy soils of plains with scattered dunes occur in more than two third area of the district. These soils are sandy to loamy fine sandy, very deep, non-calcareous and well drained surface horizon, a slightly calcareous, loamy fine sandy B horizon followed by a zone of lime accumulation, partly as concretion (CAZRI, 1990).
3. Materials and Methods
3.1 Materials
Multi-temporal Landsat (WRS2: 165/39, 166/38, 166/39, and 166/40) ETM+ (dated September, 2000) and TM (dated September 1989 and 2009) imageries remotely sensed datasets were assembled and analyzed to assess the status of surface condition in the study area. The spatial resolution of one pixel of TM and ETM+ images is 30 m by 30 m. The crop acreage statistics from the year 1980 to 2007 were collected from the website of Rajasthan Krishi. Apart from these, soil sample datas have been collected from field survey for texture analysis.
3.2 Methods
15
Identifying the Process of Environmental Changes of Churu District, Rajasthan (India) Using Remote Sensing Indices
Figure 1. Study site.
16
There are several methods to extract spatial information from remotely sensed data, among them vegetation indices are one of the simplified and efficient method to obtain spatial information. Thus they have been popularly used in various studies.The geometrically rectified and radio-metrically calibrated Landsat TM/ETM+ bands 1, 2, 3, 4 and 5 were used to derive the indices. In this research, two methods were used to retrieve class boundary, namely, supervised classification (a maximum-likelihood classification (MLC)) and indices. The three indices covered in this study were tested for surface changes; Normalized Difference Vegetation Index (NDVI), Normalized Difference Water Index (NDWI) and Normalized Difference Salinity Index (NDSI) were calculated on the basis of the following equations, respectively:
Normalized Difference Vegetation Index (NDVI)
Chlorophyll has a strong spectral absorption in the infrared region of electromagnetic spectrum and thus it has been useful for providing information on vegetation health. The NDVI is basically the difference between reflectance of red and near-infrared band combination divided by the sum of the red and near-infrared band combination. It is expressed as follows:
NDVI = (NIR − R) / (NIR + R)
Where, R and NIR are the red and near-infrared bands.
Normalized Difference Water Index (NDWI)
Gao (1996) pointed out that the NDWI calculated with 860 and 1240 nm ((R860−R1240) / (R860+R1240)) showed the potential to estimate canopy-level water content.
NDWI = (band 4 − band5) / (band 4 + band5)
where band4 and band5 represent the spectral bands of the Landsat TM/ETM+ images.
Normalized Difference Salinity Index (NDSI)
The spectral radiance of salt affected areas is much higher in band 1 and band 3 of Landsat images than other bands. So the difference between band 3 and band 4 is that Near Infrared band can retrieve the information about salt proportion from an image.
NDSI = (band 3 – band 4) / (band 3 + band 4)
The aforesaid indices were applied in the Landsat TM/ETM+ images of 1989 and 2009 and the resulted multi-temporal images of NDVI, NDWI and NDSI were used for change detection.
Asian Journal of Geoinformatics, Vol.14,No.3 (2014)
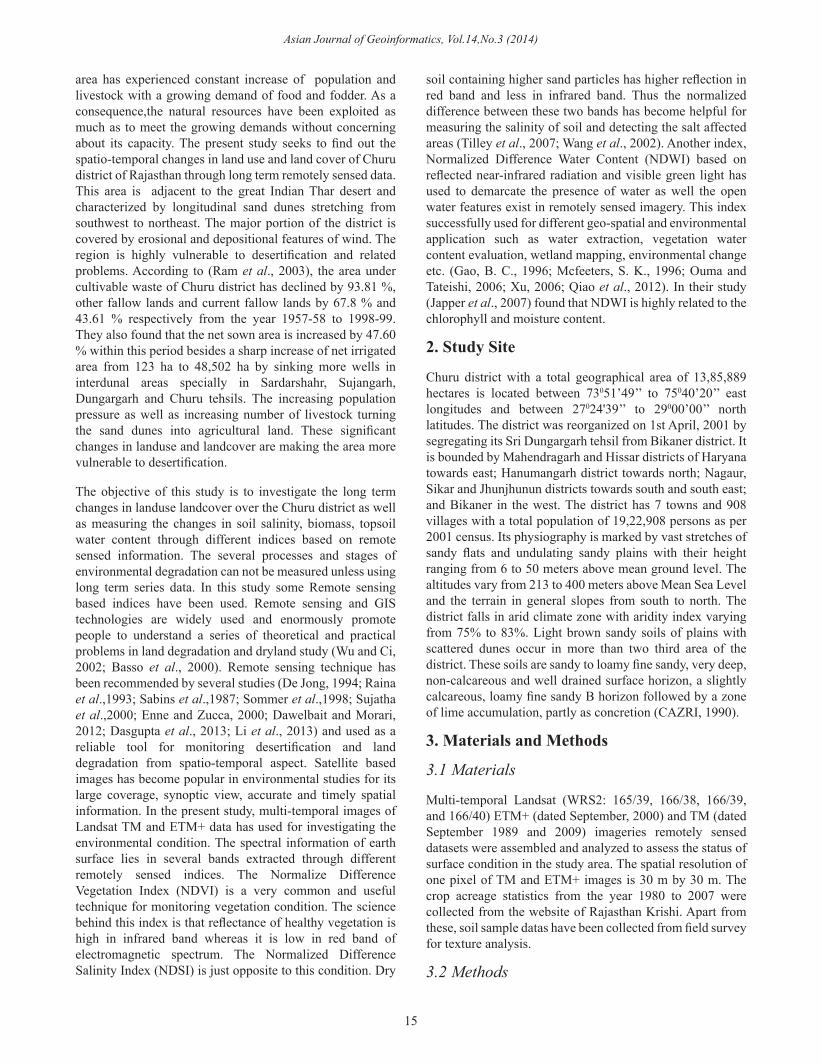
Figure 2. Spatio-temporal Pattern of NDVI.
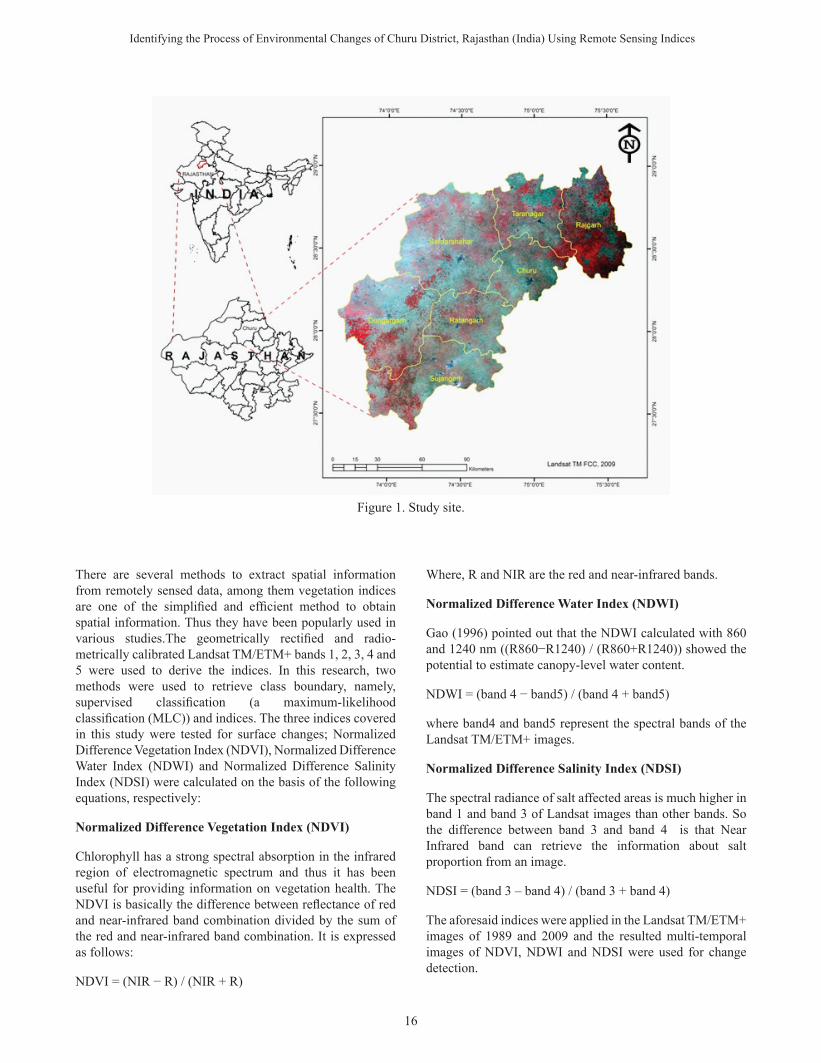
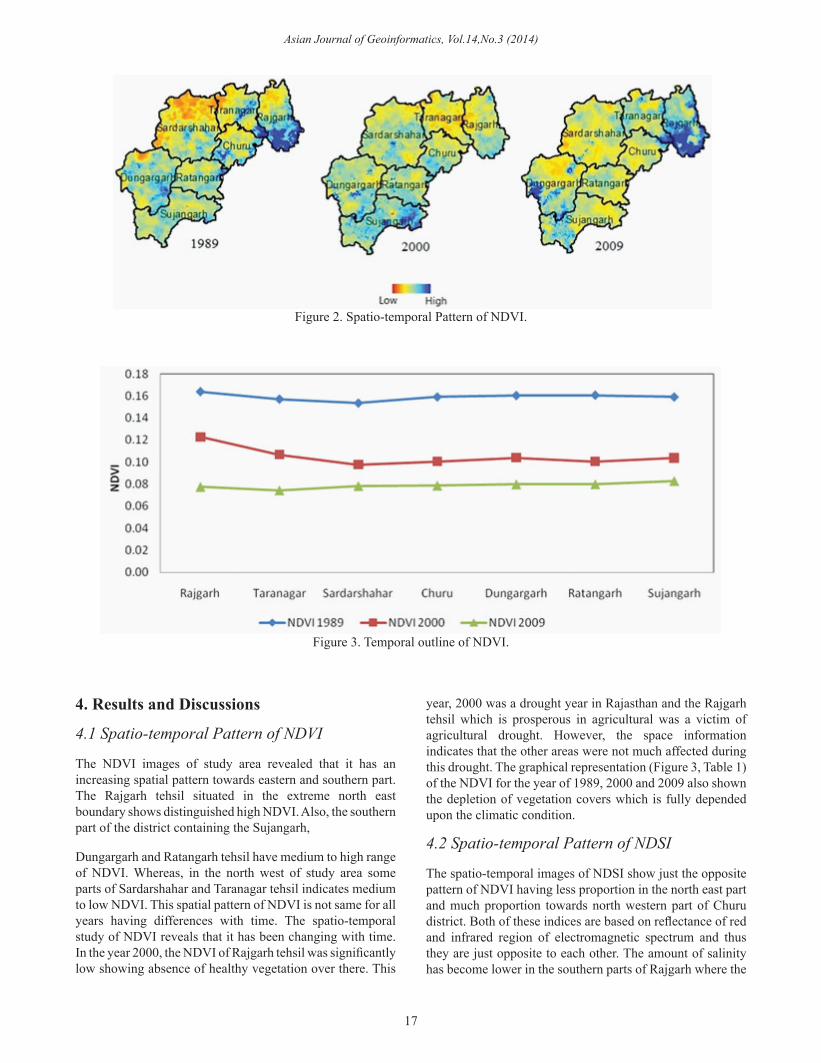
Figure 3. Temporal outline of NDVI.
17
4. Results and Discussions
4.1 Spatio-temporal Pattern of NDVI
The NDVI images of study area revealed that it has an increasing spatial pattern towards eastern and southern part. The Rajgarh tehsil situated in the extreme north east boundary shows distinguished high NDVI. Also, the southern part of the district containing the Sujangarh,
Dungargarh and Ratangarh tehsil have medium to high range of NDVI. Whereas, in the north west of study area some parts of Sardarshahar and Taranagar tehsil indicates medium to low NDVI. This spatial pattern of NDVI is not same for all years having differences with time. The spatio-temporal study of NDVI reveals that it has been changing with time. In the year 2000, the NDVI of Rajgarh tehsil was significantly low showing absence of healthy vegetation over there. This
year, 2000 was a drought year in Rajasthan and the Rajgarh tehsil which is prosperous in agricultural was a victim of agricultural drought. However, the space information indicates that the other areas were not much affected during this drought. The graphical representation (Figure 3, Table 1) of the NDVI for the year of 1989, 2000 and 2009 also shown the depletion of vegetation covers which is fully depended upon the climatic condition.
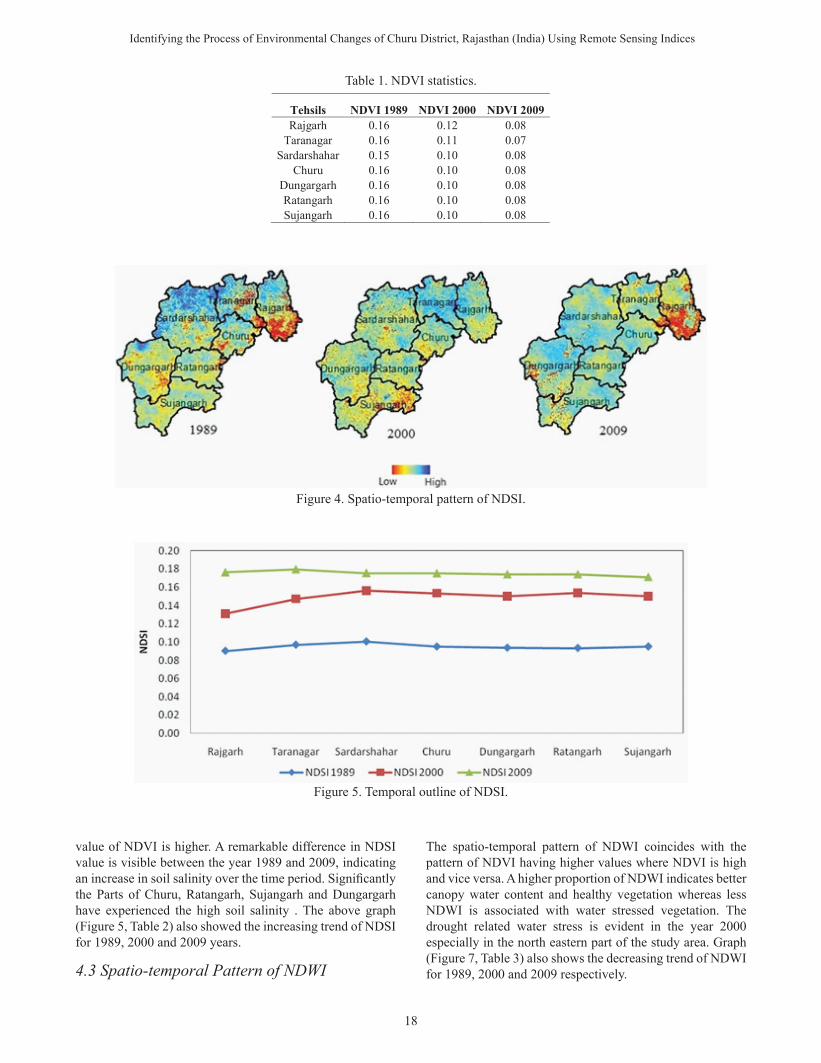
4.2 Spatio-temporal Pattern of NDSI
The spatio-temporal images of NDSI show just the opposite pattern of NDVI having less proportion in the north east part and much proportion towards north western part of Churu district. Both of these indices are based on reflectance of red and infrared region of electromagnetic spectrum and thus they are just opposite to each other. The amount of salinity has become lower in the southern parts of Rajgarh where the
Identifying the Process of Environmental Changes of Churu District, Rajasthan (India) Using Remote Sensing Indices
Table 1. NDVI statistics.
Figure 4. Spatio-temporal pattern of NDSI.
Figure 5. Temporal outline of NDSI.
18
5
agricultural was a victim of agricultural drought. However, the space information indicates that the other areas were not much affected during this drought. The graphical representation (fig. 3, table 1) of the NDVI for the year of 1989, 2000 and 2009 also shown the depletion of vegetation covers which is fully depended upon the climatic condition.
4.2 Spatio-temporal pattern of NDSI The spatio-temporal images of NDSI show just the opposite pattern of NDVI having less proportion in the north east part and much proportion towards north western part of Churu district. Both of these indices are based on reflectance of red and infrared region of electromagnetic spectrum and
PLS. INSERT FIG. 4
PLS. INSERT FIG. 5
thus they are just opposite to each other. The amount of salinity has become lower in the southern parts of Rajgarh where the value of NDVI is higher. A remarkable difference in NDSI value is visible between the year 1989 and 2009, indicating an increase in soil salinity over the time period. Significantly the Parts of Churu, Ratangarh, Sujangarh and Dungargarh have experienced the high soil salinity . The above graph (fig. 5, table 2) also showed the increasing trend of NDSI for 1989, 2000 and 2009 years.
value of NDVI is higher. A remarkable difference in NDSI value is visible between the year 1989 and 2009, indicating an increase in soil salinity over the time period. Significantly the Parts of Churu, Ratangarh, Sujangarh and Dungargarh have experienced the high soil salinity . The above graph (Figure 5, Table 2) also showed the increasing trend of NDSI for 1989, 2000 and 2009 years.
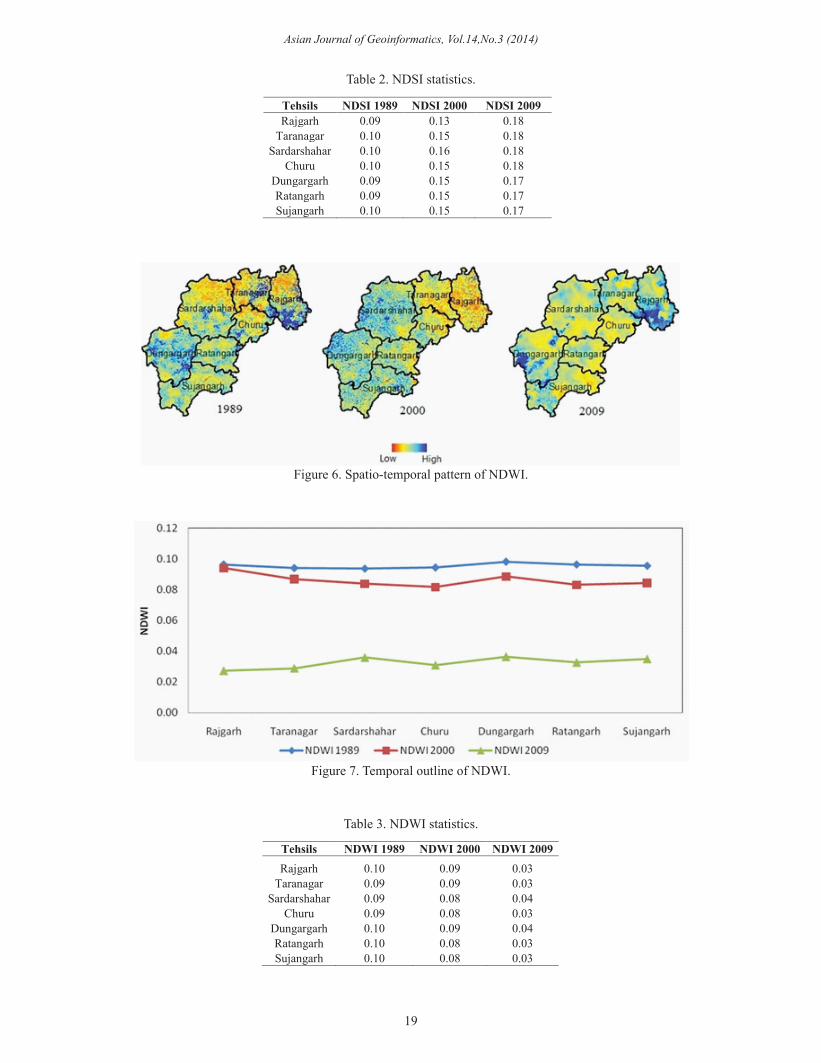
4.3 Spatio-temporal Pattern of NDWI
The spatio-temporal pattern of NDWI coincides with the pattern of NDVI having higher values where NDVI is high and vice versa. A higher proportion of NDWI indicates better canopy water content and healthy vegetation whereas less NDWI is associated with water stressed vegetation. The drought related water stress is evident in the year 2000 especially in the north eastern part of the study area. Graph (Figure 7, Table 3) also shows the decreasing trend of NDWI for 1989, 2000 and 2009 respectively.
Asian Journal of Geoinformatics, Vol.14,No.3 (2014)
Figure 6. Spatio-temporal pattern of NDWI.
Table 2. NDSI statistics.
5
agricultural was a victim of agricultural drought. However, the space information indicates that the other areas were not much affected during this drought. The graphical representation (fig. 3, table 1) of the NDVI for the year of 1989, 2000 and 2009 also shown the depletion of vegetation covers which is fully depended upon the climatic condition.
4.2 Spatio-temporal pattern of NDSI The spatio-temporal images of NDSI show just the opposite pattern of NDVI having less proportion in the north east part and much proportion towards north western part of Churu district. Both of these indices are based on reflectance of red and infrared region of electromagnetic spectrum and
PLS. INSERT FIG. 4
PLS. INSERT FIG. 5
thus they are just opposite to each other. The amount of salinity has become lower in the southern parts of Rajgarh where the value of NDVI is higher. A remarkable difference in NDSI value is visible between the year 1989 and 2009, indicating an increase in soil salinity over the time period. Significantly the Parts of Churu, Ratangarh, Sujangarh and Dungargarh have experienced the high soil salinity . The above graph (fig. 5, table 2) also showed the increasing trend of NDSI for 1989, 2000 and 2009 years.
PLS. INSERT FIG. 7 The spatio-temporal pattern of NDWI coincides with the pattern of NDVI having higher values where NDVI is high and vice versa. A higher proportion of NDWI indicates better canopy water content and healthy vegetation whereas less NDWI is associated with water stressed vegetation. The drought related water stress is evident in the year 2000 especially in the north eastern part of the study area. Graph (fig. 7, table 3) also shows the decreasing trend of NDWI for 1989, 2000 and 2009 respectively.
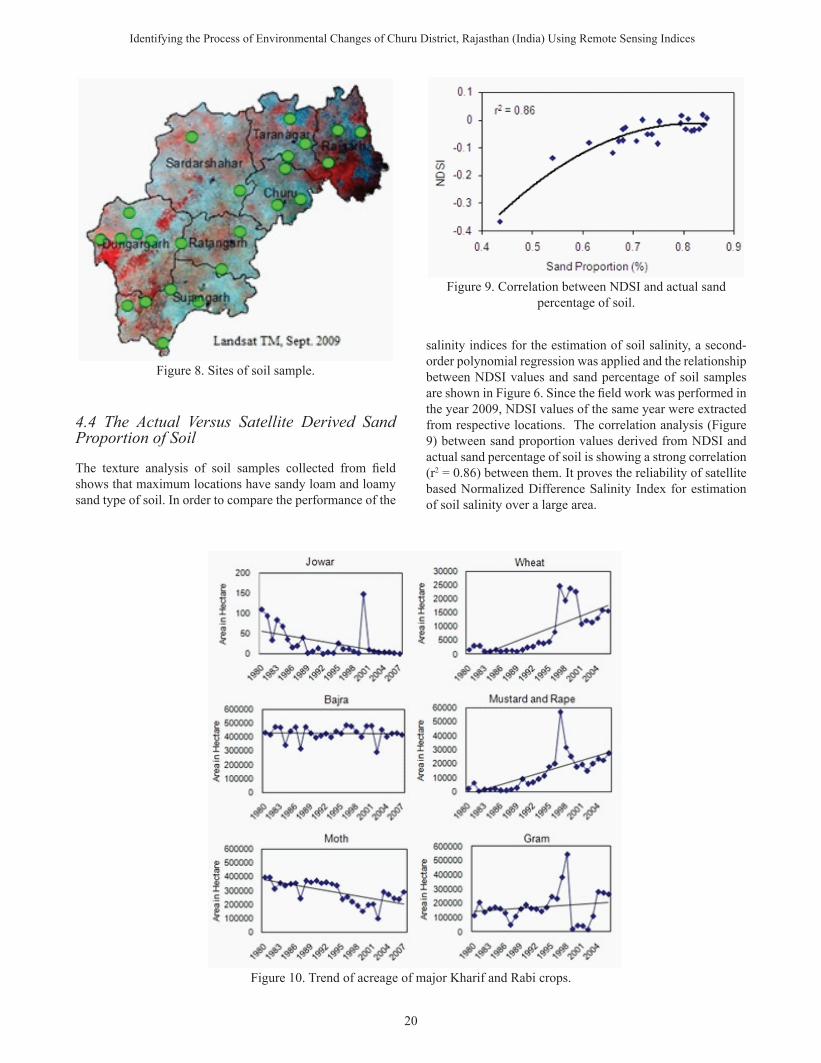
4.4 The actual versus satellite derived sand proportion of soil The texture analysis of soil samples collected from field shows that maximum locations have sandy loam and loamy sand type of soil. In order to compare the performance of the salinity indices for the estimation of soil salinity, a second-order polynomial regression was applied
PLS. INSERT FIG. 8
and the relationship between NDSI values and sand percentage of soil samples are shown in figure 6. Since the field work was performed in the year 2009, NDSI values of the same year were extracted from respective locations. The correlation analysis (fig. 9) between sand proportion values derived from NDSI and actual sand percentage of soil is showing a strong correlation (r2 = 0.86) between them. It proves the reliability of satellite based Normalized Difference Salinity Index for estimation of soil salinity over a large area.
PLS. INSERT FIG. 9
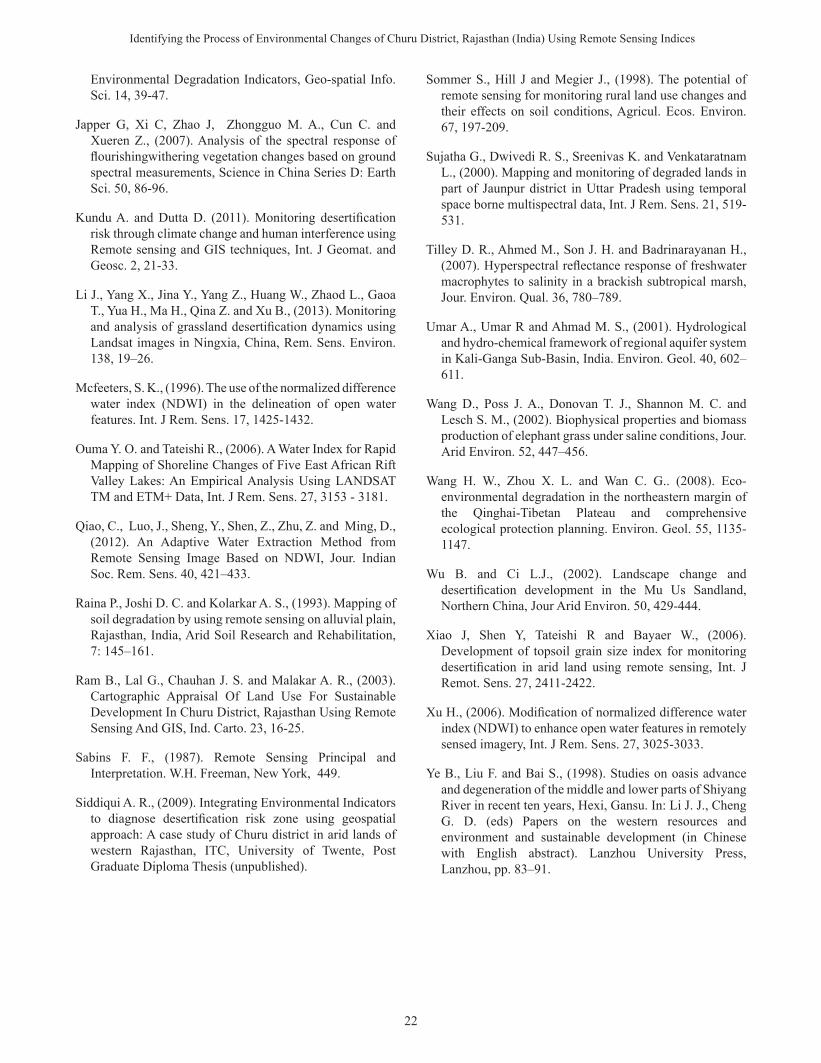
4.5 Acreage of major Kharif and Rabi crops The following graphs showing the acreage of three major kharif and three major rabi crop of Churu district. A negative trend in acreage of Kharif crops especially in case of jowar and moth
19
Identifying the Process of Environmental Changes of Churu District, Rajasthan (India) Using Remote Sensing Indices
Figure 8. Sites of soil sample.
Figure 10. Trend of acreage of major Kharif and Rabi crops.
20
4.4 The Actual Versus Satellite Derived Sand Proportion of Soil
The texture analysis of soil samples collected from field shows that maximum locations have sandy loam and loamy sand type of soil. In order to compare the performance of the
Figure 9. Correlation between NDSI and actual sand percentage of soil.
salinity indices for the estimation of soil salinity, a second-order polynomial regression was applied and the relationship between NDSI values and sand percentage of soil samples are shown in Figure 6. Since the field work was performed in the year 2009, NDSI values of the same year were extracted from respective locations. The correlation analysis (Figure 9) between sand proportion values derived from NDSI and actual sand percentage of soil is showing a strong correlation (r2 = 0.86) between them. It proves the reliability of satellite based Normalized Difference Salinity Index for estimation of soil salinity over a large area.
Asian Journal of Geoinformatics, Vol.14,No.3 (2014)
References
Basso F., Bove E., Dumontet S., Ferrara A., Pisante M., Quaranta G. and Taberner M., (2000). Evaluating environmental sensitivity at the basin scale through the use of geographic information systems and remotely sensed data: an example covering the Agri basin (Southern Italy), Catena. 40, 19- 35.
CAZRI (1990). Report on Land use/land cover, Churu district, Rajasthan, CAZRI, Jodhpur, 26.
Chen L and Qu Y, (1992). Water and land resources and their rational utilization and development in the Hexi region, Science Press, Beijing, 143–176.
Dasgupta A., Sastry K. L. N., Dhinwa P. S., Rathore V. S. and Nathawat M. S., 2013. Identifying desertification risk areas using fuzzy membership and geospatial technique –A case study, Kota District, Rajasthan, Jour. Earth Sys. Sc. 122, 1107–1124.
Dawelbait M. and Morari F., (2012). Monitoring desertification in a Savannah region in Sudan using Landsat images and spectral mixture analysis, Jour. Arid Environ. 80, 45-55.
De Jong, S. M., (1994). Derivation of Vegetative Variables from a Landsat TM Image for Modeling Soil-Erosion. Earth Sur Proc and Landfo. 19, 165–178.
Enne G. and Zucca C., (2000). Desertification indicators for the European Mediterranean region. State of the art and possible methodological approaches. ANPA, Rome. pp.121.
Gao B. C., (1996). NDWI - A normalized difference water index for remote sensing of vegetation liquid water from space, Rem. Sens. Environ. 58, 257-266.
Hadeel A. S., Jabbar M. T. and Xiaoling C., (2011). Remote Sensing and GIS Application in the Detection of
21
4.5 Acreage of major Kharif and Rabi crops
The following graphs showing the acreage of three major kharif and three major rabi crop of Churu district. A negative trend in acreage of Kharif crops especially in case of jowar and moth is observed from the crop area statistics. The acreage of jowar was 110 hectare in the year 1980 whereas it has shrinked to less than one hectare in the year 2007. Except moong and ground nut, other kharif crops, i.e. guar, moth, bazra have experienced a decreasing trend in acreage. On the other hand the Rabi crops especially wheat, mustard, gram and barley have an increasing acreage within this period. In the year 1980, about 1707 hectare of Churu was under wheat crop in rabi season which turns into a massive figure of 15743 hectare in the year 2006. Similarly the acreage of mustard and rape seed was 2186 hectare in the year 1980 while the acreage of this crop was 27545 hectare in the year 2006. The district, Churu has experienced a drastic change in acreage of major kharif and rabi crops within a comparatively short period.
While investigating the reason behind the increasing proportion of soil salinity over the study area, we found an abrupt increase in acreage of rabi crops which is one of the major cause for this incidence. The acreage of rabi crops increased in manifold indicating a massive usage of irrigated water that is transforming the barren lands under cultivation. The net irrigated area has increased from just 123 ha to 48,502 ha during the period 1956 to 2002 by sinking more wells in interdunal areas in Sardarshahr, Sujangarh, Dungargarh and Churu tehsils (Ram et al., 2003). According to his study (Ram et al., 2003) only 404 sq km area of the district has been estimated as ground water potential zone which is already over drafted. This indiscriminate use of ground water causes intense pressure upon the ecosystem of the area. Apart from this, turning the sand dunes into cultivable land by paying off the balance of ecosystem has been making the area vulnerable to wind hazards. The over use of ground water along with unscientific agricultural practices are resulting the accumulation of salts near the surface.
5.Conclusions
This study clearly reveals the utility of satellite remote sensing data for delineation and monitoring of salt affected areas. Landsat TM/ETM+ data has successfully been used for the identification of the condition of vegetation, salinity and canopy water content of Churu district. Multi-temporal landsat TM/ETM+ images have the potential to study and analyze the long term changes in landuse and landcover of an area. Based on the long term satellite images and crop area statistics of Churu district it can be concluded that intensified cultivation, overgrazing, overdraft of ground water along with improper landuse are making the area vulnerable to Aeolian hazard. The area needs an immediate landuse plan for preserving the arid ecosystem. Otherwise the area would experience an adverse environmental impact
in terms of desertification and frequent occurrence of drought.
Acknowledgements
The authors would like to thank the Global Land Cover Facility (GLCF) and USGS Global Visualization Viewer for providing quality satellite imageries without which the study would never been possible. We also acknowledge our truthful gratitude to Indian Institute of Remote Sensing, Dehradun for providing us the laboratory facility for testing soil sample data to accomplish this paper.
Identifying the Process of Environmental Changes of Churu District, Rajasthan (India) Using Remote Sensing Indices
Japper G, Xi C, Zhao J, Zhongguo M. A., Cun C. and Xueren Z., (2007). Analysis of the spectral response of flourishingwithering vegetation changes based on ground spectral measurements, Science in China Series D: Earth Sci. 50, 86-96.
Kundu A. and Dutta D. (2011). Monitoring desertification risk through climate change and human interference using Remote sensing and GIS techniques, Int. J Geomat. and Geosc. 2, 21-33.
Li J., Yang X., Jina Y., Yang Z., Huang W., Zhaod L., Gaoa T., Yua H., Ma H., Qina Z. and Xu B., (2013). Monitoring and analysis of grassland desertification dynamics using Landsat images in Ningxia, China, Rem. Sens. Environ. 138, 19–26.
Mcfeeters, S. K., (1996). The use of the normalized difference water index (NDWI) in the delineation of open water features. Int. J Rem. Sens. 17, 1425-1432.
Ouma Y. O. and Tateishi R., (2006). A Water Index for Rapid Mapping of Shoreline Changes of Five East African Rift Valley Lakes: An Empirical Analysis Using LANDSAT TM and ETM+ Data, Int. J Rem. Sens. 27, 3153 - 3181.
Qiao, C., Luo, J., Sheng, Y., Shen, Z., Zhu, Z. and Ming, D., (2012). An Adaptive Water Extraction Method from Remote Sensing Image Based on NDWI, Jour. Indian Soc. Rem. Sens. 40, 421–433.
Raina P., Joshi D. C. and Kolarkar A. S., (1993). Mapping of soil degradation by using remote sensing on alluvial plain, Rajasthan, India, Arid Soil Research and Rehabilitation, 7: 145–161.
Ram B., Lal G., Chauhan J. S. and Malakar A. R., (2003). Cartographic Appraisal Of Land Use For Sustainable Development In Churu District, Rajasthan Using Remote Sensing And GIS, Ind. Carto. 23, 16-25.
Sabins F. F., (1987). Remote Sensing Principal and Interpretation. W.H. Freeman, New York, 449.
Siddiqui A. R., (2009). Integrating Environmental Indicators to diagnose desertification risk zone using geospatial approach: A case study of Churu district in arid lands of western Rajasthan, ITC, University of Twente, Post Graduate Diploma Thesis (unpublished).
Sommer S., Hill J and Megier J., (1998). The potential of remote sensing for monitoring rural land use changes and their effects on soil conditions, Agricul. Ecos. Environ. 67, 197-209.
Sujatha G., Dwivedi R. S., Sreenivas K. and Venkataratnam L., (2000). Mapping and monitoring of degraded lands in part of Jaunpur district in Uttar Pradesh using temporal space borne multispectral data, Int. J Rem. Sens. 21, 519-531.
Tilley D. R., Ahmed M., Son J. H. and Badrinarayanan H., (2007). Hyperspectral reflectance response of freshwater macrophytes to salinity in a brackish subtropical marsh, Jour. Environ. Qual. 36, 780–789.
Umar A., Umar R and Ahmad M. S., (2001). Hydrological and hydro-chemical framework of regional aquifer system in Kali-Ganga Sub-Basin, India. Environ. Geol. 40, 602–611.
Wang D., Poss J. A., Donovan T. J., Shannon M. C. and Lesch S. M., (2002). Biophysical properties and biomass production of elephant grass under saline conditions, Jour. Arid Environ. 52, 447–456.
Wang H. W., Zhou X. L. and Wan C. G.. (2008). Eco-environmental degradation in the northeastern margin of the Qinghai-Tibetan Plateau and comprehensive ecological protection planning. Environ. Geol. 55, 1135-1147.
Wu B. and Ci L.J., (2002). Landscape change and desertification development in the Mu Us Sandland, Northern China, Jour Arid Environ. 50, 429-444.
Xiao J, Shen Y, Tateishi R and Bayaer W., (2006). Development of topsoil grain size index for monitoring desertification in arid land using remote sensing, Int. J Remot. Sens. 27, 2411-2422.
Xu H., (2006). Modification of normalized difference water index (NDWI) to enhance open water features in remotely sensed imagery, Int. J Rem. Sens. 27, 3025-3033.
Ye B., Liu F. and Bai S., (1998). Studies on oasis advance and degeneration of the middle and lower parts of Shiyang River in recent ten years, Hexi, Gansu. In: Li J. J., Cheng G. D. (eds) Papers on the western resources and environment and sustainable development (in Chinese with English abstract). Lanzhou University Press, Lanzhou, pp. 83–91.