Abstract— The case study company was established in 2001. A needs analysis was conducted at the company and a high scrap rate was identified. The company made a financial loss of about R400 000 in 2013 and also in 2014 due to scrap. The company still faces a high scrap rate in spite of the quality management system in place.
Defects are still prevalent in the manufacturing industry despite the attempts by companies to implement measures to eliminate them. A contributing factor to defects is the absence or poor utilisation of a quality management system. Measuring the effects of these defects on productivity and their contribution to losses in monetary value is likely to assist the company to use the tools in the quality management system to eliminate the root causes of these defects.
An investigation into the root causes was conducted using a root cause analysis technique. Pareto analysis, Fishbone diagram and 5 Whys were some of the tools used to uncover the root causes of defects leading to scrap. The identified recurring defects were analysed to eliminate their root causes.
Keywords— Quality management, Quality control, Production, Manufacturing, Root Cause Analysis.
I. INTRODUCTION
Defects are still prevalent in the manufacturing industry despite the attempts by companies to implement measures to eliminate them. A contributing factor to defects is the absence or poor utilisation of a quality management system. Measuring the effects of these defects on productivity and their contribution to losses in monetary value is likely to assist the company to use the tools in the quality management system to eliminate the root causes of these defects. Once the failures are identified, it is best to learn from them and avoid the recurrence using continuous improvement techniques.
The case study company was established in 2001. The company conforms to all legal requirements as per the laws of the country and is one of a handful of foundries that are registered in terms of the Atmospheric Pollution Prevention Act of 1995 (Act 45 of 1965). In June 2004, the company obtained ISO 9001:2000 quality accreditation and it was re-certified in 2010 to ISO 9001:2008. The company exports some of its products to Europe and the Middle East.
The company uses the investment casting process to manufacture its products using aluminium, ductile iron, copper, stainless steel and other ferrous and non-ferrous metals. The metal is melted by using gas-fired and induction furnaces.
The company manufactures castings for the aerospace and defence, automotive, mining, and medical industries. Some of their products include components for military vehicles, field guns, missiles, automatic weapons, rockets, safety equipment, automotive products and general engineering.
The company is a job shop production plant meaning that they only make to order (MTO). The challenge the company faces is a high level of scrap despite having a quality management system in place. In 2013 and also in 2014, about R400 000 worth of products were scrapped annually due to quality defects. Sometimes the production line produces 10% more to compensate for scrap, resulting in overproduction. According to lean manufacturing principles, overproduction is one of the seven wastes [1]. Therefore, the root causes for defects need to be eliminated to reduce overproduction and thereby reduce waste.
The defects affect the quality of castings which sometimes leads to customer dissatisfaction. The defects also affect the lead time because of re-work that has to be done and thereby causing delays. The company sends out customer satisfaction surveys to all its customers. The customer surveys are analysed and the quality of products and lead time are identified to be one of the leading complaints from customers.
The aim of the project was to reduce scrap by identifying the root causes contributing to defects.
Proceedings of the 2016 International Conference on Industrial Engineering and Operations Management Kuala Lumpur, Malaysia, March 8-10, 2016
II. MATERIAL AND METHODS
Direct observations were conducted; quality documents and process interaction sheets were studied to understand the process and procedures. The defects data were obtained from the quality control documents for the year 2014. Non-Conformance Reports (NCR) were also studied to understand some of the customer complaints. This exercise was done to identify the most common complaints and the action taken by the company thereafter.
In order to address this issue, a Root Cause Analysis was performed. The RCA follows five simple steps being:
• Define the Non-Conformity
• Investigate the Root cause
• Create proposed action plan and timescales
• Implement proposed action
• Verification & monitoring of effectiveness
RCA is complemented with other problem solving tools. For this study the tools used include a Pareto Analysis, a Fishbone diagram, and the 5 Whys.
After establishing the possible causes, we ask 5 Whys. The 5 Whys are asked until meaningful conclusion is reached. This method is used for the three defects identified to have a high significance in financial losses.
The financial value of the scrap per month was analysed. A Pareto analysis (or ABC analysis) was performed to identify the most significant causes of scrap. The following steps were followed in performing the Pareto analysis:
• A method for classifying the data was determined and in this case the number of products scrapped for differentdefects was used.
• The next step was to choose a unit of measure. For this study two units of measure were used. These are the costof scrap per defect type and the frequency of occurrence of the defect type. Two separate Pareto analyses weredone based on these two measures so that results could be compared.
• Data were then gathered for an appropriate time period which, in this case, was the whole of 2014. The datawere then summarised by ranking the items in descending order according to the two selected measures in Step 2.
• The total cost was then calculated as well as the total number of occurrences in the second case.
• The percentage for each scrap defect was then calculated.
• A bar graph showing the percentage of each item was finally constructed for the two cases.
After this the results of the Pareto analysis were interpreted and the most significant defects were identified. Other techniques for root cause analysis were then employed in order to fully understand why the problems occur and to give recommendations to address them.
III. THEORETICAL FRAMEWORK
Kaizen is a Japanese term for continuous improvement which emphasises that all employees in an organisation participate in improvement and that they perform their tasks a little better each day [2].
The problem solving and improvement process has a number of steps in which various methods and tools are used to better understand the problem and to determine the best solutions. The steps include:
• Identifying the problem
• Describing the current and revised processes
• Generating ideas for process improvement
• Achieving consensus among team members
• Evaluating and monitoring results
In Pareto analysis, items of interest are identified and measured on a common scale and then are ordered in descendingorder, as a cumulative distribution [3]. This technique is sometimes referred to as the 80-20 rule. Typically 20 percent of the ranked items account for 80 percent or more of the total activity. For example, 20 percent of mistakes account for 80 percent of
Proceedings of the 2016 International Conference on Industrial Engineering and Operations Management Kuala Lumpur, Malaysia, March 8-10, 2016
defects, 20 percent of defects account for 80 percent of financial losses. The greatest effort is concentrated on the few jobs that produce most of the problems.
It allows the separation of the significant few from the trivial many so that efforts and resources are used in the best possible way and the biggest gains are attained.
Root Cause Analysis (RCA) is a method that is used to address a problem or non-conformance, in order to identify the “root cause” of the problem [4]. It is used to correct or eliminate the cause, and prevent the problem from recurring.
Root cause analysis requires the investigator to look beyond the solution to the immediate problem and understand the fundamental or underlying causes of the situation and correct them, thereby preventing re-occurrence of the same issue. This may involve the identification and management of processes, procedures, activities, inactivity, behaviours or conditions.
The 5 Whys method of Root Cause Analysis requires questioning how the sequential causes of a failure event arose and identifying the cause-effect failure path [5]. ‘Why’ is asked to find each preceding trigger until the root cause of the incident is identified. The 5 Whys method helps to determine the cause-effect relationship in a problem or a failure event.
The 5 Whys method uses a Why table to sequentially list the questions and their answers. It can start with a statement of the situation and ask why it occurred. Then the answer to the first question can be turned into a second Why question and so on [6].
The fish bone diagram, sometimes referred to as the cause-and-effect diagram or Ishikawa diagram, was developed by Professor Kaoru Ishikawa in the 1960’s. It was originally developed as a quality control tool but it can be used as a problem solving technique or a brainstorming tool. It is a very useful tool for identifying root causes [1].
IV. RESULTS AND DISCUSSION
A. Defining the Non-confirmity In order to fully understand the results of this section a table showing the recurring defects and their definitions was
developed. The identified recurring defects are as shown in Table I together with the possible causes for each defect. Table I: Recurring defects and their definitions
Defect Name Definition
Dull run Metal not full in the mould
Mould not patched causing leakage
Mould not fired Mould not heated enough in the oven
Ceramic inclusions Ceramic stuck on metal during pouring
Metal dirt left during melting
Ceramic getting inside mould during handling
Slag Not dipped correctly
First dip peel Not dipped correctly
Broken mould Broken during knock out (ceramic removal)
Proceedings of the 2016 International Conference on Industrial Engineering and Operations Management Kuala Lumpur, Malaysia, March 8-10, 2016
Defect Name Definition
Slurry too heavy
Metal penetration Metal penetrating through the mould
Metal in bore/slot Mould not dry outside or inside causing leakage
Shell too hard Ceramic/ mould too hard
Rough surface Metal not mixed correctly with chemicals
Wrong material Using wrong material for casting
Dimensional Wrong dimensions of a die
Over produced Items produced when they were already available
Shrink Feed metal not available to compensate for shrinkage as the metal solidifies
Gas Solid form of the material cannot hold large amounts of dissolved gas
If the air could not escape it then forms bubbles
Cracked Might crack during metal pouring
Metallurgical Chemical mixing not balanced or other metallurgical characteristics
Faulty wax Wrong wax from the factory
Broken ceramic core Mould broken
Broken ingate Wax breaking during dipping
Based on defect data for the year 2014, a Pareto Analysis was carried out and the results are as shown in Table II. The table shows that the Dull Run defect is the highest in terms of occurrence. Based on the definition of the Dull Run defect, which is metal not full in the mould and mould not patched causing leakage, it means that a lot of moulds are not fully filled with metal and a lot of them have leakage. A total of 661 defects are caused by Ceramic Inclusions defect. Ceramic Inclusions occur when foreign articles are stuck inside the mould, indicating that the mould was not properly cleaned. The lowest occurring defect is Bent or damaged, contributing a total of 2 out of a total of 2505 defects.
Table II : Pareto Analysis for defects (Frequency of Occurrence)
Reason for Scrap Total Percentage Cumulative percentage
Proceedings of the 2016 International Conference on Industrial Engineering and Operations Management Kuala Lumpur, Malaysia, March 8-10, 2016
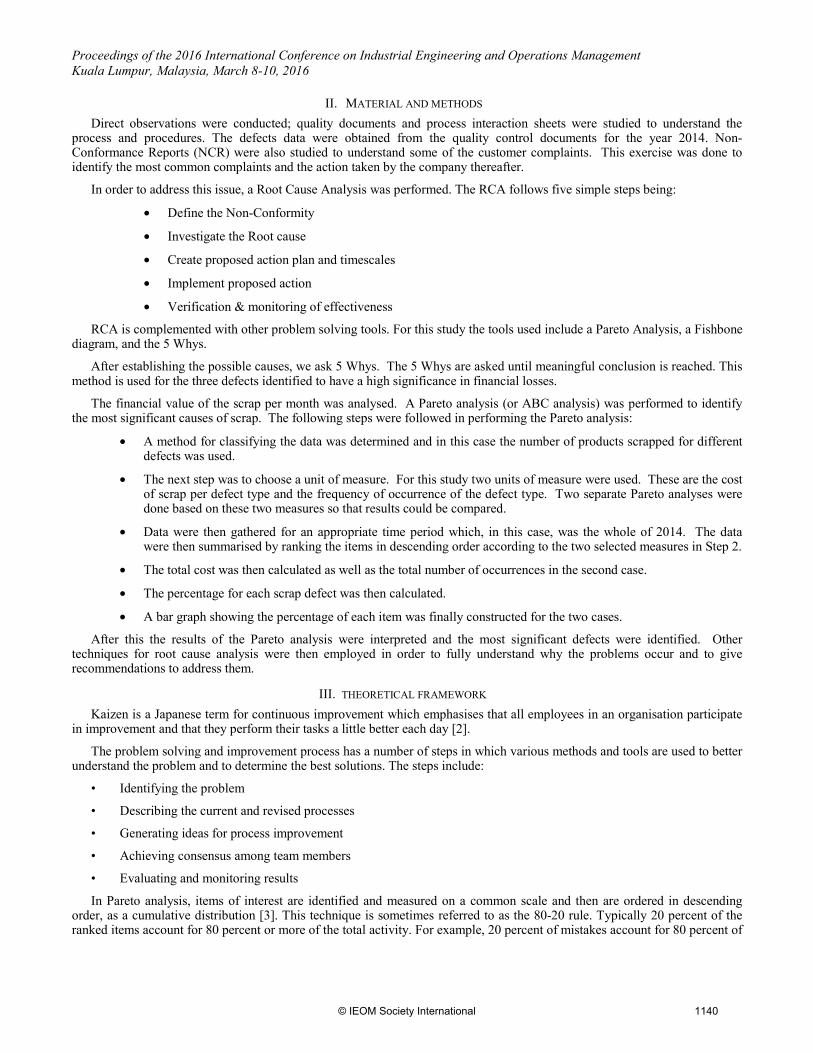
The results from the table were then plotted onto a graph in order to visualise the significant few from the trivial many. The main types of defects were identified using the Pareto Analysis. Figure 1 shows the company’s main causes of scrap based on frequency of occurrence.
Figure 1: Pareto Analysis based on Frequency of Occurrence
The figure shows that the three dominant defects in this case are:
• Dull Run
• Ceramic Inclusion
• Shrink
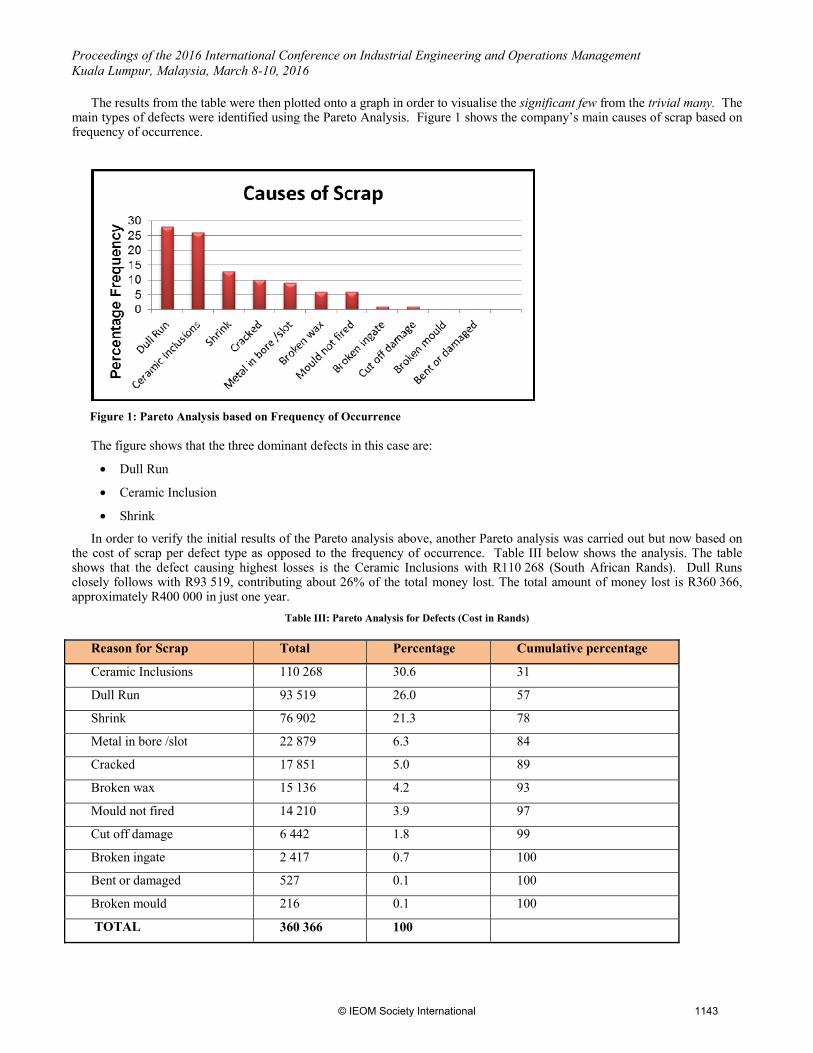
In order to verify the initial results of the Pareto analysis above, another Pareto analysis was carried out but now based on the cost of scrap per defect type as opposed to the frequency of occurrence. Table III below shows the analysis. The table shows that the defect causing highest losses is the Ceramic Inclusions with R110 268 (South African Rands). Dull Runs closely follows with R93 519, contributing about 26% of the total money lost. The total amount of money lost is R360 366, approximately R400 000 in just one year.
Table III: Pareto Analysis for Defects (Cost in Rands)
Reason for Scrap Total Percentage Cumulative percentage
Proceedings of the 2016 International Conference on Industrial Engineering and Operations Management Kuala Lumpur, Malaysia, March 8-10, 2016
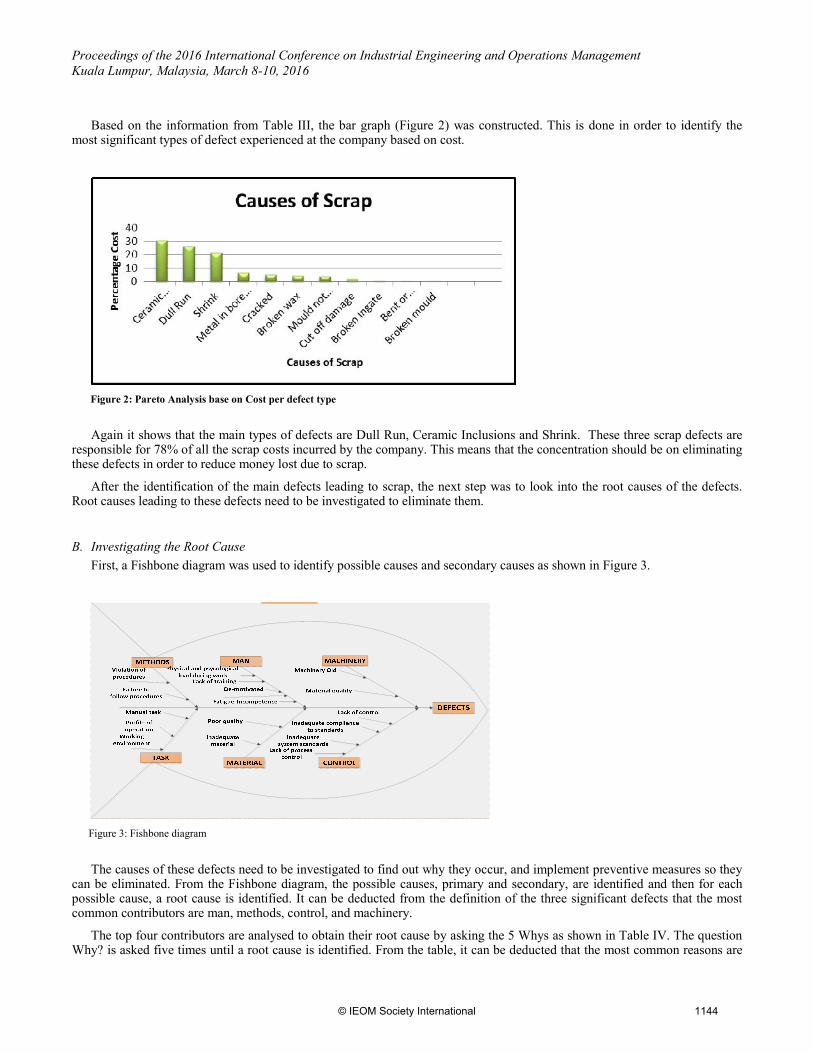
Based on the information from Table III, the bar graph (Figure 2) was constructed. This is done in order to identify the most significant types of defect experienced at the company based on cost.
Figure 2: Pareto Analysis base on Cost per defect type
Again it shows that the main types of defects are Dull Run, Ceramic Inclusions and Shrink. These three scrap defects are responsible for 78% of all the scrap costs incurred by the company. This means that the concentration should be on eliminating these defects in order to reduce money lost due to scrap.
After the identification of the main defects leading to scrap, the next step was to look into the root causes of the defects. Root causes leading to these defects need to be investigated to eliminate them.
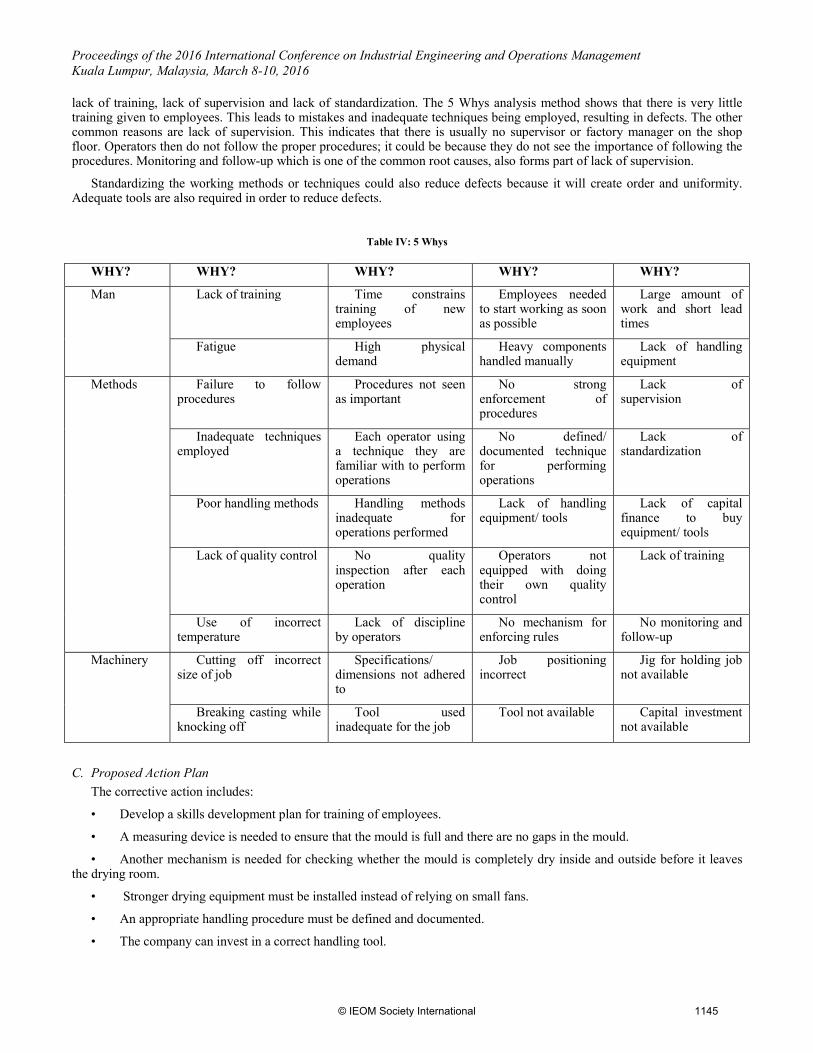
B. Investigating the Root Cause First, a Fishbone diagram was used to identify possible causes and secondary causes as shown in Figure 3.
Figure 3: Fishbone diagram
The causes of these defects need to be investigated to find out why they occur, and implement preventive measures so they can be eliminated. From the Fishbone diagram, the possible causes, primary and secondary, are identified and then for each possible cause, a root cause is identified. It can be deducted from the definition of the three significant defects that the most common contributors are man, methods, control, and machinery.
The top four contributors are analysed to obtain their root cause by asking the 5 Whys as shown in Table IV. The question Why? is asked five times until a root cause is identified. From the table, it can be deducted that the most common reasons are
Proceedings of the 2016 International Conference on Industrial Engineering and Operations Management Kuala Lumpur, Malaysia, March 8-10, 2016
lack of training, lack of supervision and lack of standardization. The 5 Whys analysis method shows that there is very little training given to employees. This leads to mistakes and inadequate techniques being employed, resulting in defects. The other common reasons are lack of supervision. This indicates that there is usually no supervisor or factory manager on the shop floor. Operators then do not follow the proper procedures; it could be because they do not see the importance of following the procedures. Monitoring and follow-up which is one of the common root causes, also forms part of lack of supervision.
Standardizing the working methods or techniques could also reduce defects because it will create order and uniformity. Adequate tools are also required in order to reduce defects.
Table IV: 5 Whys
WHY? WHY? WHY? WHY? WHY?
Man Lack of training Time constrains training of new employees
Employees needed to start working as soon as possible
Large amount of work and short lead times
Fatigue High physical demand
Heavy components handled manually
Lack of handling equipment
Methods Failure to follow procedures
Procedures not seen as important
No strong enforcement of procedures
Lack of supervision
Inadequate techniques employed
Each operator using a technique they are familiar with to perform operations
No defined/ documented technique for performing operations
Lack of standardization
Poor handling methods Handling methods inadequate for operations performed
Lack of handling equipment/ tools
Lack of capital finance to buy equipment/ tools
Lack of quality control No quality inspection after each operation
Operators not equipped with doing their own quality control
Lack of training
Use of incorrect temperature
Lack of discipline by operators
No mechanism for enforcing rules
No monitoring and follow-up
Machinery Cutting off incorrect size of job
Specifications/ dimensions not adhered to
Job positioning incorrect
Jig for holding job not available
Breaking casting while knocking off
Tool used inadequate for the job
Tool not available Capital investment not available
C. Proposed Action Plan The corrective action includes:
• Develop a skills development plan for training of employees.
• A measuring device is needed to ensure that the mould is full and there are no gaps in the mould.
• Another mechanism is needed for checking whether the mould is completely dry inside and outside before it leaves the drying room.
• Stronger drying equipment must be installed instead of relying on small fans.
• An appropriate handling procedure must be defined and documented.
• The company can invest in a correct handling tool.
Proceedings of the 2016 International Conference on Industrial Engineering and Operations Management Kuala Lumpur, Malaysia, March 8-10, 2016
• Quality control must be done by each individual. Strong quality control must be enforced.
• The metal casting department must check if the moulds are thoroughly cleaned.
V. CONCLUSIONS
This project focused on improving quality for the company by identifying the root causes of defects. The company was producing 10% more than required to compensate for scrap. In 2013 and 2014 alone, about R400 000 worth of products were scrapped. This indicated that the quality management tools that have been put in place were not being utilised. Different problem solving tools were used to investigate and analyse the root causes of defects.
Three significant defects were identified, which are Dull Run, Ceramic Inclusions and Shrink. The three defects combined contribute about R280 689 to the total losses incurred by the company due to scrap. This is about 78% of the total costs of all scrap. It was evident that in order to reduce the costs of losses, the concentration needed to be directed to these three defects.
The results showed that the most common contributors to these defects were man, methods, control and machinery. Some of the significant root causes identified were the lack of employee training, poor quality control and lack of supervision. The root causes were then analysed using the 5 Whys method. Once the root causes were analysed, a corrective action plan was developed. The plan included the responsible person and the implementation start date. Some of the implementations will highly depend on the availability of funds.
This paper showed that by utilising problem solving techniques, manufacturing companies can identify root causes to the problems. They can be able to eliminate these root causes and thereby improve quality and productivity. These improvements do not require high capital investment.
ACKNOWLEDGMENT The author would like to thank Livison Mashoko for contributing to this research.
REFERENCES
[1] J. Stevenson, Production/Operations management. 4th ed., New York: McGraw-Hill, 1999.[2] K. Ishikawa, Guide to quality control, Japan: Asian Productivity Organization, 1976.[3] F.R. Jacobs and B.R.Chase, Operations and supply management: The core, New York: McGraw Hill International Edition, 2008.[4] F.R. Jacobs, W.L. Bery, D.C. Whybark and T.E. Vollman, Manufacturing planning and control for supply chain management. 6th ed.,
New York:McGraw Hill Irwin, 2011.[5] W. Hugo, J., Badenhorst-Weiss and E.van Biljon, Supply chain management, Pretoria: Van Schaik, 2004.[6] APICS, Basics of supply chain management ,Participant Workbook, APICS CPIM, 2012.
BIOGRAPHY
Zanele Mpanza is an Industrial Engineer at the Council for Scientific and Industrial Research (CSIR). She studied Industrial Engineering at the University of Johannesburg. She is also a part time lecturer at the University of Johannesburg in the Department of Mechanical and Industrial Engineering Technology. Her research interests include supply chain management, logistics, transport, and optimization.