Ideology and Brand Consumption Supplement Romana Khan, Kanishka Misra, Vishal Singh June 27, 2011 This document is the supplement to the paper ‘Ideology and Brand Consumption’. In section 1.1, we describe the data used in the project in detail. Section 1.2 discusses the methodology and in Section 3 we provide various robustness checks to our analysis. 1 Materials and Methods 1.1 Data Description Our objective in this article is to examine whether traits associated with a conservative ide- ology such as preference for tradition and status quo, uncertainty avoidance, and skepticism to new experiences get manifested in routine purchase decisions. Our empirical strategy re- lies on relating measures of brand consumption to county level measures of conservativeness. Our analysis combines four key sources of data: (1) Retail Sales Data, (2) Religion Data, (3) Political Voting Data, and (4) Demographics. 1.1.1 Retail Sales Data The consumer packaged goods (CPG) data is an academic dataset provided by IRI (Bron- nenberg, Kruger, and Mela, 2008). It provides UPC-level weekly store sales data for 26 CPG industries across 47 U.S. markets, spanning a period of 6 years from 2001 to 2006. The categories analyzed cover a wide range of industries, including both edible (e.g. soup) and non-edible (e.g. paper towels) products. As CPG categories, the products studied are func- tional, providing personal consumption utility, with limited scope to serve as a signal of social status or make a statement about individual personality. There are 416 counties represented in the data, which cover 47% of the total US population. There are 1,860 stores from 135 1
Transcript
Ideology and Brand Consumption
Supplement
Romana Khan, Kanishka Misra, Vishal Singh
June 27, 2011
This document is the supplement to the paper ‘Ideology and Brand Consumption’. In
section 1.1, we describe the data used in the project in detail. Section 1.2 discusses the
methodology and in Section 3 we provide various robustness checks to our analysis.
1 Materials and Methods
1.1 Data Description
Our objective in this article is to examine whether traits associated with a conservative ide-
ology such as preference for tradition and status quo, uncertainty avoidance, and skepticism
to new experiences get manifested in routine purchase decisions. Our empirical strategy re-
lies on relating measures of brand consumption to county level measures of conservativeness.
Our analysis combines four key sources of data: (1) Retail Sales Data, (2) Religion Data, (3)
Political Voting Data, and (4) Demographics.
1.1.1 Retail Sales Data
The consumer packaged goods (CPG) data is an academic dataset provided by IRI (Bron-
nenberg, Kruger, and Mela, 2008). It provides UPC-level weekly store sales data for 26 CPG
industries across 47 U.S. markets, spanning a period of 6 years from 2001 to 2006. The
categories analyzed cover a wide range of industries, including both edible (e.g. soup) and
non-edible (e.g. paper towels) products. As CPG categories, the products studied are func-
tional, providing personal consumption utility, with limited scope to serve as a signal of social
status or make a statement about individual personality. There are 416 counties represented
in the data, which cover 47% of the total US population. There are 1,860 stores from 135
1
major chains. Our measures of brand consumption and new product trial are computed from
this store level sales data.
Brand Reliance - Private Label Market Share In CPG categories, a key distinc-
tion is between national and private label brands1. Despite their dramatic growth over the
past few decades, industry reports and academic research in marketing suggest that gener-
ics are perceived by consumers as riskier and of lower quality than national brands (Erdem
and Valenzuela, 2004; ADWEEK, 2000). Since a major function of branding is to lower
uncertainty and simplify decision making (Aaker, 1991), we might expect that, controlling
for other socio-economic factors, aspects of conservative values such as preference for tra-
dition and convention, and lower tolerance for ambiguity and complexity may get reflected
in higher reliance on national brands as opposed to generics. To test this empirically, our
key measure is the market share of the private label brand (PLShare), measured at the store
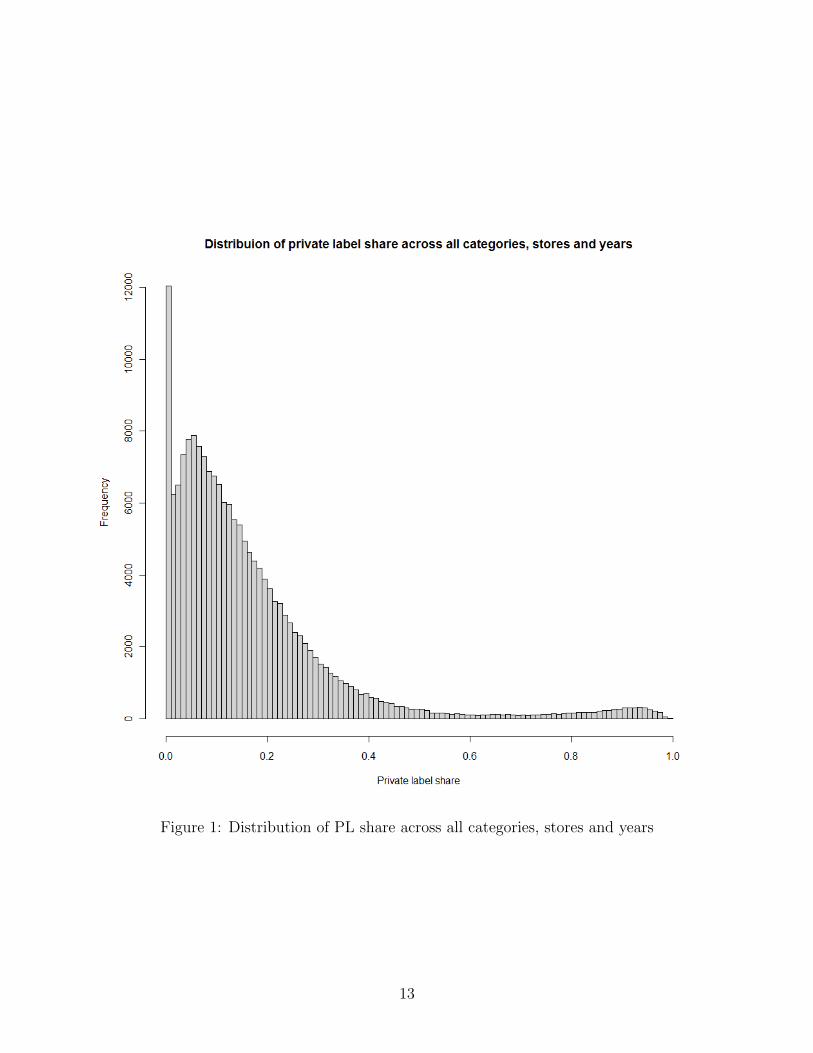
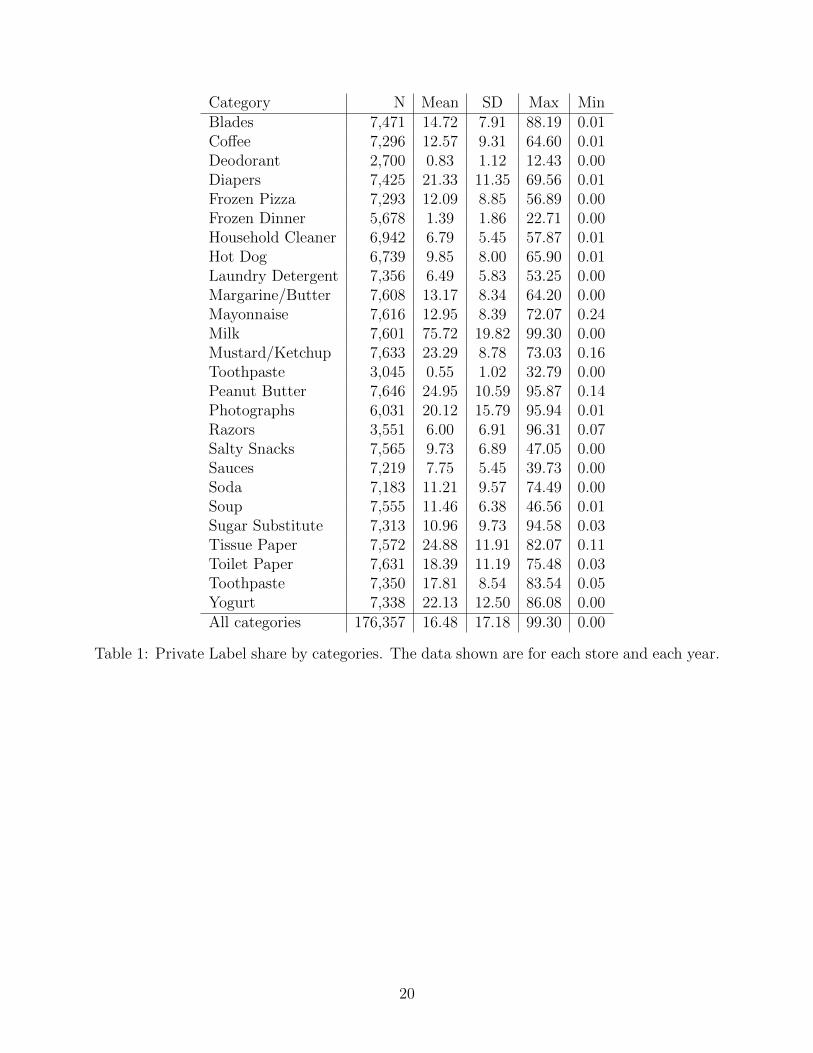
level within each category, for each year. While the average PLShare is 16%, figure 1 shows
that there is considerable variation across categories, stores and years. Table 1 shows the
summary statistics for PLShare for each category. There is a large degree of heterogeneity
across categories, ranging from an average PLShare of 76% in milk to 0.55% in toothpaste.
Furthermore, within each category we observe significant variation across stores and mar-
kets. For example, in 20 of the 26 categories the maximum PLshare observed across stores
exceeds 50%. Given the large variation, it is necessary to control for category effects and
chain identity as the private label quality may vary across chains and categories.
[Figure 1 about here.]
[Table 1 about here.]
New Brand Market Share Our second key measure is new brand market share. The
CPG industry is characterized by frequent introductions of new products, ranging from new
brands to minor modifications of existing products (e.g. a new flavor). We hypothesize
that personality traits associated with conservative ideology, such as skepticism towards new
experiences, might get reflected in lower acceptance and penetration of new products. To
measure new product penetration, we first create a data set to identify all new product
introductions from 2002 to 2004. (Since we observe data for only a few months in 2001 and
2006, we use the years 2002 to 2004 to identify the new product introductions.) We use the
market share of the new product in the year following launch as our key dependent variable. In
all, we observe 4,151 new product launches across our 26 categories. The summary statistics
1Private labels are often called store brands or generics. We use these terms interchangeably in this article.
2
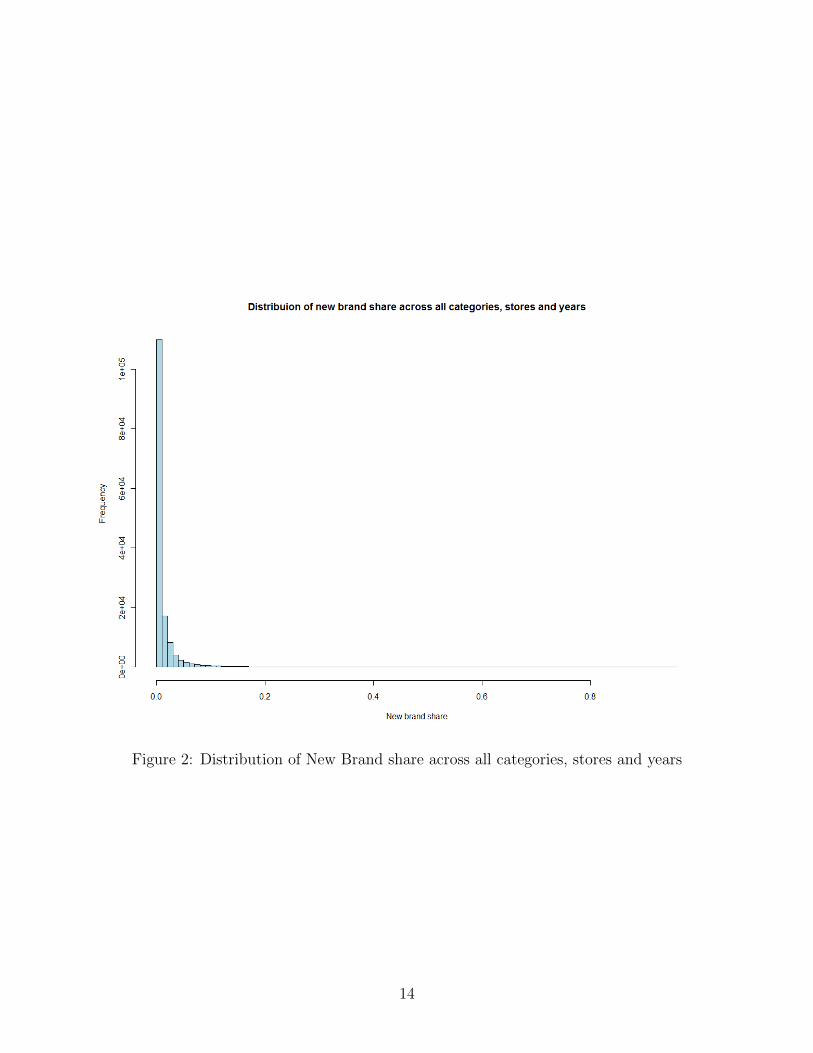
for new product market share by category is shown in table 2. On average we observe
approximately 6.6 (ranges from 0 to 122) new product launches every year in a county across
all categories. The average new product share is 1.3%, however there is a large degree of
heterogeneity across counties and categories. The distribution of all new product market
shares is shown in figure 2.
[Table 2 about here.]
[Figure 2 about here.]
1.1.2 Measures of Religiosity
Religiosity is a complex, multi-dimensional construct. It encompasses the various levels at
which religion impacts people, including their cognitive values and beliefs, affective feelings of
spirituality and commitment, and behaviors such as prayer and church attendance. The As-
sociation of Religion Data Archives (ARDA) compiles data on religious activity at the county
level. It collects information on church membership, adherence, and number of congregations
at the county level, and then provides further detail by breaking it down to the denomination
level. Our measures of religiosity are constructed from data contained in the 2000 report.
The primary measure of religiosity used in the empirical application is Adherence. The defi-
nition of adherents is quite stringent, counting only full members of religious denominations
and non-members who attend services regularly. As such, it serves as a relatively accurate
measure of the population that is truly engaged in religious activity, rather than including
those who might identify with a particular denomination but not actively practice or engage
with the religion through participation.
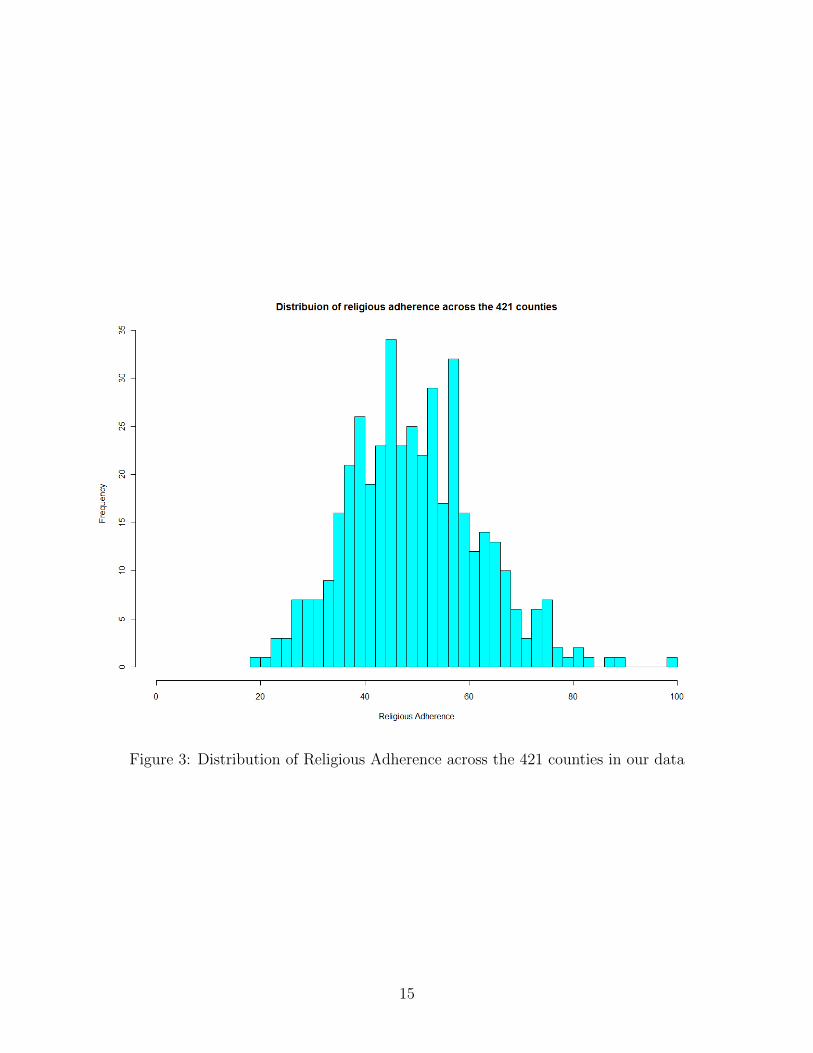
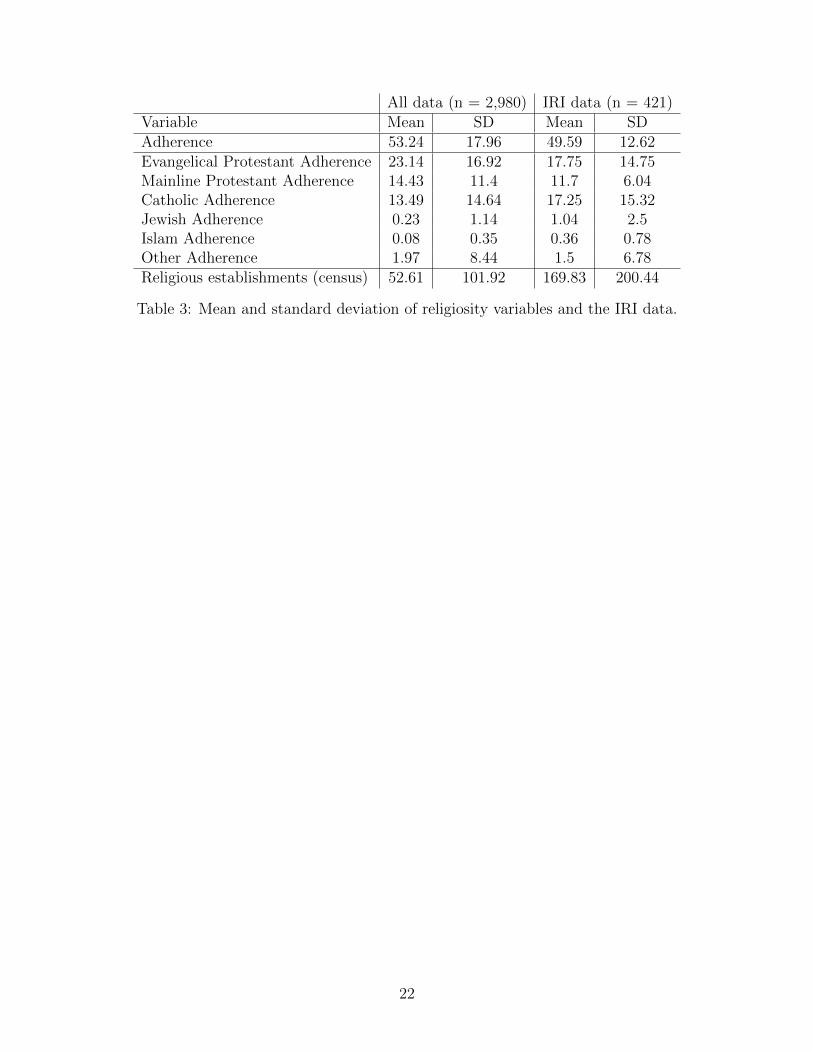
The summary statistics for our measures of religiosity are provided in table 3. This table
provides the mean and standard deviations for all counties in the US and the mean and stan-
dard deviation of the counties that overlap with IRI data and are included in our analysis.
The in-sample mean of Adherence is 50% (which matches the mean across all US counties
53%) with a standard deviation of 13%. Figure 3 shows the distribution of Adherence for the
421 counties represented in the sample. The minimum is 19%, with a few counties showing
100% Adherence. In the robustness checks below, we use two alternate measures of reli-
giosity. First, the ARDA data provides measures of Adherence at the denomination level.
Specifically, we know the number of adherents in each county who identify as Evangelical
Protestant, Mainline Protestant, Catholic, Jewish and Islamic. This allows us to investigate
whether and how the impact of religiosity on brand consumption varies across the denomi-
nations. For the second robustness measure, we use the number of religious establishments
in a county from the 2000 County Business Patterns report published by the U.S. Census
3
Bureau. The Census Bureau collects information on the number of religious establishments
defined as “those establishments primarily engaged in operating religious organizations, such
as churches, religious temples, and monasteries and/or establishments primarily engaged in
administering an organized religion or promoting religious activities.” As discussed below,
our results are robust to these alternate definitions of religiosity.
[Table 3 about here.]
[Figure 3 about here.]
1.1.3 Political Voting
To measure political voting behavior, we use county level outcomes from presidential elections
between 1980 and 2004 (available at http://uselectionatlas.org). Rather than rely on any
particular election, our main measure of political conservatism is the average percentage
of Republican votes in all elections between 1980 and 2004 (7 presidential elections). As
a robustness check, we also consider just 2004 presidential election as this coincides most
closely with our sales data.
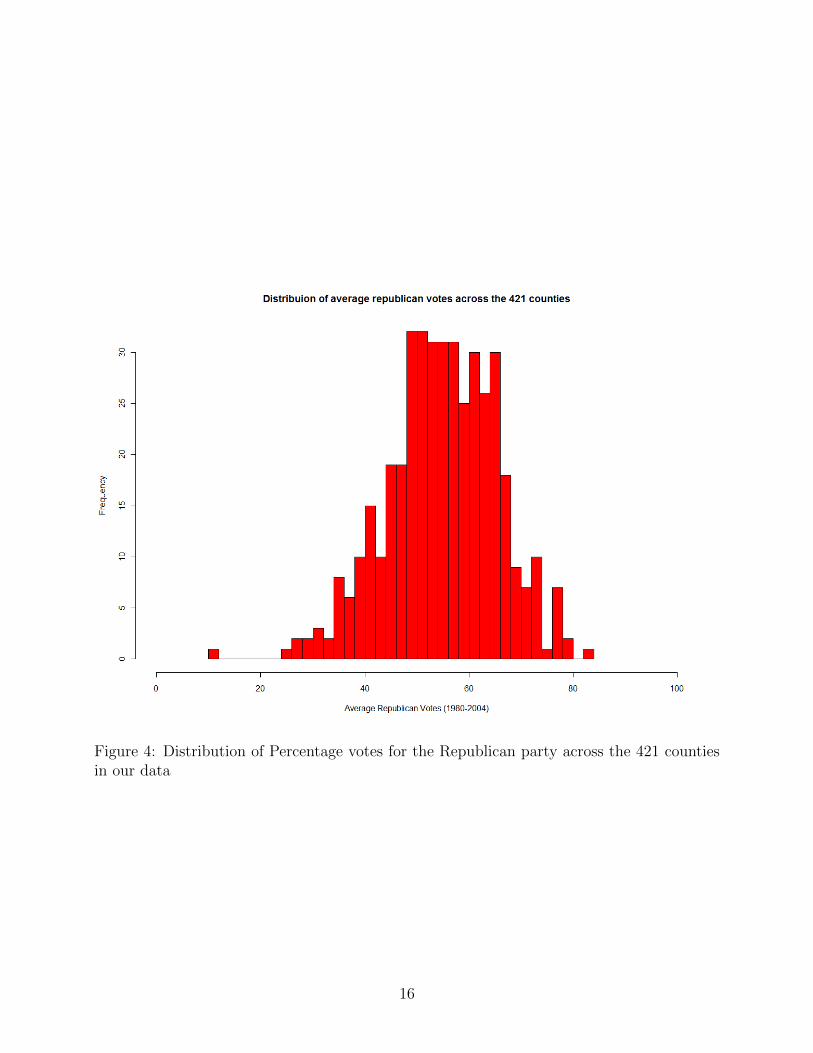
The summary statistics for our measures of Republican are provided in table 4. This table
provides the mean and standard deviation for all counties in the US and for the counties that
overlap with IRI data and are included in our analysis. The in-sample mean of Republican
vote is 55% (which matches the mean across all US counties 57%) with a standard deviation
of 11%. For the 2004 presidential election, we find that the counties with IRI data have a
lower percentage of Republican votes than the entire sample. Note importantly, the 61%
does not reflect the national average votes for George Bush in the 2004 election (51%), this
is because the 61% is the average across counties (these two number would be the same only
if the number of voters in the each county were the same). Figure 4 shows the distribution of
Republican for the 421 counties represented in the sample, displaying significant variation.
[Table 4 about here.]
[Figure 4 about here.]
Evaluating Religiosity and Republican as measures of conservativeness In addi-
tion, for the preliminary analysis in the paper we consider the biannual American national
election studies (ANES) survey data from 1948 to 2008. These data are available on-line
(http://www.electionstudies.org/). Raw correlations in these data show that religious belief
(r = 0.17, p value < 0.0001) and Republican political preference (r = 0.39, p value < 0.0001)
4
are significantly correlated with self-reported measures of conservative ideology. However,
the correlation between religious belief and political preference is not significantly different
from zero (r = -0.00, p value = 0.789), suggesting that both variables capture some aspects of
conservative values independent of each other. Interestingly, for Evangelical Protestant and
Mainline Protestant, we find a significant correlation between religious adherence (defined
by the scale ”how often do you go to church”) and Republican preference (r = 0.06 and 0.07
respectively, both have p <0.0001).
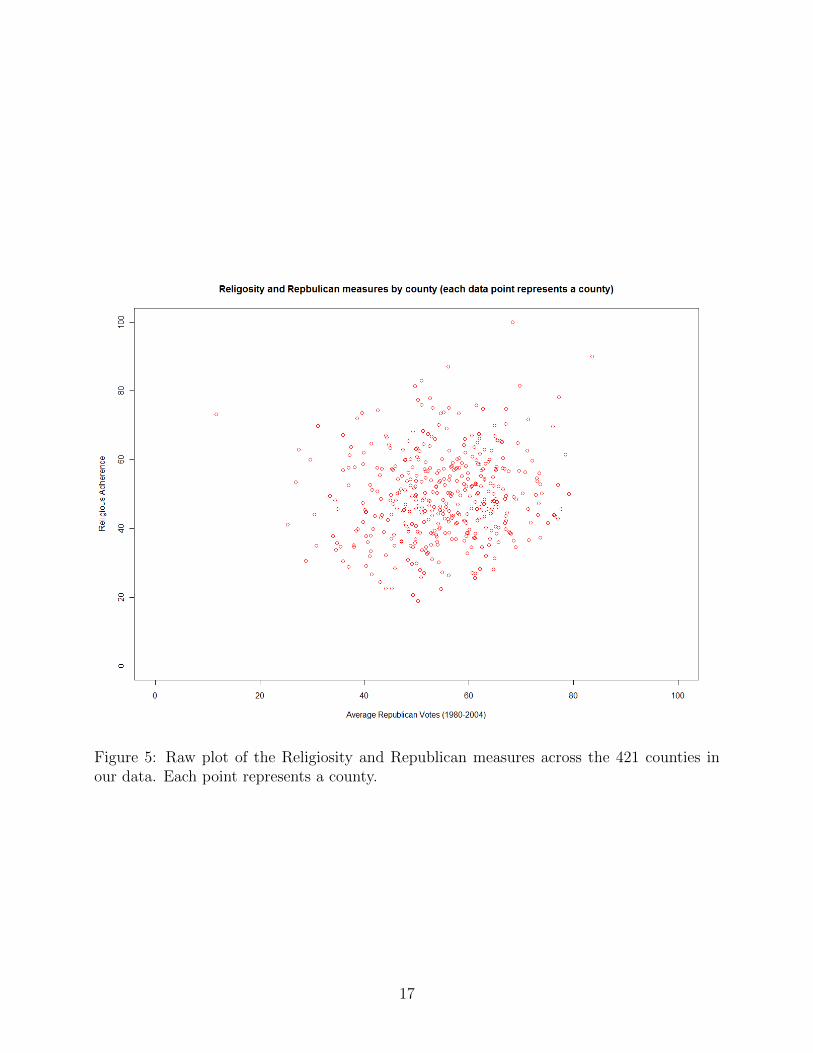
The correlations of religiosity and Republican in our data are shown in table 5. We find a
low overall correlation between the main measure of Republican and religiosity (adherence).
To visualize this, consider the plot of the raw data for the 421 counties in figure 4. Similar
to the ANES survey, we also observe a significant positive correlation between Evangelical
Protestant adherence and Republican voting.
[Table 5 about here.]
[Figure 5 about here.]
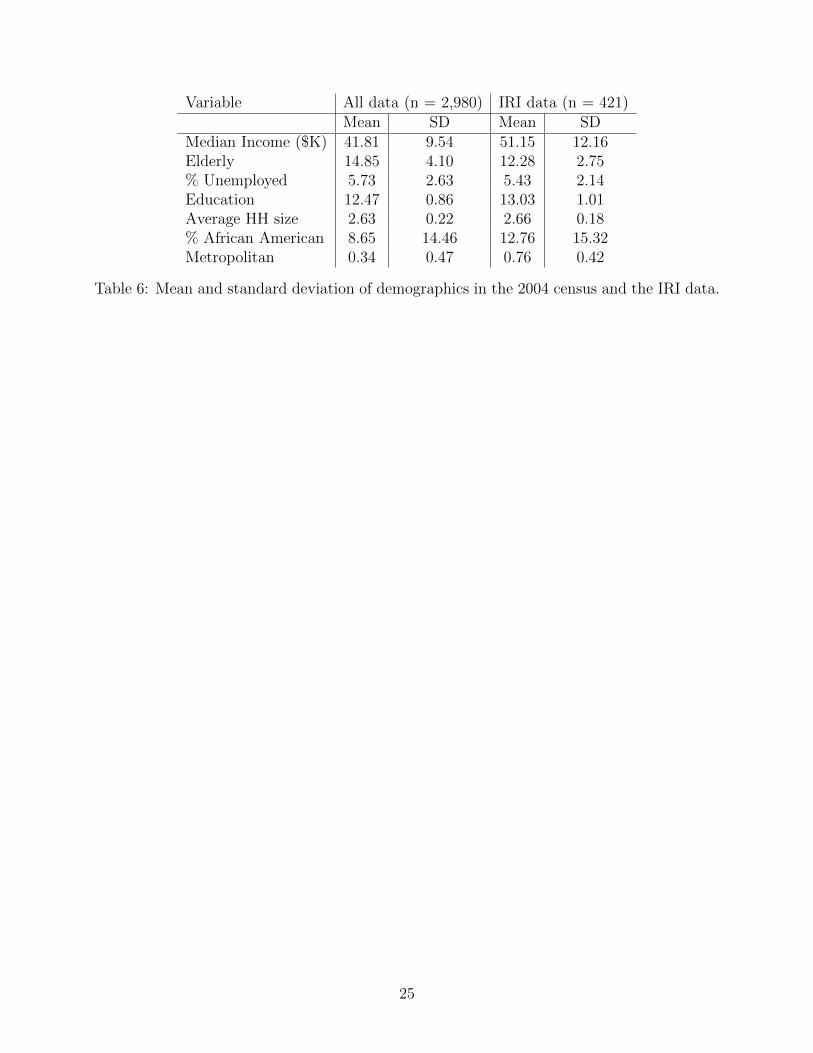
1.1.4 Demographics
Finally we incorporate an extensive set of demographic variables to control for other factors
that might impact brand consumption. These data are obtained from the US Census. The
variables included are (a) Income - average income, (b) Elderly - percent of the population
over 65, (c) Unemployed - percent unemployed, (d) Education - average number of years of
education, (e) HHsize - average household size, (f) Black - % African American population
and (g) Metro - an indicator for stores in large metropolitan areas. Descriptive statistics for
these measure are shown in table 6, which as before compares the statistics for the US with
our analysis sample. We note that metropolitan areas are over represented in the IRI sample,
and therefore we see on average a higher income and higher % African American population.
[Table 6 about here.]
In addition to demographic variables we include controls for marketing mix activity and
a rich set of fixed effects to control for every combination of chain, category, and year.
This accounts for the fact that chains may differ in the quality of private label in different
categories.
5
1.2 Methodology
1.2.1 Main model
In this paper our main model is of the following form:
Where r represents a store, ch represents a chain, ct represents a category, s represent a US
state, y represents a year. sr,ch,ct,s,y is the market share of the private label (or new product),
where the transformation to log( s1−s
) ensures support on the real line. αch,ct,s,y represents a
rich set of fixed effects for every combination of chain, category (or brand for new products),
state and year. This is important for our application as the quality of private labels can
vary across categories and chains. Religiosityr is the religious adherence in the store r’s
county; Republicanr is the average percentage of votes of the Republican party between
1980 and 2004 in the store r’s county. Our two main variables of interest are βrel and βrep
which capture the impact of the two measures of conservatism on private label (new product)
share. Xr contains the demographic variables such as income, employment and household
size for store r’s county. γ estimates the impact of these demographics on private label (new
product) share. The error term εr,ch,ct,s,y contains all other variation and is assumed to be
i.i.d. normal in our application. It is important to note that by incorporating a rich set
of fixed effects, other parameters in the regression are identified based on the variation in
market shares between stores that belong to the same retail chain serving different counties.
Thus, βrel and βrep capture the net impact of conservativeness after controlling for a variety
of socio-economic characteristics, marketing mix variables, and a robust set of fixed effects
that absorb any differences in product quality across retail chains.
1.2.2 Quantile regression
There are a few potential problems that could arise in using a least squares estimate (LS).
First, LS can give additional weight to outliers which can skew the estimates. Second, LS
only provides estimates in the central location rather then the entire distribution. In other
words, a least squares model assumes a homogeneous response to all independent variables
while this response can be heterogeneous. Therefore LS provides estimates of the average
impact of religiosity and Republican voting that may not be true for the entire distribution
of stores. Third, LS makes strong assumptions about the error term structure which could
be heteroskedastic. As a robustness check, we also estimate quantile regressions that can
account for each of these (see Koenker, 2005; Hao and Naiman, 2007). The main difference
6
between the two approaches is that LS estimates parameters at the conditional (conditional
on independent variables) mean where as a quantile regression estimates the parameters
at different conditional quantiles (e.g. median) of the private label (new product) share
distribution. As discussed below, our estimates are robust to these potential problems with
a linear model, and that for all quantiles of the conditional distribution of private label (new
product) share the estimate of Republican and religiosity are significant and negative (i.e.
consistent with the LS estimates).
2 SOM Text: Main Results
In this section we provide further details (displaying all controls) of our main results provided
in the main text. We will discuss the results for the private label share and the new product
share in subsections 2.1 and 2.2.
2.1 Private Label share
The complete main results for the pooled model are provided in Table 7. These represent the
results estimated by pooling our data from all categories. Here we find that the coefficients
associated with both religiosity and Republican are negative and statistically significant,
indicating that market shares for generics are significantly lower in conservative counties. It
is important to note that these estimates are identified based on the variation in market shares
between stores that belong to the same retail chain serving different counties. Thus, they
capture the net impact of conservativeness after controlling for a variety of socio-economic
characteristics, marketing mix variables, and a robust set of 47,232 fixed effects that absorb
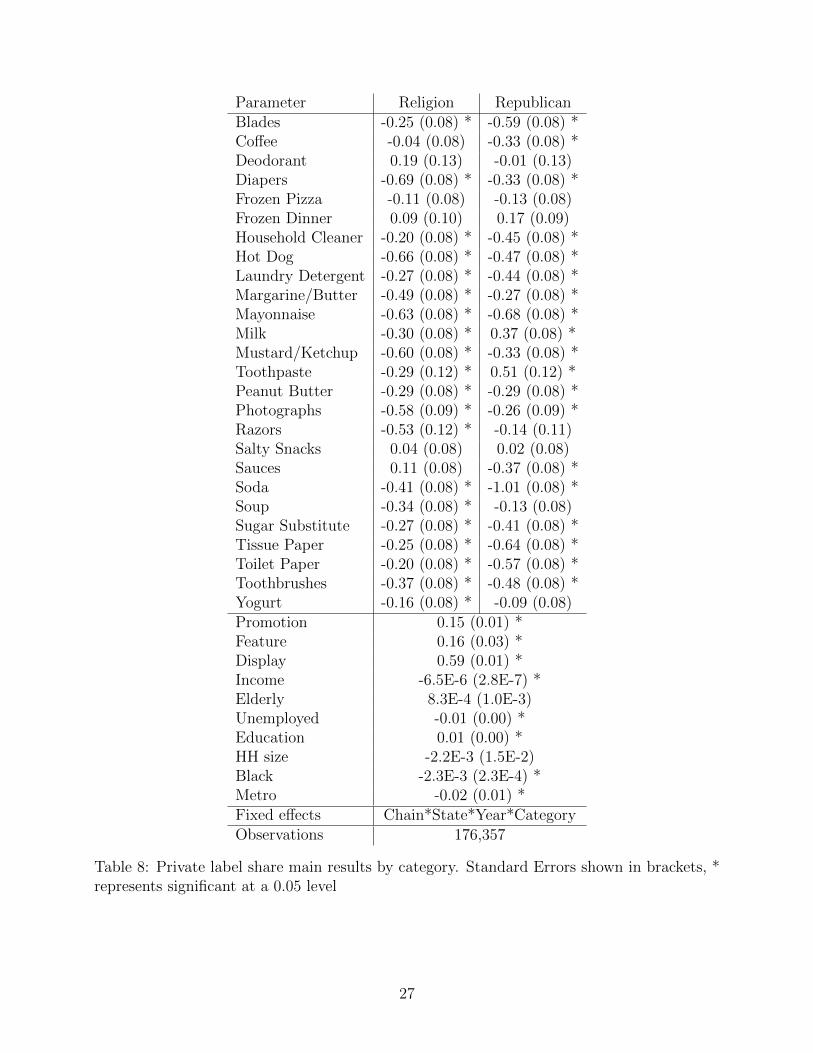
any differences in product quality across retail chains. The detailed category level results
are shown in table 8 below. The category level results are quite telling. In 20 out of the 26
categories, the effect of religiosity on generic brand penetration is negative and statistically
significant. For six categories the effect is insignificant, and there is not a single category
where religious counties are associated with higher market shares for generics. In 17 out
of the 26 categories, the effect of republican on generic brand penetration is negative and
statistically significant. For 7 categories the effect is insignificant, and for only 2 are the
estimates positive. These two categories are Toothpaste and Milk. Note that these are
somewhat unusual categories, Toothpaste has extremely low market share for generics (0.5%)
and Milk has very large market share (over 75%).
[Table 7 about here.]
7
[Table 8 about here.]
2.2 New product share
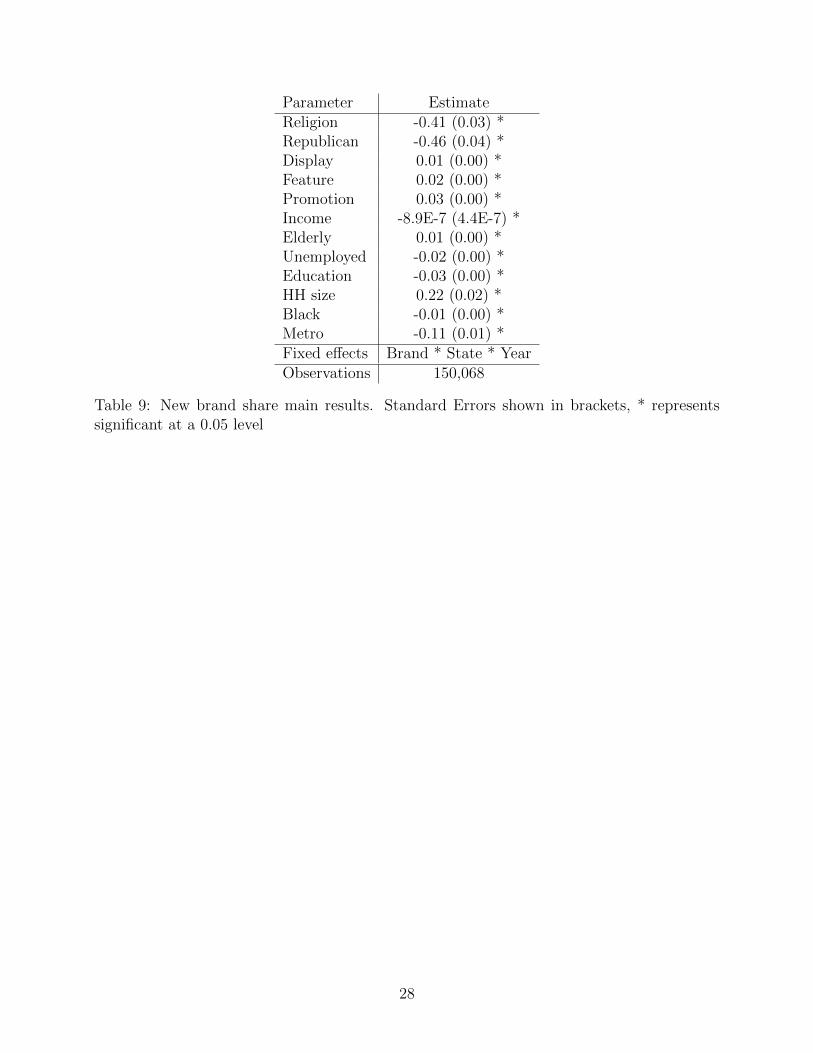
The complete main results for the pooled model are provided in Table 9. We find that the
coefficients associated with both religiosity and Republican are negative and statistically sig-
nificant, indicating that market shares for new products are significantly lower in conservative
counties. It is important to note that these estimates are identified based on the variation in
market shares for the same brands across different counties within a state. They capture the
net impact of conservativeness after controlling for a variety of socio-economic characteristics,
marketing mix variables, and a robust set of 53,389 fixed effects that absorb any differences
in brands and states. The detailed category level results are shown in table 10 below. Across
the two measures of conservatism, 32 out of the 52 estimates are negative and statistically
significant implying that the effect of religiosity and republican on new product penetration
is negative. All the remaining estimates are insignificant, and there is not a single estimate
that is positive and statistically significant.
[Table 9 about here.]
[Table 10 about here.]
3 SOM Text: Robustness Checks
In this section we provide robustness checks to our main results by using alternate definitions
for religiosity and voting. In addition, we provide estimates from quantile regressions. We
will discuss the results for the private label share and the new product share in subsections
3.1 and 3.2.
3.1 Private Label share
3.1.1 Alternate Definition of Religiosity
In our main results, we define religiosity as adherence in a county using data provided by
ARDA. To ensure these results are not driven any particular measure of religiosity, we use
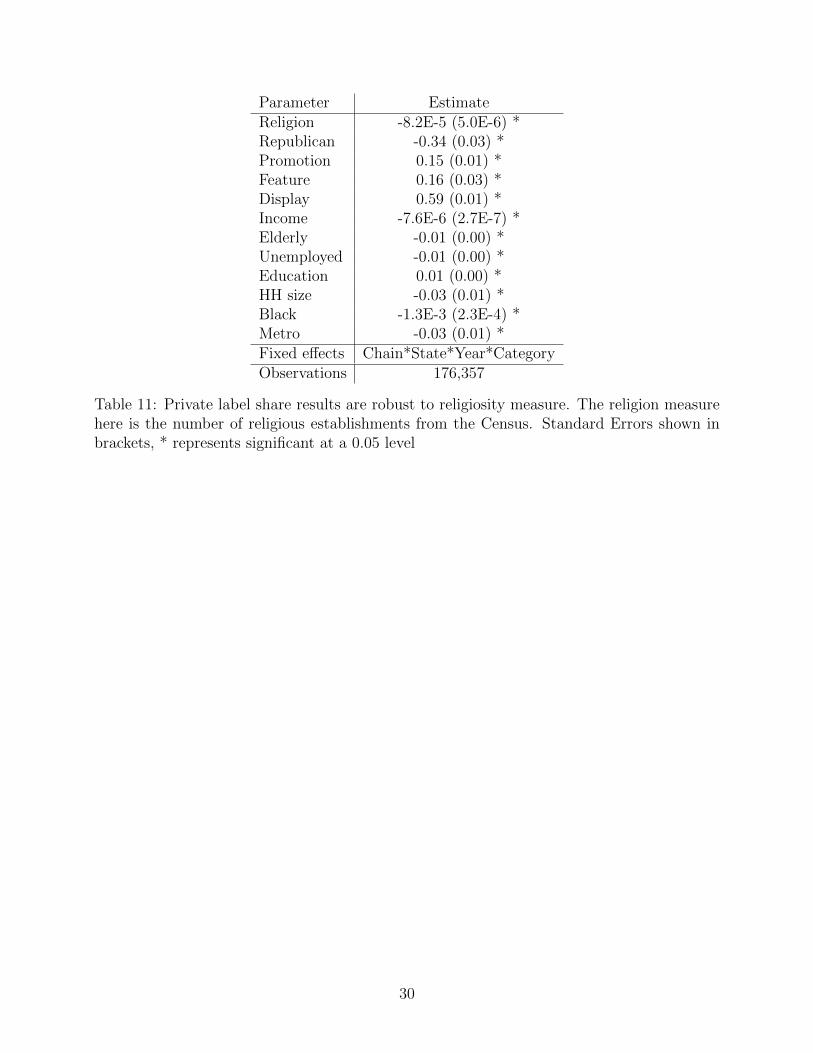
additional data from the County Business Patterns from the 2000 Census. The religiosity
measure based on this data is the number of religious organizations per 100,000 residents.
The results are shown in table 11. As seen from table 11, our main results are replicated
using this new measure of religiosity.
8
[Table 11 about here.]
As a second robustness check, we test whether our results are robust across different
religious denominations. The results are shown in table 12. We find significant negative
estimates for Protestant, Catholic, Jewish and Islam and our estimates are directionally con-
sistent though insignificant for Evangelical and all ‘other’ religions. As pointed out earlier,
there is high correlation between the Evangelical Protestants adherence and Republican po-
litical support. To test this we run the same model without the Republican parameter and
do indeed find that coefficient for Evangelical is negative and significant. These results are
shown in second column of table 12.
[Table 12 about here.]
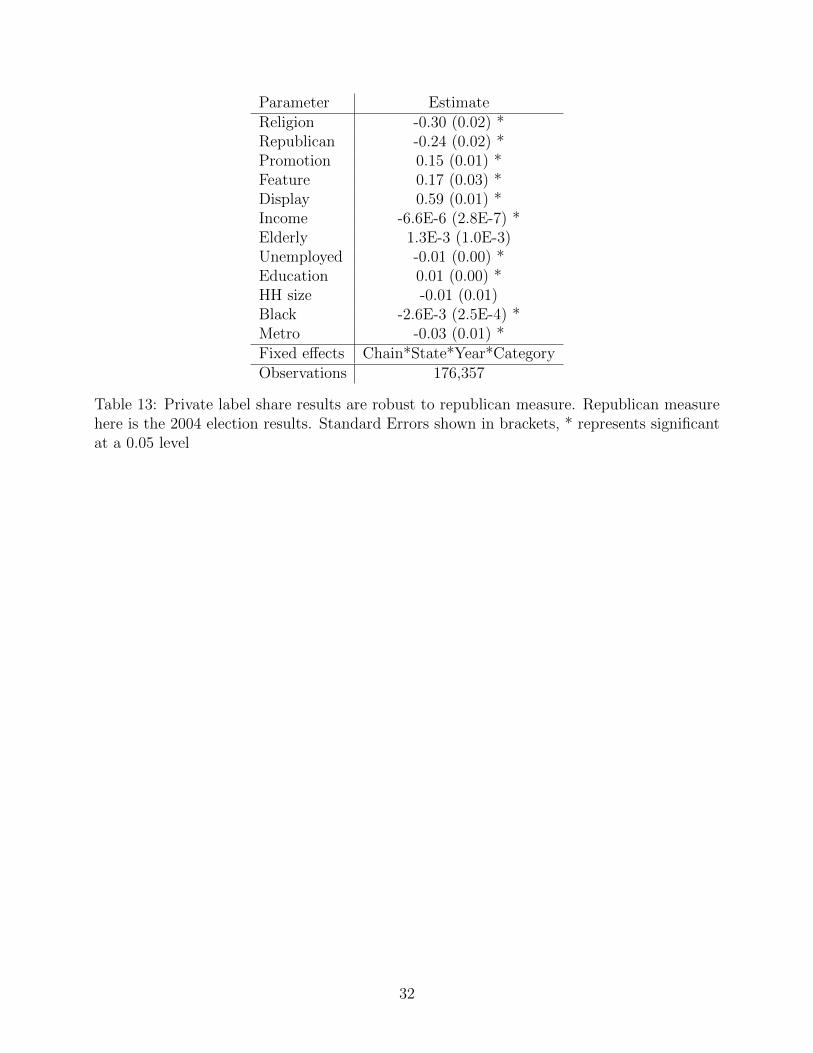
3.1.2 Alternate Definition of Republican
In our main results, we define Republican based on the average voting outcome for all elections
from 1980 to 2004. We test if our results are robust to the other measure of Republican -
2004 election results. The results are shown in table 13. We find that our main results are
replicated.
[Table 13 about here.]
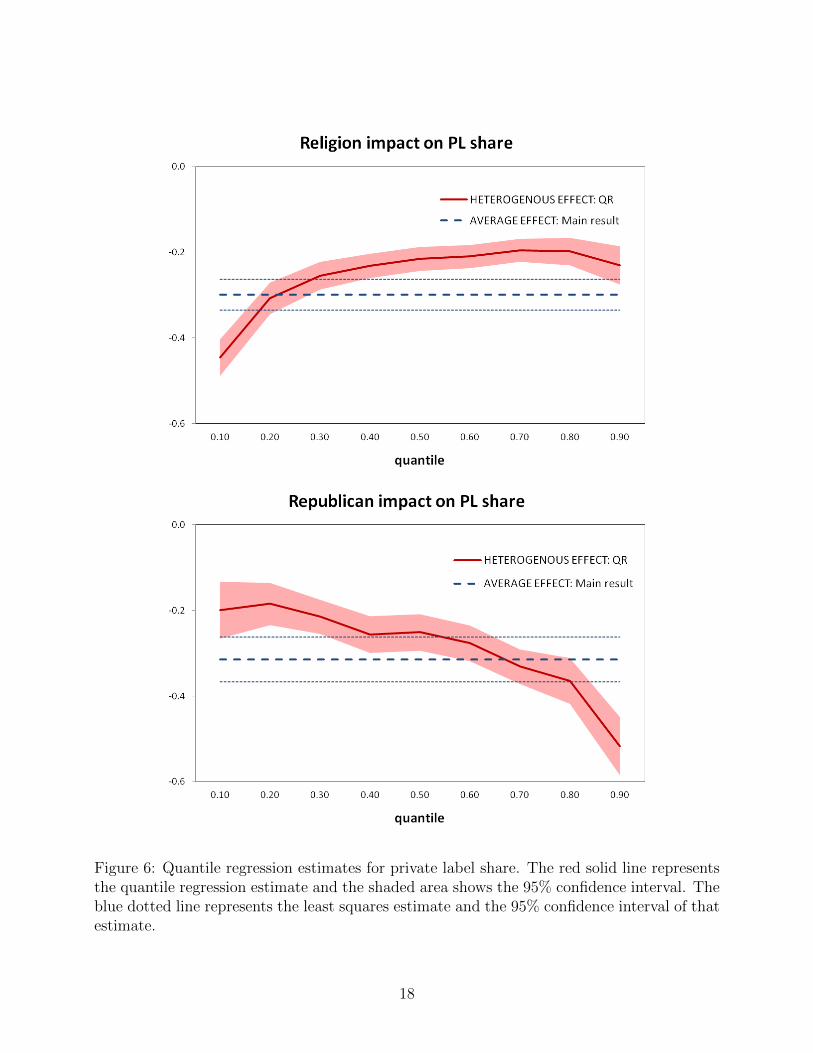
3.1.3 Quantile Regression
The results of the quantile regression are shown in figure 6. In these charts the solid line rep-
resents the quantile regression estimates and the shaded area represents the 95% confidence
interval. The dotted line shows the least squares model and the blue lines show the 95%
confidence interval for these estimates. Figure 6 shows that for the entire distribution of pri-
vate label share we find both religion and Republican have a significant and negative impact.
Hence, our main OLS estimates are not driven by outliers or other model misspecification.
[Figure 6 about here.]
3.1.4 Separate regressions by category
In our main results (table 8) we estimate our category level effects with assuming the same
impact of marketing mix and demographic variables across categories. To show this does
not impact our results, we run a robustness check where we run separate regressions for each
category. The results are shown in table 14 (for brevity the estimates of the controls are not
shown). Consistent with our main results in table 8 we find that 33 of the 52 estimates are
9
negative and statistically significant. Only one is positive and significant (the estimate of
Republican on generic milk share) and the rest are not significant.
[Table 14 about here.]
3.2 New Products
3.2.1 Alternate Definition of Religiosity
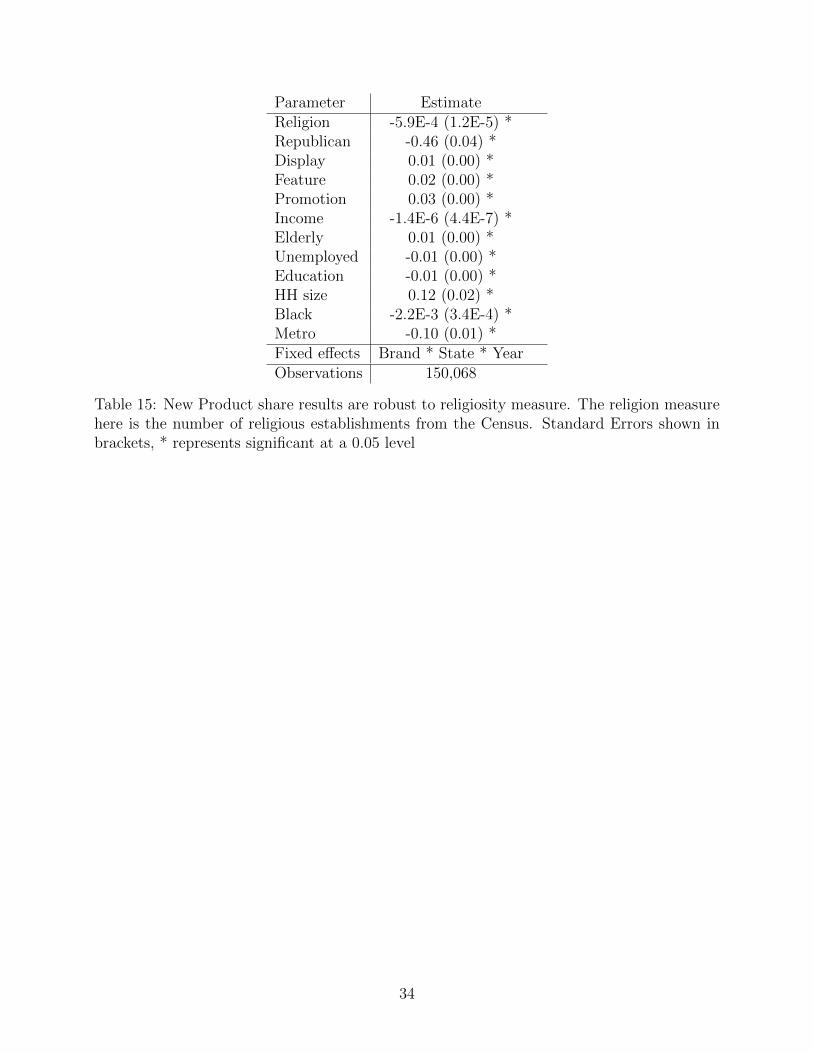
Results for new product market share using the alternate definition of religiosity are reported
in table 15. As with Private Label shares, we find our main results are replicated.
[Table 15 about here.]
Next, we test the robustness of results to different denominations of religion. The results
are shown in table 16. We find significant negative estimates for Protestant, Catholic, Jewish
and Islam. As in the Private Label case, we do not find significant results for Evangelical and
believe this is due to the correlation with Republican voting. Again, to test this we rerun our
main regression without the Republican variable and find that the Evangelical coefficient is
significant and negative.
[Table 16 about here.]
3.2.2 Alternate Definition of Republican
The results using voting outcomes for 2004 presidential elections are shown in table 17. We
find our main results are replicated.
[Table 17 about here.]
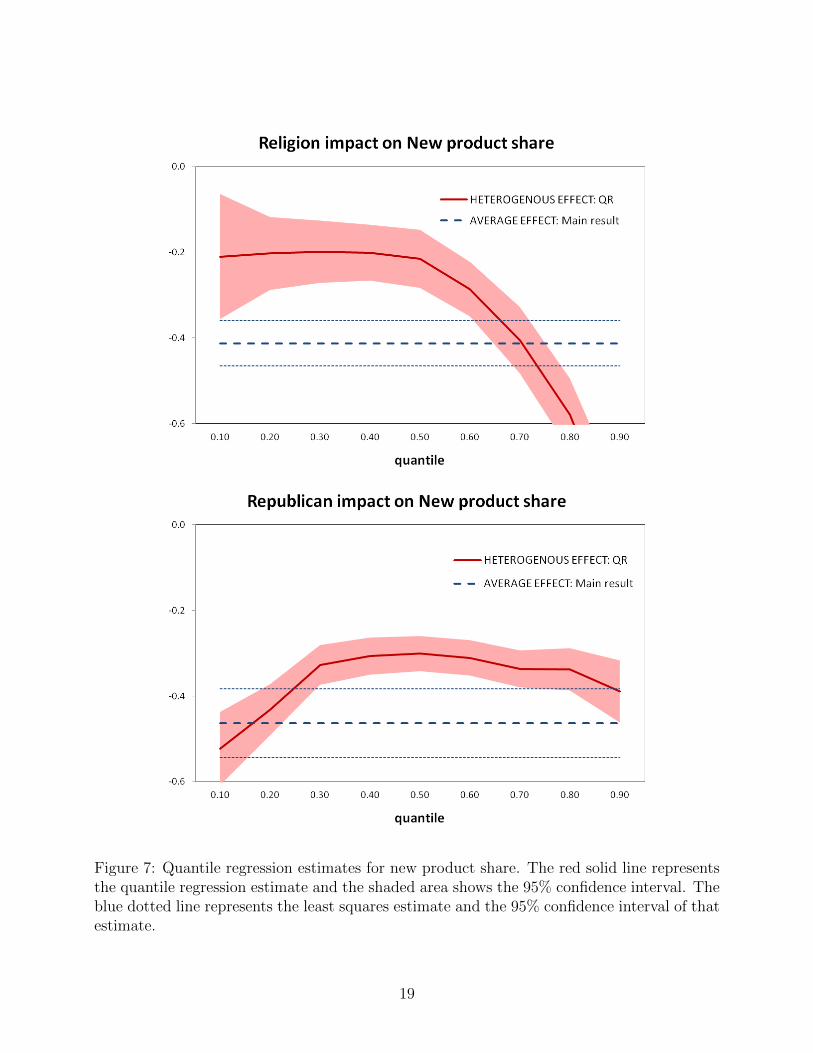
3.2.3 Quantile Regression
The results of the quantile regression are shown in figure 7. In these charts the solid line rep-
resents the quantile regression estimates and the shaded area represents the 95% confidence
interval. The dotted line shows the least squares model and the blue lines show the 95% con-
fidence interval for these estimates. As with the private label regression, these charts show
that for the entire distribution of new product share we find both religion and Republican
have a significant and negative impact.
[Figure 7 about here.]
10
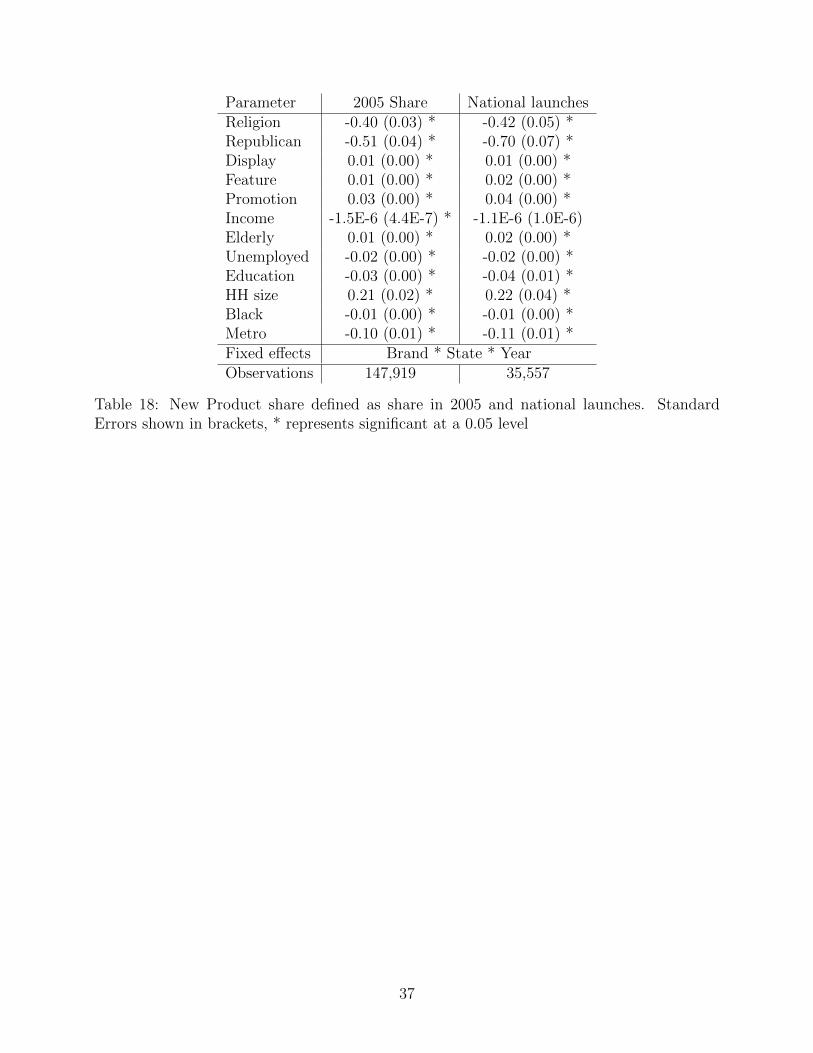
3.2.4 Launch date
We provide one final robustness check with regards to the definition of the new product. In
the data we observe that several of the new products are launched at a regional rather than a
national level. Here we consider two alternate measures for new products. First, rather than
considering the share of the new product in the year after launch, we use the share in 2005
as our main dependent variable. The results are shown in the first column of table 18, and
we find that our results are replicated. Second, we consider only “major” launches (those
brands that were launched nationwide at the same time). This definition reduces the number
of new products in the data from 4,151 to 1,350. The second column of table 18 shows that
we still get very similar results with the reduced dataset.
[Table 18 about here.]
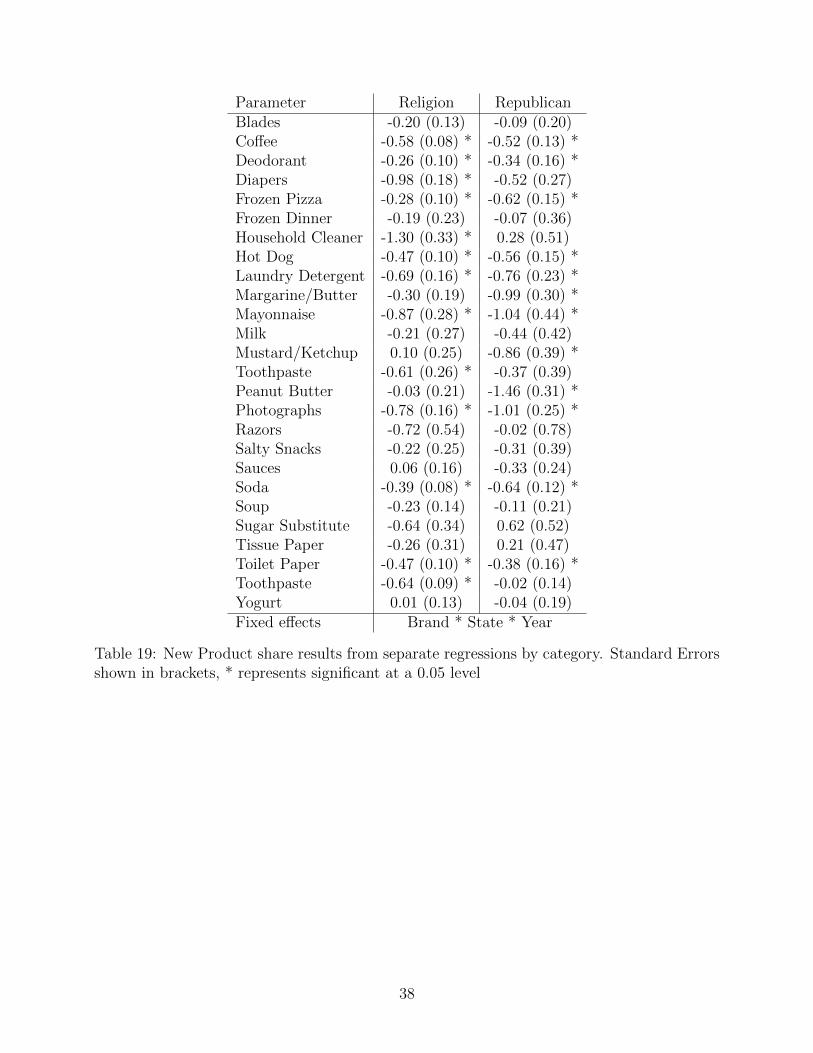
3.2.5 Separate regressions by category
In our main results (table 10) we estimate our category level effects with assuming the same
impact of marketing mix and demographic variables across categories. To show this does
not impact our results, we run a robustness check where we run separate regressions for each
category. The results are shown in table 19 (for brevity the estimates of the controls are not
shown). Consistent with our main results in table 10 we find that 25 of the 52 estimates
are negative and statistically significant. The rest are not significant. Not one estimate is
positive and statistically significant.
[Table 19 about here.]
11
References
Aaker, D. A. (1991): “Managing Brand Equity,” Free Press.
ADWEEK (2000): “Why risk prevents switching to Private Labels,” July 10.
Bronnenberg, B., M. Kruger, and C. Mela (2008): “The IRI Marketing Data Set,”
Marketing Science, 27, 745–748.
Erdem, T., and A. Valenzuela (2004): “Performance of Store Brands,” Journal of
Marketing Research, 41(1), 208–227.
Hao, L., and D. Q. Naiman (2007): “Quantile Regression,” SAGE publications.
Koenker, R. (2005): “Quantile Regression,” Cambridge University Press.
12
Figure 1: Distribution of PL share across all categories, stores and years
13
Figure 2: Distribution of New Brand share across all categories, stores and years
14
Figure 3: Distribution of Religious Adherence across the 421 counties in our data
15
Figure 4: Distribution of Percentage votes for the Republican party across the 421 countiesin our data
16
Figure 5: Raw plot of the Religiosity and Republican measures across the 421 counties inour data. Each point represents a county.
17
Figure 6: Quantile regression estimates for private label share. The red solid line representsthe quantile regression estimate and the shaded area shows the 95% confidence interval. Theblue dotted line represents the least squares estimate and the 95% confidence interval of thatestimate.
18
Figure 7: Quantile regression estimates for new product share. The red solid line representsthe quantile regression estimate and the shaded area shows the 95% confidence interval. Theblue dotted line represents the least squares estimate and the 95% confidence interval of thatestimate.
Table 11: Private label share results are robust to religiosity measure. The religion measurehere is the number of religious establishments from the Census. Standard Errors shown inbrackets, * represents significant at a 0.05 level
Table 13: Private label share results are robust to republican measure. Republican measurehere is the 2004 election results. Standard Errors shown in brackets, * represents significantat a 0.05 level
Table 14: Private label share results from separate regressions by category. Standard Errorsshown in brackets, * represents significant at a 0.05 level
Table 15: New Product share results are robust to religiosity measure. The religion measurehere is the number of religious establishments from the Census. Standard Errors shown inbrackets, * represents significant at a 0.05 level
Table 17: New Product share results are robust to republican measure. Republican measurehere is the 2004 election results. Standard Errors shown in brackets, * represents significantat a 0.05 level