White Matter Nulled Motion Corrected MPRAGE MR Provides Added Value in MR Imaging of Multiple Sclerosis Idoia Corcuera-Solano, Gerard Reddy, Bradley Delman, Reade De Leacy, Dan Rettmann, Lawrence N Tanenbaum EP-63-2519
Transcript
White Matter Nulled Motion Corrected MPRAGE MR
Provides Added Value in MR Imaging of Multiple Sclerosis
Idoia Corcuera-Solano, Gerard Reddy, Bradley Delman, Reade De Leacy, Dan Rettmann,
Lawrence N Tanenbaum
EP-63-2519
Financial Disclosure
L. Tanenbaum is a speaker for GE Healthcare
Background
Multiple Sclerosis (MS) is a chronic inflammatory demyelinating condition associated with significant neurological disability
Supportive imaging findings require display of lesions distributed in space and time
Etiology remains unknown MR imaging plays a key role in initial
diagnosis & monitoring patient progress & response to treatment
Background
Increased utilization of MRI due to increased incidence and changing geographic patterns of disease 1
Increased requirement for imaging to guide treatment decisions 2
T2 and T2 FLAIR are current mainstays of MRI protocols for MS
White Matter Nulled Motion Corrected MPRAGE MR Technique
A novel 3D MPRAGE sequence incorporates an additional inversion pulse to null white matter (WMn)
T1 weighted contrast despite white CSF
Suppression of white matter signal highlights WM pathology
Prospective motion correction (PROMO)
MPRAGE
MPRAGE
Purpose
To assess the image quality and added value of WMn-MPRAGE in comparison to conventional techniques in MR imaging of multiple sclerosis
MPRAGE FLAIR T2 T1
Material and Methods
17 MS patients (9 male, 8 female, median age 43 years) with previously identified MS lesions were included in this study
Patients were prospectively scanned with WMn-MPRAGE in addition to conventional imaging sequences on a clinical 3T MR scanner.
Studies were performed on 3.0 T scanner 3 mm MPRAGE reformatted axial images 3 mm FLAIR reformatted axial images 5 mm direct axial T2 5 mm direct axial T1
MPRAGE FLAIR T2 T1
Image analysis
Images reviewed by two Neuroradiologists who assessed image quality and added value in terms of cortical, subcortical and white matter lesion conspicuity
MPRAGE FLAIR T2 T1
Image Analysis Methodology
Lesions were assessed for each patient in 4 pre-determined anatomical levels
▪ Centrum Semiovale▪ Corona Radiata▪ Third Ventricle▪ Posterior Fossa
5 point scale was used to assess lesion conspicuity
GRADING SYSTEM
1 NOT SEEN
2 POORLY SEEN
3 ADEQUATE
4 ABOVE AVERAGE
5 EXCELLENT
Statistical Analysis
Statistical software used for analysis GraphPad Prism version 5.00 for Mac
OSX (GraphPad Software, San Diego, Calif. USA, www.graphpad.com)
Qualitative analysis Wilcoxon test Results expressed as a mean with
standard deviation p≤0.05 was considered statistically
significant
MPRAGE FLAIR p
Centrum semiovale 4.36±1.32 4.49±0.81 0.648
Corona Radiata
4.55±1.15 4.55±1.01 0.833
Third Ventricle
4.32±1.17 3.82±1.530.085
Posterior Fossa
4.53±0.82 2.17±1.11 <0.001
Comparison: MPRAGE v FLAIR
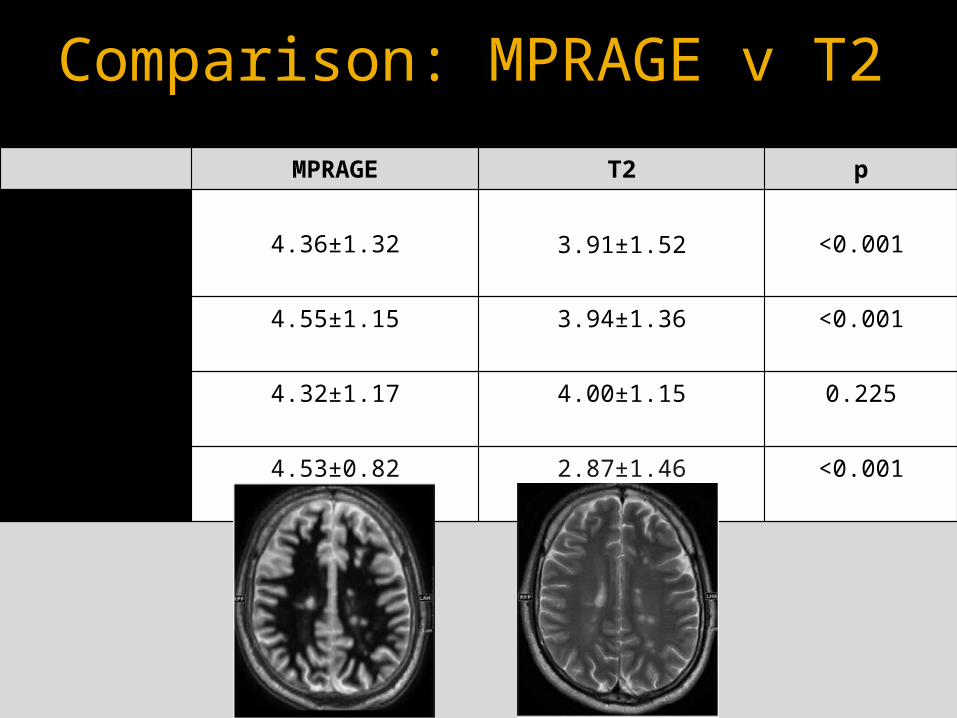
MPRAGE T2 p
Centrum semiovale 4.36±1.32 3.91±1.52 <0.001
Corona Radiata
4.55±1.15 3.94±1.36 <0.001
Third Ventricle
4.32±1.17 4.00±1.15 0.225
Posterior Fossa
4.53±0.82 2.87±1.46 <0.001
Comparison: MPRAGE v T2
MPRAGE T1 p
Centrum semiovale 4.36±1.32 2.79±1.72 <0.001
Corona Radiata
4.55±1.15 3.13±1.57 <0.001
Third Ventricle
4.32±1.17 2.68±1.70 0.014
Posterior Fossa
4.53±0.82 2.13±1.25 <0.001
Comparison: MPRAGE v T1
FLAIR T2 p
Centrum semiovale 4.49±0.81 3.91±1.52 0.013
Corona Radiata
4.55±1.01 3.94±1.36 0.023
Third Ventricle
3.82±1.53 4.00±1.15 0.748
Posterior Fossa
2.17±1.11 2.87±1.46 0.006
Comparison: FLAIR v T2
FLAIR T1 p
Centrum semiovale 4.49±0.81 2.79±1.72 <0.001
Corona Radiata
4.55±1.01 3.13±1.57 <0.001
Third Ventricle
3.82±1.53 2.68±1.70 0.05
Posterior Fossa
2.17±1.11 2.13±1.25 1.00
Comparison: FLAIR v T1
Comparison: T2 v T1
T2 T1 p
Centrum semiovale 3.91±1.52 2.79±1.72 <0.001
Corona Radiata
3.94±1.36 3.13±1.57 <0.001
Third Ventricle 4.00±1.15 2.68±1.70 <0.001
Posterior Fossa
2.87±1.46 2.13±1.25 0.006
T2MPRAGE FLAIR T1
CENTRUM SEMIOVALE
Mean ± SD Mean ± SD p
MPRAGE-FLAIR4.36±1.32 4.49±0.81 0.648
MPRAGE-T24.36±1.32 3.91±1.52 <0.001
MPRAGE-T14.36±1.32 2.79±1.72 <0.001
FLAIR-T24.49±0.81 3.91±1.52 0.013
FLAIR-T14.49±0.81 2.79±1.72 <0.001
T2-T13.91±1.52 2.79±1.72 <0.001
Centrum Semiovale
Centrum Semiovale
MPRAGE FLAIR T2 T1
Cortical lesion are more prominently seen on MPRAGE and FLAIR than on T2 and T1-weighted images.
Centrum Semiovale
MPRAGE FLAIR T2 T1
Four discrete lesion can be seen in the MPRAGE and FLAIR images and only 3 in the T2 WI. No discrete lesions are appreciated on the T1 WI at this level.
MPRAGE FLAIR T2 T1
CORONA RADIATA
Mean ± SD Mean ± SD p
MPRAGE-FLAIR4.55±1.52 4.55±1.01 0.833
MPRAGE-T24.55±1.52 3.94±1.36 <0.001
MPRAGE-T14.55±1.52 3.13±1.57 <0.001
FLAIR-T24.55±1.01 3.94±1.36
0.023
FLAIR-T14.55±1.01 3.13±1.57 <0.001
T2-T13.94±1.36 3.13±1.57 <0.001
Corona Radiata
Corona Radiata
MPRAGE FLAIR T2 T1
MPRAGE FLAIR T2 T1
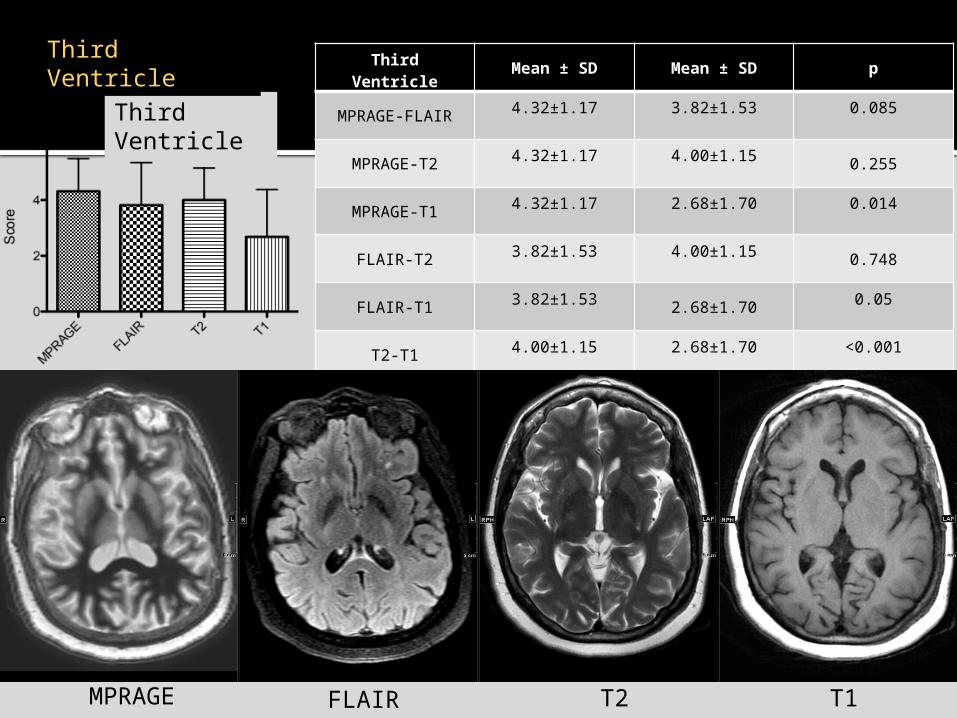
Third Ventricle Mean ± SD Mean ± SD p
MPRAGE-FLAIR 4.32±1.17 3.82±1.53 0.085
MPRAGE-T2 4.32±1.17 4.00±1.150.255
MPRAGE-T1 4.32±1.17 2.68±1.70 0.014
FLAIR-T2 3.82±1.53 4.00±1.150.748
FLAIR-T1 3.82±1.532.68±1.70
0.05
T2-T1 4.00±1.15 2.68±1.70 <0.001
Third Ventricle
Third Ventricle
Third Ventricle
MPRAGE
FLAIR T2 T1
MPRAGE FLAIR T2 T1
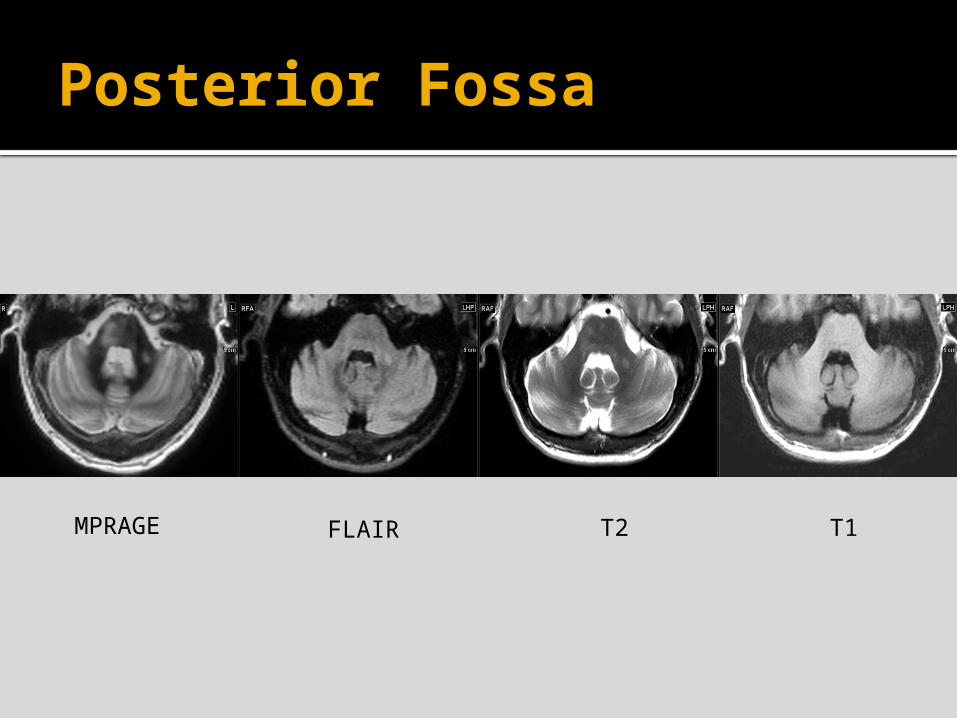
Posterior Fossa Mean ± SD Mean ± SD p
MPRAGE-FLAIR 4.53±0.82 2.17±1.11 <0.001
MPRAGE-T2 4.53±0.82 2.87±1.46<0.001
MPRAGE-T1 4.53±0.82 2.13±1.25 <0.001
FLAIR-T2 2.17±1.11 2.87±1.46 0.006
FLAIR-T1 2.17±1.11 2.13±1.25 1.000
T2-T1 2.87±1.46 2.13±1.25 0.006
Posterior Fossa
Posterior Fossa
Posterior Fossa
MPRAGE FLAIR T2 T1
MPRAGE-
FLAIR
MPRAGE-T2
MPRAGE-T1
FLAIR-T2
FLAIR-T1
T2-T1
Centrum
semiovale
(n=45)
0.648b MPRAGE<0.001a
MPRAGE<0.001a
FLAIR0.013a
FLAIR<0.001a
T2<0.001a
Corona Radiata(n=51)
0.833b MPRAGE<0.001a
MPRAGE<0.001a
FLAIR0.023a
FLAIR<0.001a
T2<0.001a
Third Ventricl
e(n=22)
0.085b 0.255b MPRAGE0.014a
0.748b FLAIR0.05a
T2<0.001a
Posterior Fossa(n=30)
MPRAGE<0.001a
MPRAGE<0.001a
MPRAGE<0.001a
T20.006a
1.000b T20.006a
Statistical comparison of MPRAGE, FLAIR, T2 and T1 sequences according to lesion location
• p≤0.05 was considered the statistical significant level. a: statistically significant; b: not statistically significant
Conclusions
MPRAGE was significantly better than T2 and T1 on the assessment of MS lesions located in the centrum semiovale and corona radiata.
MPRAGE was significantly better than T1 in the evaluation of MS lesions at the level of the 3rd ventricle.
MPRAGE was significantly better in the assessment of posterior fossa lesions in comparison to all standard sequences.
Conclusions
WMn-MPRAGE is a practical technique providing novel image contrast of value in evaluation of MS brain lesions, specially in the assessment of posterior fossa lesions.
WMn-MPRAGE should be considered for routine use in the evaluation of patients with known or suspected MS
Acknowledgements
We acknowledge Ginu Abraham, BSRT(R)(MR), for his assistance on the MRI scanners.
References
1. Alonso A, Heman MA. Temporal trends in the incidence of multiple sclerosis: A systematic review. Neurology 2008; 71: 129-35
2. Rotstein DL, Mamdani M, O’Connor PW. Increasing use of disease modifying drugs for MS in Canada. Can J Neurol 2010; 9: 520-32
3. Filippi M et al. Quantitative assessment of MRI lesions load in multiple sclerosis. A comparison of conventional spin-echo with fast fluid-attenuated inversion recovery. Brain 1996;119:1349-1355.
4. Gawne-Cain ML et al. Multiple sclerosis lesion detection in the brain: A comparison of fast fluid-attenuated inversion recovery and conventional T2-weighted dual spin-echo. Neurology 1997;49:364-37
5. Nelson F, Poonawalla A, Hou P, Wolinsky JS, Narayana PA. 3D MPRAGE improves classification of cortical lesions in multiple sclerosis. Multiple sclerosis. 2008 Nov;14(9):1214-9. PubMed PMID: 18952832. Pubmed Central PMCID: PMC2650249. Epub 2008/10/28. eng.


![· Web view[12] Fernández-d’Arlas B, Corcuera MA, Eceiza A. Comparison between exfoliated graphite, graphene oxide and multiwalled carbon nanotubes as reinforcing agents of a](https://static.documents.pub/doc/80x56/60c7038d989c5e33782f95c8/web-view-12-fernndez-daarlas-b-corcuera-ma-eceiza-a-comparison-between.jpg)

