Page 1
1
IDŐJÁRÁS Quarterly Journal of the Hungarian Meteorological Service
Vol. 118, No. 1, January – March, 2014, pp. 1–17
Risk analysis of the first and last frost occurrences during
growing season of vegetables in the Elbe River lowland
Vera Potop1*, Pavel Zahradniček
2, Luboš Türkott
1,
Petr Štěpánek2, and Josef Soukup
1
1Czech University of Life Sciences Prague, Faculty of Agrobiology,
Food and Natural Resources, Department of Agroecology and Biometeorology,
Kamycka 129, 165 21 Prague 6 – Suchdol, Czech Republic
2Global Change Research Centre AS CR,
Bědila 986/4a, 603 00 Brno, Czech Republic
*Corresponding author E-mail: [email protected]
(Manuscript received in final form May 17, 2013)
Abstract–This study has, for the first time, analyzed in detail the risk occurrences of the
last spring frost, first fall frost, and the length of the frost-free period during the growing
season of vegetable crops at a high horizontal resolution of 10 km (CZGRIDS, ALADIN-
Climate/CZ) in the Elbe River lowland. The daily minimum air temperature from 116
grid points throughout the studied area for the period 1961–2011 was used. The daily
values of minimum air temperature ranges of 0 °C to −1.1 °C, −1.2°C to −2.2 °C, and
below −2.2 °C were considered to constitute mild, moderate, and severe frosts intensities,
respectively. Firstly, comprehensive analysis of the spatio-temporal variability of the date
of the last spring frost, the date of the first fall frost, and the length of the frost-free period
in the Elbe River lowland were provided. Secondly, a catalogue of the mean dates of the
spring and fall frosts for the three frost severities (mild, moderate, and severe) and
degrees of earliness (early, mean, and late ending/beginning), as well as the length of the
frost-free period over the Elbe River lowland, was developed. Thirdly, to identify the
areas with high-risk occurrences of damaging last spring frosts during the
sowing/planting period of vegetables in the Elbe River Lowland.
According to the regional catalogue of frosts, an earlier ending of spring and a later
beginning of fall frosts, simultaneous with the latest ending of the frost-free period, were
recorded during the 1990s, 2000s, and 2010s. The severe spring frosts in the period of
1981–2011 ended earlier than in the period of 1961–1980; consequently, the end of the
20th and the beginning of the 21st century are suitable periods for the growth extension of
species and varieties of vegetables with longer growing seasons and higher demands on
temperature. Whereas the latest spring frost has ended on an earlier date across the Elbe
lowland, the first frost date in the fall has generally been delayed to a later date.
Key-words: thermophilic, cold-resistant, frost-resistant vegetables, late spring frost, early
fall frost, frost-free period
Page 2
2
1. Introduction
Most of Europe experienced increases in the surface air temperature from 1901
to 2005, which amounts to a 0.9 °C increase in annual mean temperature over
the entire continent (Alcamo et al., 2007). In the mean temperature series for the
Czech Republic determined for the period 1848–2000, the significant linear
trend for the increase reached 0.69°C/100 years (Brazdil et al., 2009). In context
of global warming, Karl et al. (1993) noted an asymmetrical rise in temperature
extremes that manifests as a swifter rise in minimum temperatures than in
maxima, which resulted in a decrease in the diurnal temperature range. For
example, in Australia and New Zealand, the frequency of days below 0 °C
decreased with warming in daily minimum temperatures (Plummer et al., 1999).
Easterling et al. (2000) concluded that the number of frost days has decreased in
every country (Australia, China, central and northern Europe, New Zealand,
USA) where it has been examined.
For central Europe, Menzel et al. (2003) found a greater change in the frost-
free period, most likely also due to the greater increase in daily minimum
temperatures. Consequently, trees may not take advantage of the frost-free
period as before but may profit from a reduced risk of damage by late spring
frosts. Scheifinger et al. (2003) indicated that the occurrence date of the last
spring frost in central Europe has been increasingly early during the last few
decades.
Numerous studies have evaluated the variability in the frost events and
associated statistics (e.g., Thom, 1959; Easterling et al., 2000; Robeson, 2002;
Tait and Zheng, 2003; Menzel et al., 2003; Scheifinger et al., 2003; Rahimi et
al., 2007; Didari et al., 2012). Nearly all of the studies in the previous decades
have reported increases of the frost-free period. For example, Bootsma (1994)
and Shen et al., (2005) noticed an increased frost-free period, a later growing
season end, and an increase in growing degree days for most of Canada.
Robeson (2002) determined a trend toward earlier spring frosts in Illinois but no
consistent trends in autumn frosts.
Variations in the frost-free period length and the timing of frost events can
also be an important indicator of climatic change that may not be represented in
mean conditions (Robeson, 2002; Easterling et al., 2000). There are a large
variety of extreme events, and their impacts can be highly variable. Our research
examines the variations in the last spring frost, the first fall frost, and the frost-
free period length for the Elbe River lowland in the Czech Republic as an
indicator of climate variations in this region. Vegetable crops are the most
sensitive to the timing of extreme cold events at the beginning and end of the
growing season. Damage caused by late frosts in spring (or early frosts during
fall) is a limiting factor, particularly in the case of fruits and vegetables in
central Europe.
Page 3
3
In the Czech Republic, research focusing on the risks of late spring and
early autumn frosts and their impacts on agricultural production gained
considerable attention during the 1960s and 1970s (Stibral, 1966; Forgáč and
Molnar, 1967; Pejml, 1955, 1973). This subject has remained in the
background of interest to climatologists, although frost is one of the most
devastating weather events that diminishes agriculture productivity in the
Czech Republic.
Therefore, there were three main objectives in this study: (i) comprehensive
analysis of the spatio-temporal variability of the date of the last spring frost
(LSF), the date of the first fall frost (FFF), and the length of the frost-free period
(FFP) in the Elbe River lowland; (ii) estimation of the tendency of the last spring
frost, the first fall frost, and the length of the frost-free period; and (iii) the
evaluation of the risk occurrences of damaging last spring frosts during
sowing/planting for thermophilic, cold-resistant, and frost-resistant vegetables.
2. Methods and materials
2.1. Quality control and homogenization of gridded datasets
Monthly and daily series of temperatures (mean, minimum, and maximum),
rainfall and sunshine duration for period 1961–2011 were analyzed. A regular
gridded network with a high horizontal resolution of 10 km (CZGRIDS,
ALADIN-Climate/CZ) from the Czech Hydrometeorological Institute (CHMI)
was applied (Fig. 1a). High-density gridded datasets allow very precise and
detailed delimitation of the area in which frosts occur in comparison with the
station network datasets. The station network in the Elbe River lowland has
significantly fewer units located primarily in non-agricultural areas, and their
data series are not complete. The gridded network was created using the
technical series from 268 climatological and 784 rain-gauge stations of the
CHMI network. From these technical series, new values for the regular
10×10 km grid network (ALADIN-Climate/CZ RCM outputs) were interpolated
(Štěpánek et al. 2011a, 2011b). The spatial interpolation of the
agroclimatological characteristics ranges between longitudes 13.7°E and 16.5°E
and latitudes 49.6°N and 50.8°N. The lowest and highest altitudes of the gridded
dataset were 169 m and 573 m above sea level, respectively.
In our approach, data quality control is carried out by combining several
methods: (i) by analyzing difference series between candidate and neighbouring
stations, i.e., pairwise comparisons (ii) by applying limits derived from
interquartile ranges (this can be applied either to individual series, i.e.,
absolutely or to difference series between candidate and reference series, i.e.,
relatively), and (iii) by comparing the series values tested with “expected”
(theoretical) values – technical series created by means of statistical methods for
spatial data (e.g., IDW, kriging).
Page 4
4
4
Legend
Polabi
hydrographic network
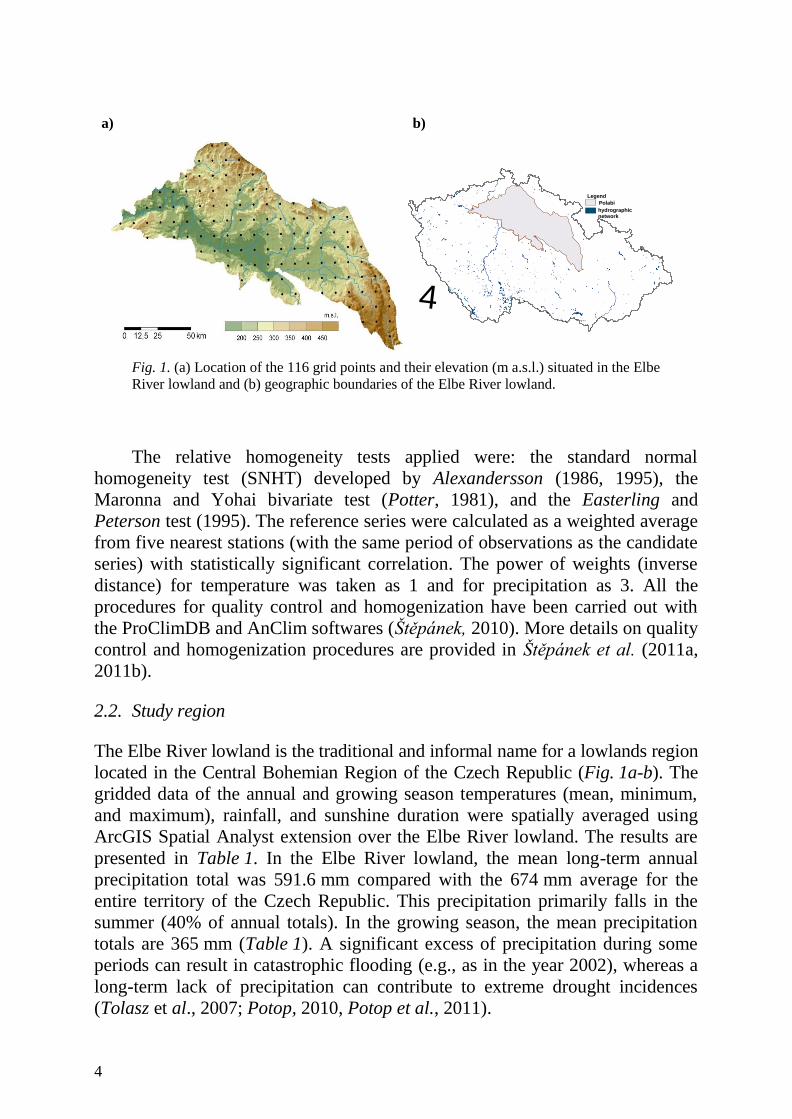
a) b)
Fig. 1. (a) Location of the 116 grid points and their elevation (m a.s.l.) situated in the Elbe
River lowland and (b) geographic boundaries of the Elbe River lowland.
The relative homogeneity tests applied were: the standard normal
homogeneity test (SNHT) developed by Alexandersson (1986, 1995), the
Maronna and Yohai bivariate test (Potter, 1981), and the Easterling and
Peterson test (1995). The reference series were calculated as a weighted average
from five nearest stations (with the same period of observations as the candidate
series) with statistically significant correlation. The power of weights (inverse
distance) for temperature was taken as 1 and for precipitation as 3. All the
procedures for quality control and homogenization have been carried out with
the ProClimDB and AnClim softwares (Štěpánek, 2010). More details on quality
control and homogenization procedures are provided in Štěpánek et al. (2011a,
2011b).
2.2. Study region
The Elbe River lowland is the traditional and informal name for a lowlands region
located in the Central Bohemian Region of the Czech Republic (Fig. 1a-b). The
gridded data of the annual and growing season temperatures (mean, minimum,
and maximum), rainfall, and sunshine duration were spatially averaged using
ArcGIS Spatial Analyst extension over the Elbe River lowland. The results are
presented in Table 1. In the Elbe River lowland, the mean long-term annual
precipitation total was 591.6 mm compared with the 674 mm average for the
entire territory of the Czech Republic. This precipitation primarily falls in the
summer (40% of annual totals). In the growing season, the mean precipitation
totals are 365 mm (Table 1). A significant excess of precipitation during some
periods can result in catastrophic flooding (e.g., as in the year 2002), whereas a
long-term lack of precipitation can contribute to extreme drought incidences
(Tolasz et al., 2007; Potop, 2010, Potop et al., 2011).
Page 5
5
Table 1. Areal averages of the basic agroclimatological characteristics determined using
ArcGIS Spatial Analyst extension over the Elbe River lowland for the period 1961–2000.
These averages are over all 116 grids (λ=13.7°E – 16.5°E; φ=49.6°N – 50.8°N, h=169 to
573 m a.s.l.)
Tmean
°C
Tmax
°C
Tmin
°C
Rainfall
mm
Sunshine
hours
Growing season
Mean 14.5 20.5 8.9 365.0 1160.0
Minimum 12.7 17.8 7.4 304.7 1002.0
Maximum 15.6 21.4 10.0 461.1 1257.6
Range 2.9 3.6 2.6 156.4 255.6
Annual
Mean 8.4 13.1 3.9 591.6 1574.2
Minimum 6.6 10.6 2.6 460.5 1327.2
Maximum 9.4 14.0 4.9 849.7 1730.3
Range 2.8 3.4 2.3 389.2 403.1
The annual mean temperature (Tmean) at the Elbe River lowland and in the
country is 8.4 °C and 7.5 °C, respectively. The mean temperature during the
growing season is 14.5 °C. The mean annual maximum (Tmax) and minimum
(Tmin) temperatures are 13.1 °C and 3.9 °C, respectively. The average Tmax and
Tmin during the growing season are 20.5 °C and 8.9 °C, respectively. The mean
annual sunshine totals reach 1574.2 hours, whereas, in the growing season, the
total is 1160 hours (Table 1).
The Tmean during the growing season ranges between 12.7 °C and 15.6 °C.
The majority of the Elbe River lowland area had Tmean values from 14.5 °C to
15.0 °C. In terms of the mean Tmin, the lowest values (less than 7.5 °C) were
centered in the northern part of the Elbe River lowland, which has an altitude
higher than 450 m (Fig. 2a). The mean Tmin varies from 7.4 °C to 10.0°C over
the Elbe River lowland territory. The mean Tmax during the growing season
ranged between 17.6 °C and 21.4 °C, while a small area had Tmax values less
than 18.5 °C (Fig. 2b). The mean precipitation total in the growing season
fluctuates between 304 and 461 mm, but in a large portion of the Elbe River
lowland, total precipitation is less than 350 mm. The mean sunshine duration
total ranges from 1000 to 1257 hours, but the maximum value is received in the
central portion of the Elbe River lowland. The warmest and longest duration of
sunshine and the lowest precipitation totals during the growing season occur in
the middle to lower reaches of the Elbe River, between Poděbrady and
Litoměřice. As a practical recommendation, the authors suggest that this region
may be suitable for cultivation of thermophile vegetable crops in combination
with an irrigation system that would assure the qualitative yields (Potop et al.,
2012; Potop et al., 2013).
Page 6
6
a)
b)
Fig. 2. Spatial distribution of the minimum (a) and maximum (b) temperatures during the
growing season (April-September) for the period 1961–2000 over the Elbe River lowland.
2.3. Determining the dates of the last spring first fall frosts, and the length of the
frost-free period
The daily minimum air temperature from 116 grid points throughout the
studied area for the period 1961–2011 was used (Fig. 1a). For each grid point
and for each year, the first and the last frost day and the frost-free period (i.e.,
the number of consecutive days from the date of the last frost with minimum
air temperature greater than 0 °C) were identified. The LSF day is defined as
the last date in a year on or before July 15 on which the daily minimum
temperature Tmin ≤ 0°C. The FFF day is defined as the first date in a year after
July 16 on which Tmin ≤ 0°C. The FFP is the number of days between the LSF
and FFF.
The three degrees of frost severity were defined with regard to the
physiological requirements of the vegetable types. The daily values of minimum
air temperature ranges of 0 °C to −1. 1°C, −1.2 °C to −2.2 °C, and below
−2.2 °C were considered to constitute mild, moderate, and severe frosts
intensities, respectively (WMO, 1963). Using these definitions, the last three
spring and first three fall frosts were specified for the spring and fall of each
year. After determining the frost dates, it was necessary to transform them into a
form that we could analyse statistically. For this purpose, Julian days (calendar
days of the year) were used. These values were statistically processed, and we
identified the mean, standard deviation, latest occurrence, earliest occurrence,
and the length of the frost-free period. The extreme values were the latest
beginning/ending, the earliest beginning/ending of spring and fall frosts and the
shortest/longest FFP. The ending of the spring frost and beginning of the fall
frost were classified into three categories: early, mean, and late. In this study,
percentiles of date of spring and fall frosts for the fitted Gaussian distribution
from 25 to 75% correspond to mean date of beginning/ending of frosts,
Page 7
7
percentiles less than 25% are qualified as early date, and percentiles above 75%
correspond to late date (Table 2).
Table 2.Classification of the timing of ending of the spring frost and beginning of the fall
frost. The units used are Julian days
Categories
Percentile
%
Last
mild
spring frost
Last
moderate
spring frost
Last
severe
spring frost
First
mild
fall frost
First
moderate
fall frost
First
severe
fall frost
early < 25 < 102 < 92 < 86 < 284 < 290 < 294
mean 25–75 102–121 92–113 86–111 284–303 290–313 294–317
late >75 >121 >113 >111 >303 >313 >317
3. Results and discussion
3.1. Statistical characteristics of the variability of frost series from 116 grid points
The mean, standard deviation, latest and earliest occurrence of the LSF and FFF,
and length of the FFP are given in Table 3. The mean date of occurrence of the
last mild spring frosts in the Elbe River lowland is on day 112 (April 22). The
mean dates of the last spring frost with moderate and severe intensity were April
13 and April 8, respectively. The earliest last mild spring frost occurred on day
74 (March 15) in the period 1961–2011. The latest mild frosts occurred on day
164 (June 13). According to these results, the highest risk for field vegetables is
a late spring frost.
Table 3. Statistical characteristics of the average frost series (at 116 grid points) of the
studied area. The units used are dates and Julian days
Last
mild
spring frost
Last
moderate
spring frost
Last
severe
spring frost
First
mild
fall frost
First
moderate
fall frost
First
severe
fall frost
Frost-
free
period
mean 112
(Apr 22)
103
(Apr 13)
98
(Apr 8)
293
(Oct 20)
302
(Oct 29)
305
(Nov 1) 180
STDev 15 16 14 15 17 16 25
earliest 74
(Mar 15)
59
(Feb 28)
65
(Mar 6)
260
(Sep 17)
270
(Sep 27)
276
(Oct 3) 93
latest 164
(Jun 13)
135
(May 15)
125
(May 5)
329
(Nov 25)
344
(Dec 10)
345
(Dec 11) 284
Page 8
8
The earliest first mild fall frosts occurred on September 17, and the latest
onset was November 25. Frosts with higher intensity occurred later, and the
earliest beginnings of the moderate and severe frosts were on September 27 and
October 3, respectively, whereas the latest onsets of moderate and severe frosts
fell in the winter period on December 10 and 11, respectively. In the studied
region, there were years with a possible extension of the growing season for
frost-resistant vegetables, allowing distribution of the harvest. From the
climatological point of view, this phenomenon indicates a delay in the onset of
winter. The average length of the frost-free period was 180 days, almost half of
the year.
3.2. Temporal evaluation of the frosts characteristic
3.2.1. Date of the last spring frost
Catalogues of the spring and fall frost dates of the three severities (mild,
moderate, and severe), degrees of earliness (early, mean, and late
ending/beginning), and the lengths of the frost-free periods were developed
(Table 4). According to the timing (Table 2), the ending of the LSF and the
beginning of the FFF, we can divide the earliness into three categories: early,
mean, and late ending (beginning) to evaluate the impact of frost on the
production of vegetables, where the highest risk is a late spring ending and early
fall beginning of frosts. The mean dates of spring and fall frosts for three frost
severities (mild, moderate, and severe) and earliness (early, mean, and late
ending/beginning) and the length of the frost-free period was averaged over the
Elbe River lowland for the period 1961–2011 (Table 4). As shown in Table 4, in
the last two decades, the last mild spring frosts were concentrated into categories
of early and mean ending, whereas in May they did not occur. Conversely, in the
period from 1961 to 1980, the majority of cases were recorded in the mean and
late ending categories of LSF. We observed that in the coolest decade of the
1970s (the lowest negative deviation of mean temperature since 1961), the
majority of LSF and FFF events were concentrated in the late ending category.
In this respect, the regional average of the late ending of mild spring frosts
occurred in the first half of May in five consecutive years (1976, 1977, 1978,
1979, and 1980). At the same time, the years of 1977, 1979, and 1980 had
shorter frost-free periods of 143, 152, and 156 days, respectively. Moreover, an
extreme year in terms of the termination of the spring frost was 1976 with the
latest end of the mild (May 4), moderate (April 25), and severe (April 30) frosts.
This year, however, had an average length of the frost-free period (177 days),
which was caused by the delayed onset of mild (October 30), moderate
(November 17), and severe (November 26) fall frosts. The exceptionality of this
year was also confirmed by a persistent extreme summer drought, and as a
result, the yield was reduced for all vegetable types as well as for cereals in the
Page 9
9
Czech Republic and central Europe (Potop et al., 2011; Potop et al., 2012;
Potop, 2013).
Table 4. Mean dates of spring and fall frosts for three frost severities (mild, moderate, and
severe) and earliness (early, mean, and late ending/beginning) and the length of frost-free
period over the Elbe River lowland (1961–2011)
Frost-free
Early Mean Late Early Mean Late Early Mean Late period,
daysEarly Mean Late Early Mean Late Early Mean Late
1961 1 Apr 28 Mar 18 Mar 217 5 Nov 21 Nov 20 Nov
1962 28 Apr 22 Apr 9 Apr 173 19 Oct 25 Oct 26 Oct
1963 28 Apr 17 Apr 8 Apr 169 14 Oct 23 Oct 9 Nov
1964 23 Apr 2 Apr 27 Mar 167 8 Oct 25 Oct 1 Nov
1965 28 Apr 3 Apr 29 Mar 166 12 Oct 15 Oct 18 Oct
1966 11 Apr 2 Apr 28 Mar 202 30 Oct 3 Nov 31 Oct
1967 28 Apr 19 Apr 4 Apr 177 23 Oct 4 Nov 14 Nov
1968 17 Apr 10 Apr 14 Apr 194 28 Oct 24 Oct 2 Nov
1969 18 Apr 17 Apr 21 Apr 178 15 Oct 12 Nov 7 Nov
1970 1 May 18 Apr 7 Apr 147 26 Sep 15 Oct 8 Nov
1971 29 Apr 20 Apr 13 Apr 149 26 Sep 9 Oct 7 Oct
1972 10 Apr 10 Apr 26 Apr 180 8 Oct 11 Oct 7 Oct
1973 6 May 20 Apr 9 Apr 161 15 Oct 24 Oct 13 Oct
1974 22 Apr 2 Apr 18 Apr 171 11 Oct 26 Oct 5 Nov
1975 25 Apr 8 Apr 30 Mar 172 15 Oct 29 Oct 28 Oct
1976 4 May 25 Apr 30 Apr 177 30 Oct 17 Nov 26 Nov
1977 12 May 24 Apr 19 Apr 143 3 Oct 25 Oct 24 Nov
1978 4 May 3 May 13 Apr 176 28 Oct 5 Nov 13 Nov
1979 7 May 6 May 3 Apr 152 7 Oct 15 Oct 18 Oct
1980 12 May 7 May 26 Apr 156 15 Oct 23 Oct 28 Oct
1981 30 Apr 24 Apr 20 Apr 176 24 Oct 3 Nov 9 Nov
1982 30 Apr 26 Apr 20 Apr 182 30 Oct 8 Nov 6 Nov
1983 9 Apr 2 Apr 28 Mar 190 17 Oct 28 Oct 28 Oct
1984 26 Apr 20 Apr 19 Apr 184 28 Oct 13 Nov 29 Nov
1985 25 Apr 11 Apr 16 Apr 179 22 Oct 21 Oct 24 Oct
1986 3 Apr 4 Apr 14 Apr 190 11 Oct 31 Oct 18 Nov
1987 24 Apr 8 Apr 27 Mar 184 26 Oct 4 Nov 3 Nov
1988 22 Apr 15 Apr 25 Apr 190 29 Oct 30 Oct 27 Oct
1989 10 Apr 30 Mar 23 Mar 190 18 Oct 7 Nov 16 Nov
1990 26 Apr 5 Apr 11 Apr 183 27 Oct 31 Oct 26 Oct
1991 6 May 21 Apr 13 Apr 167 21 Oct 27 Oct 23 Oct
1992 16 Apr 14 Apr 13 Apr 179 13 Oct 16 Oct 12 Oct
1993 11 Apr 8 Apr 10 Apr 187 16 Oct 18 Oct 27 Oct
1994 22 Apr 11 Apr 4 Apr 167 8 Oct 12 Oct 7 Oct
1995 28 Apr 9 Apr 1 Apr 180 26 Oct 25 Oct 30 Oct
1996 18 Apr 16 Apr 11 Apr 200 4 Nov 5 Nov 20 Nov
1997 24 Apr 20 Apr 23 Apr 170 12 Oct 21 Oct 20 Oct
1998 11 Apr 2 Apr 6 Apr 199 28 Oct 6 Nov 12 Nov
1999 15 Apr 14 Apr 28 Mar 186 19 Oct 26 Oct 21 Oct
2000 4 Apr 3 Apr 16 Mar 210 31 Oct 28 Nov 18 Nov
2001 16 Apr 14 Apr 2 Apr 208 10 Nov 11 Nov 7 Nov
2002 8 Apr 6 Apr 10 Apr 194 21 Oct 3 Nov 4 Nov
2003 14 Apr 5 Apr 12 Apr 180 12 Oct 19 Oct 17 Oct
2004 18 Apr 9 Apr 19 Mar 187 23 Oct 20 Oct 24 Oct
2005 28 Apr 10 Apr 22 Apr 190 5 Nov 11 Nov 22 Oct
2006 11 Apr 4 Apr 6 Apr 197 27 Oct 31 Oct 30 Oct
2007 28 Apr 17 Apr 9 Apr 176 22 Oct 15 Oct 6 Nov
2008 13 Apr 12 Apr 30 Mar 192 23 Oct 4 Nov 7 Nov
2009 2 Apr 27 Mar 26 Mar 205 25 Oct 2 Nov 20 Nov
2010 18 Apr 10 Apr 28 Mar 175 11 Oct 15 Oct 23 Oct
2011 29 Apr 28 Apr 5 Apr 171 19 Oct 17 Oct 20 Oct
Mild autumn frost Moderate autumn frost Severe autumn frost
Year
Mild spring frost Moderate spring frost Severe spring frost
Page 10
10
As we approach summer, the risk of the last spring frosts occurring after
May 15 decreases. Extremely late occurrences of moderate spring frosts,
reaching up to the month of June, were observed in 1975 and 1977 (June 6)
and 1962 (June 3) (not shown). Severe frosts in June with intensities greater
than –2.2 °C did not occur in any of the grid points during the entire study
period.
3.2.2. Date of the first fall frost and the length of the frost-free period
The late onset of fall frosts extends the growing season of field vegetables. The
longest lasting FFPs occurred in 1961 (217 days), 2000 (210 days), and 2009
(205 days) (Table 4). The shortest lasting FFPs occurred in 1977 (143), 1970
(147), and 1971 (149) (Table 4). In these years, the early beginnings of the mild
fall frosts were on September 26. From 1970–1980, there were 6 years recorded
with early beginnings of mild fall frosts, 4 years with early beginnings of
moderate and severe frosts, and 9 years where the length of FFP was below
average (180 days). According to the timing of frosts in 1980–1990, a mean fall
frost beginning prevailed for all intensities, except for 1986, when mild frosts
occurred on October 11 (early category) (Table 4). However, the severe fall
frosts in 1986 had a late onset 38 days later (November 18). Usually, the first
severe and moderate fall frosts occur closer to winter, after the mild ones. The
period of the 1990s had a large number of years in which the severe fall frosts
began earlier than mild frosts. In 1994, the FFP ended earlier due to the early
beginning of the severe fall frosts (October 7), which occurred the day before
the first mild frost. Similarly, in 1992, the severe fall frosts began on
October 12, and the mild frosts began on October 13 (Table 4). In the first
decade of the 21st century, such a situation occurred in 2001, when the severe
fall frosts began approximately three days earlier than the mild frosts. This year
also had the latest ending of the FFP (208 consecutive days, from April 10 to
November 10) for the entire study period. The years with sudden
commencement of the severe fall frosts are associated with the occurrence of an
uncharacteristic synoptic situation for the fall season. The years 2010 and 2011
had an early beginning of fall frosts that occurred during the harvest period of
root vegetables (Table 4).
An early ending of spring, together with the late onset of fall frosts in, e.g.,
1961 (November 5) and 2000 (October 31), provides suitable conditions for
sowing/planting of field vegetables, as well as their ripening and harvesting.
However, our regional average frost date series suggests that the FFP exhibits a
large amount of interannual variability, and it is also apparent that the region’s
average FFP has lengthened over the preceding two decades.
Page 11
11
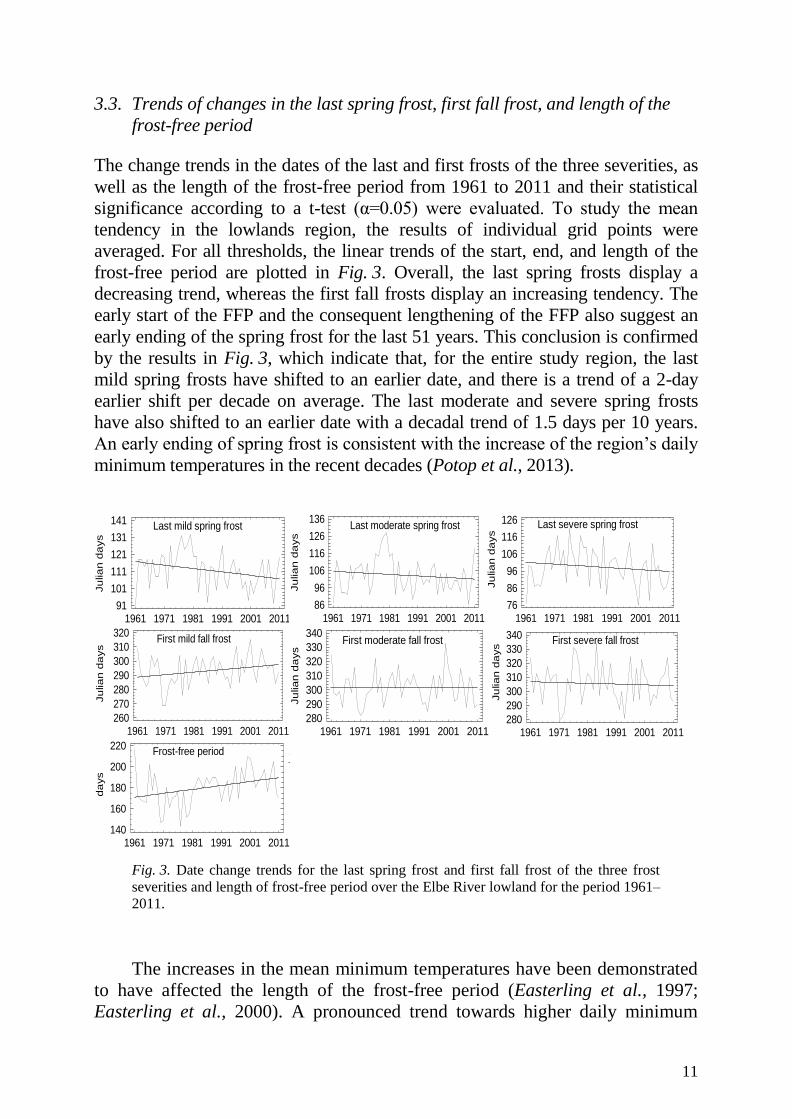
3.3. Trends of changes in the last spring frost, first fall frost, and length of the
frost-free period
The change trends in the dates of the last and first frosts of the three severities, as
well as the length of the frost-free period from 1961 to 2011 and their statistical
significance according to a t-test (α=0.05) were evaluated. To study the mean
tendency in the lowlands region, the results of individual grid points were
averaged. For all thresholds, the linear trends of the start, end, and length of the
frost-free period are plotted in Fig. 3. Overall, the last spring frosts display a
decreasing trend, whereas the first fall frosts display an increasing tendency. The
early start of the FFP and the consequent lengthening of the FFP also suggest an
early ending of the spring frost for the last 51 years. This conclusion is confirmed
by the results in Fig. 3, which indicate that, for the entire study region, the last
mild spring frosts have shifted to an earlier date, and there is a trend of a 2-day
earlier shift per decade on average. The last moderate and severe spring frosts
have also shifted to an earlier date with a decadal trend of 1.5 days per 10 years.
An early ending of spring frost is consistent with the increase of the region’s daily
minimum temperatures in the recent decades (Potop et al., 2013).
Fig. 3. Date change trends for the last spring frost and first fall frost of the three frost
severities and length of frost-free period over the Elbe River lowland for the period 1961–
2011.
The increases in the mean minimum temperatures have been demonstrated
to have affected the length of the frost-free period (Easterling et al., 1997;
Easterling et al., 2000). A pronounced trend towards higher daily minimum
Last mild spring frost
Ju
lian d
ays
1961 1971 1981 1991 2001 201191
101
111
121
131
141 Last moderate spring frost
Ju
lia
n d
ays
1961 1971 1981 1991 2001 201186
96
106
116
126
136 Last severe spring frost
Ju
lia
n d
ays
1961 1971 1981 1991 2001 201176
86
96
106
116
126
First mild fall frost
Ju
lia
n d
ays
1961 1971 1981 1991 2001 2011260
270
280
290
300
310
320First moderate fall frost
Ju
lia
n d
ays
1961 1971 1981 1991 2001 2011280
290
300
310
320
330
340First severe fall frost
Ju
lian d
ays
1961 1971 1981 1991 2001 2011280
290
300
310
320
330
340
Frost-free period
da
ys
1961 1971 1981 1991 2001 2011140
160
180
200
220
Page 12
12
temperatures can be observed, often coincidently with a decrease of the number
of frost days over central Europe (Scheifinger et al., 2003; Menzel et al. 2003),
Australia, and New Zealand (Plummer et al., 1999), the US (Feng and Hu,
2004) and large portions of the Earth’s continents (Easterling et al., 1997).
Whereas the latest spring frost has ended on an earlier date across the Elbe
lowland, the first frost date in the fall has generally been delayed to a later date
(Fig. 3). The delay of the first fall frost date exhibits a trend of 1.8 days per 10
years. There has been a general increase in the length of the frost-free period.
The FFP is lengthening by up to 3.7 days per 10 years on average. The trend for
the frost-free season displays two distinct periods: a shortening of the FFP in the
1960s and an intensified lengthening of the FFP since the 1980s. These changes
are consistent with the global, European, and national temperature changes. For
the first period, including the 1960s–1970s, the temperatures do not exhibit
conspicuous changes, whereas in the second, beginning with the 1980s,
significant warming is evident (Brazdil et al., 2009).
The lengthening FFP in lowlands was primarily a result of an earlier start
of the growing season. The consequences to agriculture from these changes
include a reduced risk of spring and fall frost damage to crops and a lengthened
growing season for vegetable crops. The earlier LSF implies that consecutive
warm days in the spring occur earlier and, hence, allow spring melts to occur
earlier too. These conditions raise soil temperature earlier for seed germination
and, thus, reduce the frost risk for spring crops. The delay of consecutive cold
days in the fall improves the chances for crops to mature to a higher-quality
yield (Shen et al., 2005).
These changes in the last spring and the first fall frosts are also in general
agreement with those in Feng and Hu (2004), Menzel et al. (2003), and Shen et
al., (2005). For example, in Germany (1951–2000), the dates of the last spring
frost have advanced by 0.24 days per year on average. The respective fall dates
are delayed up to 0.25 days per year, whereas the frost-free period is lengthening
by up to 0.49 days per year (Menzel et al., 2003).
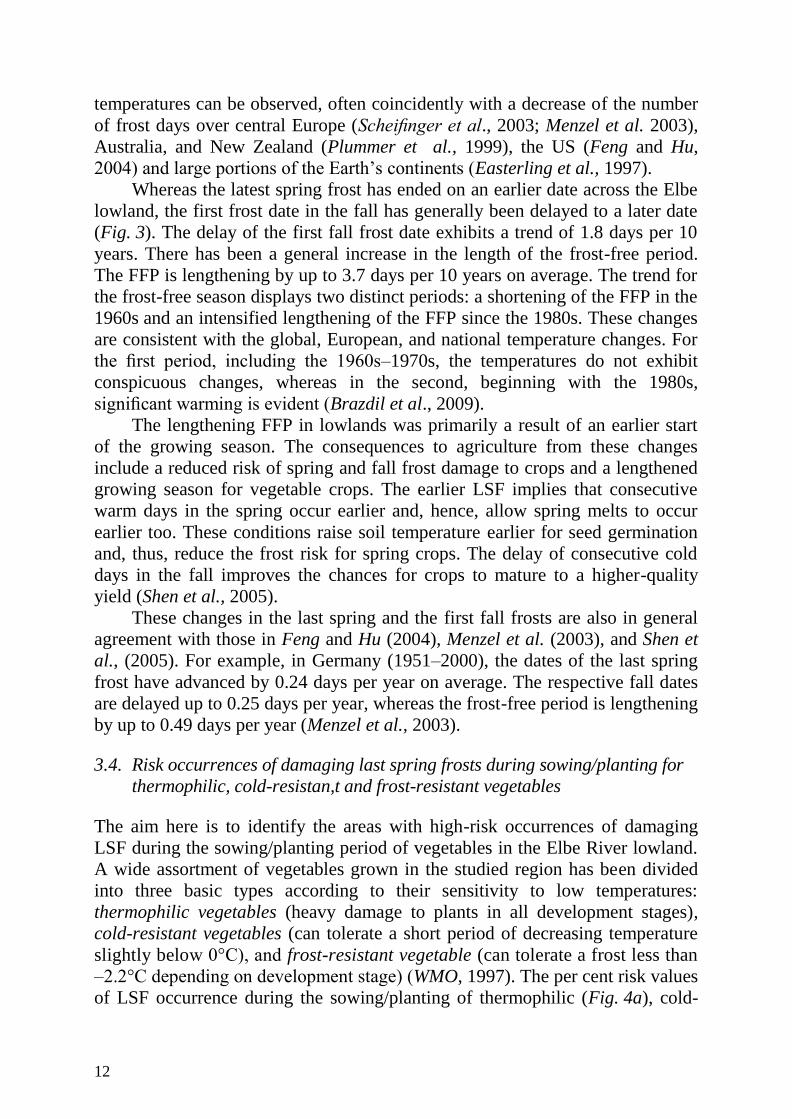
3.4. Risk occurrences of damaging last spring frosts during sowing/planting for
thermophilic, cold-resistan,t and frost-resistant vegetables
The aim here is to identify the areas with high-risk occurrences of damaging
LSF during the sowing/planting period of vegetables in the Elbe River lowland.
A wide assortment of vegetables grown in the studied region has been divided
into three basic types according to their sensitivity to low temperatures:
thermophilic vegetables (heavy damage to plants in all development stages),
cold-resistant vegetables (can tolerate a short period of decreasing temperature
slightly below 0°C), and frost-resistant vegetable (can tolerate a frost less than
–2.2°C depending on development stage) (WMO, 1997). The per cent risk values
of LSF occurrence during the sowing/planting of thermophilic (Fig. 4a), cold-
Page 13
13
resistant (Fig. 4b), and frost-resistant vegetables (Fig. 4c) in the Elbe River
lowland for the period 1961–2011 are given in Table 5 and Fig. 4. According to
the per cent values for frost occurrences, four types of frost risk areas were
defined: low, moderate, high, and critical (Fig. 4).
(a)
(b)
(c)
Fig. 4. Frost risk maps for last spring frosts during sowing/planting of thermophilic (a), cold-
resistant (b), and frost-resistant (c) vegetables over the Elbe River lowland (1961–2011). Red
indicates critical-risk areas, pink indicates high-risk areas, orange indicates moderate-risk
areas and yellow indicates low-risk areas.
Page 14
14
Table 5. Risk occurrences (%) of the last spring frosts during sowing/planting of
thermophilic, cold-resistant, and frost-resistant vegetables in the Elbe River lowland
(1961–2011)
Altitude
m a.s.l.
Thermophilic
tmin <–0.1 after May 15
Cold-resistant
tmin <–2.2 after April 15
Frost-resistant
tmin <–2.2 after April 1
mean min max mean min max mean min max
below 250 4.5 0 15.4 30.6 19.2 48.1 56.9 38.5 73.1
251–300 11.3 0 38.5 41 15.4 82.7 67.4 40.4 94.2
above 300 15.4 1.9 34.6 46.2 32.7 67.3 74.3 61.5 90.4
Thermophilic vegetables (e.g., tomato, pepper, pumpkins, and cucumber)
from an agronomic point of view should be planted before May 15, considering
risk (Maly et al., 1998). The critical temperature after May 15 for thermophilic
vegetables is Tmin ≤ – 0.1°C (Table 5). In areas with an altitude below 250 m,
the risk of critical temperature occurrence is as high as 4.5%; at altitudes from
251 to 300 m, the risk is as high as 11.3%; and at altitudes above 300 m, the risk
is as high as 15.4% (Table 5). The risk level of frost after May 15 in the
traditional grown vegetable regions (up to 250 m) is low (Fig. 4a). At higher
altitudes (251–300 m), areas with zero incidences of negative temperatures were
found, which may allow for the possible expansion of thermophilic vegetable
growth. The critical and high risks after May 15 are related to high altitudes in
the region (higher than 300 m) and frost hollows, whereas low frost risk is
observed in the lower areas (lower than 250 m) (Fig. 4a).
During the sowing/planting of cold-resistant vegetables (e.g., early
kohlrabi, summer savoy cabbage, late cauliflower, late cabbage, late carrots, and
celeriac), a severe LSF after April 15 has occurred every second year at higher
altitudes. The risk levels for severe LSF occurrence (up to 250 m) are moderate
(30.6%) at lower altitudes and high (46.2%) at higher altitudes (Table 5). Most
vegetable growing areas fall within the low and moderate risk categories for
severe spring frosts (Fig. 4b). It will be possible to extend the areas suitable for
the growing of cold-resistant vegetables (i.e., mostly Brassicas) towards the
north-east in the middle Elbe lowland.
Typically, the date of planting/sowing of frost-resistant vegetables (e.g.,
onion, root parsley) in the Czech Republic corresponds with the end of March,
and a gradual shift occurs from the hottest regions of south Moravia towards the
Elbe region. Fig. 4c defines two main areas with a low risk of severe frosts after
April 1. The occurrence of severe frosts during the planting of frost-resistant
vegetables in the growing area of the Elbe lowland is, on average, 56.9%
(Table 5). It follows that, despite the considerable resistance of these vegetables
to low temperatures, it is necessary to choose lands with southern exposure (or
cover plants with non-woven textile). Utilizing resistant varieties and hardening
seedlings before planting are advisable.
Page 15
15
4. Summary and conclusions
This study has, for the first time, analyzed in detail the risk occurrences of the
last spring frost, first fall frost, and the length of the frost-free period during the
growing season of vegetable crops at a high horizontal resolution of 10 km in
the Elbe River lowland. The main results for the period of 1961–2011 can be
summarized as follows:
(i) The most frosts occurring during the vegetable growing season are the
spring frosts in the last third of April. According to the frost series averaged
over the Elbe River lowland region, the earliest and latest dates of the
spring frost range have been March 15 and May 27, respectively. The
earliest and latest dates of the fall frost range have been September 17 and
November 25, respectively. The latest endings of the spring frost were
recorded in 1973 (May 6), 1976 (May 4), 1977 (May 12), 1978 (May 4),
1979 (May 7), 1980 (May 12) and 1991 (May 6). Conversely, the earliest
beginnings of the first frost were in 1970 and 1971 (September 26).
(ii) A catalogue of the mean dates of the spring and fall frosts for the three frost
severities (mild, moderate, and severe) and degrees of earliness (early,
mean, and late ending/beginning), as well as the length of the frost-free
period over the Elbe River lowland, was developed. According to the
regional catalogue of frosts, an earlier ending of spring and a later
beginning of fall frosts, simultaneously with the latest ending of the frost-
free period, were recorded during the 1990s, 2000s, and 2010s. The
shortest frost-free periods were recorded in 1961–1970 and 1971–1980.
The severe spring frosts in the period of 1981–2011 ended earlier than in
the period, of 1961–1980; consequently, the end of the 20th and the
beginning of the 21st century are suitable periods for the growth extension
of species and varieties of vegetables with longer growing seasons and
higher demands on temperature. These results agree with other studies
conducted at a European scale (Menzel et al., 2003, Scheifinger et al.,
2003).
(iii) The real risk of late frost damage for vegetable crops have been lower
during the last three decades (1990s, 2000s, and 2010s) than estimated in
the previous decades (1970s and 1980s). These results corroborate other
research, indicating that spring frost is a critical period for detecting recent
climatic changes and their impacts (Robeson, 2002; Easterling et al., 2000;
Scheifinger et al., 2003).
Acknowledgements: This research was supported by S grant of MSMT CR and projects 6046070901
and CZ.1.07/2.3.00/20.0248.
Page 16
16
References
Alcamo, J., Moreno, J.M., Nováky, B., Bindi, M., Corobov, R., Devoy, R.J.N., Giannakopoulos, C., Martin,
E., Olesen, J.E. and Shvidenko, A., 2007: Europe. In: Parry, M.L., Canziani, O.F., Palutikof, J.P., van
der Linden, P.J., Hanson, C.E. (Eds.), Climate Change 2007: Impacts, Adaptation and Vulnerability.
Contribution of Working Group II to the Fourth Assessment Report of the Intergovernmental Panel
on Climate Change. Cambridge University Press, Cambridge, UK, 541–580.
Alexandersson, A., 1986: A homogeneity test applied to precipitation data. J. Climatol. 6, 661–675.
Alexandersson, A., 1995: Homogenity testing, multiple breaks and trends. In: Proc. 6th Int. Meeting on
Stat. Climatology, Galway, Ireland. 439–441.
Brazdil, R., Chroma, K., Dobrovolny, P. and Tolasz, R., 2009: Climate fluctuations in the Czech Republic
during the period 1961-2005. Int. J. Climatol. 29, 223–242.
Bootsma, A., 1994: Long term (100yr) climatic trends for agriculture at selected locations in Canada.
Climatic Change 26, 65–88.
Didari, S., Zand-Parsa, S., Sepaskhah A.R., Kamgar-Haghighi, A.A. and Khalili, D., 2012: Preparition of
frost atlas using different interpolation methods in a semiarid region of south of Iran. Theor. Appl.
Climatol. 108,159–171.
Easterling, D.R. and Peterson, T.C., 1995: A new method for detecting undocumented discontinuities in
climatological time series. Int. J. Climatol. 15, 369–377.
Easterling, D.R., Horton, B., Jones P.D., Peterson, T.C., Karl, R.R., Parker, D.E., Salinger, M.J.,
Razuvayev, V., Plummer N., Jamason, P. and Folland C.K., 1997: Maximum and minimum
temperature trends for the globe. Science 277, 364–367.
Easterling, D.R., Evans, J.L., Groisman, P.Y.A., Karl, T.R., Kunkel, K.E. and Ambenje, P., 2000: Observed
variability and trends in extreme climate events: a brief review. B. Am. Meteorol. Soc. 81, 417–425.
Forgač, P. and Molnar, F., 1967: Spring frost in Western Slovakia region. In: Proccedings of HMÚ,
Bratislava: SHMU, 9, 31–86.
Feng, S. and Hu, Q., 2004: Changes in agro-meteorlogoical indicators in the contiguous United States:
1950-2000. Theor. Appl. Climatol. 78, 247–264.
Karl T.R., Knight R.W., Gallo, K.P. and Peterson T.C. 1993: A New Perspective on Recent Global
Warming: Asymmetric Trends of Daily Maximum and Minimum Temperature. B. Am. Meteorol.
Soc. 74, 1007–1023.
Maly, I., Bartos, J., Hlusek, J., Kopec, K., Petrikova, K., Rod, J. and Spistitz, P., 1998: Field Vegetable
Growing. Prague, Czech Republic. Agrospoj 64. (in Czech)
Menzel, A., Gert, J., Rein, A., Helfried, S. and Nicole, E. 2003: Variations of the climatological growing
season (1951–2000) in Germany compared with other countries. Int. J. Climatol. 23, 793–812.
Pejml, K., 1955: Development and current status of predictions night frosts during the growing season.
Meteorol. B. 8, 8–42. (in Czech)
Pejml, K., 1973: Secular evolution of frequency and intensity of spring frosts. In: Proceedings of
HMÚ. 19, 8–42. (in Czech)
Plummer, N., Salinger, M.J., Nicholls, N., Suppiah, R., Hennessy, K.H., Leighton, R.M., Trewin, B., Page,
Ch.M. and Lough, J.M., 1999: Changes in climates extremes over the Australian region and New
Zealand during the Twentieth Century. Climatic Change 42, 183–202.
Potter, K.W., 1981: Illustration of a New Test for Detecting a Shift in Mean in Precipitation Series. Mon.
Weather Rev. 109, 2040–2045.
Potop, V., 2010: Temporal variability of daily climate extremes of temperature and precipitation in the
middle Polabí (Elbeland) lowland region. Scientia Agriculturae Bohemica. 41, 140–148.
Potop, V., Koudela, M. and Možný, M., 2011: The impact of dry, wet and heat episodes on the production
of vegetable crops in Polabí (River Basin). Scientia Agriculturae Bohemica. 42, 93–101.
Potop, V., Možný, M. and Soukup, J., 2012: Drought evolution at various time scales in the lowland regions
and their impact on vegetable crops in the Czech Republic. Agr. Forest Meteorol. 156, 121–133.
Potop, V., 2013: The evolution of the assortment and yield of vegetable crops in relation to climate in
Polabí. In Proceedings of influence of abiotic and biotic stresses on properties of plants 2013. Praha
13.–14.2.2013, 198–201. (in Czech)
Page 17
17
Potop, V., Türkott, L., Zahradníček, P. and Štěpánek, P., 2013: Evaluation of agro-climatic potential of
Bohemian plateau (České tabule) for growing vegetables. Meteorol. B.. 66, 42–48. (in Czech)
Rahimi, M., Hajjam, S., Khalili, A., Kamalid, G.A. and Stigter, C.J., 2007: Risk analysis of first and last
frost occurrences in the Central Alborz Region, Iran. Int. J.f Climatol. 27, 349–356.
Robeson, S.M., 2002: Increasing growing-season length in Illinois during the 20th century. Climatic
Change 52, 219–238.
Shen, S. S. P., Yin, H., Cannon, K., Howard A., Chetner S. and Karl, T.R., 2005: Temporal and Spatial
Changes of the Agroclimate in Alberta, Canada, from 1901 to 2002. J. Appl. Meteorol. 44, 1090–
1105.
Scheifinger, H., Menzel, A., Koch, E. and Peter, Ch., 2003: Trends of spring time frost events and
phenological dates in Central Europe. Theor. Appl. Climatol. 74, 41–51.
Stibral, J., 1966. Frequency of frosts during flowering apple trees. Meteorol. B. 19, 177–179. (in Czech) Štěpánek, P. 2010: ProClimDB – software for processing climatological datasets. CHMI, regional office Brno.
http://www.climahom.eu/ProcData.html
Štěpánek, P., Zahradníček, P., Brazdil, R. and Tolasz, R., 2011a: Methodology of data quality control and
homogenization of time series in climatology. Praha. 118.
Štěpánek, P., Zahradníček, P. and Huth, R., 2011b: Interpolation techniques used for data quality control
and calculation of technical series. An example of Central European daily time series. Időjárás 115,
87–98.
Tait, A. and Zheng, X. 2003: Mapping frost occurrence using satellite data. J. Appl. Meteorol. 42, 193–203.
Tolasz, R., Brazdil, R., Bulir, O., Dobrovolny, P., Dubrovsky, M., Hajkova, L., Halasova, O., Hostynek, J.,
Janouch, M., Kohut, M., Krska, K., Krivancova, S., Kveton, V., Lepka, Z., Lipina, P., Mackova, J.,
Metelka, L., Mikova, T., Mrkvica, Z., Mozny, M., Nekovar, J., Nemec, L., Pokorny, J., Reitschlager,
J.D., Richterova, D., Roznovsky, J., Repka, M., Semeradova, D., Sosna, V., Striz, M., Serlc, P.,
Skachova, H., Stepanek, P., Stepankova, P., Trnka, M., Valerianova, A., Valter, J., Vanicek, K.,
Vavruska, F., Vozenilek, V., Vrabik, T., Vysoudil, M., Zahradnicek, J., Zuskova, I., Zak, M. and
Zalud, Z., 2007: Atlas podnebí Česka. Climate Atlas of Czechia. ČHMÚ Praha, Univerzita
Palackého v Olomouci, Praha-Olomouc, 254.
Thom, H.C.S., 1959: The distribution of freeze-date and freeze-free period for climatological series with
freeze less years. Mon. Weather Rev. 87, 136–144.
WMO, 1963. Protection Against Frost Damage, WMO-No. 133. WMO, Geneva, Switzerland.
WMO, 1997. Definition of agrometeorological information required for vegetable crops. WMO-No. 866.
WMO, Geneva, Switzerland. 110.