15
IEE 505 – Information Management Systems Final Project Report Environmental Pollution Tracker Submitted By – Amit Shinde Mayur Dharwadkar Prashanth Acharya Priyesh Pradhan Shilpa Madhavan
IEE 505 – Information Management Systems
Final Project Report
Environmental Pollution Tracker
Submitted By –
Amit Shinde
Mayur Dharwadkar
Prashanth Acharya
Priyesh Pradhan
Shilpa Madhavan
Contents
1. Going Green ........................................................................................................................................................3
2. Management Information System .....................................................................................................................4
3. Objectives and Goals ..........................................................................................................................................5
4. Learnings.............................................................................................................................................................6
5. Current Project Scope .........................................................................................................................................7
6. Overall MIS Schematic ........................................................................................................................................8
7. Entity Relationship Diagram ...............................................................................................................................9
8. Database Schematic ........................................................................................................................................ 10
9. Functionalities ................................................................................................................................................. 11
10. Team Contributions ..................................................................................................................................... 15
11. References ................................................................................................................................................... 15
IEE 505 – Spring Final Project Report
Page | 3
1. Going Green
Every warmer day in a year brings us face to face with the reality that hundreds of years of human
evolution have had its effect on the environment. Global warming is the increase in the average
temperature of the Earth's near-surface air and oceans since the mid-twentieth century, and its
projected continuation.
The average global air temperature near the Earth's surface increased 0.74 ± 0.18 °C (1.33 ± 0.32 °F)
during the hundred years ending in 2005. The Intergovernmental Panel on Climate Change (IPCC)
concludes "most of the observed increase in globally averaged temperatures since the mid-twentieth
century is very likely due to the observed increase in man-made greenhouse gas concentrations” via
the greenhouse effect.
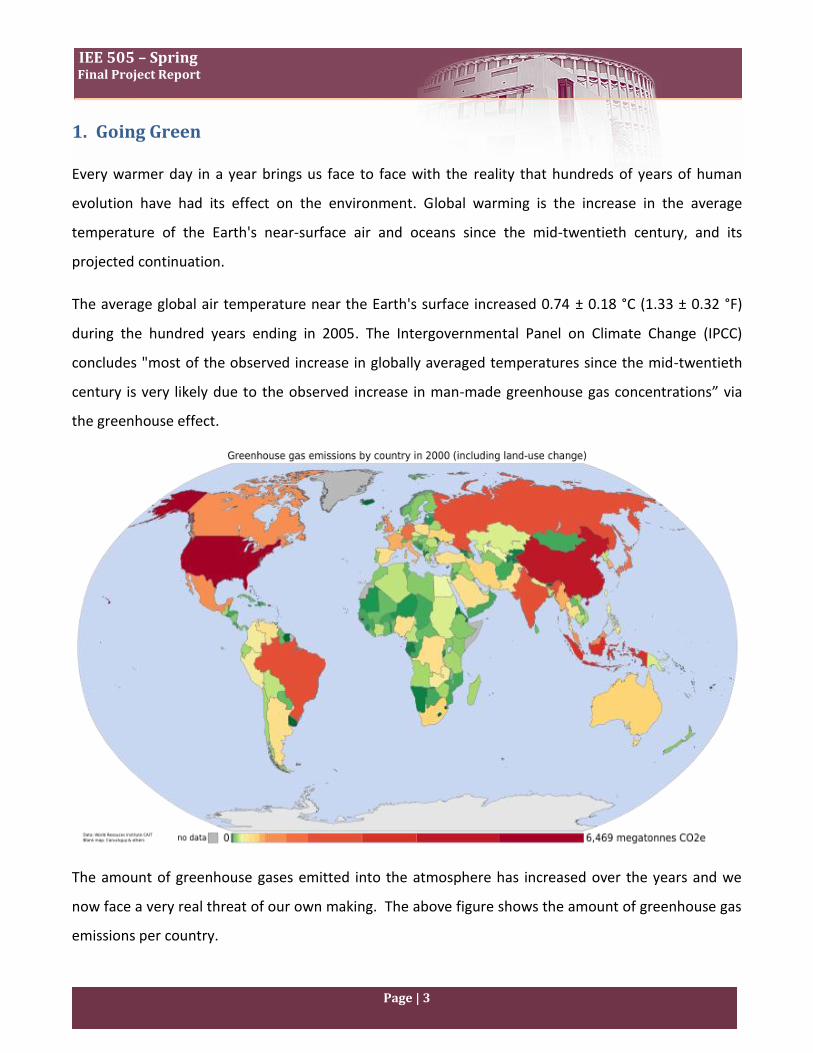
The amount of greenhouse gases emitted into the atmosphere has increased over the years and we
now face a very real threat of our own making. The above figure shows the amount of greenhouse gas
emissions per country.
IEE 505 – Spring Final Project Report
Page | 4
2. Management Information System
A management information system (MIS) is a system or process that provides the information
necessary to manage an organization effectively. MIS and the information it generates are generally
considered essential components of prudent and reasonable business decisions. It is a powerful
planned system of collecting, processing, storing and disseminating data in the form of information
needed to carry out the functions of management.
In the current context of environmental pollution, our environment is the business and the
management is each one of us. Be it Government Bodies, Weather Bureaus, Businesses, Individuals;
each of us are affected by the changes in the environment and need current information regarding this
to be able to affect change.
Environment Pollution Tracker is an attempt to collate information regarding pollution, manage it,
analyze it and present it in easy to understand form. It is designed to disseminate information
regarding the environment so that individuals or organizations can make informed decisions.
IEE 505 – Spring Final Project Report
Page | 5
3. Objectives and Goals
The main objective in designing this MIS is to facilitate progressing towards a greener future.
“We measure what we value and we improve what we measure.”
Collating information from different sources
Information regarding environmental pollution is available at different sources all over the World Wide
Web. The foremost goal is to collate the information together at a single location so that all relevant
information is available to the user through a single interface.
Providing historic information on pollution levels across the globe
Data is raw. It simply exists and has no significance beyond its existence (in and of itself). Information is
data that has been given meaning by way of relational connection. This "meaning" is what makes the
information useful. The collated data is grouped and analyzed at different levels of aggregation to
make sense out of the raw data.
Forecasting future pollution levels
Historical information in itself is useful but the next level of analysis is modeling the historical
information in order to make predictions in the future. The software attempts to use time series
models to predict future pollution levels.

IEE 505 – Spring Final Project Report
Page | 6
4. Learning Objectives
Along with the above listed Project Objectives and Goals, the team wanted to achieve some personal objectives.
These objectives allowed us to maximize the learning from the course and at the same time allowed us to
explore many different aspects of a Software Development Lifecycle.
Manage a Large Database using Visual Basic
Throughout the course we handled small datasets. But an Industrial Engineer would come across large
datasets in the real world. Managing the large dataset was learning in itself. It helped emphasize the
importance of normalization and making sure that no anomalies exist in the database logic.
Exploring Charting and Graphing tools
All applications which handle large databases need to be able to represent the data in an easy to
interpret form. This is a key aspect of a good MIS. All management decisions are made based on
analyzed data and seldom on raw data itself. Therefore charts and graphs formed a very critical part of
the entire project. This also allowed us to explore using a third party add-in and integrating it into
Visual Basic.
Implementation of a statistical model
As industrial engineers we build models very often. In most cases, it is desirable to make the model
available to the end user. We attempted this by building a time series model and integrating it with
the software.

IEE 505 – Spring Final Project Report
Page | 7
5. Current Project Scope
The current scope of the project has been restricted to Air pollutants only. The size of the data
available on air pollutants is very large and due to technical constraints on our systems, it has been
restricted to the below ranges only.
Air Pollutants
Restricted to Carbon Monoxide, Nitrogen Dioxide, Sulphur Dioxide, Ozone & Particulate Matter 10
(PM10).
Geographical
Data has been restricted to US states Arizona, California, New Jersey and New York.
Date Range
Data for the years 2004 and 2005 has been included in the database.

IEE 505 – Spring Final Project Report
Page | 8
6. Overall MIS Schematic
The overall schematic reflects how the objectives of the project have been implemented. Above this is
the User Creation module which allows new users to be created. These users are given all rights except
administrative rights to update the database. Only the Administrative user has access to this additional
feature.
IEE 505 – Spring Final Project Report
Page | 9
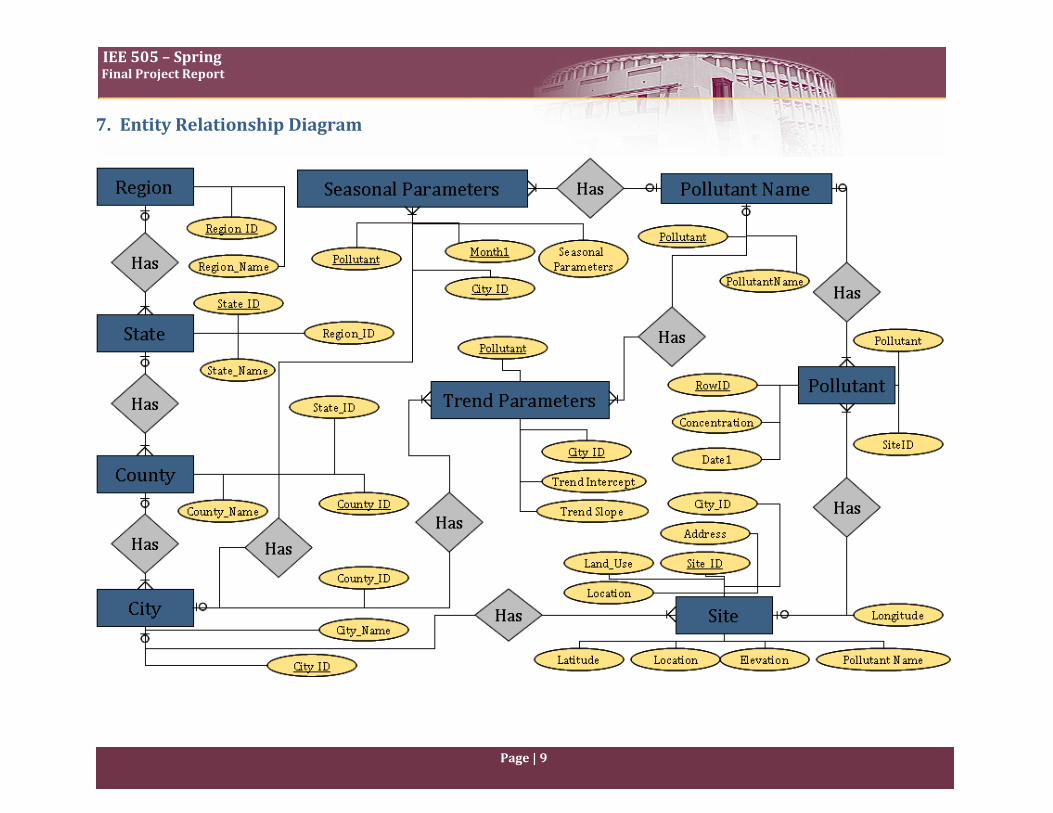
7. Entity Relationship Diagram
IEE 505 – Spring Final Project Report
Page | 10
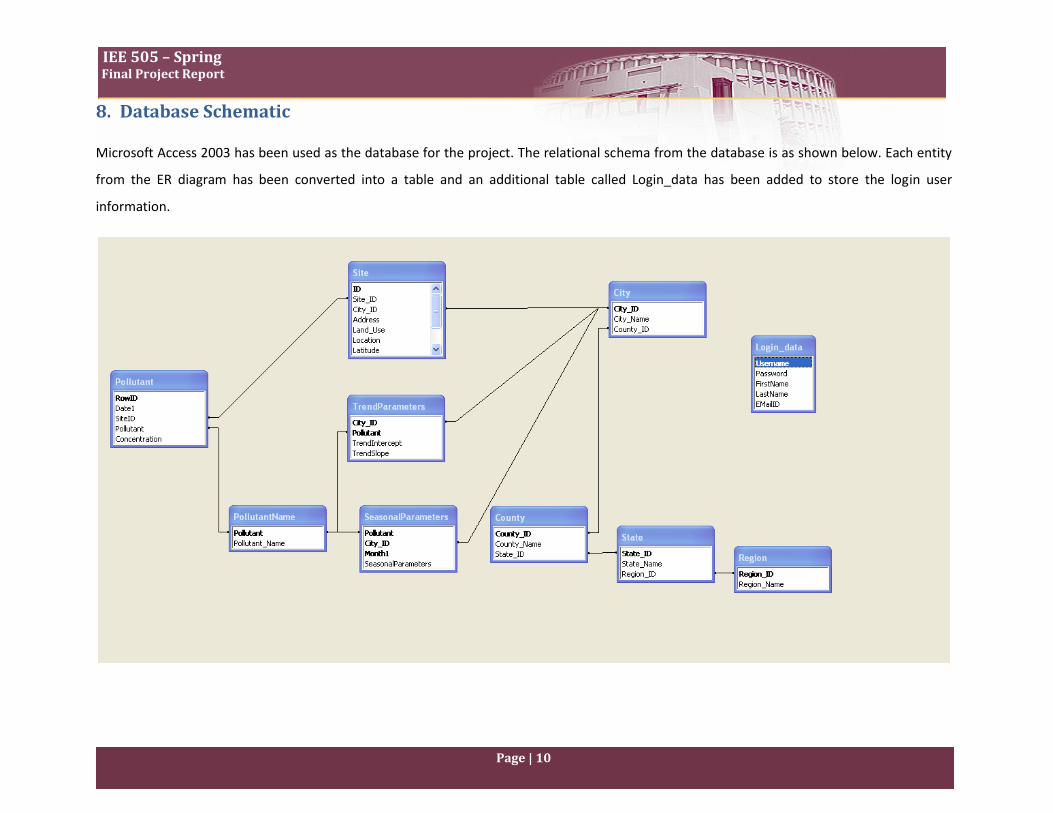
8. Database Schematic
Microsoft Access 2003 has been used as the database for the project. The relational schema from the database is as shown below. Each entity
from the ER diagram has been converted into a table and an additional table called Login_data has been added to store the login user
information.
IEE 505 – Spring Final Project Report
Page | 11
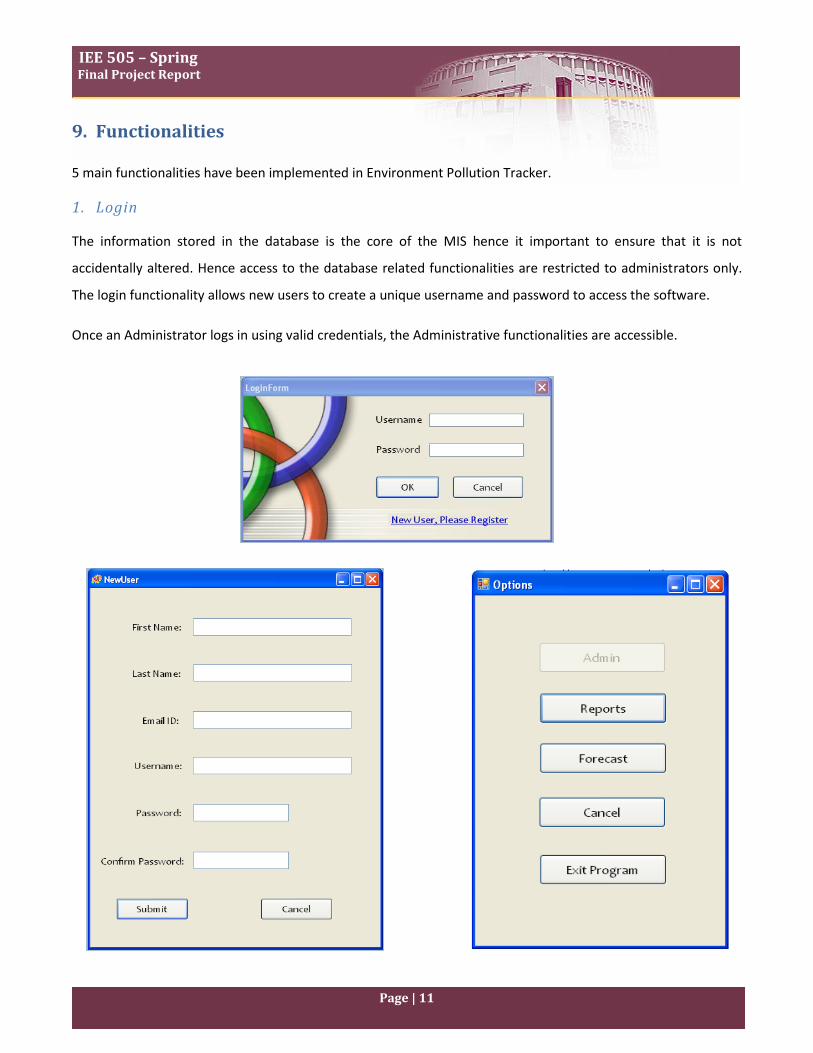
9. Functionalities
5 main functionalities have been implemented in Environment Pollution Tracker.
1. Login
The information stored in the database is the core of the MIS hence it important to ensure that it is not
accidentally altered. Hence access to the database related functionalities are restricted to administrators only.
The login functionality allows new users to create a unique username and password to access the software.
Once an Administrator logs in using valid credentials, the Administrative functionalities are accessible.
IEE 505 – Spring Final Project Report
Page | 12
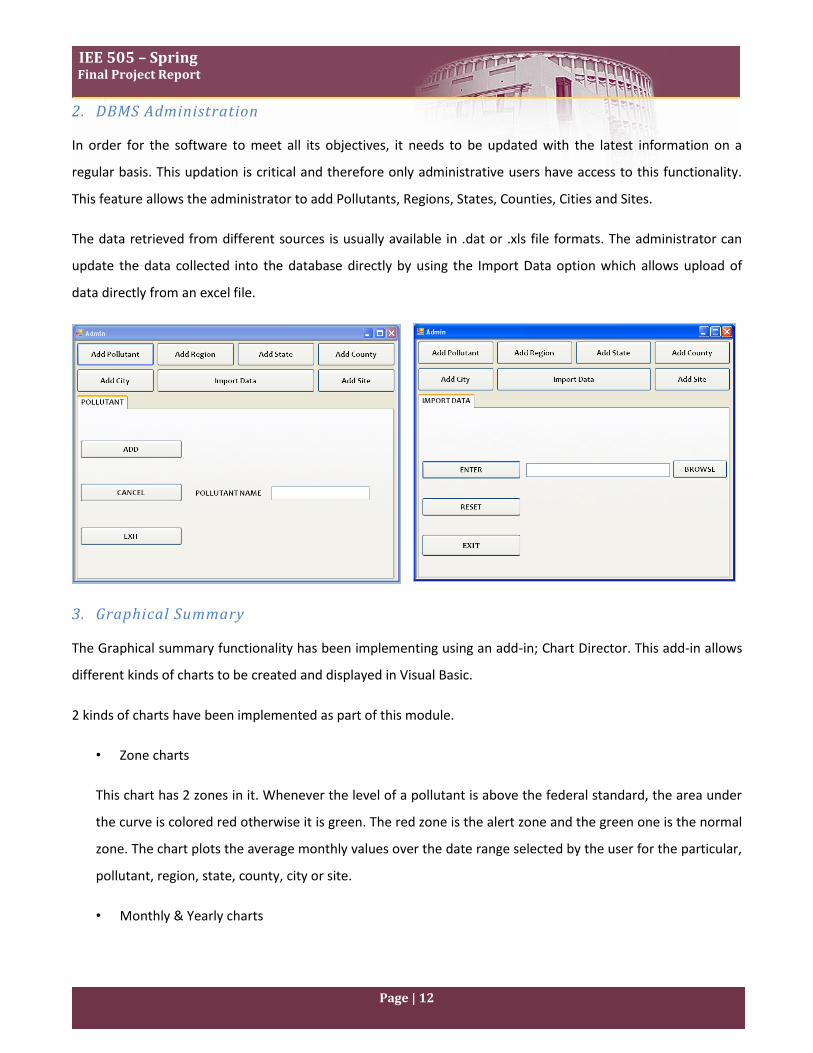
2. DBMS Administration
In order for the software to meet all its objectives, it needs to be updated with the latest information on a
regular basis. This updation is critical and therefore only administrative users have access to this functionality.
This feature allows the administrator to add Pollutants, Regions, States, Counties, Cities and Sites.
The data retrieved from different sources is usually available in .dat or .xls file formats. The administrator can
update the data collected into the database directly by using the Import Data option which allows upload of
data directly from an excel file.
3. Graphical Summary
The Graphical summary functionality has been implementing using an add-in; Chart Director. This add-in allows
different kinds of charts to be created and displayed in Visual Basic.
2 kinds of charts have been implemented as part of this module.
• Zone charts
This chart has 2 zones in it. Whenever the level of a pollutant is above the federal standard, the area under
the curve is colored red otherwise it is green. The red zone is the alert zone and the green one is the normal
zone. The chart plots the average monthly values over the date range selected by the user for the particular,
pollutant, region, state, county, city or site.
• Monthly & Yearly charts

IEE 505 – Spring Final Project Report
Page | 13
Depending on the input options selected by the user, the graphs summarize the data on a monthly and
yearly basis. The averaging is done at the last level of input given by the user. For example, if the last level of
input is city, then the average monthly and yearly graphs show the selected city level detail.
4. Crystal Reports
'Crystal Reports' is a popular third party package that is included with Visual Basic, which allows you to
create reports for your application. Crystal reports enable easy visualization of the database. It allows
drilling down from a macro level to a micro level for the geographical options and date range selected
by the user. All levels of crystal reports have been implemented, starting with just a particular pollutant
to a specific site and all levels in between.
The explorer view on the left hand side allows the user to browse to whatever level he wishes to view
without have to browse through the entire report. The details of a specific site and pollutant are listed
at the end of the report after the drill down is completed. Graphical representation of the data is
possible in many different forms such as pie charts, bar charts; 3-D surface charts line charts, etc.
Different charts as appropriate have been implemented at each level of the crystal report.
IEE 505 – Spring Final Project Report
Page | 14
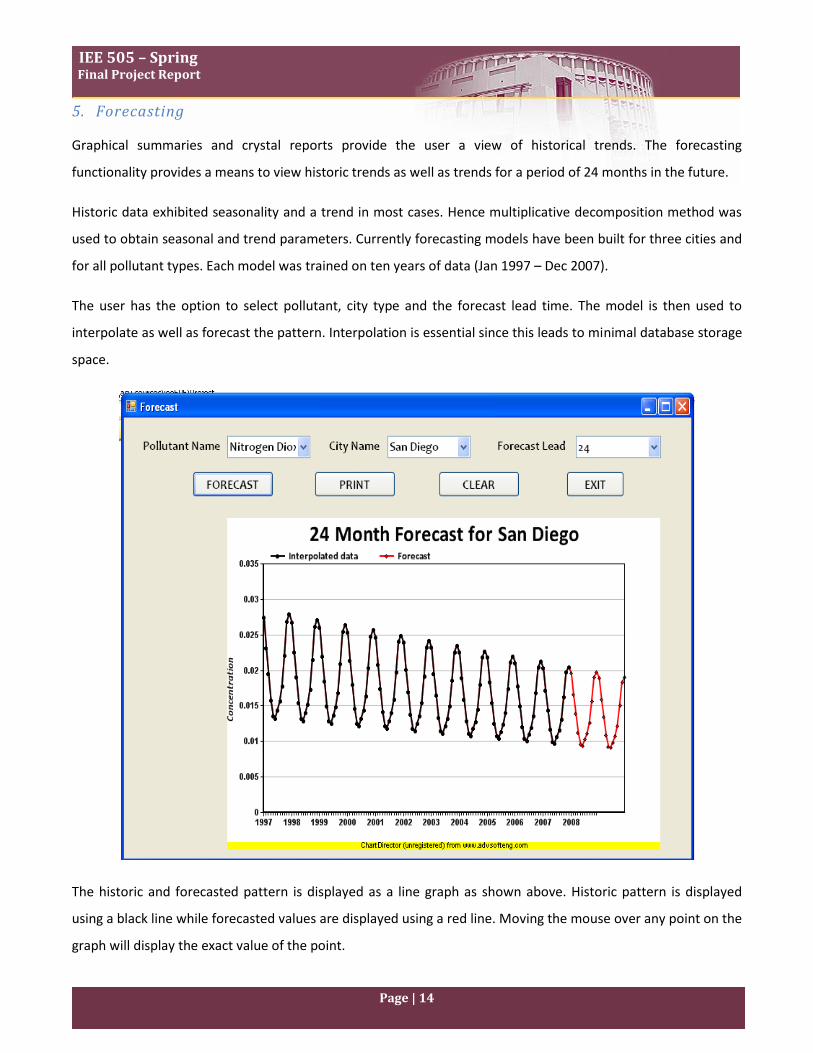
5. Forecasting
Graphical summaries and crystal reports provide the user a view of historical trends. The forecasting
functionality provides a means to view historic trends as well as trends for a period of 24 months in the future.
Historic data exhibited seasonality and a trend in most cases. Hence multiplicative decomposition method was
used to obtain seasonal and trend parameters. Currently forecasting models have been built for three cities and
for all pollutant types. Each model was trained on ten years of data (Jan 1997 – Dec 2007).
The user has the option to select pollutant, city type and the forecast lead time. The model is then used to
interpolate as well as forecast the pattern. Interpolation is essential since this leads to minimal database storage
space.
The historic and forecasted pattern is displayed as a line graph as shown above. Historic pattern is displayed
using a black line while forecasted values are displayed using a red line. Moving the mouse over any point on the
graph will display the exact value of the point.

IEE 505 – Spring Final Project Report
Page | 15
10. Team Contributions
Tasks Members
Database
Management
ER Modeling & Database Design Priyesh, Prashanth
Data collection & population Amit, Priyesh
Visual basic
Admin Module Priyesh, Shilpa
Graphical Summary Shilpa, Mayur
Crystal Reports Mayur, Prashanth
Forecasting Module Amit, Shilpa
Project
Integration and
Documentation
Integration Shilpa, Amit
Testing All
Documentation Prashanth, Mayur, Shilpa
11. References
The data and the federal standards for the different air pollutants have been obtained from the Environment
Protection Agency website. (www.epa.gov)
The add-in used to implement the graphical summary and forecasting modules is a trial version of Chart
Director. This add-in is available at www.adventsofteng.net.


