Efficient Animal Feed Factories IEE/12/758/SI2.644752 Handbook coordinator: TECALIMAN (Centre Technique des Aliments pour Animaux) HANDBOOK Co-funded by the Intelligent Energy Europe Programme of the European Union
Transcript
Efficient Animal Feed Factories
IEE/12/758/SI2.644752
Handbook coordinator: TECALIMAN (Centre Technique des Aliments pour Animaux)
HANDBOOK
Co-funded by the Intelligent Energy Europe Programme of the European Union
Update version:February 2014
Authors:Loïc Perrin, François Lucas and Fabrice Putier.
TECALIMAN (Technical Centre for Animal Feed)
Co-authors:The following document has been executed
jointly with CIRCE, UÉvora, ENEA and UPM
(specially the point 4 regarding Energy Saving
Measures), and includes information provided
by Spanish Co-ops, CoopdeFrance, CONFAGRI
and Legacoop Agro.
About this report:This report has been developed in the
framework of the TESLA project (Intelligent
Energy Europe) and has been founded by the
European Commission.
Copyright:This report can be copied and distributed
always including notes of copyright. Teachers,
trainers and any other user must always
quote the authors, the TESLA project and the
Intelligent Energy Europe programme.
“The sole responsibility for the content of this guide lies with the authors. It does not necessarily reflect the opinion of the European Union. Neither the EACI nor the European Commission are responsible for any use that may be made of the information contained therein”.
0. INDEX1. Introduction
1.1. Analysis of productive animal feed sub-sectors 6
1.2. Socio-economic point of view 8
2. Processes description
2.1. Grinding 12
2.2. Pelletizing 14
2.3. Auxiliary processes 15
2.3.1. Compressed air system 15
2.3.2. Boiler 16
2.3.3. Electrical motors 17
2.3.4. Lighting 17
3. Energy analysis of animal feed sector
3.1. Electrical consumption 18
3.2. Thermal consumption 21
3.3. Energy balance 23
3.4. Energy cost 25
3.5. Sub-sector particularities 25
4. Energy saving measures
4.1. Steam system 26
4.2. Ventilation 27
4.3. Efficient engines 28
4.4. Compressed air system (CAS) 30
4.5. Variable speed drives 32
4.6.Insulation 32
4.7. Heating water or air 33
4.8. Lighting 35
4.9. Capacitor batteries to decrease reactive energy 36
4.10. High efficiency in power transformers 36
4.11.Management tools 36
5. Conclusions 38
6. References 39
4
1. INTRODUCTION
The aim of the animal feed production is to mix, as homo-genous as possible, various raw materials and components to provide a balanced nutrition to food producing animals with the best conversion performance. Complexity relates to the use of raw materials and components, to the diffe-rent technological characteristics, and to various physical aspects.Most of them require grinding and this need determines the plant types by the positioning of this operation in the process. Thus, there are two main types of process flow diagrams:
• Pre-grinding process flow diagram (see Figure 1): In this case, the raw materials are firstly ground separa-tely and stored before dosing (weighing). Pre-grin-ding has a reputation to provide good productivity performances of the mill, but it requires, for the same raw material, several bulk silos for the different mi-llings.
• Pre-dosing process flow diagram: In this case, all the raw materials are weighed, coarsely mixed before being ground together formula by formula. Pre-dosing allows simplifying feed mills, with fewer raw material silos for multi-species feed mills and a good fit milling and formulation. The drawback will be the division of the grinding step batch by batch, more consumption of energy and the need of servocontrols to automate the processes.
5
Figure 1. pre-grinding diagram (TECALIMAN)
reception dosing mixing
molassing
thermal treatment
cooling
crumbling seeving coatingloading bagging
pelleting
grinding
6
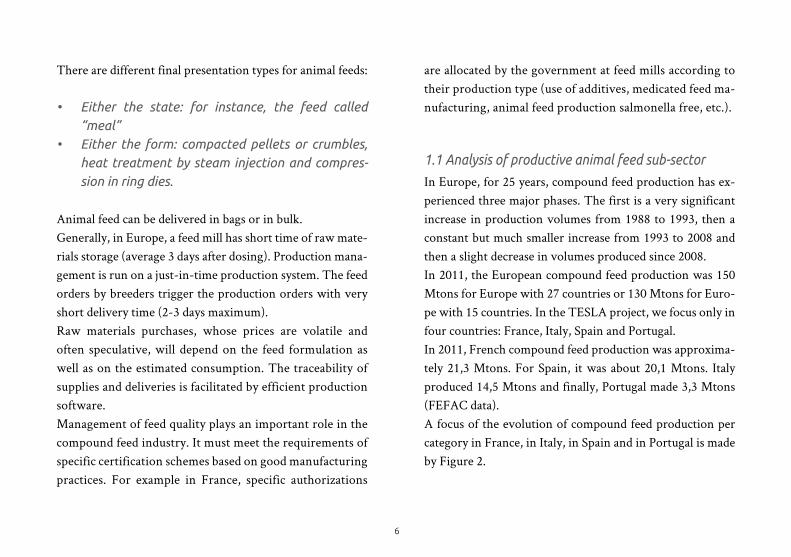
There are different final presentation types for animal feeds:
• Either the state: for instance, the feed called “meal”
• Either the form: compacted pellets or crumbles, heat treatment by steam injection and compres-sion in ring dies.
Animal feed can be delivered in bags or in bulk.Generally, in Europe, a feed mill has short time of raw mate-rials storage (average 3 days after dosing). Production mana-gement is run on a just-in-time production system. The feed orders by breeders trigger the production orders with very short delivery time (2-3 days maximum).Raw materials purchases, whose prices are volatile and often speculative, will depend on the feed formulation as well as on the estimated consumption. The traceability of supplies and deliveries is facilitated by efficient production software. Management of feed quality plays an important role in the compound feed industry. It must meet the requirements of specific certification schemes based on good manufacturing practices. For example in France, specific authorizations
are allocated by the government at feed mills according to their production type (use of additives, medicated feed ma-nufacturing, animal feed production salmonella free, etc.).
1.1 Analysis of productive animal feed sub-sector
In Europe, for 25 years, compound feed production has ex-perienced three major phases. The first is a very significant increase in production volumes from 1988 to 1993, then a constant but much smaller increase from 1993 to 2008 and then a slight decrease in volumes produced since 2008. In 2011, the European compound feed production was 150 Mtons for Europe with 27 countries or 130 Mtons for Euro-pe with 15 countries. In the TESLA project, we focus only in four countries: France, Italy, Spain and Portugal. In 2011, French compound feed production was approxima-tely 21,3 Mtons. For Spain, it was about 20,1 Mtons. Italy produced 14,5 Mtons and finally, Portugal made 3,3 Mtons (FEFAC data).A focus of the evolution of compound feed production per category in France, in Italy, in Spain and in Portugal is made by Figure 2.
7
Figure 2. Evolution of compund feed production per category (FEFAC data)
20072007
20072007
2001.000
1.0001.500
400
2.000
2.0003.000
6004.000
5.000
3.0004.500
8006.000
4.0006.000
1.0007.000
8.000
5.0007.500
1.200
9.000
6.0009.000
1.400
1.600
10.000
11.000
7.00010.000
20072007
20072007
20072007
20072007
20082008
20082008
20082008
20082008
20082008
20082008
20092009
20092009
20092009
20092009
20092009
20092009
20102010
20102010
20102010
20102010
20102010
20102010
20112011
20112011
20112011
20112011
20112011
20112011
cattlecattle
cattlecattle
pigpig
pigpig
poultrypoultry
poultrypoultry
PORTUGALSPAIN
ITALYFRANCE
8
1.2. Socio-economic point of view
The European socioeconomic point of view has evolved ac-cording to the number of countries incorporating the EU. Figure 3 shows the evolution of the number (in blue) and average size of feed mills (in red) in the EU.
FRANCE in 2008, the number of compound feed plants was 301 for an average annual production level per site of 75,3 kt but in 2010, this number of compound feed mills only was 292 and the average annual production level per site was 80 kt (SNIA-CoopdeFrance, 2011).
ITALY 600 companies are distributed in the Italian territory for an average annual production level per site of 23,8 kt. (ISTAT–Assalzoo, 2011
SPAIN the number of compound feed production units was about 854 in 2011 for an average annual production level per site of 23,5 kt (FEFAC, 2011).
PORTUGAL the number of feed mills in Portugal is 124 for an average annual production level per site of 26,6 kt (DGAV, 2013).
The European average turnover of compound feed industry (without Luxembourg, Greece and Malta) is 44.510 M€ (FE-FAC, 2011). In the case of:
Figure 3. Number and average size of feed production units in
the EU (FEFAC data)
In 2004, the loss of average size of feed production units is due to the expansion of EU (EU–15 to EU–27) because the number of feed mills grew with its expansion . In the case of:
99
20
25
0
2000
2500
3000
3500
4000
4500
5000
1500
1000
30
35
40
45
50
00 01 02 03 04 05 06 07 08 09 10 11N
umbe
r o
f un
its
EU p
rodu
ctio
n pe
r un
it in
1,0
00 t
EU-15 as from 1995, EU-25 as from 2004, EU-27 as from 2007
9
Figure 4. Production Area in France(Cattle in blue, Pig in brown, Poultry in green, Other in
turquoise) (SNIA - CoopdeFrance)
FRANCE the compound feed profession accounts for about 12.000 jobs in the French territory for a turnover of 7,14 billion € (FEFAC, 2011). About these 12.000 jobs, 6.000 are given by 45 cooperative enterprises (CoopdeFrance) and others 6.000 are given by 203 private enterprises (SNIA data, 2009).
ITALY in 2011, the total economical turnover was 6,65 bi-llion €. The number of direct operators was 8.500. (ISTAT, 2011)
SPAIN current value of production of the sector in the country was about 5,75 billion € in 2010 (FEFAC, 2011).
PORTUGAL according with data from the Portuguese Insti-tute of Statistics, in 2010, the production value of this sector was around 1.002 M€. (IACA, 2012). 3.551 jobs are given by 6 cooperative enterprises (INE (EA, 2011)).
The production areas in France and Italy are shown in the Figures 4 and 5, respectively.
French feed mills are predominantly agro-industry coopera-tives and the feed production is mainly manufactured in the large western. Indeed, Bretagne, Pays de la Loire and Poitou-Charentes include 65% of the French metropolitan produc-tion (without taking into account French islands). Figure 5 shows the repartition of feed mills in Italy. It is possible to observe that the majority of them is concentrated in North of this country.
<50 fEEd mILLs
51-100
101-150
>150
Figure 5. Number of feed mills in Italy (ISTA–Assalzoo 2011)
11
2. PROCESSES DESCRIPTION
Different production steps are necessary to produce animal feed. A quick explanation will be made about the processes consuming less energy and a complete description of the most energy consuming processes will be done. The diffe-rent production steps in a feed mill are:
RECEPTION. Various raw materials arrive by truck (more rarely, by trains), and are discharged into reception hoppers and transferred by mechanical or pneumatic system to a feed processing plant: grains, powdery, liquids, etc. Their packa-ging changes according to their physical aspects (bulk, big bags, etc). At the arrival of delivery trucks, they are weighed and a first quality control is performed.
GRINdING. A complete description is given below (section 2.1).
dOSING. Dosing is the process that manages the supply and distribution of products flow based on feedback from weighing sensors. It aims to get the right quantities of each raw material needed to approach closer to the formu-la provided by the formulator. The number of weighing bins may vary from one plant to another.
MIxING. The aim of mixing operation is to distribute, in a homogeneous manner, the elements of the dosed formula. The most used mixer is the horizontal ribbon mixer with a ribbon agitator. The two main parameters of the mixing operation are the mixing time and the filling rate. These two parameters have a direct impact on the production level of the plant, because it often has only one mixer.
PELLETIzING. A complete description is given below (section 2.2).
HEAT TREATMENT. Heat treatment is usually related to the need of feed hygienisation in order to eliminate preventively pathogenic microorganisms. The principle consists in trea-ting the feed with a temperature of 85°C for several minutes under the steam action. The feed in the meal form is subjec-ted to heat treatments. Heat treatments can be carried out continuously or by batches.
COOLING. The aim of this step is to cool and to dry pellets in a single device. In animal feed, the drying and cooling steps
12
are combined. These processes are carried out by creating an airflow within the feed mass. Drying is due to heat generated by the hot product and cooling is due to adjustment of the incoming air. The cooling process is the result of coupled exchanges of heat (enthalpy) and substance (water) between the air and the product. This process is done in vertical counter-flow coolers or horizontal and cross-flow coolers.
Crumbling/sifting/Coating. The aim of crumbling is to break up pellets into smaller particles agglomerated for small animals (chicks, quails, etc) from the pellets manufac-tured. Usually, the crumbler consists of two corrugated rolls situated below the cooler/drier exit. The main issue is set-ting up the end of the batch cycle by stopping the recycling of fine particles. The separation of fine particles is typically performed by a sifting. After sifting, liquids (fat, enzymes, etc) can be incorporated into the feed at a step called spray coating outside the pellets. This is the last step of dosing and the formula is definitely considered complete at this step.
Conditioning/loading/delivery. A conditioning line is composed of storage hoppers, a sack filling station and a palletizing system. The main elements of the sack filling
station will be the dosing/weighing. In most cases, the bags are delivered to dealers or distributors while the bulk is deli-vered directly to livestock farmers. Usually, most of produc-tion is delivered in bulk. At the plant, loading can be done in the truck directly on a weigh-bridge or by a weighing tool pre-installed between storage cells of finished products and loading). The truck is divided into cells in order to separate the different batches of deliveries. Upon arrival to the farm, unloading depends on the truck type (pneumatic hoses or mechanical system).
AUxILIARY PROCESSES. A complete description is given below (section 2.3).
2.1. Grinding
The grinding aim is to transform all the particles making up a formula to a similar particle size, consuming as low energy as possible. The similar particle size favours thereafter obtaining ho-mogeneous and stable mixtures. The grinding fineness promotes pellet cohesion and the electrical efficiency of the pellet mill.Unless design constraints of the plant, only raw materials as gra-ins or pellets with higher than desired particle sizes are ground. All others powdery raw materials will be added at the mixing step.
13
The most grinding mill type used in animal feed is the ham-mer mill (Figure 6).
cleaner (a magnetic device) and the denser particles (stones) with a destoner operating with an air-flow. The grinding chamber is delimited by a screen, calibrating the desired final particle size distribution. The particles are ground by reversi-ble moving hammers hooked up on discs mounted on a rotor usually in rotation from 1.500 to 3.000 rpm.Between the disc and the hammer, fixed counter-hammers may be present.High vacuum pressure generated by suction into the hopper beneath hammer mill, provided by a large airflow and also contributing to the operation of the destoner, extracts the particles of the grinding chamber through the screen when they reached the right particle size.The entrained air with the product is then separated from the meal most often by filtration in a sleeves battery insta-lled on the ceiling of the hopper under hammer mill. The cleaning sleeves are provided by a sequential injection sys-tem of compressed air at 6-8 bars. In its lower part, the hop-per under hammer mill is provided with a transfer system (generally a screw conveyor) to ensure the ground products removal. This evacuation is completed by a rotating valve system that prevents the air received, by the fan, comes to the downstream circuit of the hammer mill.
Figure 6. Hammer mill (Tecaliman)
In each plant, one or more grinding mills are used for this operation. The supply device of each grinding mill includes a silo bin with, at its base, a screw conveyor which carries out the supply device of the grinding mill. Its rotational speed defines the grinding mill flow rate.At the entrance of the grinding chamber, raw materials are purged of all foreign materials: the metal particles by a ferrous
Feeding screw
Grinder
Silo bin
Magnetic
Destoner
14
2.2. Pelletizing
The pelletizing aim is to convert the feed milled into pellets. This physical transformation of feed has many benefits, such as feed densification (about 40%) which generates an increa-se in storage capacity and a reduction of transport costs and of dust emissions and a better feed preservation. The pelleti-zing is characterized by a line composed of different succes-sive steps (Figure 7):
• Storage in the “small storage silo” in various num-bers, but generally two.
• A screw conveyor for each small storage silo which is also the supply screws controlling the pe-lletizing flow rate,
• A cylinder mixer, also called conditioner, in which the feed is mixed with steam (produced in the pe-riphery line by a boiler and a steam system),
• The pellet mill.
However, it has some disadvantages, such as expensive in-vestments (silos, pellet mill, boiler, cooler...), additional energy costs (electricity and steam), or the change in water content with “free” water incorporation.Ingredients usually are supplied to the conditioner by using a screw controlled by a speed variation device. The supply flow rate of the conditioner and the pellet mill is adjusted to a set-point value for the current speed of the pellet mill motor. The conditioning of the ingredients is performed by continuous in-corporation of dry steam. The steam injection, close to the inlet,
Figure 7. Pellet mill (Tecaliman).
Silo bin
Press pelleter
Knife
Temperaturesensor
Press conditionerSteam
Feeding screw
15
is regulated at the output by a temperature sensor, allowing the feed treatment between 40 and 95°C. The steam amount injec-ted into the conditioner affects the production flow rate and the energy consumption of the pellet mill. The pelletizing process is the first consumer of energy in a feed processing plant:
• 50 to 60% of electric energy consumption• 80 to 90% of steam consumption
After passing a magnetic device, the meal is brought to a me-tal ring perforated of circular channels (disc dies, ring dies (more typically on pellet mill with vertical dies) or rotating dies). After being compressed by rollers, the meal is oriented towards the die using scraper knives. Then the meal is extru-ded through the die channels. The product comes out in the form of a cylinder. At the exit of the die channels, two knives slice the cylinder setting up the pellet length.After pelletizing, the feed passes by gravity through a cooler and possibly a crumbler or crusher and a sifter. The smaller particles are separated from the feed and come back to the pellet mill.
2.3. Auxiliary processes
2.3.1 . Compressed air system
This air is mostly produced from single-stage lubricated rotary screw compressors. The rotary vane compressors are also commonly used. The installation of variable speed compressors tends to accelerate strongly in recent years. The compressors are most often installed in a specific local or within the plant. Usually, only one compressor is enough to satisfy the plant needs. Typically, the range of used com-pressors varies from 18 to 75 kW for maximum production pressures from 7,5 to 10 bars.The drying system of the air is often located in the area of a compressor. The most common technology of drying sys-tem is the refrigerated dryer. Sometimes, the external heat-adsorption dryer is installed on larger production units. In practice, animal feed sector is still using only one drying system of the air to supply the entire distribution network. Most facilities tend to have a reserve of air between the compressor and the dryer. The major air consumer is the air leaks in the compressed air network. Another drying system of the air can be used: the heatless “pressure-swing” drying. It uses part of the dry compressed air coming from the other vessel to dry the desiccant in the vessel being regenerated at
16
lower pressure. The blowdown rate is between 17 to 20%.The specific electrical consumption of compressed air sys-tem represents an average of 6-7 % of the electricity con-sumption of a feed mill. This use does not include the power consumption of refrigerated dryers and external heat-ad-sorption dryer. Usually, air compressors are stopped at the weekend (when the plant is shut down).
2.3.2. Boiler
This steam is in the majority of industrial plants produced by fire tube boiler. The boilers are installed in boiler room including, often, the water treatment utility, the feed-water, etc. Usually, one boiler is needed to supply the feed mill. Steam is often produced at 6 to 10 bars (effective). The used fuel is mostly natural gas or LPG (butane or propane). For smaller units, heating oil tends to be used as fuel. The use of heavy fuel oil and electricity is marginal. Fuels from biomass and natural gas liquid grow increasingly in the ani-mal feed sector.The boiler size varies according to steam needs. A very few boilers with a capacity of more than 5 tons/hour are used. On some plants, the boiler remains under pressure when stopping production (heating liquids, etc.).
The blowdown rate of boiler is highly variable from one feed mill to another. It can also vary greatly in time for a same boiler. The parameters, influencing blowdown rate, can be:
• The characteristics of the feed-water (which may change depending in particular on the origin of the water)
• The water treatment,• The setting mode of these valves (manual, auto-
matic, etc.).
The rate of return of condensate to feed-water tank varies greatly depending on the nature of users on the site, their operations and the network structure of condensates. It is common to find low pressure condensate returned directly to the sewer. If the use of steam is limited to its injection into the conditioner of pellet mill, the rate of return of condensa-te in the feed-water tank is typically between 5 and 20 %. In this case, the feed-water temperature will hardly exceed 50 to 60 ° C. This rate of return will increase if the plant:
• Warms liquid from steam/water exchanger,• Operates a heat treatment of meals.
17
Figure 8. Repartition of purchase cost of a motor
(Motor challenge)
2.3.3. Electrical motors
In a feed mill, the electric consumption of motors represents more than 90 % of global electrical consumption. The motors power is rated from few kW to few hundred kW. For guidance only, 5% of all motors in a feed mill may consume more than 70 % of global electrical consumption. These 5 % correspond to the motors used in grinding, pelletizing, mixing, fan system and compressed air system. Most motors are induction motors and few of them uses a variable speed drive. Figure 8 shows the economical point of view in the purchase of a motor.Figure 8 explains that the global cost of a motor is due to its energy consumption while its purchase cost only represents around 2.5%.
2.3.4. Lighting
It is very common to use discharge gases lamps, like high pressure sodium or mercury steam and also halogen lamps for lighting inside production buildings and in raw material reception respectively. These devices have a very high power, around 400 W in the most cases. Moreover they need also auxiliary devices (ballast) that increase final energy consump-tion. Due to the high technology develop that LED lighting technologies have, it is possible to change old systems by new ones using LED technology with a reasonable cost and a high feasibility due to power reduction will be up to 65 %.
ENERGY
mAINTENANCE
PURCHAsE COsT
1,5% 2,5%
96,0%
18
3. ENERGY ANALYSIS OF ANIMAL FEED SECTOR
In this sector, primary energy sources used are electricity and fuels (natural gas, propane, butane, heavy fuel oil and domes-tic heating oil). Natural gas is the most used fuel for steam production.
Ratio between electrical energy consumption/production
Electrical power installed
France 80 kt/year From 18 to 60 kWh/t of feed Depends on feed type
Italy 130 kt/year 20kWh/t of feed 450kW
Spain 44 kt/year 16 kWh/t of feed 725 kW
Portugal 81 kt/year 13,8 kWh/t of feed 430 kW
3.1. Electrical consumption
On feed mills, electricity is always used for the motors of devices (it concerns approximately 90% of electricity con-sumption), for compressed air production and for lighting buildings. On some feed mills, electricity can be used for heating liquids contained in some storage silos for liquids and, with rare exceptions, for producing steam. Operation
Sources: Tecaliman/Company Valmori SR/CO2OP project of Cooperativas Agro-alimentarias/National Statistics Institute in Portugal.
19
management decisions can cause empty operating periods or operating periods with a partial load for different motors. These periods can be more or less long. Table 1 indicates average values of electrical consumption in France, in Italy, in Spain and in Portugal.
Considering three French feed mills which produce different feeds (average 80 kt), the following values of electrical consumptions can be found included in Table 2.
TAbLE 2. ExAMPLES OF TYPICAL FRENCH PLANT dATA ON ELECTRICAL ENERGY CONSUMPTIONS.
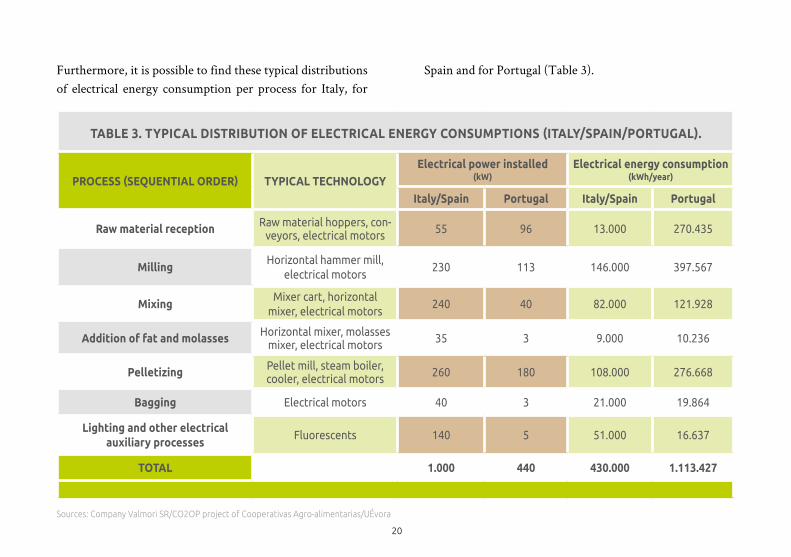
Furthermore, it is possible to find these typical distributions of electrical energy consumption per process for Italy, for
Spain and for Portugal (Table 3).
Sources: Company Valmori SR/CO2OP project of Cooperativas Agro-alimentarias/UÉvora
21
3.2. Thermal consumption
The thermal consumption is mainly due to the pelletizing process for pellet form and to the heat treatment process for meal (for example, poultry feed). The most thermal consu-
Ratio between thermal energy consumption/production
Thermal power installed (speciallythe boiler)
France 80 kt/year From 20 to 50 kWh/t of feed From 1.400 to 2.050 kW
Italy 130 kt/year 55 kWh/t of feed From 813 to 1.744 kW
Spain 44 kt/year 16 kWh/t of feed 725 kW
Portugal 81 kt/year 10,4 kWh/t of feed 220 kW
mer device is the boiler aiming to produce steam. Table 4 indicates average values of thermal consumption in France, in Italy, in Spain and in Portugal.
Sources: Tecaliman/Company Valmori SR/CO2OP project of Cooperativas Agro-alimentarias/National Statistics Institute in Portugal.
22
TAbLE 5. TYPICAL FRENCH PLANT dATA ON THERMAL ENERGY CONSUMPTIONS.
Thermal auxiliary processes Heating boiler, transport 300 220 110.000 794.640
Auxiliary equipments Forklifts 49.659
TOTAL 800 220 300.000 844.299
Sources: Company Valmori SR/CO2OP project of Cooperativas Agro-alimentarias/UÉvora.
3.3. Energy balance
Figure 9 represents the energy balance in the form of Sankey’s diagram.
24
Figure 9. Sankey diagram of repartition of energy in a feed mill
25
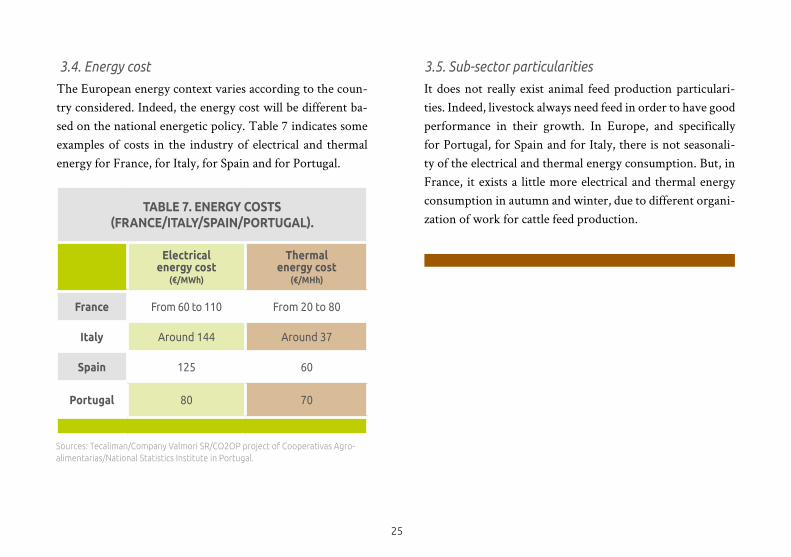
3.4. Energy cost
The European energy context varies according to the coun-try considered. Indeed, the energy cost will be different ba-sed on the national energetic policy. Table 7 indicates some examples of costs in the industry of electrical and thermal energy for France, for Italy, for Spain and for Portugal.
3.5. Sub-sector particularities
It does not really exist animal feed production particulari-ties. Indeed, livestock always need feed in order to have good performance in their growth. In Europe, and specifically for Portugal, for Spain and for Italy, there is not seasonali-ty of the electrical and thermal energy consumption. But, in France, it exists a little more electrical and thermal energy consumption in autumn and winter, due to different organi-zation of work for cattle feed production.
TAbLE 7. ENERGY COSTS (franCe/italy/sPain/Portugal).
Electrical energy cost
(€/MWh)
Thermal energy cost
(€/MHh)
France From 60 to 110 From 20 to 80
Italy Around 144 Around 37
Spain 125 60
Portugal 80 70
Sources: Tecaliman/Company Valmori SR/CO2OP project of Cooperativas Agro-alimentarias/National Statistics Institute in Portugal.
26
periodically checks to optimize combustion and, if necessary, adjusting the burner.
reduCe tHe mass flow of tHe flue-gases by re-
dUCING THE ExCESS AIR. And excess air can be minimi-sed by adjusting the air flow rate to the fuel flow rate for large boiler. This is greatly assisted by the automated measu-rement of oxygen content in the flue-gases.
PreHeat feed-water. The water from the feed-water container being returned to the boiler often has a tempe-rature of < 60°C. Heat recovery is possible by preheating the feed-water, thus reducing the steam boiler fuel requi-rements. Preheating can be done: using waste heat such as on the blowdown of steam boilers, on returning condensate, on air compressor, etc.; or using economisers and/or con-densers which are heat exchangers that reduce steam boiler fuel requirements by transferring heat from the flue-gas to the feed-water of the boiler.
MINIMISE THE bLOWdOWN RATE FROM THE bOILER.
It can substantially reduce energy losses as the temperatu-re of the blowdown is directly related to that of the steam
4. ENERGY SAVING MEASURES
This part has been developed with the help of the Best Avai-lable Techniques (BATs) Reference Document (BREF) for Energy Efficiency from the European Commission, valida-ted in 2009. A selection of improvement actions has been done in order to identify the potential actions which could be used in animal feed sub-sector. The improvement solu-tions to save energy on production processes and utilities in animal feed processing mills are numerous. The interest of these solutions must be evaluated on a case by case basis for each feed mill. Each plant must be considered as a specific case, i.e., it is impossible to generalize one case for all feed mill. The return time can vary significantly depending on investment costs, operating time machine, the size of the machine, the energy cost, the place, etc.
4.1. Steam system
Several improvements can be done regarding steam production.
AdjUST THE STEAM SYSTEM. The minimum excess air that is reachable to maintain emissions within the limit de-pends on the burner and the boiler. It should be carried out
27
IMPLEMENTING A CONTROL ANd REPAIR PROGRAM-
ME FOR STEAM TRAPS. Leaking steam traps lose signifi-cant quantities of steam, which result in large energy losses. Proper maintenance can reduce these losses in an efficient manner. The frequency by which steam traps are checked depends on the size of the site, the rate of the steam flow, the operating pressure(s), the number and size of traps, and the age and condition of the system and the traps, as well as any existing planned maintenance.
COLLECTING ANd RETURNING CONdENSATE TO THE
boiler for re-use. Condensate is collected and redi-rected to the feed-water container. It results in: re-using the energy contained in the hot condensate; saving the cost of the (raw) top-up water; saving the cost of boi-ler water treatment; reduction in chemicals for water treatment; and the quantity of water used and discharged is also reduced.
4.2. Ventilation
Ventilation is mainly used by hammer mill and coolers. In order to have an efficient system of ventilation, some points are necessary:
generated in the boiler. It can be done by performing regu-lar checks on the quality of the water in the boiler in order to reduce the levels of suspended and total dissolved solids (TDS) to acceptable limits; or by improving the installation of automated blowdown control systems, usually by moni-toring conductivity.
MINIMISE bOILER SHORT CYCLE THERMAL LOSSES. Losses during short cycles occur every time a boiler is switched off for a short period of time. Losses due to short term cycles for steam boilers can be magnified if the boilers can generate the required capacity in a very short period of time. This is the case if the installed capacity of the boiler is considerably larger than that generally needed. It is good practice to review whether to replace the boiler system or to adapt the burner of the boiler.
OPTIMISE STEAM dISTRIbUTION SYSTEMS. A proper performance of the distribution system requires careful de-sign practices and effective maintenance. The piping should be properly sized, supported, insulated, and configured with adequate flexibility. The distribution system should be confi-gured to allow adequate condensate drainage, which requires adequate drip leg capacity and proper steam trap selection.
28
4.3. Efficient motors
The electricity consumption of motor systems is influenced by many factors. In order to benefit from the available sa-vings potential, users should aim to optimise the whole sys-tem that the motor sub-system is part of, before considering the motor section. The following points will be taken into account to improve motor systems efficiency.
HIGHLY EFFICIENT MOTORS. Motors’ improvements are especially recommended in animal feed factories where some used electrical motors have an installed power higher than 100 kW (mainly in grinding and pelletizing processes) and have over 2.000 yearly operating hours.Energy efficiency classification of electrical motors is shown by IEC 60034:2007 legislation. According to this classifica-tion there are four possible levels:
• IE1 : standard efficiency• IE2 : high efficiency• IE3 : premium efficiency• IE4 : super premium efficiency (currently it is not
available in the market)
FANS. When designing or modifying an installation, it is es-sential to choose the correct size of fan for the installation, so that it operates as close as possible to maximum efficiency.
AIR SYSTEM. the design of an air system must meet certain conditions in order to be energy efficient. It is necessary to check that the system is airtight, particularly at joints.
ELECTRICAL MOTORS (and coupling with fans): choose the correct type and size of motor.
MANAGING AIRFLOW. airflow is a basic parameter when it comes to energy consumption by ventilation systems. For example: for a 20% reduction in flow, about 50% less power is consumed by the fan. Some ventilation installations do not have to operate constantly at their maximum rate. So it is important to be able to adjust the fan operating speed.
ELECTRONIC SPEEd CONTROLS. can be used to adapt the rate of operation of fans whilst optimising energy consumption by the motor, producing potentially significant energy savings.
29
The European directive EuP (Energy using Product), which con-cerns the motors defined by IEC 60034-30 legislation, requires to market high performance motors: IE2 from 16th June 2011; IE3 from 1st January 2015 for motors from 7,5 to 375 kW; and IE3 from 1st January 2017 for motors from 0,75 to 375 kW.
PROPER MOTOR SIzING. The maximum efficiency is obtained for the motors working between 60 to 100% full load. The induction motor efficiency typically peaks near 75% full load and is relatively flat down to the 50% load point. Under 40% full load, an electrical motor does not work at optimized conditions and the efficiency falls very quickly. However, motors in the larger size ranges can operate with reasonably high efficiencies at loads down to 30% of rated load. The efficiency of an electric motor according to the load is shown by the figure 11.
Figure 11: Efficiency of an electrical motor according to the load
(BREF, 2009).
Figure 10. Energy efficiency curves comparison (CIRCE, 2013).
E3E2E1
100
0.1 1 10 100 1000
95
90
85
80
75
70
Motor output (kW)
no
min
al e
ffici
ency
(%
)
load (%)
200
0
20
40
60
80
100
40 60 80 100e
ffici
ency
(%
)
30
4.4. Compressed air system (CAS)
Almost every industry has compressed air systems for many di-fferent aims: pellet mills, compressors, conveyors, etc. Energy efficiency in compressed air systems can be controlled by the following measures.
OPTIMIzING SYSTEM dESIGN. Many existing CASs lack an updated overall design. The implementation of additio-nal compressors and various applications in several stages along the installation lifetime frequently results in a subop-timal performance of a CAS. One fundamental parameter in a CAS is the pressure value which must satisfy 95% of all needs, using a small pressure-increasing device for the rest. Another fundamental design issue for a compressed air sys-tem is dimensioning the pipework and positioning the com-pressors. A properly designed system should have a pressure loss of less than 10% of the compressor’s discharge pressure to the point of use.
variable sPeed drive (vsd) and storage volu-
ME. Every time the air requirements of the process fluctuate (over times of the day and days of the week) the VSD and the storage volume will help reducing energy demanded by
MOTOR CONTROLS. The aim is to limit to the minimum ne-cessary the motors idling (no load run mode) for example by a presence sensor, a clock, a controlling process, etc. Thus, the way contributing to energy efficiency is switching off the mo-tors when they are not needed, for example by a switch or a contactor to connect and disconnect the motor from the mains. The adjustment of the motor speed through the use of va-riable speed drives (VSDs) can lead to significant energy sa-vings associated to better process control, less wear in the mechanical equipment. When loads vary, VSDs can redu-ce electrical energy consumption particularly in centrifugal pumps, compressors and fan applications. Materials proces-sing applications like hammer mill for example, as well as materials handling applications such as conveyors, can also benefit both in terms of energy consumption and overall performance through the use of VSDs.Transmission equipment including shafts, belts, chains, and gears should be properly installed and maintained. The transmission system from the motor to the load is a source of losses. These losses can vary significantly, from 0 to 45%. Direct coupling has to be the best possible option (where te-chnically feasible).
31
the compressed air system. The savings can be up to 30%, although the average gain in a CAS, where one compressor with a variable speed drive is added, is about 15%. In the other hand, a storage volume helps to reduce the pressure demand fluctuations and to fill short-timing peak demands.Variable speed drives on compressors, have also other bene-fits: stable pressure, higher power factor which keeps reacti-ve power low, and smooth start-up at low speeds extending the operating lifetime of the compressor.
REdUCING COMPRESSEd AIR SYSTEM LEAkS. The re-duction of compressed air system (CAS) leaks often has by far the highest potential gain on energy. Leakage is directly pro-portional to the system pressure (gauge). Leakages are present in every CAS and they are effective 24 hours a day, not only during production. The percentage of compressor capacity lost to leakage could be less than 15% in a well maintained large system, and up more to 25% in a poorly maintained ‘historically grown’ CAS.Preventive maintenance programmes for compressed air systems should therefore include leak prevention measu-res and periodic leak tests. An additional way to reduce leakage is to lower the operating pressure of the system:
with lower differential pressure across a leak, the leakage flow rate is reduced.
feeding tHe ComPressor(s) witH Cool outside
AIR. For thermodynamic reasons, the compression of warm air requires more energy than the compression of cool air. This energy can be saved simply by feeding the compressed air station with outside air. A duct can be installed connecting the outside and the intake of the compressor, or to the entire compressed air station. The outside intake should be placed on the north side or at least in the shade for most of the time.
oPtimizing tHe Pressure level. The lower the pres-sure level of the compressed air generated, the more cost effective the production. However, it is necessary to en-sure that all active consumers are supplied with sufficient compressed air at all times. The cheapest way to adjust the pressure range of a compressor is to use mechanical pressu-re switches. Pressure can also be readjusted by means of a frequency converter compressor functioning as a peak load compressor and adapting its speed drives to specific com-pressed air needs.
32
4.6. Insulation
In several TESLA sub-sectors, it is necessary to transfer heat either for heating or for cooling processes. It takes place, for example, in boilers where hot water or steam goes from boi-ler to the place in which it is used. In this kind of facilities the maintenance conditions of insulation materials are very important for avoiding thermal losses and condensation problems. Thus, insulation materials must follow several recommendations: to avoid rust problems, to protect from UVA rays, to be dry (pay attention to leaks that affect in-sulating capacity of insulating materials), to be flexible and easy-to-install, and to have low thermal conductivity (0,04 W/m°C or lower). Common range of working temperatures for insulating materials is between -50ºC and 110ºC
PIPES INSULATION. Potential savings achieved will depend on: pipe diameter and length (or insulating surface size), temperature difference, insulating material thermal resis-tance and insulating material thickness. Following, a simple example is presented: two pipes which transport a hot fluid, one with insulation material and the other without insula-tion material. In both cases, the fluid temperature is 60°C, air temperature is 15°C, pipe length 100 m, pipe diameter 150 mm, and the insulation material is polyurethane with
4.5. Variable speed drives
Variable speed drives can be installed in every process working at variable load, for example in feed sector: fans, hammer mill, compressor for compressed air systems, etc. Using it, the energy consumption of motors is lower since consumption is adapted to real process needs.Variable speed drives, also called adjustable speed drives, control the rotation speed on motors located in pumps, fans, conveyor belts or other machines. These drives ope-rate converting constant electrical grid input parameters (volt, frequency) in variable values. This change of fre-quency causes a change in the motor speed and also in the torque. It means that motor speed can be regulated accor-ding to external parameters such as, for example, tempera-ture, flow, etc. Speed control can be very important in the energy efficiency on processes.Energy savings depends on motor power, load, motor ope-ration profile, and yearly operation hours. For example, in some case, a fan working with or without variable speed dri-ve can vary its energy cons umption more than 30%.
33
energy transfer higher than 92%. The absorber is manufactured in copper with a selective treatment (TINOX) and they can be used at a maximum temperature of 250C, optical performance of 75% and transmittance coefficient of 2,9 W/m2°C .Potential saving achieved will depend on desirable solar energy cover rate. Common savings are around 50 - 70% depending on weather conditions and energy demand. It means that energy consumption in boiler can be reduced, and so, less fossil fuel will be consumed and less CO2 will be emitted. The solar thermal should be usefull in the Southern countries (Spain, Italy and Portugal).
31 mm thickness and thermal conductivity of 0,04 W/m°C. Comparison between heat losses in these two pipes shows that energy losses of the pipe with insulating material will be reduced in 85%, which means that a huge amount of energy can be saved simply by using thermal insulation in pipes.
valves insulation. Besides that, the fittings, valves and other connections are usually not well insulated. Re-usable and removable insulating pads are available for these surfa-ces. Considering an operating temperature of 150°C, room temperature 20°C, and valve size 150mm, potential energy savings for installing removable insulated valve covers are up to 970W (BREF, 2009).Moreover, as a general rule, any surface that reaches tem-peratures greater than 50°C where there is a risk of human contact, should be insulated to protect personnel.
4.7. Heating recovery
In this handbook three heating recovery method are mentioned, since they do not imply an increase in energy consumption.
SOLAR THERMAL FOR HEATING WATER. High perfor-mance solar collectors are equipped with a special glass with an
regulatorhot water
cool water
Figure 12. IMS Solar thermal system scheme (CPC solar).
34
changers can produce non-potable or potable water. When hot water is not required, the lubricant is rou-ted to the standard lubricant cooler. Hot water can be used in feed industry to steam production or any other application where hot water is required.
Heat recovery systems are available for most compressors on the market as optional equipment, either integrated in the compressor package or as an external solution. A properly designed heat recovery unit can recover approximately 50 - 90% of this available thermal energy.
Heat reCovery by eConomizer or Condenser.
The installation of a heat recovery system in boilers allows recovering heat from exhaust gases. In boilers many heat is lost by fumes so by recovering part of this heat, fuel energy consumption will be reduced. Economizer is a heat exchan-ger installed in fume smokestack that transfers heat from fu-mes to the boiler’s water or to other thermal process. The installation of economizer after the boiler allows reaching an energy saving until around 5% (fumes temperature decrea-se cannot exceed a limit because it would entail corrosion in heat exchanger and in fume smokestack).
Heat reCovery from air ComPressors. Most of the electrical energy used by an industrial air compressor is con-verted into heat and has to be conducted outwards. In many cases, a properly designed heat recovery unit can recover a high percentage of this available thermal energy and put to useful work heating either air or water when there is a de-mand. Two different recovery systems are available:
• Heating air: the heat recovered can be used for many applications requiring warm air. Ambient air is passed through the compessor where it gains the heat resul-ting of the compressed air process. The only system modifications needed are the addition of ducting and potentially another fan to handle the duct loading and to eliminate any back-pressure on the compressor coo-ling fan. These heat recovery systems can be modu-lated with a simple thermostatically-controlled hinged vent. Heating air can be used for example to warm room temperature.
• Heating water: it is also possible to use a heat exchanger to extract waste heat from the lubricant coolers found in packaged air-cooled and water-cooled compressors to produce hot water. Depending on design, heat ex-
35
Condenser allows recovering energy that is contained in combustion fumes by condensing a part of the water steam. The energy saving depends on combustion fumes tempera-ture decrease. In real cases, the installation of condenser after the boiler allows reaching an energy saving around 5 to 10%.
4.8. Lighting
In TESLA industrial sub-sectors are necessary a large amount of lighting inside buildings. Currently, there are installed a large variety of lamps, mainly gas discharge lamps (fluores-cents, high pressure sodium or mercury steam) or halogen
technologies. These devices are very inefficient and can be easily replaced by new ones using new LED technologies. This LED technology has longer lifetime (more than 50.000 hours), less maintenance operations, colour index of 80%, colour temperature of 4.000 K, and energy saving up to 75% (compared with gas discharge lamps or halogens). Lighting flow is 10.000 lm (for 110 W) and 20.000 lm (for 210 W). Besides that, light replacement is very easy due to LEDs de-sign. The following table shows energy savings considering the replacement of fluorescent lamps by LEDs.
table 8. energy savings aCHieved.
CURRENT SITUATION ENERGY EFFICIENCY SITUATION POWER REdUCTION
2x18W fluorescent tube (total installed power 42W considering an electromagnetic ballast)
LED18S (19W) 54%
2x58W fluorescent tube (total installed power 136W considering an electromagnetic ballast)
LED60S (57W) 58%
250W mercury steam lamp (total installed power 268 W considering auxiliary devices)
BY120P (110 W) 58%
400W mercury steam lamp (total installed power 428 W considering auxiliary devices)
BY121P (210 W) 51%
Source: Philips.
36
4.10. High efficiency in power transformers
All industries’ facilities have a power transformer to convert electricity that comes from the grid. However in old installa-tions transformers are very old, use oil and their efficiency is not as high as possible. The worst the transformer current situation is, the higher the energy consumption will be. This measure will be specially recommended in those industries having high yearly operation hours, such as animal feed fac-tories or fruit and vegetables processing plants. This energy saving is really done when transformers are broken due to the long payback of its implementation.Dry transformers reduce transformer losses up to 70% and are safe and free of maintenance, with an excellent capacity to support overload and an excellent resistance to short circuit.
4.11. Management tools
Different solutions can be considered to improve energy efficiency. These solutions are not only technical but also solutions linked to management methods, such as product quality management, energy management, or production management could be considered.Factors affecting product quality such as conditioning tem-
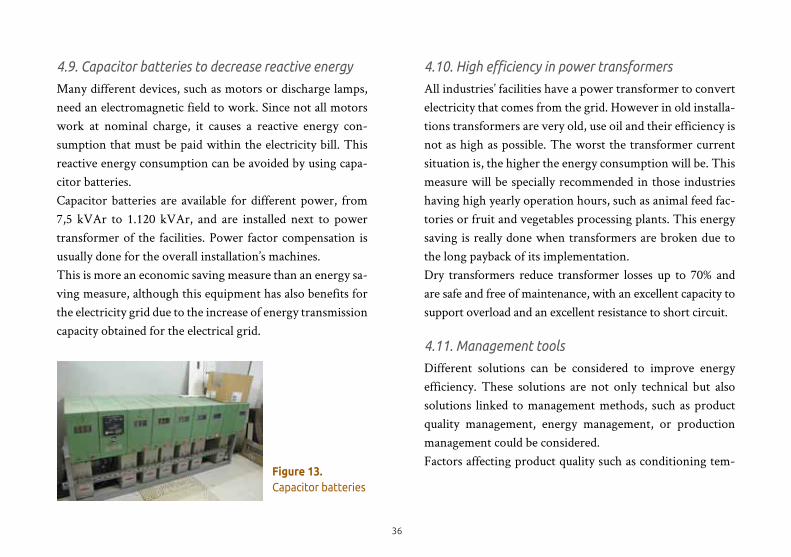
4.9. Capacitor batteries to decrease reactive energy
Many different devices, such as motors or discharge lamps, need an electromagnetic field to work. Since not all motors work at nominal charge, it causes a reactive energy con-sumption that must be paid within the electricity bill. This reactive energy consumption can be avoided by using capa-citor batteries.Capacitor batteries are available for different power, from 7,5 kVAr to 1.120 kVAr, and are installed next to power transformer of the facilities. Power factor compensation is usually done for the overall installation’s machines.This is more an economic saving measure than an energy sa-ving measure, although this equipment has also benefits for the electricity grid due to the increase of energy transmission capacity obtained for the electrical grid.
Figure 13. Capacitor batteries
37
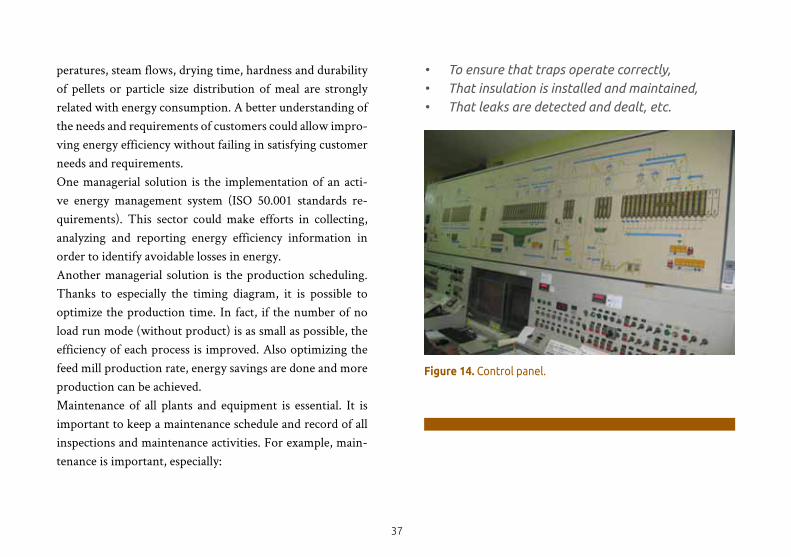
peratures, steam flows, drying time, hardness and durability of pellets or particle size distribution of meal are strongly related with energy consumption. A better understanding of the needs and requirements of customers could allow impro-ving energy efficiency without failing in satisfying customer needs and requirements. One managerial solution is the implementation of an acti-ve energy management system (ISO 50.001 standards re-quirements). This sector could make efforts in collecting, analyzing and reporting energy efficiency information in order to identify avoidable losses in energy.Another managerial solution is the production scheduling. Thanks to especially the timing diagram, it is possible to optimize the production time. In fact, if the number of no load run mode (without product) is as small as possible, the efficiency of each process is improved. Also optimizing the feed mill production rate, energy savings are done and more production can be achieved.Maintenance of all plants and equipment is essential. It is important to keep a maintenance schedule and record of all inspections and maintenance activities. For example, main-tenance is important, especially:
• To ensure that traps operate correctly, • That insulation is installed and maintained,• That leaks are detected and dealt, etc.
Figure 14. Control panel.
38
To conclude, it is necessary to optimise energy consump-tion in order to reduce energy costs. With the knowledge of the parameters which have impact on the energy balance, it is possible to reduce critical points and to use suitable te-chniques. According to the energy type used (electrical or thermal), some techniques are similar (automation, a well-dimensioned design, etc.), other are different (for example, insulation for thermal processes). Finally, a correct and fre-quent maintenance of the equipment is also a good way to save energy.
5. CONCLUSIONS
Each country has these typical production characteristics. The energy saving measures could be different for each country depending on specific conditions such as energy price and energy regulation. Moreover, in a particular coun-try, each feed mill should be considered like a unique case because the energy efficiency solutions proposed for a feed mill could not be the most suitable for another feed mill. In order to improve its energy efficiency, a feed mill can imple-ment techniques which are described in Best Available Te-chniques reference documents (BREFs). At present, it exists more than 30 BREFs, including one on the energy efficien-cy. This document indicates many techniques which can be applied in animal feed sector. These techniques can also be management tools (energy management,…). But, before the implementing of these techniques, it is necessary to observe the practices and to have an important amount of data in order to evaluate as precisely as possible the different energy saving opportunities and their impact on the energy efficien-cy management of a feed mill. Energy efficiency also requires a well-dimensioned process used (motor power, compressed air system design, etc.).
39
6. REFERENCES
- Tecaliman, Centre technique de l’alimentation animale, http://
www.tecaliman.com/
- SNIA, Syndicat national des industries agroalimentaires, http://