IEEE TRANSACTIONS ON BROADCASTING, VOL. 60, NO. 4, DECEMBER 2014 637 Temporal Video Quality Model Accounting for Variable Frame Delay Distortions Margaret H. Pinson, Lark Kwon Choi, and Alan Conrad Bovik, Fellow, IEEE Abstract—We announce a new video quality model (VQM) that accounts for the perceptual impact of variable frame delays (VFD) in videos with demonstrated top performance on the laboratory for image and video engineering (LIVE) mobile video quality assessment (VQA) database. This model, called VQM_VFD, uses perceptual features extracted from spatial- temporal blocks spanning fixed angular extents and a long edge detection filter. VQM_VFD predicts video quality by measur- ing multiple frame delays using perception based parameters to track subjective quality over time. In the performance analy- sis of VQM_VFD, we evaluated its efficacy at predicting human opinions of visual quality. A detailed correlation analysis and statistical hypothesis testing show that VQM_VFD accurately predicts human subjective judgments and substantially out- performs top-performing image quality assessment and VQA models previously tested on the LIVE mobile VQA database. VQM_VFD achieved the best performance on the mobile and tablet studies of the LIVE mobile VQA database for simulated compression, wireless packet-loss, and rate adaptation, but not for temporal dynamics. These results validate the new model and warrant a hard release of the VQM_VFD algorithm. It is freely available for any purpose, commercial, or noncommercial at http://www.its.bldrdoc.gov/vqm/. Index Terms—Edge detection, video quality model, video qual- ity assessment, variable frame delay, video quality database, VQM_VFD. I. I NTRODUCTION M ODERN video transmission systems contain different impairments than those seen two decades ago. Back in the 1990s, video codecs operated with one system delay. Difficult-to-code segments resulted in lower frame rates and more delay; easy-to-code segments resulted in higher frame rates and less delay. These delays always varied around a sin- gle system delay. Changes to delay occurred gradually, making them difficult for a naïve viewer to notice. Today, video transmitted over the internet contains occa- sional, systematic change to the delay. That is, the sys- tem varies around one delay for a while, an event occurs, Manuscript received August 28, 2014; revised October 2, 2014; accepted October 14, 2014. Date of publication November 12, 2014; date of current version December 5, 2014. M. H. Pinson is with the Institute for Telecommunication Sciences, Boulder, CO 80305 USA (e-mail: [email protected]). L. K. Choi and A. C. Bovik are with the Laboratory for Image and Video Engineering and the Wireless Networking and Communications Group, Department of Electrical and Computer Engineering, the University of Texas at Austin, Austin, TX 78712-1084 USA (e-mail: [email protected]; [email protected]). Color versions of one or more of the figures in this paper are available online at http://ieeexplore.ieee.org. Digital Object Identifier 10.1109/TBC.2014.2365260 then the system varies around a different delay, and so on. Example events are rebuffering and decoder buffer overflow / underflow. These changes are often abrupt and easy to perceive (e.g., the video freezes without loss of content). The Laboratory for Image & Video Engineering (LIVE) Mobile Video Quality Assessment (VQA) database [1] is a tool to investigate this “multiple system delays” problem. It contains a variety of video impairments that are typical of heavily loaded wireless networks, including dynamically varying distortions such as frame freeze and time varying compression rates, as well as static distortions such as com- pression and wireless packet loss. In August of 2012, LIVE made these video sequences and subjective scores available upon request to researchers. One goal is to encourage devel- opment of improved video quality models that are appropriate for mobile video applications. Objective video quality models are struggling to catch up with the impact of multiple system delays on users’ percep- tion of video quality. Most models were designed under the one system delay paradigm. Two examples are Peak Signal to Noise Ratio (PSNR, see the Appendix) and the NTIA General Model, released in 2001 under the name Video Quality Metric (VQM) [2], [3]. In August of 2011, Wolf and Pinson [4] issued a soft release of a new model: the video quality model for variable frame delay (VQM_VFD). This model was designed to accommo- date the reality of multiple system delays. Code implementing VQM_VFD is freely available for any purpose, commercial or non-commercial [5]. VQM_VFD was soft released with a small announcement, while independent analyses were being sought. Another goal of the LIVE Mobile VQA database was to analyze the performance of existing objective video quality models for mobile applications. Moorthy et al.[6] analyzed the performance of eleven objective video quality models. Their conclusion was that existing VQA algorithms are not well-equipped to handle distortions that vary over time. This analysis did not include VQM_VFD, as the authors were not aware of each other’s work. We have recently employed the LIVE Mobile VQA database to independently analyze the performance of the VQM_VFD model. The VQA database was not made avail- able to NTIA until after the analyses listed in this report were completed (to ensure impartial analysis). The good performance of VQM_VFD on this database verifies the value of the new model, which thus warrants a hard release. 0018-9316 c 2014 IEEE. Translations and content mining are permitted for academic research only. Personal use is permitted, but republication/ redistribution requires IEEE permission. See http://www.ieee.org/publications_standards/publications/rights/index.html for more information.
Transcript
IEEE TRANSACTIONS ON BROADCASTING, VOL. 60, NO. 4, DECEMBER 2014 637
Temporal Video Quality Model Accounting forVariable Frame Delay Distortions
Margaret H. Pinson, Lark Kwon Choi, and Alan Conrad Bovik, Fellow, IEEE
Abstract—We announce a new video quality model (VQM)that accounts for the perceptual impact of variable framedelays (VFD) in videos with demonstrated top performance onthe laboratory for image and video engineering (LIVE) mobilevideo quality assessment (VQA) database. This model, calledVQM_VFD, uses perceptual features extracted from spatial-temporal blocks spanning fixed angular extents and a long edgedetection filter. VQM_VFD predicts video quality by measur-ing multiple frame delays using perception based parameters totrack subjective quality over time. In the performance analy-sis of VQM_VFD, we evaluated its efficacy at predicting humanopinions of visual quality. A detailed correlation analysis andstatistical hypothesis testing show that VQM_VFD accuratelypredicts human subjective judgments and substantially out-performs top-performing image quality assessment and VQAmodels previously tested on the LIVE mobile VQA database.VQM_VFD achieved the best performance on the mobile andtablet studies of the LIVE mobile VQA database for simulatedcompression, wireless packet-loss, and rate adaptation, but notfor temporal dynamics. These results validate the new modeland warrant a hard release of the VQM_VFD algorithm. It isfreely available for any purpose, commercial, or noncommercialat http://www.its.bldrdoc.gov/vqm/.
Index Terms—Edge detection, video quality model, video qual-ity assessment, variable frame delay, video quality database,VQM_VFD.
I. INTRODUCTION
MODERN video transmission systems contain differentimpairments than those seen two decades ago. Back
in the 1990s, video codecs operated with one system delay.Difficult-to-code segments resulted in lower frame rates andmore delay; easy-to-code segments resulted in higher framerates and less delay. These delays always varied around a sin-gle system delay. Changes to delay occurred gradually, makingthem difficult for a naïve viewer to notice.
Today, video transmitted over the internet contains occa-sional, systematic change to the delay. That is, the sys-tem varies around one delay for a while, an event occurs,
Manuscript received August 28, 2014; revised October 2, 2014; acceptedOctober 14, 2014. Date of publication November 12, 2014; date of currentversion December 5, 2014.
M. H. Pinson is with the Institute for Telecommunication Sciences, Boulder,CO 80305 USA (e-mail: [email protected]).
L. K. Choi and A. C. Bovik are with the Laboratory for Image andVideo Engineering and the Wireless Networking and Communications Group,Department of Electrical and Computer Engineering, the University of Texasat Austin, Austin, TX 78712-1084 USA (e-mail: [email protected];[email protected]).
Color versions of one or more of the figures in this paper are availableonline at http://ieeexplore.ieee.org.
Digital Object Identifier 10.1109/TBC.2014.2365260
then the system varies around a different delay, and so on.Example events are rebuffering and decoder buffer overflow /underflow. These changes are often abrupt and easy to perceive(e.g., the video freezes without loss of content).
The Laboratory for Image & Video Engineering (LIVE)Mobile Video Quality Assessment (VQA) database [1] is atool to investigate this “multiple system delays” problem.It contains a variety of video impairments that are typicalof heavily loaded wireless networks, including dynamicallyvarying distortions such as frame freeze and time varyingcompression rates, as well as static distortions such as com-pression and wireless packet loss. In August of 2012, LIVEmade these video sequences and subjective scores availableupon request to researchers. One goal is to encourage devel-opment of improved video quality models that are appropriatefor mobile video applications.
Objective video quality models are struggling to catch upwith the impact of multiple system delays on users’ percep-tion of video quality. Most models were designed under theone system delay paradigm. Two examples are Peak Signalto Noise Ratio (PSNR, see the Appendix) and the NTIAGeneral Model, released in 2001 under the name Video QualityMetric (VQM) [2], [3].
In August of 2011, Wolf and Pinson [4] issued a soft releaseof a new model: the video quality model for variable framedelay (VQM_VFD). This model was designed to accommo-date the reality of multiple system delays. Code implementingVQM_VFD is freely available for any purpose, commercialor non-commercial [5]. VQM_VFD was soft released with asmall announcement, while independent analyses were beingsought.
Another goal of the LIVE Mobile VQA database was toanalyze the performance of existing objective video qualitymodels for mobile applications. Moorthy et al. [6] analyzedthe performance of eleven objective video quality models.Their conclusion was that existing VQA algorithms are notwell-equipped to handle distortions that vary over time. Thisanalysis did not include VQM_VFD, as the authors were notaware of each other’s work.
We have recently employed the LIVE Mobile VQAdatabase to independently analyze the performance of theVQM_VFD model. The VQA database was not made avail-able to NTIA until after the analyses listed in this reportwere completed (to ensure impartial analysis). The goodperformance of VQM_VFD on this database verifies thevalue of the new model, which thus warrants a hardrelease.
638 IEEE TRANSACTIONS ON BROADCASTING, VOL. 60, NO. 4, DECEMBER 2014
II. VQM_VFD
A. Background and Design Goals
In 2001, NTIA finalized the General Video QualityModel (VQM) [2], [3]. VQM was trained on 11 datasets, con-taining a total of 1,536 subjectively rated video sequences [2].VQM is one of the first of four models developed for dig-ital video codecs that passed scrutiny when independentlyexamined by the Video Quality Experts Group (VQEG). Ofthese four models, only VQM showed equally strong perfor-mance for both American and European frame rates. VQMgained popularity and is widely used.1 However, VQM hasthe following known flaws:
• Training data limited to standard definition television andCIF resolution progressive video
• Few examples of transmission errors in the training data• Assumes the “single system delay” paradigmVQM is a reduced reference (RR) metric, meaning low
bandwidth features are extracted from the original video andcompared to the processed video. For practical reasons, suchas the difficulty of getting in-service access to original videos,the software implementations of VQM are full reference (FR).This means that the entire original video and processed videoare available at one location. An overview of these and othermodel types is provided by Wang and Jiang [7].
By 2010, NTIA had access to 83 datasets, containing a totalof 11,255 subjectively rated video sequences. These datasetsinclude five image sizes: Quarter Common IntermediateFormat (QCIF), Common Intermediate Format (CIF), VideoGraphics Array (VGA), Standard Definition (SD), and HighDefinition (HD). Five combined datasets were created, eachwith one image size. The Iterative Nested Least SquaresAlgorithm (INLSA) was used to map the subjective scoresonto the nominal (0, 1) common scale [8]. This enabled thecombined datasets to be used for developing and testing theoutput mapping.
NTIA decided to develop a new FR model to replaceVQM. The design goals were as follows:
• Include the multi-system delay paradigm• Allow different viewing distances• Improve accuracy for transmission error impairments• 0.90 Pearson Correlation on training data for each of five
resolutions: QCIF, CIF, VGA, SD & HDLike VQM and PSNR, this new FR model requires
calibrated video sequences. Calibration algorithms estimateand remove systematic differences between the original andreceived sequence that do not impact quality:
• A constant spatial shift, horizontally and/or vertically• A small amounts of spatial scaling (e.g., ≤ 10%)• A constant delay• A small, constant gain and offset applied to the luma
component / Y in the YCbCr colorspace (e.g., ≤ 10%)• A change to the overscan size
NTIA developed two sets of calibration routines that can beused for this purpose. The first are FR calibration routines
1As of the date this article was submitted for publication, Google Scholarfinds 655 citations associated with [3]. This does not capture papers that citeVQM with [2], ITU-T Rec. J.144, or ITU-R Rec. BT.1683.
defined in [2] and [3]. The second are reduced reference (RR)calibration routines defined in [9].
B. VFD: Measurement of Multiple Frame Delays
Digital video transmission systems can produce pauses inthe video presentation, after which the video may continuewith or without skipping video frames. Sometimes sections ofthe original video stream may be missing entirely (skippingwithout pausing).
Time varying delays of the output (or processed) videoframes with respect to the input (i.e., the original or refer-ence) video frames present significant challenges for FR videoquality measurement systems. Time alignment errors betweenthe output video sequence and the input video sequence canproduce measurement errors that greatly exceed the perceptualimpact of these time varying video delays.
Wolf [10] describes an algorithm that finds the best match-ing original frame for each received frame. This variableframe delay (VFD) algorithm does pixel-by-pixel comparisonsbetween each received frame and a range of original videoframes. A heuristic algorithm chooses the set of most likelymatching frames. The VFD algorithm steps are as follows.
• Normalize each original and processed frame (or field)for zero mean and unit variance.
• Compute mean squared error (MSE) between each pro-cessed frame (or field).
• Choose a threshold below which MSE indicates a likelycandidate for correct alignment. This threshold is setempirically, based on the range of MSE for the cur-rent frame (or field). This produces a fuzzy set of likelyalignments for each frame (or field).
• Compute frame (or field) update patterns that are likelyand ensure causality. This produces a set of alignmentalternatives, some of which may not span the entireduration of the clip.
• Sort these update patterns by length. Compute the mostprobable alignment pattern for the entire sequence, basedupon the assumption that longer update patterns are morelikely to be correct than shorter update patterns.
• If the longest update pattern does not span the entiresequence, fill gaps using a multi-stage set of heuristics.
The original video sequence is then modified so it matchesthe processed video sequence (i.e., VFD-matched originalvideo). For instance, if the received video sequence repeatsevery other frame, then the original sequence would matchthis behavior. The VFD information generated from thisstep, together with the calibrated processed video, and theVFD-matched original video are sent to the objective model. Inthis way, the objective model predicts quality based on correctlyaligned original and distorted frames, and on the estimatedannoyance of frame delay variations and frame repetition.
The VFD algorithms act as a pre-filter for two objectivevideo quality models: VQM_VFD and PSNR_VFD.
C. PSNR_VFD
PSNR is probably the most well-known objective videoquality model. PSNR is a logical extension of signal-to-noise
PINSON et al.: TEMPORAL VQM ACCOUNTING FOR VFD DISTORTIONS 639
ratio, which is a long standing electrical engineering measure-ment. PSNR is on a logarithmic decibel scale, which is nota perceptual scale. PSNR is widely accepted by industry andhas value for that alone.
There are multiple variations of the PSNR in use. TheNTIA author is aware that a proprietary implementation ofthis algorithm calculates and removes the impact of variableframe delays before calculating PSNR. This motivated NTIAto develop a freely available variant, PSNR_VFD.
PSNR_VFD [10] is calculated by comparing the receivedvideo with the VFD-matched original video. PSNR is thencalculated as:
PSNR = 10 × log10
⎛⎝ 2552
1N
∑x∑
y∑
t
(Ox,y,t − Px,y,t
)2
⎞⎠ (1)
where• O is the luma plane of the original video• P is the luma plane of the received video• x, y, and t index the video horizontally, vertically,
and in time• N is the total number of pixels used in the calculationLike most versions of PSNR, this model is very sensitive to
calibration errors. PSRN_VFD is intended to be run in threesteps: first calibrate the received video, second calculate VFDinformation, and third calculate PSNR_VFD. In our experi-ments, PSNR_VFD is run twice: once with the FR calibrationroutines [2] and once with the RR calibration routines [9].2
PSNR_VFD does not capture errors due to temporal mis-alignments of the video frames, or indeed any artifacts whoseperceptual impact is primarily temporal (such as flicker).Instead of measuring overall video quality as perceived bya person, PSNR_VFD isolates one element: the amount ofdistortion in individual frames.
The goal of PSNR_VFD is to enable subsequent root causeanalysis. PSNR_VFD focuses on one aspect of video quality:how well individual frames replicate the original picture. Rootcause analysis may provide useful indicators as to why thevideo system is producing the given quality level.
The disadvantage is that PSNR_VFD does not always tracksubjective opinion, as we will see in Section IV. PSNR_VFDis used by the VQM_VFD model, as one of its parameters.
D. VQM_VFD Filters
A core component of both VQM and VQM_VFD is a spatialinformation (SI) filter that detects long edges. This filter issimilar to the classical Sobel filter in that separate horizontaland vertical filters are applied, then the total edge energy iscomputed as the Euclidean distance:
SIn (i, j, t) =√
Hn(i, j, t)2 + Vn(i, j, t)2 (2)
where the filter size is (n×n), i is the row, j is the column, t isthe time (frame number), Hn is the horizontal bandpass filteredvideo, and Vn is the vertical bandpass filtered video. Unlike
Sobel, each line of the horizontal bandpass filter is identical,and likewise each column of the vertical bandpass filter.
Next, SIn is separated into HVn and HVn, such that HVn
contains the horizontal-vertical edges (and zero otherwise),and HVn contains the diagonal edges. Low energy edges areomitted.
Filter SIn assumes that subjects focus on long edges andtend to ignore short edges. As the filter size increases (e.g., SI5,SI7, SI9), individual pixels and small details have a decreasingimpact on the edge strength and angle calculation. By contrast,Sobel (3 × 3) responds identically to short and long edges.
The optimal SIn filter size depends upon the resolutionof the target video and, consequently, the length of interest-ing edges. The filter sizes used by VQM_VFD were chosenempirically, based on the training databases: SI5 for QCIF res-olution video, SI9 for CIF, SI13 for standard definition, and SI13for HD. Naturally there are diminishing returns. SI21 showedslightly improved performance over SI13 for HD, but the per-formance difference was too small to justify the slower runspeed.
The SIn, HVn and HVn filters have potential value for othervideo or image processing applications. The advantage of SIn
is the ability to detect long edges. HVn and HVn providea means to detect a shift of energy from diagonal edges tohorizontal & vertical edges (e.g., blocking or tiling) or theopposite (e.g., blurred vertical edges). Here, we have onlysummarized the filters. Source code is available online athttp://www.its.bldrdoc.gov/resources/video-quality-research/guides-and-tutorials/guides-and-tutorials.aspx.
E. VQM_VFD Model Parameters
VQM_VFD computes video quality by comparing thereceived video sequence to the VFD-matched original video.This new video quality model accounts for the perceptualimpact of variable frame delays, by using features extractedfrom spatial-temporal (ST) blocks spanning a fixed angularextent as seen by the eye. Thus, the ST block sizes change inresponse to the viewing distance. This enables VQM_VFD totrack subjective quality over a wide range of viewing distancesand image sizes.
Features and parameters are extracted from ST blocks. EachST block has a fixed angular extent θ , as seen by the viewer,plus a time extent in seconds. The viewing distance is an inputparameter to the model. The ST block size is translated fromangular degrees and seconds into pixels and frames using thecurrent viewing distance and video sequence’s frame rate. ForVQM_VFD, θ is 0.4 degrees. The time extent is 0.2 sec, whichis identical to VQM.
A “feature” is a quantity of information associated with, orextracted from, an ST block. A “parameter” is a measure ofvideo distortion that is the result of comparing two parallelstreams of features, one stream from the original video andthe corresponding stream from the processed video. The eightparameters of VQM_VFD are briefly summarized below. Thereader is directed to the source code for additional details,including algorithms not given here for clipping functions,thresholds, and weighting.
640 IEEE TRANSACTIONS ON BROADCASTING, VOL. 60, NO. 4, DECEMBER 2014
Fig. 1. De-weighting function that reduces the HV_Loss parameter ST-blocksfor ST-blocks with low and high luma levels. C1 = 0.64, C2 = 100, andC3 = 0.40.
1) HV_Loss: HV_Loss detects a loss in horizontal and ver-tical spatial edge energy, compared to diagonal edge energy.The computation begins by estimating the edge energy in eachST block in both the original and processed video:
fHV = mean (HVn) /mean(HVn
)(3)
where mean computes the average over the pixels within a par-ticular ST block. A minimum threshold is applied separatelyto mean (HVn) and mean
(HVn
)to eliminate erratic behavior
from imperceptible impairments. The filter adapts in size tothe video resolution (e.g., HV13 for HD, SD and VGA; HV9for CIF; and HV5 for QCIF).
The differences between original and processed features arecomputed by estimating the change in HV edge energy:
pHVL = min(log10
(f HVorig/fHVproc
),0
)(4)
where fHVorig is (3) calculated on the original video, fHVproc
is (3) calculated on the processed video, and min computesminimum. This produces one parameter value per ST block,where decreasing (negative) values of pHVL indicate the pro-cessed video has lost horizontal & vertical edge energy. Thevisual masking function in (4) implies that impairment per-ception is inversely proportionate to the amount of localactivity.
The HV_Loss parameter in VQM was oversensitive toimpairments for scenes with low and high luma levels and lowand high motion levels (i.e., HV_Loss values were too large,so the quality predicted was too low). Thus, VQM_VFD’sHV_Loss parameter includes a quadratic weighting functionthat de-weights ST blocks containing low and high luma levelsand/or low and high motion levels. These weighting functionsreduce the magnitude of impairments detected in individualST-blocks. Fig. 1 depicts the luma de-weighting function.
After the de-weighting function, the three-dimensionalmatrix of parameter values is reduced by a single number by:
HV_Loss = [meantime(below5%space(pHVLdw))
]2 (5)
where pHVLdw are the de-weighted pHVL values,below5%space computes the average of the 0th through
5th percentile values for all ST blocks associated with thesame time segment, and meantime computes the average overtime. Put another way, below5% detects the areas of the videothat contain the greatest loss in HV edge energy. As a finalstep, a clipping function is applied to eliminate small values.This reduces the parameter’s sensitivity to small impairments
2) HV_Gain: HV_Gain detects an increase in horizon-tal and vertical spatial edge energy, compared to diagonaledge energy. Both HV_Loss and HV_Gain can be causedby edge coding noise. The computation is identical toHV_Loss through (4), except that minimum is replaced bymaximum:
pHVG = max(log10
(f HVoriginal/fHVprocessed
), 0
)(6)
where max computes the maximum. This produces one param-eter value per ST block, where increasing values of pHVGindicate the processed video has gained horizontal and verticaledge energy.
The three-dimensional matrix of parameter values is reducedby a single number by:
HV_Gain = rmstime(rmsspace (pHVG)
)(7)
where rmsspace computes the root mean square (RMS) for allST blocks associated with the same time segment, and rmstime
computes the RMS over time.3) SI_Loss: SI_Loss detects a general decrease in spatial
edge energy over time due, for example, to blurring. The com-putation begins by calculating SIn feature values for each STblock in both the original and processed video:
fSI = stdev(SIn) (8)
where stdev computes standard deviation over a particular STblock. A minimum threshold eliminates erratic behavior fromimperceptible impairments. The SIn filter adapts in size to thevideo resolution as per HV_Loss.
The difference between original and processed video iscomputed by estimating the loss in SI edge energy:
pSIL = min[((
fSIproc − f SIorig)/fSIproc
), 0
](9)
where fSIorig is (8) calculated on the original video, and fSIproc
is (8) calculated on the processed video. This produces oneparameter value per ST block, where decreasing (negative) val-ues of pSIL indicate the processed video has lost edge energy.The visual masking function in (9) acts similarly to that seenin (4) and (6).
The three-dimensional matrix of parameter values is reducedby a single number by:
SI_Loss = above90%time(meanspace( pSIL)) (10)
where meanspace computes the average for all ST blocks asso-ciated with the same time segment, and above95%time averagesthe 90th through 100th percentile values over time. Functionabove90%time focuses on the time segments with the worstimpairments.
PINSON et al.: TEMPORAL VQM ACCOUNTING FOR VFD DISTORTIONS 641
4) SI_Gain: SI_Gain detects a general increase in spatialedge energy over time using the same adaptive edge filter.The SI_Gain parameter is sensitive to transient added edgesin the picture. SI_Gain uses the same features as SI_loss,from (8), but applies a different visibility threshold. The dif-ference between original and processed video is computed byestimating the gain in SI edge energy:
pSIG = max[((
f SIproc − f SIorig)/ f SIproc
), 0
](11)
This produces one parameter value per ST block, whereincreasing values of pSIG indicate the processed video hasgained edge energy. The three-dimensional matrix of parame-ter values is reduced by a single number by:
SI_Loss = rmstime(above98%tailspace( pSIG)) (12)
where above98%tailspace computes the difference between twovalues: (a) the average of the 98th through 100th percentilevalues over space and (b) the 98th percentile value over space.This measures the spread of the worst quality levels seen inone time segment.
5) TI_Gain: TI_Gain computes temporal information (TI)of an ST block by computing the pixel-by-pixel differencebetween the current frame and the previous frame.
fTI = rms(Y (i, j, t) − Y(i, j, t − 1)) (13)
where rms computes RMS over a particular ST block andY(i,j,t) is the luma plane. A minimum threshold on fTIeliminates erratic behavior from imperceptible impairments.
The difference between original and processed video iscomputed by estimating the gain in TI edge energy:
pTIG = max[log10
(f TIorig/fTIproc
), 0
](14)
where fTIorig is (13) calculated on the original video, andfTIproc is (13) calculated on the processed video. This producesone parameter value per ST block, where increasing values ofpTIL indicate the processed video has gained motion energy.
The three-dimensional matrix of parameter values is reducedby a single number by:
TI_Gain = STabove95%tail( pTIG) (15)
where STabove95%tail computes difference between two val-ues: (a) the average of the 95th through 100th percentile valuesand (b) the 95th percentile value. Equation (15) pools all valuesof pTIG into a single ST collapsing function. This measuresthe spread of the worst quality levels seen over the entiresequence.
Since the original video is VFD-matched to the processedclip, the TI_Gain parameter does not have a large sensitivity todropped or repeated frames—these are compensated for by theVFD matching process. Rather, the TI_Gain parameter mea-sures added transient distortions in the processed video (suchas error blocks) that are not compensated for by the VFD cor-rection. TI_Gain is sensitive to transient-added errors in thepicture.
6) RMSE_Gain: RMSE_Gain is a full reference parameterthat is computed by comparing pixels within an ST block ofthe received clip and the VFD-matched original clip.
pDiff = Yproc(i, j, t) − Yorig(i, j, t) (16)
where Yproc is the luma plane of the processed video, andYorig is the luma plane of the original video. RMSE_Gain iscalculated as follows:
RMSE_Gain = STmean[max (rmse ( pDiff ), 0)
](17)
where STmean takes the average over all parameter values inspace and time, and rmse is root mean square error.
7) VFD_Par1: VFD_Par1 is extracted from variable framedelay (VFD) information. This temporal distortion parameteris only triggered by delay changes (e.g., received frame Naligns to original frame N, but received frame N + 1 aligns tooriginal frame N + 3). VFD_Par1 is weighted by the dura-tion of the freeze preceding the delay changes (e.g., longfreezes are more heavily penalized than many small framefreezes). VFD_Par1 ignores pure frame freezes, for examplefrom a constant reduction to the frame rate, and errs on theside of detecting no impairment when the VFD alignments areambiguous.
8) VFD_Par1·PSNR_VFD: VFD_Par1·PSNR_VFD is theproduct of VFD_Par1 and the full reference metricPSNR_VFD. This parameter is triggered by video clips thatcontain both temporal distortions impacting the pattern offrames (e.g., pauses and skips detected by VFD_Par1) and spa-tial distortions impacting individual frames (e.g., fine detailsdetected by PSNR_VFD).
F. VQM_VFD Model Description and Training
The VFD algorithm and VFD_Par1 were developed usinga small number of clips known to contain variable framedelays. This training emphasized manual inspection of individ-ual received sequences and VFD delay traces. VFD_Par1 andVFD_Par1·PSNR_VFD were tested on portions of the QCIF,CIF and VGA combined subsets (see [10]).
The remaining parameters were chosen for consistent per-formance across all five combined datasets, either in isolationor as a complement to the other parameters. The HV_Loss,HV_Gain, SI_Loss and SI_Gain parameters are similar toparameters used in the prior model, VQM, with improve-ments that appear in the Fast Low Bandwidth Models [11].Variants of TI_Gain and RMSE_Gain were considered forinclusion in those prior models. The final form for eachparameter was determined by calculating numerous varia-tions (e.g., different values for θ and the time extent; see [2]for other examples). The parameter variant and parametercombinations were experimentally determined via searchesof the five combined databases using Pearson’s correlationcoefficient.
A neural network (NN) is used to combine these eight objec-tive video quality parameters. The video sequences from the83 databases were randomly divided into 70% NN training
642 IEEE TRANSACTIONS ON BROADCASTING, VOL. 60, NO. 4, DECEMBER 2014
Fig. 2. Rate adaptation. Schematic diagram of the three different rate-switches in a video stream simulated in this paper.
and 30% NN testing. The MATLAB� NN training tool(nntraintool) was used to train and test the NN.3
The eight-parameter input vector is multiplied by an 8 × 8weighting matrix, which is added to a bias vector, and sentto a hidden layer consisting of eight tan-sigmoid (tansig)neurons. The outputs of these eight tansig neurons are thenweighted, summed together with a bias, and sent to a pure-linear (purelin) output neuron. There are thus 72 weights andnine biases in the NN, for a total of 81 free parameters, whichare determined in the training phase. A tansig/purelin NN waschosen because of its ability to act as a generalized functionapproximator (i.e., be similar to nearly any function).
VQM_VFD achieves a 0.9 Pearson correlation to subjectivequality for each of the five subjective datasets.
G. Comments on VQM_VFD
While the VQM_VFD model achieves good performancein predicting subjective ratings, there is always room forimprovement. One obvious improvement would be the addi-tion of color distortion parameters.
One possible reason for the difficulty in obtaining a robustcolor distortion measure that brings added information to theVQM_VFD model might be the lack of independent colordistortions in the subject datasets. Distortions that appear inthe chroma channels (CB, CR) nearly always also appear inthe luma channel (Y).
Another reason might be that some of the color distortionsare actually pleasing to the eye (e.g., colors are made morevibrant). Thus, a color distortion metric probably needs to bebipolar, where some distortions produce increases in subjectivequality while others produce decreases in subjective quality.
III. TESTING ON THE LIVE MOBILE VQA DATABASE
A. Background and Motivation
The Laboratory for Image & Video Engineering (LIVE) atthe University of Texas at Austin performs research on thehuman perception of video and images. LIVE is known forthe LIVE image quality database [12], the LIVE video qualitydatabase [13], and the LIVE 3D image quality database [14].These databases are available to the research community freeof charge.
The recently-released LIVE Mobile VQA database focuseson video quality distortions typical of a heavily-traffickedwireless network. The goal was to make a dataset available
3Certain commercial equipment, materials, and/or programs are identifiedin this report to specify adequately the experimental procedure. In no casedoes such identification imply recommendation or endorsement by the authorsor their employers, nor does it imply that the program or equipment identifiedis necessarily the best available for this application.
to researchers that aids the development of perceptually opti-mized VQA algorithms for wireless video transmission onmobile devices and that helps the design of video stream-ing strategies for video network resource allocation and rateadaptation as a function of time. It is useful for our purposessince it includes systematic simulations of realistic distortionincluding changes in delay. The dataset contains:
• 720p 30 fps videos• High quality original video sequences• A large number of impaired video sequences• A wide range of quality• Examples of most common mobile video impairmentsCombined, these characteristics were not available from pre-
existing video databases. This section provides an overview ofthe LIVE Mobile VQA database. For details, see [6]; and toobtain a copy, see [1].
B. Reference Videos and Distortion Simulation
The LIVE mobile VQA database reference video sequencesare 720p (1280 × 720) at 30fps and 15 sec duration. Thesevideos were filmed with the best acquisition quality option(42MB/s). The final scene pool contains 12 videos that depicta variety of content types. Two of these videos were used fortraining the human subjects, while the rest were used in theactual study.
For each scene, four encoding levels were chosen that showunmistakably different quality levels. The JM reference imple-mentation of H.264 scalable video codec (SVC) [13], [14] wasused with fixed Quantization Parameter (QP) encoding. TheQP parameter / scene content interaction produces a uniquebitrate. The four QP levels are R1 (highest QP), R2, R3 & R4(lowest QP). The goal was to ensure perceptual separation ofthe subjective scores (i.e., perceived quality of Ri < perceivedquality of Ri+1). This perceptual separation makes it possiblefor people (and algorithms alike) to produce consistent judg-ments of visual quality [11], [15]. Because the source videocontent is quite varied, the resulting bitrates vary between0.7 Mbps and 6 Mbps.
The LIVE Mobile VQA database consists of 10 referencevideos and 200 distorted videos. The distortions simulate mostcommon mobile video impairments as follows:
1) Compression: This subset contains coding-only impair-ments R1, R2, R3 and R4 for each sequence.
2) Rate Adaptation: This subset explores the quality impactof rate changes of different magnitudes (i.e., large or small).The video sequence began with an encoding rate of eitherR1, R2 or R3 then after 5 seconds switched to the highestrate (R4), then again after 5 seconds switched back downto the original rate. Three rate adaptations are illustratedin Fig. 2.
3) Temporal Dynamics: This subset was designed to eval-uate the effect of multiple rate switches, using five patterns:
PINSON et al.: TEMPORAL VQM ACCOUNTING FOR VFD DISTORTIONS 643
Fig. 3. Subjective study interface. (a) Video display and a temporal scorerating bar. (b) Overall score rating bar.
These patterns were designed to evaluate two types of switchpatterns: abrupt (pattern 1) and smooth (patterns 2 to 5). Eachnew rate was presented for between 3 and 5 seconds.
4) Wireless Packet Loss: The H.264 bitstream (e.g., R1,R2, R3, and R4) was impaired using a Rayleigh fading chan-nel, which was modeled by an IEEE 802.11 based wirelesschannel simulator. Bit errors due to attenuation, shadowing,fading and multiuser interference in wireless channels causespatiotemporal transient distortions which appear as glitchesin videos.
5) Frame-Freezes: This subset models two types of frame-freeze impairments:
• Frame-freezes that did not result in the loss of a videosegment, to simulate stored video delivery
• Frame-freezes that resulted in a loss of video segmentsand lacked temporal continuity, to simulate live videodelivery
Three frame-freeze patterns were designed, such that the totalduration of all freeze events was held constant:
• Eight 1 sec frame-freezes• Four 2 sec frame-freezes• Two 4 sec frame-freezes
This subset uses uncompressed video sequences.
C. Test Methodology
Subjects rated the videos using the single-stimulus contin-uous quality evaluation (SSCQE) method [19] with hiddenreference [11], [17], [20]. Subjects watched 200 test videoson a 4" touchscreen Motorola AtrixTM with a resolution of960×540 and 100 different test videos on a 10.1" touchscreenMotorola Xoom with a resolution of 1280 × 800. Becausethese platforms do not support uncompressed video playback,videos were lightly compressed (> 18Mbps MPEG-4). Theexperimenters were unable to detect any differences betweenthe visual quality of the uncompressed video files and qual-ity of the compressed video streams. The video files used byobjective models do not include this compression, nor do theyinclude the resolution due to the monitor or playback software.
Testing took place at the LIVE subjective testing lab, usingsoftware that was specially created for the Android platform todisplay videos. The subjects rated the videos as a function oftime during the playback, yielding continuous temporal qualityscores using an uncalibrated bar that spanned the bottom ofthe screen (see Fig 3(a)). Subjects also rated the overall qualityat the end of each video, using a similar bar (see Fig. 3(b)).
A total of 36 subjects attended the mobile study, and 17 sub-jects participated in the tablet study. Most of the subjects
were undergraduate students between 22 and 28 years old.Although no vision test was executed, a verbal confirmationof soundness of (corrected) vision was obtained from eachsubject. Each subject attended two separate sessions. Eachsession lasted less than 30 minutes, and consisted of the sub-ject viewing 55 videos in randomized order (5 reference and50 distorted videos). A short training set (6 videos) precededthe study.
Differential Mean Opinion Scores (DMOS) were calculatedas the difference between the score that the subject gave thereference video and the score for the distorted video. The over-all scores were used to evaluate the Image Quality Assessmentand Video Quality Assessment (IQA/VQA) models.
D. Evaluation of Subjective Opinion
This section summarizes trends indicated by the subjectivescores. This analysis uses the overall scores.
The design goal of the compression subset was achieved.Subjective opinion of each compression rate (Ri) was statisti-cally better than of the next lower rate (Ri−1) for all contents.For example, for the following scenes, the four DMOS valuesfrom R1 to R4 were:
• “bulldozer with fence” [3.24, 2.09, 1.04, 0.36]• “two swan dunking” [3.23, 2.55, 1.39, 0.31]Subjects preferred fewer freezes of long duration to more
frequent yet short duration freezes, perhaps because the latterlead to choppy playback. Subjects also preferred not to losecontent after a frame-freeze, however that preference was lesspronounced. For example, subjects preferred two 4 sec frame-freezes with loss of content over eight 1 sec frame freezeswith no loss of content.
A Student’s t-test on the DMOS results for the rate adap-tation and temporal dynamics subsets showed that the time-varying quality of a video had a definite and quantifiableimpact. When variations in quality occurred, the opinion scoreswere influenced by the magnitude, order, and duration of thosequality level changes.
The rate adaptation subset analysis indicated that it is prefer-able to switch from a low rate to a higher rate when thehigher rate segment lasts at least half as long as the lowerrate. This study only included rate increases that lasted at least5 seconds, so further study is needed. Nonetheless, this con-clusion parallels a speech quality subjective test that analyzedtime varying quality in talk-spurts [22]. A change in the lowestrate has a clear impact on visual quality.
The temporal dynamics subset analysis indicated that it ispreferable to switch to an intermediate rate before switch-ing to a higher or lower rate (patterns 2 to 5). An abruptchange of bitrate received a statistically significantly lowerscore (pattern 1).
A comparison between the coding subset and the temporaldynamics subset showed a preference for constant bitrates. Forexample, R3 is favored over R2 − R4 − R2. This preferenceis not explained by a weighted sum of the compression-only DMOS scores for rates R2 and R4. This behavior couldindicate a quality penalty for changing video bitrates, asVoran and Catellier [22] demonstrated can occur when theaudio coding bitrate of a talk-spurt is increased.
644 IEEE TRANSACTIONS ON BROADCASTING, VOL. 60, NO. 4, DECEMBER 2014
An analysis of the temporal dynamics subset showedthat multiple bitrate switches were preferred over fewerswitches. For example, bitrate switches every 3 sec with thepattern R1 – R4 – R1 – R4 – R1 was preferred over bitrateswitches every 5 sec with the pattern R1 – R4 – R1; andthis preference could not be explained by the 1 sec differ-ence in the duration of the R4 level. We interpret this tomean that humans perceive multiple changes in quality level asattempts to provide better quality and appear to reward thoseendeavors.
The overall quality scores were impacted by the quality atthe end of the clip. This supports the forgiveness effect theoryproposed by Hands [23].
Regarding the comparison of subjective opinions betweenthe mobile and the tablet study, subjects seemed to be moresensitive to dynamically varying distortions displayed on thetablet device. The higher resolution or larger screen size ofthe display probably caused those distortions to be moreperceptible.
E. Evaluation of Algorithm Performance
The overall performance of various leading FR IQA/VQAalgorithms on the LIVE Mobile VQA database indicates thatnone of the contemporary FR IQA/VQA algorithms are able topredict video quality accurately for the time varying dynamicdistortions.
A useful lesson from the correlation coefficient analy-sis of algorithms is that true multiscale processing (as inVQM_VFD) is recommended to achieve scalability againstvariations in video resolutions, display sizes, and viewing dis-tance. Another valuable reflection is that the variable framedelay approach is beneficial for the prediction of videoquality.
F. Comments on LIVE Mobile VQA Database
The new LIVE Mobile VQA database opens fertile groundfor researchers to test and develop perceptually improved VQAalgorithms as well as providing analysis of human behavior tosupport successful video streaming strategies.
Due to limitations of the study session durations, the datasetcould not include several other interesting scenarios, such asmultiple rate changes between different quality levels, a largenumber of rate changes, a single change with a high qualitysegment at the end (e.g., R4 − R1 − R4) and so on.
Longer video sequences (e.g., five to thirty minutes) withrate switch simulations to analyze time varying quality wouldalso be beneficial for better understanding human perceptionof visual quality. We looked at short term effects in this currentstudy. Future work will step towards longer studies includingmore possible scenarios.
IV. MODEL PERFORMANCE ANALYSIS
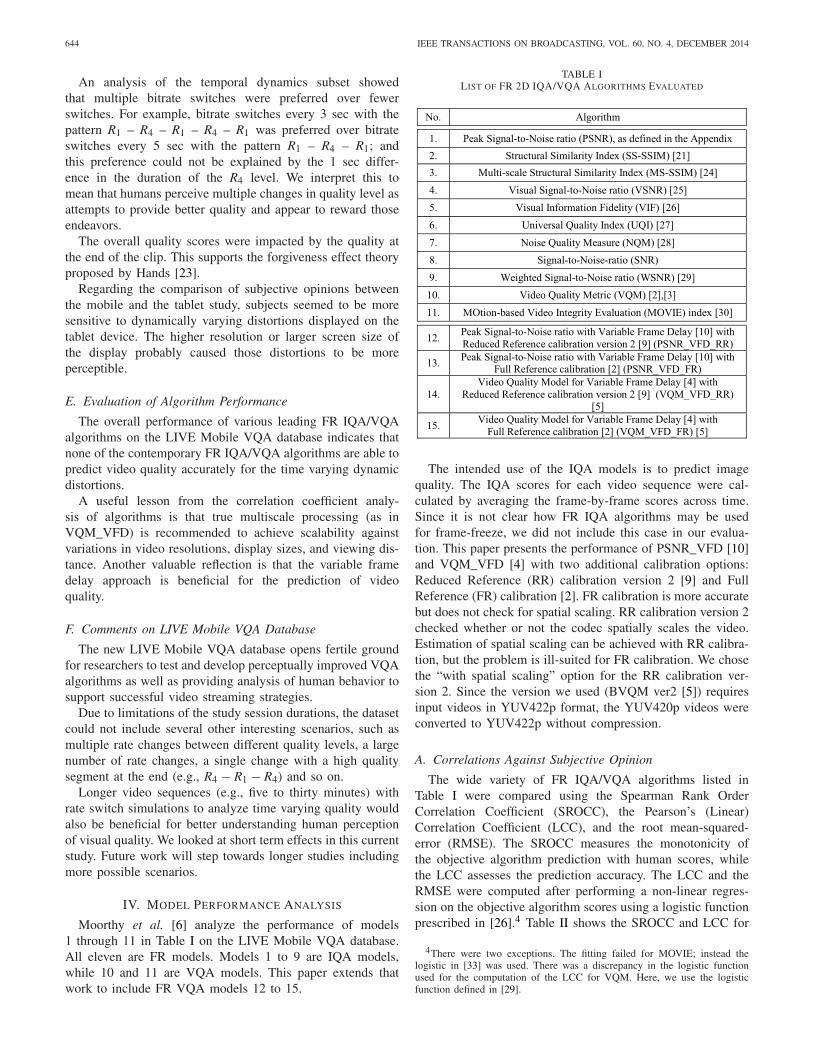
Moorthy et al. [6] analyze the performance of models1 through 11 in Table I on the LIVE Mobile VQA database.All eleven are FR models. Models 1 to 9 are IQA models,while 10 and 11 are VQA models. This paper extends thatwork to include FR VQA models 12 to 15.
TABLE ILIST OF FR 2D IQA/VQA ALGORITHMS EVALUATED
The intended use of the IQA models is to predict imagequality. The IQA scores for each video sequence were cal-culated by averaging the frame-by-frame scores across time.Since it is not clear how FR IQA algorithms may be usedfor frame-freeze, we did not include this case in our evalua-tion. This paper presents the performance of PSNR_VFD [10]and VQM_VFD [4] with two additional calibration options:Reduced Reference (RR) calibration version 2 [9] and FullReference (FR) calibration [2]. FR calibration is more accuratebut does not check for spatial scaling. RR calibration version 2checked whether or not the codec spatially scales the video.Estimation of spatial scaling can be achieved with RR calibra-tion, but the problem is ill-suited for FR calibration. We chosethe “with spatial scaling” option for the RR calibration ver-sion 2. Since the version we used (BVQM ver2 [5]) requiresinput videos in YUV422p format, the YUV420p videos wereconverted to YUV422p without compression.
A. Correlations Against Subjective Opinion
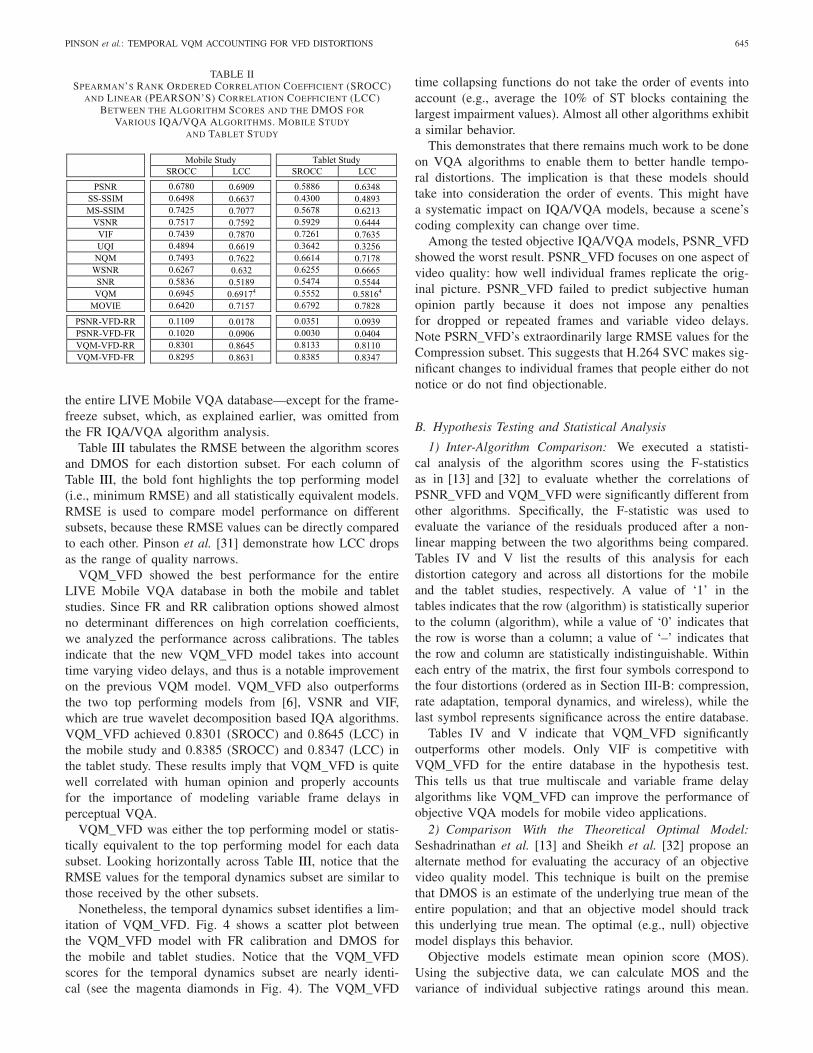
The wide variety of FR IQA/VQA algorithms listed inTable I were compared using the Spearman Rank OrderCorrelation Coefficient (SROCC), the Pearson’s (Linear)Correlation Coefficient (LCC), and the root mean-squared-error (RMSE). The SROCC measures the monotonicity ofthe objective algorithm prediction with human scores, whilethe LCC assesses the prediction accuracy. The LCC and theRMSE were computed after performing a non-linear regres-sion on the objective algorithm scores using a logistic functionprescribed in [26].4 Table II shows the SROCC and LCC for
4There were two exceptions. The fitting failed for MOVIE; instead thelogistic in [33] was used. There was a discrepancy in the logistic functionused for the computation of the LCC for VQM. Here, we use the logisticfunction defined in [29].
PINSON et al.: TEMPORAL VQM ACCOUNTING FOR VFD DISTORTIONS 645
AND LINEAR (PEARSON’S) CORRELATION COEFFICIENT (LCC)BETWEEN THE ALGORITHM SCORES AND THE DMOS FOR
VARIOUS IQA/VQA ALGORITHMS. MOBILE STUDY
AND TABLET STUDY
the entire LIVE Mobile VQA database—except for the frame-freeze subset, which, as explained earlier, was omitted fromthe FR IQA/VQA algorithm analysis.
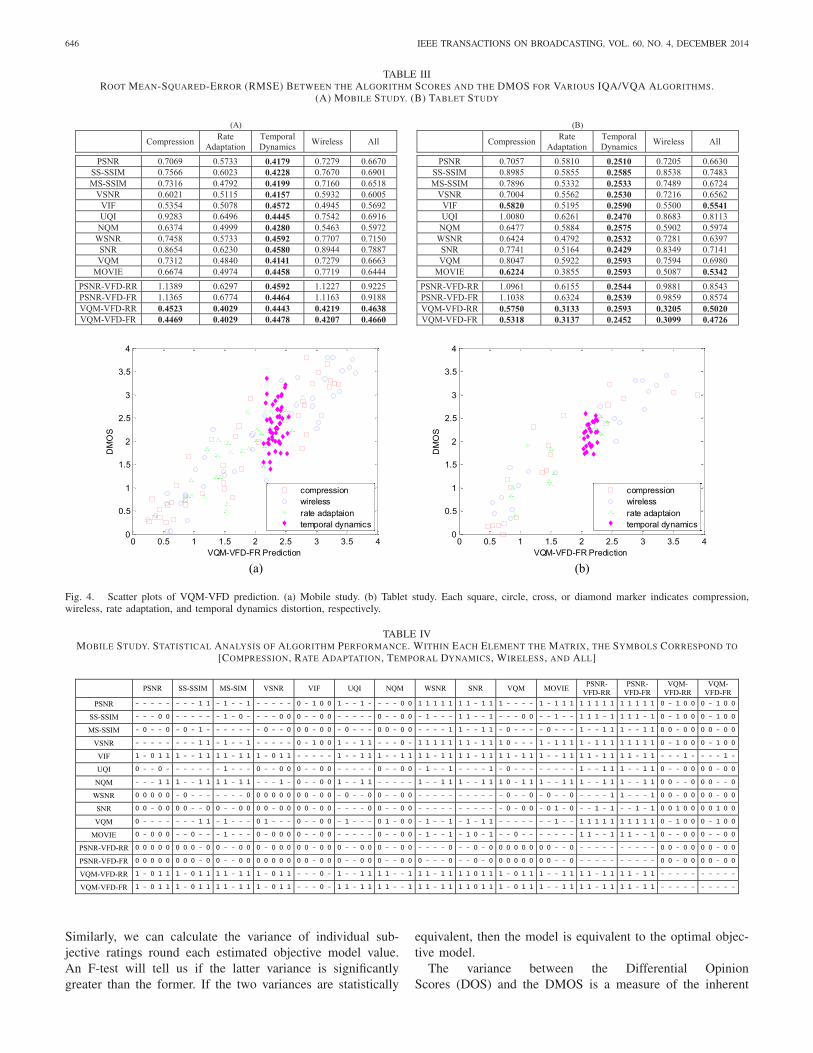
Table III tabulates the RMSE between the algorithm scoresand DMOS for each distortion subset. For each column ofTable III, the bold font highlights the top performing model(i.e., minimum RMSE) and all statistically equivalent models.RMSE is used to compare model performance on differentsubsets, because these RMSE values can be directly comparedto each other. Pinson et al. [31] demonstrate how LCC dropsas the range of quality narrows.
VQM_VFD showed the best performance for the entireLIVE Mobile VQA database in both the mobile and tabletstudies. Since FR and RR calibration options showed almostno determinant differences on high correlation coefficients,we analyzed the performance across calibrations. The tablesindicate that the new VQM_VFD model takes into accounttime varying video delays, and thus is a notable improvementon the previous VQM model. VQM_VFD also outperformsthe two top performing models from [6], VSNR and VIF,which are true wavelet decomposition based IQA algorithms.VQM_VFD achieved 0.8301 (SROCC) and 0.8645 (LCC) inthe mobile study and 0.8385 (SROCC) and 0.8347 (LCC) inthe tablet study. These results imply that VQM_VFD is quitewell correlated with human opinion and properly accountsfor the importance of modeling variable frame delays inperceptual VQA.
VQM_VFD was either the top performing model or statis-tically equivalent to the top performing model for each datasubset. Looking horizontally across Table III, notice that theRMSE values for the temporal dynamics subset are similar tothose received by the other subsets.
Nonetheless, the temporal dynamics subset identifies a lim-itation of VQM_VFD. Fig. 4 shows a scatter plot betweenthe VQM_VFD model with FR calibration and DMOS forthe mobile and tablet studies. Notice that the VQM_VFDscores for the temporal dynamics subset are nearly identi-cal (see the magenta diamonds in Fig. 4). The VQM_VFD
time collapsing functions do not take the order of events intoaccount (e.g., average the 10% of ST blocks containing thelargest impairment values). Almost all other algorithms exhibita similar behavior.
This demonstrates that there remains much work to be doneon VQA algorithms to enable them to better handle tempo-ral distortions. The implication is that these models shouldtake into consideration the order of events. This might havea systematic impact on IQA/VQA models, because a scene’scoding complexity can change over time.
Among the tested objective IQA/VQA models, PSNR_VFDshowed the worst result. PSNR_VFD focuses on one aspect ofvideo quality: how well individual frames replicate the orig-inal picture. PSNR_VFD failed to predict subjective humanopinion partly because it does not impose any penaltiesfor dropped or repeated frames and variable video delays.Note PSRN_VFD’s extraordinarily large RMSE values for theCompression subset. This suggests that H.264 SVC makes sig-nificant changes to individual frames that people either do notnotice or do not find objectionable.
B. Hypothesis Testing and Statistical Analysis
1) Inter-Algorithm Comparison: We executed a statisti-cal analysis of the algorithm scores using the F-statisticsas in [13] and [32] to evaluate whether the correlations ofPSNR_VFD and VQM_VFD were significantly different fromother algorithms. Specifically, the F-statistic was used toevaluate the variance of the residuals produced after a non-linear mapping between the two algorithms being compared.Tables IV and V list the results of this analysis for eachdistortion category and across all distortions for the mobileand the tablet studies, respectively. A value of ‘1’ in thetables indicates that the row (algorithm) is statistically superiorto the column (algorithm), while a value of ‘0’ indicates thatthe row is worse than a column; a value of ‘–’ indicates thatthe row and column are statistically indistinguishable. Withineach entry of the matrix, the first four symbols correspond tothe four distortions (ordered as in Section III-B: compression,rate adaptation, temporal dynamics, and wireless), while thelast symbol represents significance across the entire database.
Tables IV and V indicate that VQM_VFD significantlyoutperforms other models. Only VIF is competitive withVQM_VFD for the entire database in the hypothesis test.This tells us that true multiscale and variable frame delayalgorithms like VQM_VFD can improve the performance ofobjective VQA models for mobile video applications.
2) Comparison With the Theoretical Optimal Model:Seshadrinathan et al. [13] and Sheikh et al. [32] propose analternate method for evaluating the accuracy of an objectivevideo quality model. This technique is built on the premisethat DMOS is an estimate of the underlying true mean of theentire population; and that an objective model should trackthis underlying true mean. The optimal (e.g., null) objectivemodel displays this behavior.
Objective models estimate mean opinion score (MOS).Using the subjective data, we can calculate MOS and thevariance of individual subjective ratings around this mean.
646 IEEE TRANSACTIONS ON BROADCASTING, VOL. 60, NO. 4, DECEMBER 2014
TABLE IIIROOT MEAN-SQUARED-ERROR (RMSE) BETWEEN THE ALGORITHM SCORES AND THE DMOS FOR VARIOUS IQA/VQA ALGORITHMS.
(A) MOBILE STUDY. (B) TABLET STUDY
(a) (b)
Fig. 4. Scatter plots of VQM-VFD prediction. (a) Mobile study. (b) Tablet study. Each square, circle, cross, or diamond marker indicates compression,wireless, rate adaptation, and temporal dynamics distortion, respectively.
TABLE IVMOBILE STUDY. STATISTICAL ANALYSIS OF ALGORITHM PERFORMANCE. WITHIN EACH ELEMENT THE MATRIX, THE SYMBOLS CORRESPOND TO
[COMPRESSION, RATE ADAPTATION, TEMPORAL DYNAMICS, WIRELESS, AND ALL]
Similarly, we can calculate the variance of individual sub-jective ratings round each estimated objective model value.An F-test will tell us if the latter variance is significantlygreater than the former. If the two variances are statistically
equivalent, then the model is equivalent to the optimal objec-tive model.
The variance between the Differential OpinionScores (DOS) and the DMOS is a measure of the inherent
PINSON et al.: TEMPORAL VQM ACCOUNTING FOR VFD DISTORTIONS 647
TABLE VTABLET STUDY. STATISTICAL ANALYSIS OF ALGORITHM PERFORMANCE. WITHIN EACH ELEMENT THE MATRIX, THE SYMBOLS CORRESPOND TO
[COMPRESSION, RATE ADAPTATION, TEMPORAL DYNAMICS, WIRELESS, AND ALL]
TABLE VIALGORITHM PERFORMANCE VERSUS THE THEORETICAL OPTIMAL MODEL FOR (A) MOBILE STUDY AND (B) TABLET STUDY.
BOLD FONT INDICATES STATISTICAL EQUIVALENCE TO THE THEORETICAL OPTIMAL MODEL
variance of subjective opinion (σ 2null). This is compared
to the variance between the DOS and the algorithm scores(σ 2
algorithm). The ratio of the two variables, σ 2algorithm / σ 2
null
is evaluated with the F-statistic. A threshold F-ratio can bedetermined based on the degrees of freedom exhibited bythe numerator and denominator at the 95% confidence level.If the F-statistic is larger than the threshold, the algorithmperformance is statistically equivalent to the theoreticaloptimal model.
Table VI indicates that VQM_VFD is equivalent to the the-oretical optimal model, when compared to the compressionand the wireless subsets. However, none of the algorithmsare equivalent to the optimal model when the entire databaseis considered. Obviously, despite the significant progressof VQM_VFD, there remains considerable opportunity toimprove the performance of VQA algorithms with respect tosubjective human opinions.
V. CONCLUSION
We introduced a new video quality model (VQM_VFD)that is able to handle variable frame delays, and successfullycaptures multiple system delays of the processed video
frames with respect to the reference video frames to tracksubjective quality. The performance of the VQM_VFDwas evaluated on the recently-released LIVE Mobile VQAdatabase, which encompasses a wide variety of distortions,including dynamically-varying distortions as well as uniformcompression and wireless packet loss. This confirms thatvariable frame delays have a definite impact on humansubjective judgments of visual quality and that VQM_VFDsignificantly contributes to the progress of VQA algorithms.Based on non-optimized code, VQM_VFD takes five timesas long to compute as PSNR.
Although VQM_VFD performed better than existing top-performing IQA/VQA models tested on the LIVE MobileVQA database, there remains significant room for improve-ment. The temporal dynamics subset indicates that humansubjective opinion is influenced by the time ordering of qualityevents within short video clips. Understanding the reactions ofhumans to time varying behavior and temporal dynamics mayprove helpful in the design of future improved objective VQAalgorithms that are appropriate for mobile video applications.
VSNR and VIF were the best performing IQA models.These image quality models were applied to rate video quality
648 IEEE TRANSACTIONS ON BROADCASTING, VOL. 60, NO. 4, DECEMBER 2014
instead, by performing frame averages over time. The accuracyof these models implies that there is merit to the idea of anIQA model as the basis of a VQA model. The performance dif-ferential between VQM and VFD_VQM on the LIVE MobileVQA database indicates that such IQA based VQA modelscould benefit by integrating the VFD algorithm [10]. Such inte-gration would require separate training, which is beyond thescope of this paper. Note that the VFD algorithm and SIn longedge detection filter can be used for any purpose, commercialor non-commercial.
In this article, we only summarized the portion of theLIVE Mobile database relevant to evaluating PSNR_VFD andVQM_VFD using a performance analysis mirroring the onethat Moorthy et al. did in [6]. The reader is referred to [6] fora detailed description of the study including the evaluation oftemporal quality scores.
APPENDIX
Here, PSNR was calculated using the MeTriX MuX VisualQuality Assessment Package from Cornell University [34].PSNR is calculated as follows:
PSNR = 1
T
∑t
10 × log10
⎛⎝ 2552
1N
∑x∑
y
(Ox,y,t − Px,y,t
)2
⎞⎠
(18)
where• O is the luma plane of the original video• P is the luma plane of the processed video• x, y and t index the video horizontally, vertically and in
time• N is the number of pixels in each image• T is the number of frames
ACKNOWLEDGMENT
M. H. Pinson would like to thank S. Wolf for his develop-ment of the VQM_VFD model, and A. K. Moorthy for hiswork developing the LIVE mobile VQA database.
REFERENCES
[1] (2011, Nov. 5). LIVE Mobile Video Quality Database. [Online].Available: http://live.ece.utexas.edu/research/quality/live_mobile_video.html
[2] S. Wolf and M. Pinson, “Video quality measurement techniques,”U.S. Dept. Commer., Nat. Telecommun. Inf. Admin., Boulder, CO, USA,Tech. Rep. TR-02-392, Jun. 2002.
[3] M. H. Pinson and S. Wolf, “A new standardized method for objec-tively measuring video quality,” IEEE Trans. Broadcast., vol. 50, no. 3,pp. 312–322, Sep. 2004.
[4] S. Wolf and M. H. Pinson, “Video quality model for variable frame delay(VQM_VFD),” U.S. Dept. Commer., Nat. Telecommun. Inf. Admin.,Boulder, CO, USA, Tech. Memo TM-11-482, Sep. 2011.
[6] A. K. Moorthy, L. K. Choi, A. C. Bovik, and G. de Veciana, “Video qual-ity assessment on mobile devices: Subjective, behavioral and objectivestudies,” IEEE J. Sel. Topics Signal Process., vol. 6, no. 6, pp. 652–671,Oct. 2012.
[7] C. Wang and X. Jiang, “Video quality assessment for IPTV services: Asurvey,” in Proc. 7th Int. Conf. Comput. Convergence Technol. (ICCCT),Seoul, Korea, Dec. 2012, pp. 182–186.
[8] M. Pinson and S. Wolf, “An objective method for combining multi-ple subjective data sets,” SPIE Video Commun. Image Process. Conf.,vol. 5150, pp. 8–11, Jul. 2003.
[9] M. H. Pinson and S. Wolf, “Reduced reference video calibration algo-rithms,” U.S. Dept. Commer., Nat. Telecommun. Inf. Admin., Boulder,CO, USA, Tech. Rep. TR-08-433b, Nov. 2007.
[10] S. Wolf, “Variable frame delay (VFD) parameters for video qualitymeasurements,” U.S. Dept. Commer., Nat. Telecommun. Inf. Admin.,Boulder, CO, USA, Tech. Memo TM-11-475, Apr. 2011.
[11] M. Pinson and S. Wolf, “Fast low bandwidth model: A reduced refer-ence video quality metric,” U.S. Dept. Commer., Nat. Telecommun. Inf.Admin., Boulder, CO, USA, Tech. Memo TM-13-497, Jun. 2013.
[12] Z. Wang, A. C. Bovik, H. R. Sheikh, and E. P. Simoncelli, “Imagequality assessment: From error visibility to structural similarity,” IEEETrans. Image Process., vol. 13, no. 4, pp. 600–612, Apr. 2004.
[13] K. Seshadrinathan, R. Soundararajan, A. C. Bovik, and L. K. Cormack,“Study of subjective and objective quality assessment of video,” IEEETrans. Image Process., vol. 19, no. 6, pp. 1427–1441, Jun. 2010.
[14] A. K. Moorthy, C.-C. Su, A. Mittal, and A. C. Bovik, “Subjective eval-uation of stereoscopic image quality,” Signal Process. Image Commun.,vol. 28, no. 8, pp. 870–883, Sep. 2013.
[15] H. Schwarz, D. Marpe, and T. Wiegand, “Overview of the scalable videocoding extension of the H. 264/AVC standard,” IEEE Trans. CircuitsSyst. Video Technol., vol. 17, no. 9, pp. 1103–1120, Sep. 2007.
[17] A. K. Moorthy, K. Seshadrinathan, R. Soundararajan, and A. C. Bovik,“Wireless video quality assessment: A study of subjective scores andobjective algorithms,” IEEE Trans. Circuits Syst. Video Technol., vol. 20,no. 4, pp. 513–516, Apr. 2010.
[18] B. Wandell, Foundations of Vision. Sunderland, MA, USA: SinauerAssociates, 1995.
[19] Methodology for the Subjective Assessment of the Quality of TelevisionPictures, ITU-R Rec. BT.500-11, Jun. 2012.
[20] M. H. Pinson and S. Wolf, “Comparing subjective video quality testingmethodologies,” SPIE Video Commun. Image Process. Conf., vol. 5150,pp. 573–582, Jul. 2003.
[21] Z. Wang, A. C. Bovik, H. R. Sheikh, and E. P. Simoncelli, “Imagequality assessment: From error measurement to structural similarity,”IEEE Signal Process. Lett., vol. 13, no. 4, pp. 600–612, Apr. 2004.
[22] S. D. Voran and A. A. Catellier, “When should a speech coding qual-ity increase be allowed within a talk-spurt?” in Proc. IEEE Int. Conf.Acoust. Speech Signal Process. (ICASSP), Vancouver, BC, Canada,May 2013, pp. 8149–8153.
[23] D. S. Hands, “Temporal characteristics of forgiveness effect,” Electron.Lett., vol. 37, no. 12, pp. 752–754, Jun. 2001.
[24] Z. Wang, L. Lu, and A. Bovik, “Foveation scalable video coding withautomatic fixation selection,” IEEE Trans. Image Process., vol. 12, no. 2,pp. 243–254, Feb. 2003.
[25] D. M. Chandler and S. S. Hemami, “VSNR: A wavelet-based visualsignal-to-noise ratio for natural images,” IEEE Trans. Image Process.,vol. 16, no. 9, pp. 2284–2298, Sep. 2007.
[26] H. R. Sheikh and A. C. Bovik, “Image information and visualquality,” IEEE Trans. Image Process., vol. 15, no. 2, pp. 430–444,Feb. 2006.
[27] Z. Wang and A. C. Bovik, “A universal image quality index,” IEEESignal Process. Lett., vol. 9, no. 3, pp. 81–84, Mar. 2002.
[28] N. Damera-Venkata, T. D. Kite, W. S. Geisler, B. L. Evans, andA. C. Bovik, “Image quality assessment based on a degradationmodel,” IEEE Trans. Image Process., vol. 9, no. 4, pp. 636–650,Sep. 2002.
[29] J. Mannos and D. Sakrison, “The effects of a visual fidelity criterionof the encoding of images,” IEEE Trans. Inf. Theory, vol. 20, no. 4,pp. 525–536, Jul. 1974.
[30] K. Seshadrinathan and A. C. Bovik, “Motion tuned spatio-temporal qual-ity assessment of natural videos,” IEEE Trans. Image Process., vol. 19,no. 2, pp. 335–350, Feb. 2010.
[31] M. Pinson et al., “The influence of subjects and environment on audiovi-sual subjective tests: An international study,” IEEE J. Sel. Topics SignalProcess., vol. 6, no. 6, pp. 640–651, Oct. 2012.
[32] H. R. Sheikh, M. F. Sabir, and A. C. Bovik, “A statistical evaluation ofrecent full reference image quality assessment algorithms,” IEEE Trans.Image Process., vol. 15, no. 11, pp. 3440–3451, Nov. 2006.
PINSON et al.: TEMPORAL VQM ACCOUNTING FOR VFD DISTORTIONS 649
[33] Video Quality Experts Group (VQEG). (2000). Final Report From theVideo Quality Experts Group on the Validation of Objective QualityMetrics for Video Quality Assessment Phase I. [Online]. Available:http://www.its.bldrdoc.gov/vqeg/projects/frtv_phaseI
Margaret H. Pinson ([email protected])received the B.S. and M.S. degrees in com-puter science from the University of Colorado atBoulder, Boulder, CO, USA, in 1988 and 1990,respectively. Since 1988, she has been investigat-ing improved methods for assessing video qualitywith the Institute for Telecommunication Sciences,an office of the National Telecommunications andInformation Administration, Boulder, CO, USA. Sheis a Co-Chair with the Video Quality ExpertsGroup (VQEG), the VQEG Independent Laboratory
Group, and an Associate Rapporteur of Questions 2 and 12 withInternational Telecommunication Union Telecommunication StandardizationSector (ITU-T) Study Group 9. Her contributions and leadership within StudyGroup 9 played a key role in the approval of ITU-T Rec. P.913 (2014).She encourages video quality research and development by administeringthe Consumer Digital Video Library (CDVL, www.cdvl.org) and by mak-ing broadcast video sequences available on the CDVL. She was the recipientof the Best Paper Award at the 2014 Workshop on Quality of MultimediaExperience for a proposed model of rating behavior based on subject biasand subject error.
Lark Kwon Choi received the B.S. degree in electri-cal engineering from Korea University, Seoul, Korea,and the M.S. degree in electrical engineering andcomputer science from Seoul National University,Seoul, Korea, in 2002 and 2004, respectively. He iscurrently pursuing the Ph.D. degree as a memberof the Laboratory for Image and Video Engineeringand the Wireless Networking and CommunicationsGroup from the University of Texas at Austin,Austin, TX, USA, under Dr. Alan C. Bovik’ssupervision. From 2004 to 2009, he worked at KT
Corporation (formerly Korea Telecom), Seoul, Korea, as a Senior Engineeron Internet Protocol television (IPTV) platform research and development.He contributed to IPTV standardization in International TelecommunicationUnion Telecommunication Standardization Sector, Internet Engineering TaskForce, and Telecommunications Technology Association. His research inter-ests include image and video quality assessment, spatial and temporal visualmasking, motion perception, and perceptual image and video enhancement.
Alan Conrad Bovik (F’96) received the B.S. degreein computer engineering, and the M.S. and Ph.D.degrees in electrical and computer engineering in1980, 1982, and 1984, respectively, all from theUniversity of Illinois at Urbana-Champaign, Urbana,IL, USA. He is the Cockrell Family Endowed Chairin Engineering at the University of Texas at Austin,where he is the Director of the Laboratory forImage and Video Engineering. He is a Professorof Electrical and Computer Engineering and ofthe Institute for Neuroscience. His research inter-
ests include image and video processing, computational vision, and visualperception. He is the recipient of a number of major awards from theIEEE Signal Processing Society, including the Society Award, the TechnicalAchievement Award, the Best Paper Award, the Signal Processing MagazineBest Paper Award, the Education Award, and the Meritorious Service Award(1998) and has co-authored a Young Author Best Paper Award. He was alsothe recipient of the Honorary Member Award of the Society for ImagingScience and Technology for 2013, the SPIE Technology Achievement Awardfor 2012, and the IS&T/SPIE Imaging Scientist of the Year for 2011. He is aFellow of the Optical Society of America and the Society of Photo-Optical andInstrumentation Engineers. He has served as a Governing Board Member ofthe IEEE Signal Processing Society, from 1996 to 1998, was Co-Founder andan Editor-in-Chief of the IEEE TRANSACTIONS ON IMAGE PROCESSING,from 1996 to 2002, an Editorial Board Member of the Proceedings of theIEEE, from 1998 to 2004, and the Founding General Chairman of the FirstIEEE International Conference on Image Processing, held in Austin, TX,USA, in 1994.