Haishen Liang, and Chengshan Wang, Senior Member, IEEE
Abstract—This paper proposes a method for coordinated sizing ofenergy storage (ES) and diesel generators in an isolated microgridbased on discrete Fourier transform (DFT). ES and diesel generatorshave different response characteristics and can complementarilycompensate the generation-demand imbalance at different timescales. The DFT-based coordinated dispatch strategy allocates bal-ance power between the two components through frequency-timedomain transform. The proposed method ensures that ES and dieselgenerators work in their respective and most efficient, fit way. Dieselgenerators consecutively work at a high-level generation while EScompensates small and frequent power fluctuations. Then, the ca-pacities of ES and diesel generators are determined based on thecoordinated dispatch strategy.Theproposedmethod canalso beusedin the planning of ES with other dispatchable sources such as micro-turbine or fuel-cell. Finally, the effectiveness of the proposed methodand its advantages are demonstrated via a practical case study.
Index Terms—Coordinated dispatch, diesel generators, discreteFourier transform (DFT), energy storage (ES), isolated microgrid,size scheduling.
I. INTRODUCTION
I N REMOTE areas or on islands, an isolated microgrid is agood choice for supplying electrical energy to residents
[1], [2]. The integration of renewable energy reduces a largeamount of fuel consumption required by diesel generators.However, the intermittent and random nature of renewableenergy can have a negative impact on the grid and cause greatpower fluctuations of net load (load-renewable energy). Theintroduction of energy storage (ES) can solve this problem [3],[4] by tracking fast power variations and working coordinatelywith diesel generators in order to supply the balance power.
In an isolated microgrid with installed renewable energyresources, wind turbines (WTs) and photovoltaics (PVs) shouldoperate at their maximum power point and produce as muchpower as possible in order to optimize the economic and envi-ronmental benefits. Themain objective of a stand-alone system isthe guarantee of power reliability for consumers [5]. The cost ofES is still very high at present. ES can absorb energy from thegrid and release it at a later time by working in conjunction withdiesel generators, aiming to reduce the fuel consumption andimproving the entire economy of the system [6]. In this situation,it is necessary to address the problem of coordinated powerallocation and the sizing of ES and diesel generators in anisolated microgrid.
Considerable research has been done in the area of design,simulation, and the planning of stand-alone hybrid powersystems. A variety of heuristic optimization methods (e.g.,genetic algorithm (GA) [7], [8] and particle swarm algorithm[9], [10]) have been applied to solve the problem of sizing eachcomponent in an isolated microgrid. The software HOMER [11]optimizes the capacities of components in microgrids usingenumeration and the comparison method. Existing methodsconsider hour-level wind/solar statistic data in microgrid plan-ning, but they cannot reflect the random nature of renewableenergy. The determined capacities may be over- or under-sizedfor system requirements at short time scales. Most of themonly considered some simple coordinated control strategiesof ES and diesel generators in their planning. They did nottake into account the response characteristics of ES and dieselgenerators, which can lead to an inefficient operation ofdiesel generators and a lower economic capacity ratio of ESand diesel generators.
Diesel generators and ES have different response rates and cancompensate for power variations complementarily [12]. Theefficiency of diesel generators decreases when operating at alow generation level [13]. The balance power can be divided intotwo parts: 1) long time scale smooth power; and 2) short timescale frequent power fluctuations. In this way, diesel generatorscan operate at a relatively high mean generation level, and EScompensates the frequent power fluctuations.
This kind of power allocation can be realized by frequencydistribution techniques. Wavelet transform and low-pass filter-ing were applied in wind power prediction [14], [15] and powersmoothing [16], [17], but they were not used to allocate powerbetween ES and diesel generators and meet the net load in an
Manuscript received September 23, 2013; revised January 14, 2014 andFebruary 23, 2014; accepted March 02, 2014. Date of publication April 11,2014; date of current version June 17, 2014. This workwas supported in part bythe National High Technology Research and Development Program (863Program) (2011AA05A117), in part by the Program of Technology andProject Demonstration of Distributed Wind Power Integration (China StateGrid Program), and in part by U.S. National Science Foundation (NSF) GrantECCS-1001999. This work made use of the shared facility of CURENT, aU.S. NSF Engineering Research Center under U.S. NSF Award EEC-1041877.
J. Xiao, H. Liang, and C. Wang are with the Key Laboratory of Smart Grid ofMinistry of Education, Tianjin University, Tianjin 300072, China (e-mail:[email protected]; [email protected]; [email protected]).
L. Bai and F. Li are with the Department of Electrical Engineering andComputer Science, The University of Tennessee, Knoxville, TN 37996 USA(e-mail: [email protected]; [email protected]).
Color versions of one ormore of the figures in this paper are available online athttp://ieeexplore.ieee.org.
Digital Object Identifier 10.1109/TSTE.2014.2312328
IEEE TRANSACTIONS ON SUSTAINABLE ENERGY, VOL. 5, NO. 3, JULY 2014 907
isolated microgrid. Besides, there is time latency in the filteringprocess [17], which may lead to a higher capacity of ES. Thewavelet transform method is highly affected by the chosen basisfunction [16]. It requires a significant amount of computationand has the edge effect in signal processing. On the other hand,the discrete Fourier transform (DFT) can be regarded as anaccurate band-pass filter [18], which can distribute frequencyefficiently.
Therefore, in this paper, we propose a DFT-based method in amulti-time scale perspective to allocate balance power betweenES and diesel generators, and then determine their capacities.This differs from previous approaches that typically work for aspecific scenario of either abundant or inadequate renewableenergy generation. The proposedDFT-based approachworks forboth of these scenarios. During the coordinated sizing process,the optimal cut-off frequency is determined for the least total costdesign, while meeting the technical requirements of the system.The proposed method can effectively size ES and diesel gen-erators to balance the capital cost and fuel cost to achieve themost economic scheme.
The paper is organized as follows. Section II introduces thecoordinated dispatch strategy of allocating the balance powerbetween ES and diesel generators using DFT. Section III de-scribes the method for determining the capacities of ES anddiesel generators based on the their respective assigned power.Section IV illustrates the technical and economic evaluationmodel for the planning schemes. Section V describes the princi-ple of selecting the optimal cut-off frequency. In Section VI, acase study is presented to show the feasibility and advantages ofthe proposed method. Section VII concludes the paper.
II. COORDINATED POWER DISPATCH BETWEEN
ES AND DIESEL GENERATORS BASED ON DFT
A typical dc structure of a wind/solar/diesel/storage isolatedmicrogrid [19] is shown in Fig. 1, which has been deployed inmany tests or demo systems around the world. The systemcontains WTs, PV panels, diesel generators, a battery energystorage system (BESS), and ac loads. All the components areconnected to a central dc bus through ac/dc or dc/dc converters.WTs and PV panels work at their maximum power points. Theproposed DFT-based coordinated dispatch strategy focuses onallocating power between ES and diesel generators for theacquisition of their respectively assigned power.
DFT is adopted to analyze the spectrum of balance power inthe frequency domain. According to the spectrum results, thecompensation frequency bands of ES and diesel generators areallocated, then the frequency-domain results are transformed totime-domain signals using the inverse discrete Fourier transform(IDFT). Thus, the assigned power of ES and diesel generators isacquired. The detailed process is shown in Fig. 2.
A. Power Balance
Output power cannot usuallymeet the requirements of the loadby the renewable energy itself due to its intermittence. Sincerenewables have a very low production cost to produce energy, it
is essentially considered negative loads in this paper. Thus, themain task in this paper is to identify an efficient size for ESand diesel generators to work together to supply the balancepower (i.e., meet the net load)
PRES þ PB ¼ PL (1)
PB ¼ PES þ PD (2)
wherePRES is the output power of renewable energy sources,PB
is the balance power, PES is the power of ES, PD is the output ofdiesel generators, and PL is the system load.
Fig. 1. Typical dc structure of a wind/solar/diesel/storage isolated microgrid.
Fig. 2. Process of the DFT-based coordinated dispatch strategy.
908 IEEE TRANSACTIONS ON SUSTAINABLE ENERGY, VOL. 5, NO. 3, JULY 2014
B. Allocate Balance Power in Frequency DomainUsing DFT
As an example, some of the data sampled from an isolatedmicrogrid is shown in Fig. 3. Thewind power is sampled at 1-mintime interval. The load curve is generated for 1-min intervalbased on 1-h interval data. The balance power is acquired using(1) and (2).
The balance power shown in Fig. 3 primarily contains twotypes of power fluctuations: 1) smooth power fluctuation corre-sponding to a low frequency; and 2) fast and frequent powerfluctuations corresponding to a high frequency. Using DFT todecompose the signals, the spectrum analysis results can beacquired, and the frequency distributions can be determined.
The DFT analysis equations are shown in (3) where DFT()is defined as a function for conducing DFT on a series ofsignals
XðkÞ ¼ DFTðxðnÞÞ ¼XN�1
n¼0
xðnÞWnkN
AðkÞ ¼ XðkÞj j
fðkÞ ¼XN�1
n¼0
k � f=N
k ¼ 0; 1; 2; . . . ; N � 1 (3)
whereWN ¼ ej2�N ,N is the number of the sampled data, AðkÞ is
the amplitude, and fðkÞ is the frequency.Decomposing the balance power using DFT, we have
f g ¼ ½fg ½1�; . . . ; fg ½n�; . . . ; fg ½Ns��T (4)
where Ns is the number of sample points; DFTðPgÞ meansdecomposing the balance power signals using DFT; Sg½n� ¼Rg½n� þ Ig½n�i is the amplitude value at the frequency fg½n�; andRg½n�, Ig½n� denotes the real part and the imaginary part ofaltitude, respectively
fg½n� ¼ fs½n� 1�=Ns ¼ ðn� 1Þ=ðTs� NsÞ (5)
where fs is the sampling frequency and Ts is the samplinginterval.
According to theNyquist principle, the spectrum is distributedsymmetrically around the frequency fN ¼ fs=2. So the spectrumof 0 � fN is representative of the whole sampled data
Fig. 4 shows the spectrum analysis results of the balancepower.
Fig. 3. Balance power in an isolated microgrid.
Fig. 4. Spectrum analysis results of balance power. (a) Frequency spectrumcurve. (b) Frequency spectrum dot density map.
XIAO et al.: SIZING OF ES AND DIESEL GENERATORS IN AN ISOLATED MICROGRID USING DFT 909
When the sampling interval is 1min, the spectrum ranges from0 to 0.008333 Hz [¼ 1=ð2� 60 sÞ]. The balance power issuperposed by the set of power signals with different frequenciesand amplitudes. The spectrum of the balance power mainlyconcentrates on the low frequency band. As shown in Fig. 4,the low frequency portion contains a dc component that corre-sponds to smooth and high amplitude signals. Diesel generatorshave a relatively low response speed, thus the low frequencyband is suitable for efficient diesel generator operation at arelatively high and steady generation level. The response rateof ES, such as the battery and flywheel, is very fast and is wellsuitable for the compensation of the high frequency components.The power amplitudes of high frequency components are usuallylow andwill not lead to a high ES capacity. The output of a dieselgenerator is generally a function of its ramp rate, which variesnonlinearly with its size and generation level; therefore, it couldtrack power variations, ranging from minutes to several hours.
As shown in Fig. 4, the cut-off frequency (fc) is used to dividethewhole spectrum into two parts: 1) the low-frequency part; and2) the high-frequency part. The selection of the cut-off frequencyis important for allocating power between ES and diesel gen-erators. The principle used to judiciously choose the cut-offfrequency will be described in Section V.
C. Acquire Assigned Power for ES and Diesel GeneratorsUsing IDFT
The spectrum has been allocated between ES and dieselgenerators in the frequency domain. Using IDFT, the spectrumresults can be transformed to time-domain assigned power for ESand diesel generators, respectively
SD½n� ¼ 0þ 0i; fn =2 f cSg½n�; fn 2 f c
�(9)
where SD½n� is the spectrum result within f c correspondingto the assigned power of diesel generators. Sg ¼ DFTðPgÞ ¼½Sg ½1�; . . . ; Sg ½n�; . . . ; Sg ½Ns��T is the spectrum result of thebalance power throughDFT, and f c indicates the frequency bandfor diesel generators, f c ¼ ½0; fc�.
With IDFT on S0, the spectrum results within f c are trans-formed into the time-domain assigned powers for diesel gen-erators. This is given as follows:
where IDFTðSDÞ means using IDFT to transform spectrumresults to time-domain data, and PD is the set of assigned powerfor diesel generators.
D. Adjust Assigned Power of ES and Diesel Generators
The assigned power for ES is easy to obtain (i.e., the balancepower minus the assigned power for diesel generators). However,it is possible that IDFT produces negative values in the assignedpower of generators. It is unreasonable for generators to absorbpower from the grid. Thus, additional power adjustmentsshould be done in order to modify the assigned power of ES
and diesel generators. That is, the negative assigned power ofdiesel generators is shifted to ES, which have the ability toabsorb power
PD½i� ¼ PD½i�; if PD½i� � 0
PD½i� ¼ 0; if PD½i� < 0
PES½i� ¼ Pg½i� � PD½i�; i 2 ½0; NS�: (11)
III. SIZING OF ES AND DIESEL GENERATORS
This section discusses the sizing of ES and diesel generators.Their capacities are planned with the DFT-based dispatch strat-egy presented above.
A. Sizing of Diesel Generators
For an isolated system, the capacity of diesel generators shouldbe able to meet the maximum assigned power. Usually, theremust be some reserve capacity for the generators to deal with theuncertainties or prediction errors of renewable energy. Since thedetermination of reserve capacity is not the focus of this work, asimple model is employed as follows:
CD ¼ maxfjPD½i�jg � ð1þ RÞ (12)
where CD is the capacity of the diesel generators and R is thecapacity reserve rate.
B. Sizing of ES
1) Sizing Energy Capacity: ES can not only discharge tosupply power but also absorb surplus power. The process ofcharging and discharging will produce losses. So, charge anddischarge efficiency should be considered in sizing the capacityof ES. Here, we assume that the charge efficiency is equal to thedischarge efficiency [20]. Thus
PES½n� ¼PES½n�=�ES;d; PES½n� � 0
PES½n� � �ES;c; PES½n� < 0
�(13)
�ES;c ¼ �ES;d ¼ ffiffiffiffiffiffiffi�ES
p(14)
where �ES;d is the discharge efficiency, �ES;c is the chargeefficiency, and �ES is the overall cycling efficiency of ES. Ifthe assigned power is a negative value, it means that the ES needsto be charged at that particular point in time. If the assignedpower is a positive value, then the ES needs to discharge tosupply power.
To avoid the physical damage of ES due to deep discharge andhigh charge/discharge currents, the state of charge (SOC) andcharge/discharge power should be limited to reasonable bounds.In each time step, ES should satisfy the operation constraints (15)and (16)
Power Limits:
0 PESðtÞ PES;dmax
� PES;cmax PESðtÞ 0 (15)
where PES;dmax is the maximum discharge power andPES;c
max isthe maximum charge power.
910 IEEE TRANSACTIONS ON SUSTAINABLE ENERGY, VOL. 5, NO. 3, JULY 2014
SOC Limits:
SOClow SOC SOCup (16)
where SOCup is the upper limit of SOC and SOClow is the lowerlimit of SOC.
According to the assigned power of ES, the accumulativeenergy relative to the original energy status of ES can becalculated as follows:
Eacu½m� ¼Xm0
ðPES½m� � Ts=3600Þ; m ¼ 0; . . . ; Ns (17)
where Eacu ½m� is the energy change at the mth time point inkWh. This indicates the charging and discharging of energyrelative to the original status; and PES ½m� is the power of ES atthe mth time point in kW.
The energy capacity of ES should be able to meet the differ-ence between the maximum energy and the minimum energy.Considering the SOC limits, the energy capacity of ES can bedetermined as follows:
EES0 ¼ max Eacu½m�f g �min Eacu½m�f gSOCup � SOClow
(18)
where EES0 is the minimum energy capacity of ES andmaxfEacu½m�g �minfEacu½m�g represents the maximum en-ergy variation in the whole data set.
2) Sizing Power Capacity: The power capacity calculation forES is similar to that of the diesel generators. The power capacityof ES should be able to meet the maximum assigned power of ES
PES0 ¼ maxfjPES½n�jg (19)
where PES0 is the power capacity of ES.The power capacity of ES usually determines the converter’s
capacity.
IV. EVALUATION OF PROPOSED SIZING SCHEME
Cost analysis and technical evaluation are necessary to evalu-ate the planning schemes. In this section, some technical andeconomic indices are presented, based on the system simulation.
A. System Simulation
The assigned powers of ES and diesel generators are acquiredby (10) and (11). The general model of the battery charging anddischarging process can be modeled as follows:
Eðtþ 1Þ ¼ EðtÞ � Ts � PES=�ES;d; if PES > 0
Eðtþ 1Þ ¼ EðtÞ þ Ts � PES�ES;c; if PES < 0
SOCðtþ 1Þ ¼ Eðtþ 1Þ=EES0
t ¼ 0; . . . ; N (20)
where EðtÞ is the energy stored in the battery bank at samplepoint t, and SOCðtþ 1Þ is the state of charge of the battery afterdischarge or charge in each time step. During every simulation
step Ts, the energy left in ES, should always meet the require-ments of the grid. Itmust have enough capacity not only to absorbthe extra electrical energy from the grid, but also to supplyenough power and energy to support the grid.
It should be noted that different types of batteries havedifferent charge/discharge characteristics and different economiccosts, whichmay affect the sizing results. However, the proposedmethod is a general method to coordinately size the ES and dieselgenerators in an isolated microgrid. Thus, the above, genericmodel of battery can be easily replaced with actual, detailedbattery models based on actual applications where the proposedapproach can still be applied.
B. Technical Evaluation
In order to evaluate the technical effects, two indices, theoutage time and deviation, have been introduced to identifywhether the scheme can meet the system requests.
Outage times per year is a statistical value for the number oftimes blackouts occur in a year, indicating the power reliability ofthe system.
Deviation is the difference between the output of ES and dieseland the target curve, which indicates the extent of an insufficientor excessive power supply. It also inflects whether the design ofthe ES and diesel generators can meet the difference between thesystem load and the output of renewable energy. Deviation isdefined as
where PEER is the deviation, Pg;i is the power of generation, Pa;i
is the target power, and N is the number of sampled points.
C. Economic Evaluation
1) Battery Lifetime Prediction: The lifetime of a battery has agreat impact on economic performances. The battery is primarilyaffected by the depth of discharge (DOD) and the number ofcharge–discharge cycles. The rain-flow counting method [21] isadopted to count the cycles and the DOD of each cycle. Thedamage done to batteries with each charge–discharge cycle ismodeled as follows [22]:
CF ¼ a1 þ a2ea3�DOD þ a4e
a5�DOD (22)
where CF is the number of cycles to failure, indicating thedamage to the batteries; a1 � a5 are fitting constants; andDOD is the depth of discharge in a cycle.
The life cycle characteristics are shown in Fig. 5.After sufficient cycles have passed the fractions multiplied by
the number of cycles and the damage of discharges, the battery isassumed to have reached the end of its lifetime and must bereplaced. At the end of the simulation, the total fractional damageD and the expected battery lifetime are given by
LBat ¼ 1
D� T
Tyr; D ¼
X 1
CF;i(23)
XIAO et al.: SIZING OF ES AND DIESEL GENERATORS IN AN ISOLATED MICROGRID USING DFT 911
whereLBat is the expected lifetime of the batteries, year;D is thetotal damage in the sampled time; CF;i is the damage corre-sponding to every cycle;T is the sampled time; andTyr is the timein a whole year.
For instance, ifD ¼ 0:5 at the end of an annual simulation, itmeans that the batteries have attained 50%damage in 1 year. Halfof the battery lifetime has been consumed, and as a result, thebatteries need to be replaced in 2 years.
2) Diesel Generator Lifetime Prediction: The lifetime of adiesel generator depends on its operating time. Usually, agenerator has a nominal lifetime. For example, a high speed(3600 r/min), air-cooled diesel can be used for around 20 000 h.The lifetime of diesel generators can be calculated as follows:
Lgen ¼ Lnom
Tgen(24)
where Lgen is the expected lifetime of diesel generators, year;Lnom is the nominal life of diesel generators, hour; and Tgen is theoperating hours in a year, hours/year.
3) Economic Analysis: The cost of ES, diesel generators, andconverters include the capital, replacement, operating, andmaintenance costs. The fuel consumption of diesel generatorsis also included.
The consumption of generators is a function related to theoperation status, type, and rated capacity of diesel generators
F ¼ F0� Prate þ F1
� P (25)
where F is the consumption of diesel generators, L; Prate is therated power, kW;P is the output power of the generator, kW; andF0, F1 are coefficients of the Fuel Consumption-Power curve,L/kW. Typical values for F0 and F1 (0.06, 0.24) are adopted inthis paper.
The total annualized cost of the scheme
C ¼ Ccap þ CO&M þ Cfuel � F (26)
Ccap ¼ CES=LBat þ Cgen=Lgen (27)
whereCcap is the capital cost, which is scaled to 1 year by batterylifetimeLBat and diesel generator lifetimeLgen;CES andCgen arethe capital cost of ES and diesel generators, respectively; CO&M
is the operating and maintenance cost; and Cfuel is the price offuel, ¥=L.
V. DETERMINATION OF THE CUT-OFF FREQUENCY IN
DFT-BASED POWER ALLOCATION STRATEGY
This section describes how the cut-off frequency (i.e., fc inFig. 4) is determined and how the most economic ES/dieselgenerator’s design is achieved. The selection of a cut-off fre-quency value has a significant impact on allocating the balance-power between ES and diesel generators and the determination ofthe capacities for each component.
Apparently, if the value of the cut-off frequency is too small,the systemwould require a large amount of battery to compensatefor the high-frequency band, whichwould lead to a higher capitalcost. On the other hand, if the value of cut-frequency is overlylarge, the diesel generators will undertake most of the net loadand this will lead to higher fuel costs. Thus, it is necessary to findout the optimal cut-off frequency.
From Section II, we know that the balance power can bedecomposed into a series of discrete spectrums. The cut-offfrequency can be chosen from the set of frequencies within therange ½0; 1=ð2TsÞ�. For a certain value of cut-off frequency fc,the corresponding allocated powerPES andPD, for ES and dieselgenerators, respectively, can be obtained through the proceduredescribed in Section II. Then, technical and economicmodels areconstructed in Section IV for the evaluation of the designscheme. The total annualized cost C in (26) is the economyobjective. The technical indices in Section IV-B are the systemconstraints.
The objective is to minimize the total annualized of C whilemeeting the system’s technical constraints. A typical gradientsearch method based on the change of the objective w.r.t. cut-offfrequency is utilized in this paper to find the optimal cut-offfrequency. In short, if the objective improves within a new fcobtained from the previous fc aswell as the gradient of dC=dfc, itcontinues to adjust fc until no further improvements can bemade.
Fig. 6 provides the detailed procedure for optimally selectingthe cut-off frequency.
VI. CASE STUDY
The proposed method is validated via a case study. The dataused come from the operation of an island microgrid located inthe East China Sea, Zhejiang Province, China.
A. Case Description
This project is a typical isolated microgrid with wind, solar,diesel, and storage. It presently contains a 70-kWWT, a 100-kWPV system, diesel generators, battery energy storage (BES), and100-kW load. The BES system efficiency is set to 88%. The SOClimits are [40%, 100%]. The sample interval is 10 s. The reservecapacity rate of diesel generators is 10%. Load shedding is notallowed. The economic parameters in this paper are shown inTable I.
Usually, sampled data over a short period of time (e.g., 1 day orseveral days) are not representative. The sizing process should berepeated for different data sets over the course of an entire year inorder to obtain a series of capacities for the ES and dieselgenerators. The final capacity scheme is chosen at a high confi-dence level. Also, typical daily data are commonly used to
Fig. 5. Battery cycle life characteristics.
912 IEEE TRANSACTIONS ON SUSTAINABLE ENERGY, VOL. 5, NO. 3, JULY 2014
represent seasonal, or whole year, data within the planningproblem. In this case, to better illustrate the proposed method,we use the typical daily operation data to design the capacities ofES and diesel generators, as is shown in Fig. 7.
B. Sizing of ES and Diesel Generators
1) Data Analysis: The net load is the difference between theload curve and the output of renewable energy. The net load is
equal to the balance power, which is supplied by the BES and thediesel generators together. By using DFT to analyze the balancepower, the spectrum can be acquired. For the 10-s sampleinterval, the frequency range of the data is [0, 0.05 Hz].Fig. 8 shows part of the spectrum so that it may be seen moreclearly.
2) Optimal Selection of the Cut-Off Frequency: The gradientsearch procedure described in SectionV can be used to determinethe optimal cut-off frequency fc and obtain the most economicES/diesel generator designs. In this case, the range of the cut-offfrequency is in the range of [0, 0.05] Hz.
Starting from an initial fc at 0 Hz, the gradient search methodidentifies the optimal cut-off frequency to be 0.000023 Hz. Tofurther demonstrate and verify the results, more calculationsat different fc are performed and shown in Fig. 9(a) and (b),
Fig. 7. Typical daily data in the microgrid.
Fig. 8. Spectrum of balance power.
Fig. 6. Procedure of obtaining the optimum cut-off frequency.
TABLE IECONOMIC PARAMETERS
Note: ¥ stands for Yuan, the unit of Chinese currency, or CNY. 1 USD 6:1CNY in 2013.
XIAO et al.: SIZING OF ES AND DIESEL GENERATORS IN AN ISOLATED MICROGRID USING DFT 913
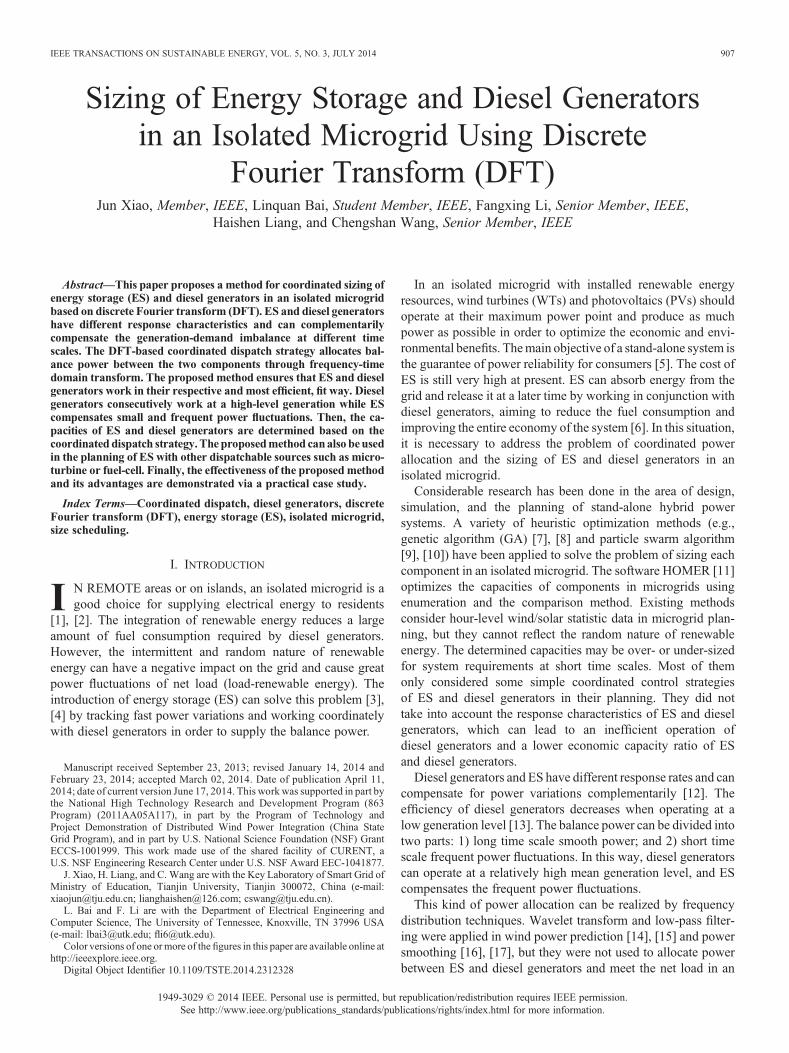
where 9(b) shows the zoom-in figure of 9(a) at the fc range of[0, 0.001] Hz.
Fig. 9 verifies that the identified optimal cut-off frequency isproducing the lowest total annualized cost. When the cut-offfrequency is 0, it means that all the balance power is undertakenby BES, and the capital cost of BES is high. With the increase inthe cut-off frequency value, the capital cost decreases and the fuelcost of diesel generators increases. When the cut-off frequencyreaches 0.05 Hz, it means that all positive balance power isproduced by diesel generators. The fuel consumption is very highand causes a high total-annualized cost.
In Fig. 9(a), it can be observed that the total cost changes littlewhen the cut-off frequency exceeds 0.025Hz. This is because theamplitudes are very small for high frequencies (as seen in Fig. 8),which have little impact on the power allocation and sizing of thescheme. The diesel generator compensates most of the balancepower.
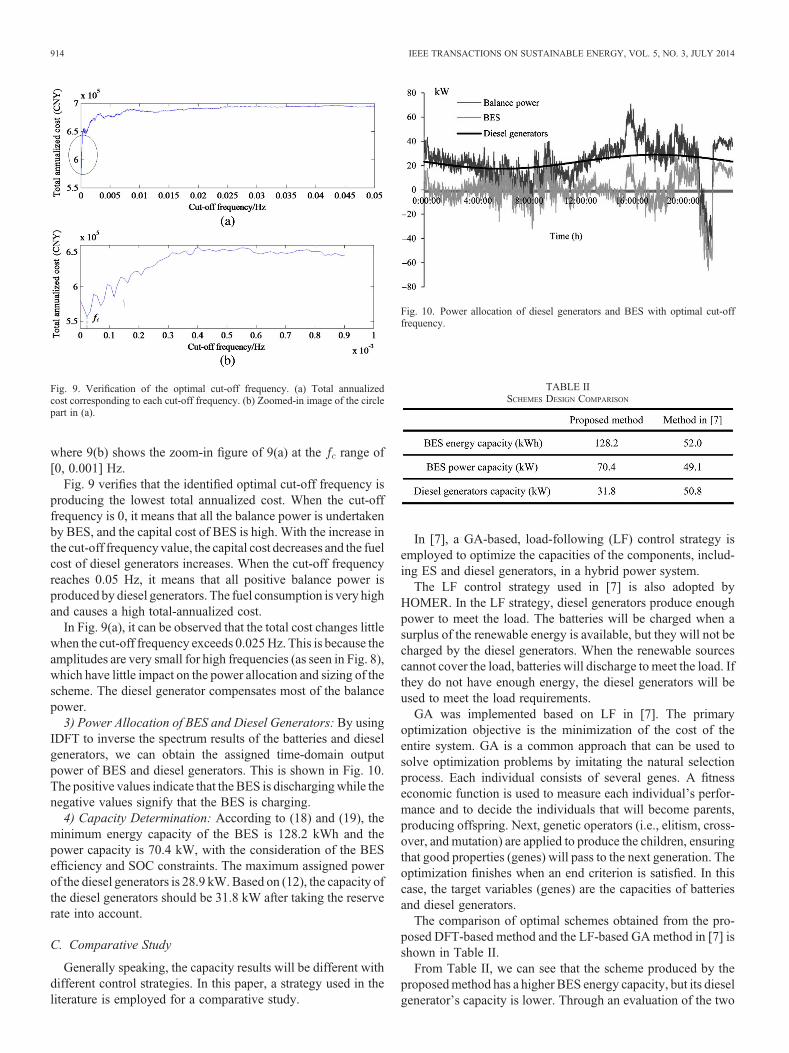
3) Power Allocation of BES and Diesel Generators: By usingIDFT to inverse the spectrum results of the batteries and dieselgenerators, we can obtain the assigned time-domain outputpower of BES and diesel generators. This is shown in Fig. 10.The positive values indicate that the BES is dischargingwhile thenegative values signify that the BES is charging.
4) Capacity Determination: According to (18) and (19), theminimum energy capacity of the BES is 128.2 kWh and thepower capacity is 70.4 kW, with the consideration of the BESefficiency and SOC constraints. The maximum assigned powerof the diesel generators is 28.9 kW.Based on (12), the capacity ofthe diesel generators should be 31.8 kW after taking the reserverate into account.
C. Comparative Study
Generally speaking, the capacity results will be different withdifferent control strategies. In this paper, a strategy used in theliterature is employed for a comparative study.
In [7], a GA-based, load-following (LF) control strategy isemployed to optimize the capacities of the components, includ-ing ES and diesel generators, in a hybrid power system.
The LF control strategy used in [7] is also adopted byHOMER. In the LF strategy, diesel generators produce enoughpower to meet the load. The batteries will be charged when asurplus of the renewable energy is available, but they will not becharged by the diesel generators. When the renewable sourcescannot cover the load, batteries will discharge to meet the load. Ifthey do not have enough energy, the diesel generators will beused to meet the load requirements.
GA was implemented based on LF in [7]. The primaryoptimization objective is the minimization of the cost of theentire system. GA is a common approach that can be used tosolve optimization problems by imitating the natural selectionprocess. Each individual consists of several genes. A fitnesseconomic function is used to measure each individual’s perfor-mance and to decide the individuals that will become parents,producing offspring. Next, genetic operators (i.e., elitism, cross-over, and mutation) are applied to produce the children, ensuringthat good properties (genes) will pass to the next generation. Theoptimization finishes when an end criterion is satisfied. In thiscase, the target variables (genes) are the capacities of batteriesand diesel generators.
The comparison of optimal schemes obtained from the pro-posed DFT-based method and the LF-based GAmethod in [7] isshown in Table II.
From Table II, we can see that the scheme produced by theproposedmethod has a higher BES energy capacity, but its dieselgenerator’s capacity is lower. Through an evaluation of the two
Fig. 10. Power allocation of diesel generators and BES with optimal cut-offfrequency.
Fig. 9. Verification of the optimal cut-off frequency. (a) Total annualizedcost corresponding to each cut-off frequency. (b) Zoomed-in image of the circlepart in (a).
TABLE IISCHEMES DESIGN COMPARISON
914 IEEE TRANSACTIONS ON SUSTAINABLE ENERGY, VOL. 5, NO. 3, JULY 2014
approaches, the technical and economic results comparison inwhich the economic results are all scaled to an annual basis, isperformed and is shown in Table III. The two methods use thesame economic and technical parameters in the sizing andevaluation process.
From Table III, it can be observed that both approaches meetthe technical needs, although using the method proposed in thispaper can reduce the total cost. TheDFT-basedmethod considersthe response characteristics of the ES and diesel generators,which better allocate the balance power between the two com-ponents. Although the initial investment cost is higher, the usageof diesel generators is reduced and they work more efficiently,which lowers the cost of fuel consumption. Using the method in[7], the diesel generators will meet the primary load, and the restwill be handled by the ES. This produces a high capacity andlarge fuel consumption usage for the diesel generators.
Fig. 11 shows the output of ES and diesel generators using themethod in [7]. A comparison between Figs. 10 and 11 shows thismore clearly. The proposed method in this paper can effectivelyallocate the power between ES and diesel, and then size theircapacities. In [7], GA is adopted to search the optimal solution,which is usually population-based and time-consuming, whilethe proposed method will be time-saving since the DFT can besolved very fast. Also, the proposed method will not be affectedby factors like human judgment.
VII. CONCLUSION
This paper has presented a DFT-based method for the coordi-nated sizing of ES and diesel generators in an isolated microgrid.The effectiveness of the proposed method has been validatedthrough a practical islandmicrogrid project. The contributions ofthe paper are as follows.
1) A DFT-based coordinated dispatch strategy was proposedto allocate balance power between ES and diesel genera-tors considering their respective rate of response. Theproposed strategy first allocates the balance power in thefrequency domain using DFT and the optimal cut-offfrequency, and then acquires the power allocation usingIDFT, back to the time domain. The diesel generatorsproduce major amounts of energy with slower and fewerfluctuations, therefore having a high efficiency rate, whilethe ES tracks fast power fluctuations and lowers the fuelconsumption of the system.
2) The capacities of ES and diesel generators are determinedbased on the coordinated dispatch strategy. The optimalcut-off frequency is selected for the least cost withintechnical constraints. This paper combines and examinesboth operation and planning issues. The random andintermittent nature of renewable energy is included in theplanning process, which is different from the previousplanning studies with hourly statistic data. Based on theassigned power produced by the dispatch strategy, theminimum capacities of ES and diesel generators are ob-tained with the intention of meeting system requirements.Some technical and economic indices are introduced toevaluate the schemes.
The proposed method can also be applied in the coordinatedcontrol and planning of ES with other dispatchable sources, suchas micro-turbines, fuel-cells, etc.
ACKNOWLEDGMENT
The authors acknowledge the generous supply of microgridoperation data sets from Zhejiang Electric Power Company,State Grid, China.
REFERENCES
[1] L. A. de Souza Ribeiro, O. R. Saavedra, S. L. de Lima, and J. G. de Matos,“Isolated micro-grids with renewable hybrid generation: The case ofLençóis island,” IEEE Trans. Sustain. Energy, vol. 2, no. 1, pp. 1–11,Jan. 2011.
[2] R. Karki and R. Billinton, “Considering renewable energy in small isolatedpower system expansion,” in Proc. Can. Conf. Elect. Comput. Eng., 2004,pp. 367–370.
[3] C. Abbey and G. Joós, “A stochastic optimization approach to rating ofenergy storage systems in wind-diesel isolated grids,” IEEE Trans. PowerSyst., vol. 24, no. 2, pp. 418–426, Feb. 2009.
[4] S. Rehman and L. Hadhrami, “Study of a solar PV–diesel–battery hybridpower system for a remotely located population near Rafha, Saudi Arabia,”Energy, vol. 35, no. 12, pp. 4986–4995, Dec. 2010.
[5] Q. Jiang, M. Xue, and G. Geng, “Energy management of microgrid in grid-connected and stand-alonemodes,” IEEE Trans. Power Syst., vol. 28, no. 3,pp. 3380–3389, Aug. 2013.
[6] P. Lautier,M. Prévost, andP.Martel, “Off-grid diesel power plant efficiencyoptimization and integration of renewable energy sources,” in Proc. IEEECan. Elect. Power Conf.,Montréal, QC, Canada, Oct. 2007, pp. 274–279.
[7] R. Dufo-Lopez and J. L. Bernal-Agustin, “Design and control strategies ofPV-Diesel systems using genetic algorithms,” Solar Energy, vol. 79,pp. 33–46, 2005.
Fig. 11. Output power of diesel generator and BES using method in [7].
TABLE IIITECHNOLOGY AND ECONOMY RESULTS COMPARISON
XIAO et al.: SIZING OF ES AND DIESEL GENERATORS IN AN ISOLATED MICROGRID USING DFT 915
[8] T. Senjyu, D. Hayashi, A. Yona, N. Urasaki, and T. Fumabashi, “Optimalconfiguration of power generating systems in isolated islandwith renewableenergy,” Renew. Energy, vol. 32, no. 11, pp. 1917–1933, Sep. 2007.
[9] C. Wang, M. Liu, and L. Guo, “Cooperative operation and optimal designfor islandedmicrogrid,” in Proc. Innov. Smart Grid Technol. (ISGT), 2012,pp. 1–8.
[10] J. Wang and F. Yang, “Optimal capacity allocation of standalone wind/solar/battery hybrid power system based on improved particle swarmoptimisation algorithm,” IET Renewable Power Gener., vol. 7,pp. 443–448, 2013.
[11] P. Lilienthal, T. Lambert, P. Gilman et al., HOMER V.2.68beta [EB/OL].Colorado, USA: Homer Energy, LLC, Jan. 1, 2011 [Online]. Available:http://www.homerenergy.com/.
[12] B. Singh and J. Solanki, “Compensation for diesel generator-based isolatedgeneration system employing DSTATCOM,” IEEE Trans. Ind. Appl.,vol. 47, no. 1, pp. 238–244, Jan./Feb. 2011.
[13] A. Elmitwally, “Flexible operation strategy for an isolated PV-Dieselmicrogrid without energy storage,” IEEE Trans. Energy Convers., vol. 26,no. 1, pp. 235–244, Mar. 2011.
[14] L. Wang, L. Dong, and Y. Hao, “Wind power prediction using wavelettransform and chaotic characteristics,” inProc.WorldNon-Grid-ConnectedWind Power Energy Conf., 2009, pp. 1–5.
[15] Q. Jiang and H. Hong, “Wavelet-based capacity configuration and coordi-nated control of hybrid energy storage system for smoothingoutwind powerfluctuations,” IEEE Trans. Power Syst., vol. 28, no. 3, pp. 1363–1372,Aug. 2013.
[16] H. R.Mohseni, E. L.Wilding, and S. Sanei, “Preprocessing of event-relatedpotential signals via Kalman filtering and smoothing,” in Proc. DigitalSignal Process. Conf., 2007, pp. 179–182.
[17] J. Xiao, L. Bai, Z. Lu, and K. Wang, “Method, implementation andapplication of energy storage system designing,” Int. Trans. Elect. EnergySyst., vol. 24, pp. 378–394, 2014.
[18] Y. Makarov, P. Du, M. C. W. Kintner-Meyer et al., “Sizing energy storageto accommodate high penetration of variable energy resources,” IEEETrans. Sustain. Energy, vol. 3, no. 1, pp. 34–40, Jan. 2012.
[19] D.Manolakos , G. Papadakis et al., “ASimulation-optimisation programmefor designing hybrid energy systems for supplying electricity and freshwater through desalination to remote areas-case study: The MerssiniVillage, Donoussa island, Aegean Sea, Greece,” Energy, vol. 26, no. 7,pp. 679–704, 2001.
[20] S. Chen, H. B. Gooi, and M. Wang, “Sizing of energy storage for micro-grids,” IEEE Trans. Smart Grid, vol. 3, no. 1, pp. 142–151, Aug. 2012.
[21] E. Mohamed, M. Yusuff, and D. Wahab, “Application of rainflow cyclecounting in the reliability prediction of automotive front corner modulesystemin,” in Proc. Ind. Eng. Eng. Manage., 2009, pp. 709–712.
[22] J. Manwell, A. Rogers, G. Hayman, C. Avelar, and J. McGowan,“Hybrid2-a hybrid system simulation model: Theory manual,”Nat.Renew.Energy Lab., Univ. Massachusetts, Tech. Rep. Subcontract No. XL-1-11126-1-1, Jun. 2006 [Online]. Available: http://www.ceere.org/rerl/projects/software/hybrid2/Hy_theory_manual.pdf
Jun Xiao (M’13) received the B.S., M.S., and Ph.D.degrees from Tianjin University, Tianjin, China, in1994, 1997, and 2003, respectively.Currently, he is a Professor with the School of
Electrical Engineering and Automation, Tianjin Uni-versity. He had been a visiting scholar at the Univer-sity of Tennessee, Knoxville, TN, USA, in 2010. Hisresearch interests include distribution systems plan-ning, assessment, and microgrids planning.
Linquan Bai (S’13) received the B.S. andM.S. degrees in electrical engineering from TianjinUniversity, Tianjin, China, in 2010 and 2013, respec-tively. He is now working toward the Ph.D. degreeat The University of Tennessee at Knoxville (UTK),TN, USA.His research interests include voltage stability,
microgrid planning and optimal operation, and energystorage capacity optimization.
Fangxing Li (M’01–SM’05), also known as Fran Li,received the B.S.E.E. and M.S.E.E. degrees bothfrom Southeast University Nanjing, China, in 1994and 1997, respectively, and the Ph.D. degree fromVirginia Tech, Blacksburg, VA, USA, in 2001.Currently, he is an Associate Professor at The
University of Tennessee at Knoxville (UTK), TN,USA. He had been a senior and then a principalengineer at ABBElectrical SystemConsulting (ESC),Raleigh, NC, USA, from 2001 to 2005, prior tojoining UTK in August 2005. His current interests
include renewable energy integration, power markets, distributed energyresources, and smart grid.Dr. Li is a registered Professional Engineer (P.E.) in the state ofNorthCarolina,
and a Fellow of IET (formerly IEE).
Haishen Liang received the B.S. and M.S. degreesin electrical engineering from Tianjin University,Tianjin, China, in 2011 and 2014, respectively.His research interests include energy storage sys-
tem planning and microgrids.
Chengshan Wang (M’08–SM’12) received thePh.D. degree in electrical engineering from TianjinUniversity, Tianjin, China, in 1991.Currently, he is a Professor with the School of
Electrical Engineering and Automation, TianjinUniversity. His research includes the area of distribu-tion system planning, distributed generation systemanalysis and simulation, and power system securityanalysis.Prof. Wang is a senior member of the Chinese
Society for Electrical Engineering (CSEE), a memberof the national committee of International Conference on Electricity Distribution(CIRED), and a member of national committee of International Council on LargeElectric Systems (CIGRE).
916 IEEE TRANSACTIONS ON SUSTAINABLE ENERGY, VOL. 5, NO. 3, JULY 2014


![Joint Investment and Operation of Microgrid · 2015-11-09 · and microgrid operation. While in [9]–[12], only microgrid operation is studied under given microgrid facilities. However,](https://static.documents.pub/doc/80x56/5f055ca67e708231d412960b/joint-investment-and-operation-of-microgrid-2015-11-09-and-microgrid-operation.jpg)


![fli6«o jg gLlt · /fli6«o jg gLlt–@)&% 17 /fli6«o jg gLlt @)&% g]k]kfn ;/sf/fn ;/sf/ jjg tyf jftfj/0f dGqfnog tyf jftfj/0f dGqfno ll;;+x+xb/af/, sf7df8fb/af/, sf7df8f}+}](https://static.documents.pub/doc/80x56/5f1da5fb2a745978fc60adf8/fli6o-jg-fli6o-jg-gllta-17-fli6o-jg-gllt-gkkfn-sffn.jpg)


![!( 2014 i7 ^ bnx¿n] ‘Joj;foL s/ · 2014 k[i7 ^ d"No ¿= %.– AdArshA sAmAj NAtioNAl dAily / fli6«o b} lgs / fli6«o æsÆ ju{ Study in Poland Apace international institute P.](https://static.documents.pub/doc/80x56/5f55c0099ea6200f80412ce5/-2014-i7-bnxn-ajojfol-s-2014-ki7-dno-a-adarsha-samaj.jpg)


![fli6«o dfgj clwsf/ cfof]usf] · 2019-03-25 · /fli6«o dfgj clwsf/ cfof]usf] jflif{s k|ltj]bg -@)&$—@)&%_ /fli6«o dfgj clwsf/ cfof]u xl/x/ejg, nlntk'/, g]kfn](https://static.documents.pub/doc/80x56/5e5d6f45b3499c79f90018a1/fli6o-dfgj-clwsf-cfofusf-2019-03-25-fli6o-dfgj-clwsf-cfofusf-jflifs.jpg)
