IESP The New York City Aspiring Principals Program A School-Level Evaluation Sean P. Corcoran Amy Ellen Schwartz Meryle Weinstein Institute for Education and Social Policy New York University August 2009
Transcript
IESP
The New York CityAspiring Principals Program
A School-Level Evaluation
Sean P. Corcoran
Amy Ellen Schwartz
Meryle Weinstein
Institute for Education and Social PolicyNew York University
August 2009
Direct correspondence to Sean Corcoran, Institute for Education and Social Policy, New York University, 82 Washington Square East, 7th Floor, New York, NY 10003. Phone: (212) 992-9468. Email: [email protected]. Funding for this paper was provided by the NYC Leadership Academy through grants from The Eli and Edythe Broad Foundation and The Michael and Susan Dell Foundation. The authors would like to thank Tom Gold and the New York City Department of Education for their cooperation in providing necessary data, and Lila Nazar de Jaucourt for her research assistance.
with an experienced principal, along with bi-weekly leadership development seminars. Finally, the
planning summer allows participants an opportunity to transition to their school leadership position.
This report represents the first systematic comparison of student outcomes in schools led by
APP graduates after three years to those in comparable schools led by other new principals. We
provide both a straightforward comparison of average achievement in these two groups of schools,
and in efforts to isolate a potential program effect, we conduct a formal regression analysis that
accounts for pre-existing differences in student performance and characteristics. We also report key
differences between the school leaders themselves and the schools in which they were placed. All
principals in this study were installed in 2004-05 or 2005-06, remained in the same school for three
or more consecutive years, and led their school through the 2007-08 school year.
We find that the first two cohorts of APP principals were placed in schools that were
demographically, geographically, and academically distinct from comparison schools led by other
new principals. In keeping with the Leadership Academy’s mission of placing graduates in the
hardest-to-staff schools, APP principals were more likely to be placed in schools that were low-
performing, relative to both the citywide average and to schools receiving a new principal at the
same time. Moreover, the average APP elementary/middle school was trending downward in both
English Language Arts (ELA) and mathematics scores, relative to the citywide average, before APP
principals took the helm.
During the period of this study, New York City schools as a whole improved their average
annual state assessment scores in both ELA and mathematics, and students in schools that
experienced a leadership transition during this time experienced gains as well. However, controlling
for pre-existing differences in student demographics and achievement, we find that APP principals
bettered their comparison group counterparts in ELA performance, trending upward apace with
4 AUGUST 2009
overall city-wide gains.3 Whereas comparison schools, while also posting gains, fell further behind
the rest of the city in their third and fourth years, APP schools remained stable, and by the third year
the difference in these schools’ trajectories becomes statistically significant. In mathematics, both
groups’ scores improved over time, although comparison principals’ schools trended slightly better
in the years following the arrival of their new principal, with differences that are small and most
often not statistically significant. At the high school level, we find minor and inconclusive
differences in achievement between APP and comparison schools.
In brief, our study finds:
APP and comparison principals have different characteristics
o APP principals are younger and more likely to be black than those in the
comparison group. The average age of APP principals in the study was 40.9, as
compared with 44.4 for comparison principals. Forty-one percent of APP principals
were black versus 29 percent of comparison principals.
o Both APP and comparison principals had substantial experience in the classroom.
However, APP principals had three fewer years of teaching experience on average
than comparison principals, at 7.3 versus 10.3 years.
o APP principals were unlikely to have served as an assistant principal. Seventy-eight
percent of APP principals had no prior experience as an assistant principal, while
most comparison principals (82 percent) had some experience in this position.
Comparison principals had also worked at their respective schools longer, in
positions other than principal.
APP and comparison principals were placed in schools with different demographic profiles
3As explained in Section II, we refer to ―APP schools‖ as schools that were eventually led by an APP principal in our study. ―Comparison schools‖ are schools that were eventually led by a non-APP novice principal.
THE NEW YORK CITY ASPIRING PRINCIPALS PROGRAM 5
o In elementary and secondary schools, APP principals were more likely to be located
in the Bronx (32 percent versus 18 percent of comparison principals), while
comparison principals were more likely to be found in Brooklyn and Queens. APP
principals in high schools were more likely to be working at schools in Manhattan
than comparison high school principals.
o APP schools enrolled fewer Asian and white students than comparison schools, and
had a significantly greater share of black students (43 percent in APP schools versus
31 percent in comparison schools). On average, APP schools were smaller than
comparison schools, at both the elementary/middle and high school levels.
APP and comparison principals were placed in schools with different performance levels
and histories
o Schools in which APP principals were placed exhibited lower initial levels of
performance than comparison principals’ schools, an achievement gap that preceded
the arrival of these new principals. The average APP elementary and middle school
student performed substantially below their citywide grade level average in ELA and
mathematics in the years before their new principal, while students in comparison
schools scored approximately at citywide grade-level average. These pre-existing
differences are evident regardless of whether one compares scale scores, proficiency
rates, or standardized scores.4
o Elementary and middle schools in which APP principals were placed were generally
on a sharp downward trend in mathematics and ELA—relative to the citywide
average—in the years preceding the new principal. This was especially evident for
4 For most of our analysis we use average standardized scores as our measure of student achievement. These scores indicate how far the average student in a school scored from his/her citywide grade level average, in standard deviation units. As we explain in Section V, these scores are the best suited to making comparisons across tests, grades, and years.
6 AUGUST 2009
the 2005 cohort of APP schools. Comparison schools, by contrast, experienced
relatively stable performance in these subjects prior to their new principal.
In the initial years of their leadership, elementary and middle school APP principals had
comparable or better growth trends than comparison principals
o Controlling for pre-existing differences in student demographics and achievement,
APP principals bettered their comparison group counterparts in ELA, trending
upward apace with overall city-wide gains. Whereas comparison schools fell further
behind the rest of the city in their third and fourth years, APP schools remained
stable, and by the third year the difference in these schools’ trajectories is statistically
significant. In mathematics, both APP and comparison schools scores improved
over time, although APP schools trended slightly worse following the arrival of their
new principal. These differences, however, are small and not consistently statistically
significant.
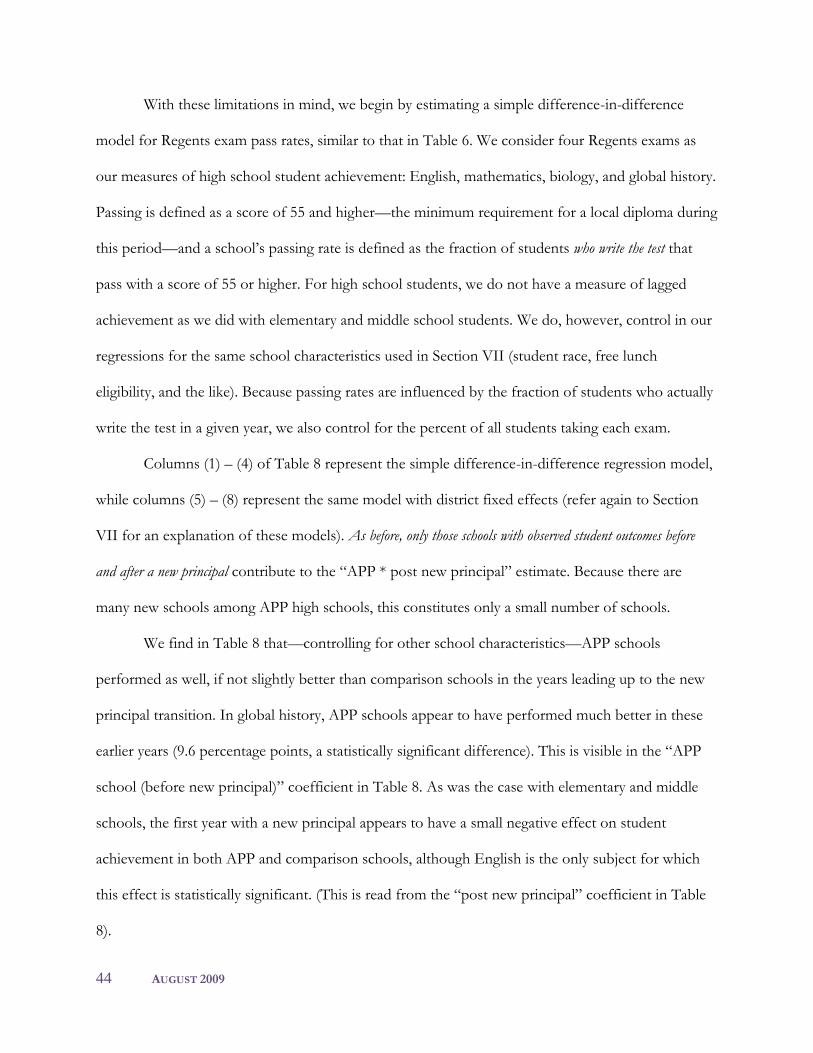
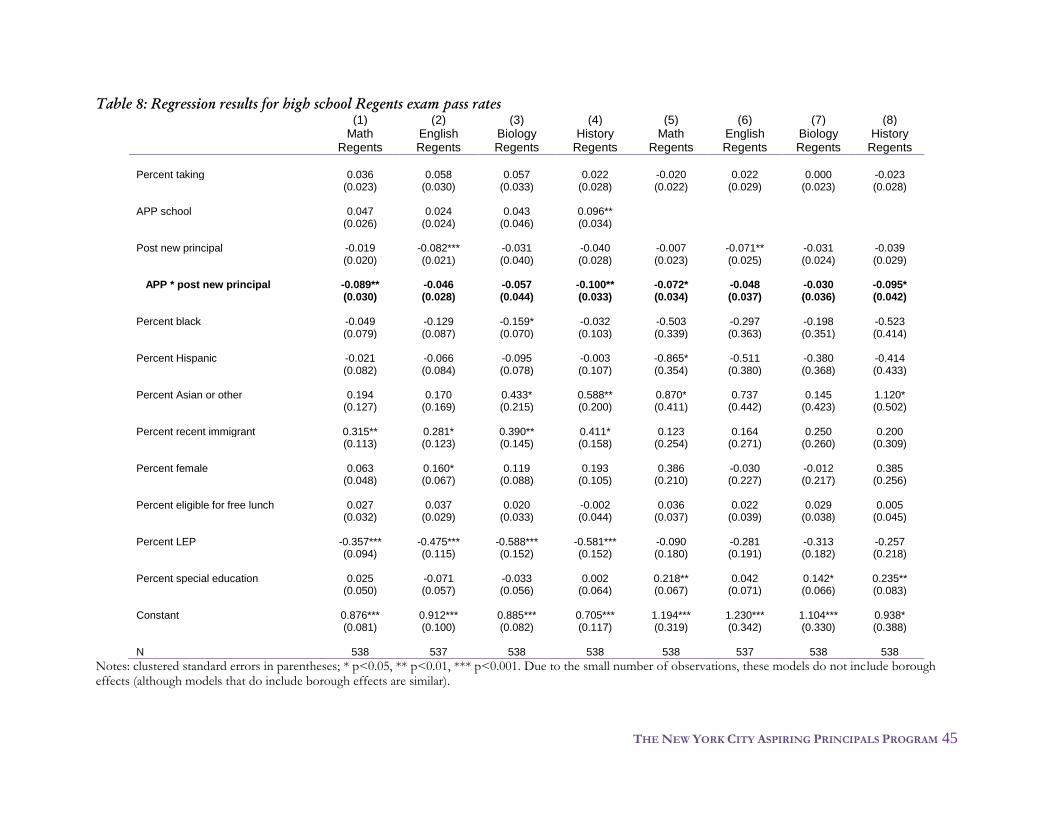
School performance differences at the high school level are small and mostly inconclusive
o APP and comparison high schools differed in their average state Regents’ Exam
scores, proportions of students taking Regents exams, and graduation rates, both
before and after the arrival of their new principal. The significance of these
differences, however, is inconclusive, given the small sample of high school
principals in the study.
The remainder of this report is organized as follows. Section II describes how APP and
comparison principals were selected for inclusion in the study. Section III contrasts the average
characteristics of APP principals with those of other novice principals selected as our comparison
group. Sections IV and V use administrative data from NYCDOE to provide a baseline comparison
THE NEW YORK CITY ASPIRING PRINCIPALS PROGRAM 7
of students and schools served by APP and comparison principals. Section VI is a descriptive
analysis of average student achievement in APP and comparison schools, both in the principals’
initial year and in years before and after the arrival of the new principal. Finally, sections VII and
VIII provide a formal regression analysis of student achievement in APP and comparison schools.
II. Description of the Data and Sample
The primary goal of this report is to compare schools led by Aspiring Principals Program
(APP) graduates to comparable schools led by non-APP principals. In this section, we describe how
principals and schools were selected for this analysis. The first step required the identification of
APP and non-APP principals with comparable years of experience leading a school (roughly 2.8 –
4.6 years). The second involved further limiting this group to those who led one school for a
sufficient time to be meaningfully evaluated.5 The final step involved matching principals to student
outcomes in administrative data from the NYCDOE.
For most of the schools in our analysis, we have measured outcomes for years prior to the
new principal’s installation and years following his or her arrival. Having both of these measures
allows for a ―pre‖ and ―post‖ comparison of outcomes within the same schools. Throughout this
report, we refer to schools eventually led by an APP principal as ―APP schools.‖ ―Comparison
schools‖ are schools eventually led by a comparison principal. Both APP and comparison schools
are observed before and after the arrival of their new principal. Only ―post‖ outcome measures are
available for new schools. While we include new schools in our descriptive analyses, we are unable to
include these schools in ―pre‖ and ―post‖ comparisons.6
5Our requirement that principals remain in one school for three consecutive years is based on the notion that it takes time to see evidence of school improvement in student test scores. Scholars of school improvement (e.g. Fullan and Stiegelbauer, 1991) suggest three years as the minimum amount of time needed to see such results. 6 In future work, we hope to use student-level data to provide a baseline level of achievement for principals leading new schools.
8 AUGUST 2009
Selection of APP and comparison principals
For this study, we restricted our attention to graduates of the first two cohorts of the Aspiring
Principals Program (2004 and 2005) who became principals in 2004-05 and 2005-06, remained with
the same school for three or more consecutive years, and continued as principals in 2007-08.
Comparison principals were also required to meet these criteria to be included. Because of these
restrictions, not all principals who began service in these years are represented in this analysis. Of the
147 graduates in the 2004 and 2005 APP cohorts, 88 percent (n=130) were placed as a school
principal at the time of our study. Sixty percent (n=88) met our strict inclusion criteria.7 The other
40 percent (n=59) are excluded for a variety of reasons, as summarized in Table 1.
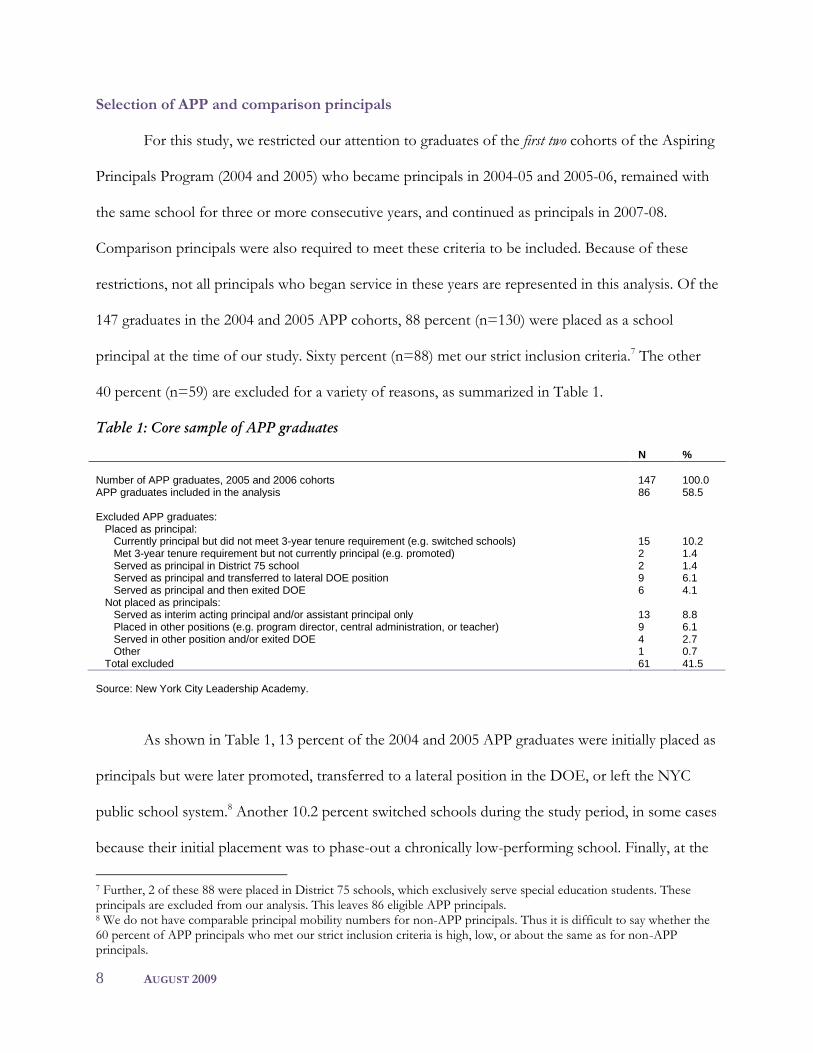
Table 1: Core sample of APP graduates
N
%
Number of APP graduates, 2005 and 2006 cohorts 147 100.0 APP graduates included in the analysis 86 58.5 Excluded APP graduates: Placed as principal: Currently principal but did not meet 3-year tenure requirement (e.g. switched schools) 15 10.2 Met 3-year tenure requirement but not currently principal (e.g. promoted) 2 1.4 Served as principal in District 75 school 2 1.4 Served as principal and transferred to lateral DOE position 9 6.1 Served as principal and then exited DOE 6 4.1 Not placed as principals: Served as interim acting principal and/or assistant principal only 13 8.8 Placed in other positions (e.g. program director, central administration, or teacher) 9 6.1 Served in other position and/or exited DOE 4 2.7 Other 1 0.7 Total excluded 61 41.5
Source: New York City Leadership Academy.
As shown in Table 1, 13 percent of the 2004 and 2005 APP graduates were initially placed as
principals but were later promoted, transferred to a lateral position in the DOE, or left the NYC
public school system.8 Another 10.2 percent switched schools during the study period, in some cases
because their initial placement was to phase-out a chronically low-performing school. Finally, at the
7 Further, 2 of these 88 were placed in District 75 schools, which exclusively serve special education students. These principals are excluded from our analysis. This leaves 86 eligible APP principals. 8 We do not have comparable principal mobility numbers for non-APP principals. Thus it is difficult to say whether the 60 percent of APP principals who met our strict inclusion criteria is high, low, or about the same as for non-APP principals.
THE NEW YORK CITY ASPIRING PRINCIPALS PROGRAM 9
time of study, 18.3 percent had not become principals in the NYC public schools, but had accepted
other positions within or outside NYC (including assistant principal, central administration, and
teaching positions). Of these, about a fifth served as an interim principal before assuming permanent
positions as assistant principals.
For our comparison group, we drew from a list of all active NYC principals in 2007-08 and
identified those who were new principals in 2004-05 or 2005-06, and had remained in the same
school for three or more years. 371 non-APP principals met these criteria. Of these, 334 led schools
with grade configurations comparable with those led by APP principals. We refer to the 86 eligible
APP and 334 eligible comparison principals as our ―combined sample‖ in Panel A of Table 2.
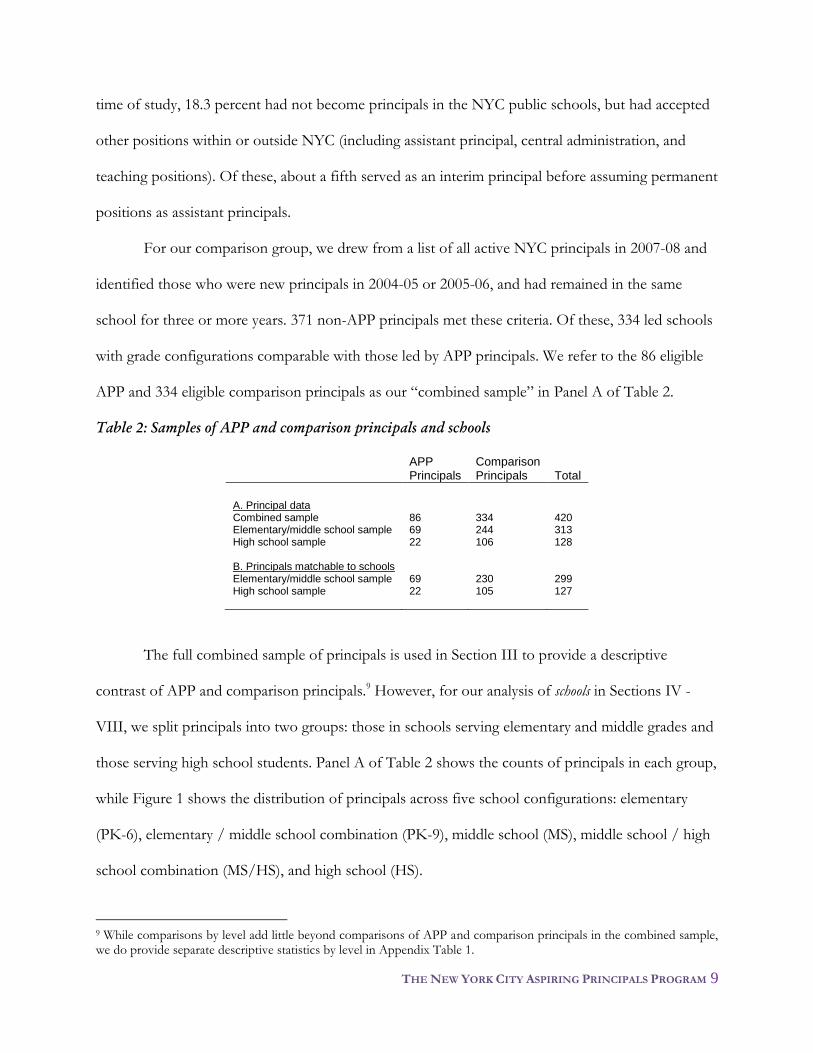
Table 2: Samples of APP and comparison principals and schools
APP Principals
Comparison Principals
Total
A. Principal data Combined sample 86 334 420 Elementary/middle school sample 69 244 313 High school sample 22 106 128 B. Principals matchable to schools Elementary/middle school sample 69 230 299 High school sample 22 105 127
The full combined sample of principals is used in Section III to provide a descriptive
contrast of APP and comparison principals.9 However, for our analysis of schools in Sections IV -
VIII, we split principals into two groups: those in schools serving elementary and middle grades and
those serving high school students. Panel A of Table 2 shows the counts of principals in each group,
while Figure 1 shows the distribution of principals across five school configurations: elementary
(PK-6), elementary / middle school combination (PK-9), middle school (MS), middle school / high
school combination (MS/HS), and high school (HS).
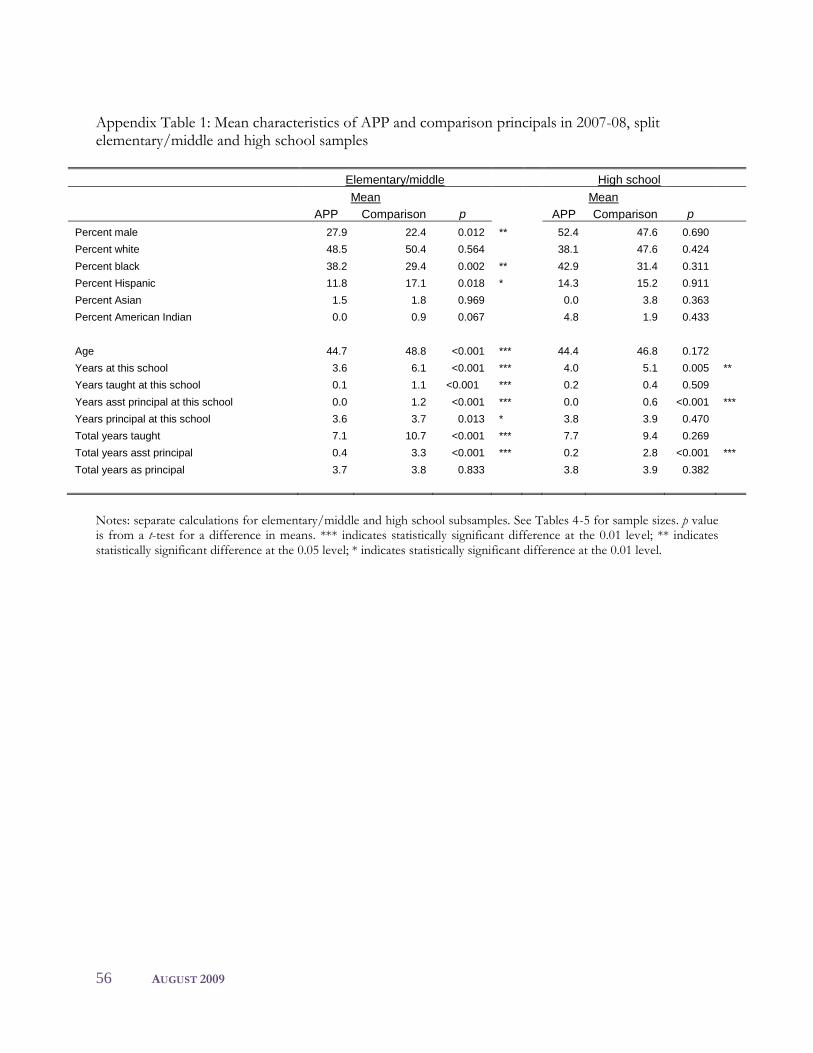
9 While comparisons by level add little beyond comparisons of APP and comparison principals in the combined sample, we do provide separate descriptive statistics by level in Appendix Table 1.
10 AUGUST 2009
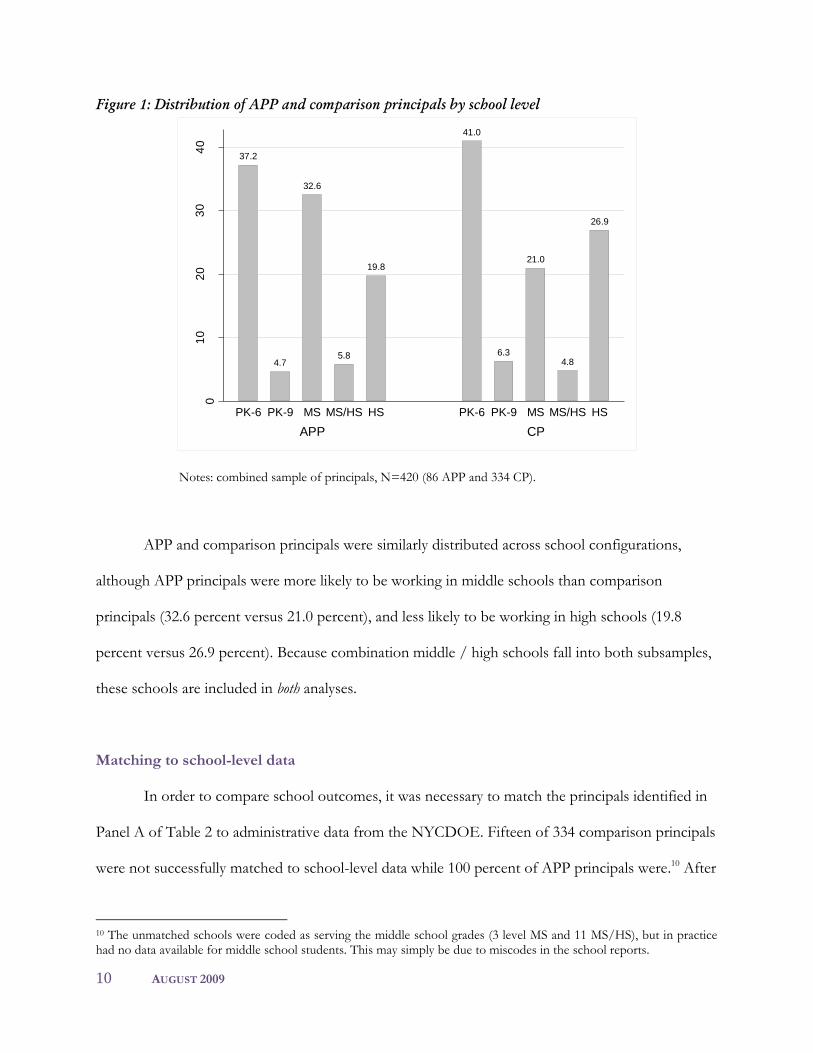
Figure 1: Distribution of APP and comparison principals by school level
37.2
4.7
32.6
5.8
19.8
41.0
6.3
21.0
4.8
26.9
01
02
03
04
0
Pe
rcen
t
APP CP
PK-6 PK-9 MS MS/HS HS PK-6 PK-9 MS MS/HS HS
Notes: combined sample of principals, N=420 (86 APP and 334 CP).
APP and comparison principals were similarly distributed across school configurations,
although APP principals were more likely to be working in middle schools than comparison
principals (32.6 percent versus 21.0 percent), and less likely to be working in high schools (19.8
percent versus 26.9 percent). Because combination middle / high schools fall into both subsamples,
these schools are included in both analyses.
Matching to school-level data
In order to compare school outcomes, it was necessary to match the principals identified in
Panel A of Table 2 to administrative data from the NYCDOE. Fifteen of 334 comparison principals
were not successfully matched to school-level data while 100 percent of APP principals were.10 After
10 The unmatched schools were coded as serving the middle school grades (3 level MS and 11 MS/HS), but in practice had no data available for middle school students. This may simply be due to miscodes in the school reports.
THE NEW YORK CITY ASPIRING PRINCIPALS PROGRAM 11
matching we are left with 69 APP and 230 comparison schools in the elementary / middle school
sample, and 22 APP and 105 comparison principals in the high school sample (Panel B of Table 2).11
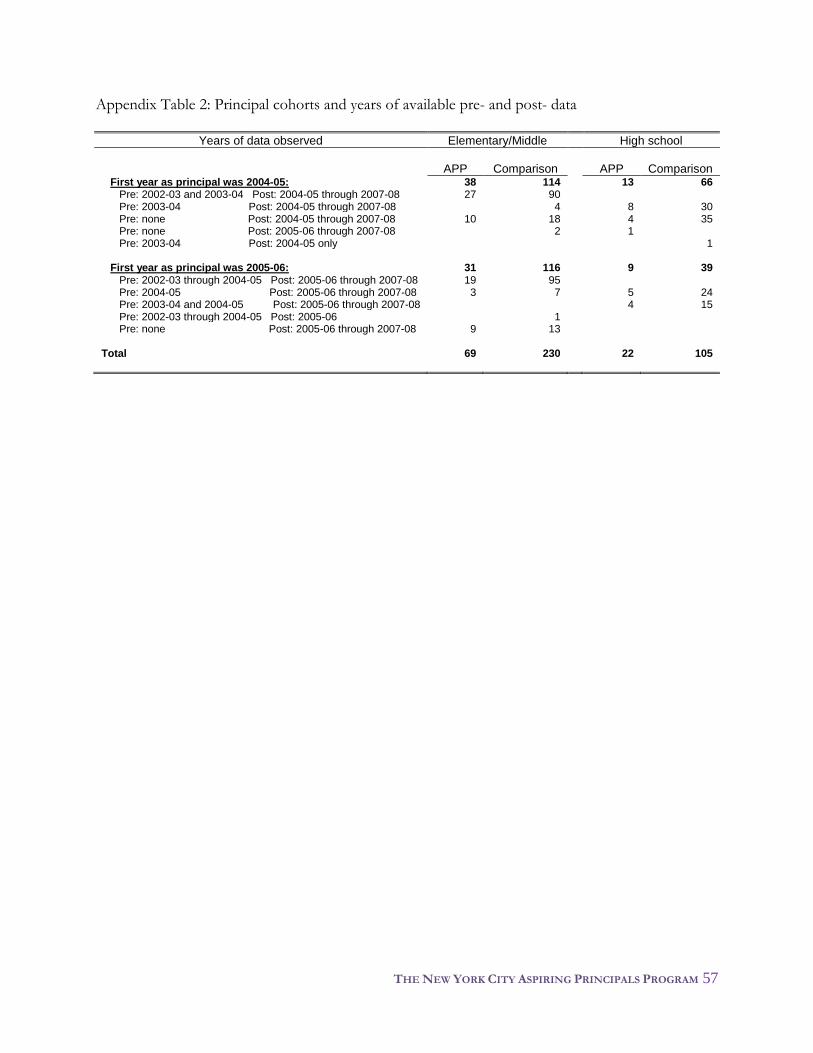
Another practical limitation on our data is the number of years for which school results are
available. For example, principals that began work in 2005-06 have at most three years of results
under their leadership, while those who began in 2004-05 have up to four.12 Our elementary /
middle school data series begins in 2002-03, so for some cases we observe schools up to three years
before the arrival of their new principal (for those beginning in 2005-06), while for others we observe
up to two years prior (for those beginning in 2004-05). For high schools, our data series begins in
2003-04, so we have at most two years of data prior to the installation of a new principal. New
schools have no observable data prior to the tenure of the founding principal. Details on data
availability for schools in each principal cohort are provided in Appendix Table 2.
III. Characteristics of APP and Comparison Principals
Table 3 provides the average characteristics of APP and comparison principals in our
combined sample.13 We observe several statistically significant differences in the demographics of
APP and comparison principals. For example, APP principals were younger and more likely to be
black than those in the comparison group. As seen in Table 3, 40.7 percent of APP principals were
black versus 29.3 percent of comparison principals. APP principals were somewhat less likely to be
Hispanic (12.8 percent versus 17.4 percent) or white (44.2 percent versus 49.1 percent) than
11 Again, the sum of the two APP subsamples (69 + 22 = 91) exceeds our total number of APP principals (86) because middle school / high school combination principals are included in both subsamples. 12 In some cases, principals took leadership of a school in the middle of the school year. We coded those principals who joined a school in a given school year as present for the entire year. 13 A comparison of principals by school level adds little beyond the information provided by the combined sample. We do, however, provide these statistics in Appendix Table 1. As this table shows, elementary / middle school principals (both APP and comparison) were less likely to be male than high school principals. APP high school principals were less likely to be white than APP elementary / middle principals (38.1 percent versus 48.5 percent). Comparison principals in the high schools were less experienced as teachers and assistant principals than their elementary/middle school counterparts, while APP principals in the high schools tended to have more prior experience than their primary school counterparts.
12 AUGUST 2009
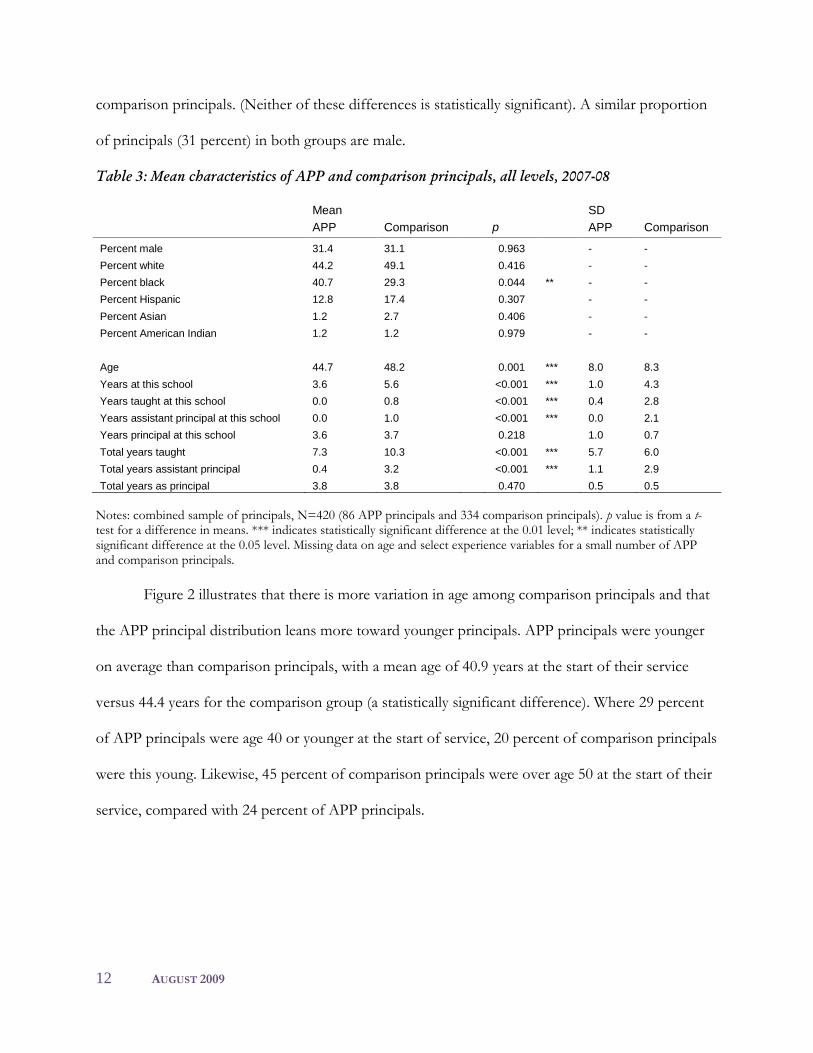
comparison principals. (Neither of these differences is statistically significant). A similar proportion
of principals (31 percent) in both groups are male.
Table 3: Mean characteristics of APP and comparison principals, all levels, 2007-08
Mean SD
APP Comparison p APP Comparison
Percent male 31.4 31.1 0.963 - -
Percent white 44.2 49.1 0.416 - -
Percent black 40.7 29.3 0.044 ** - -
Percent Hispanic 12.8 17.4 0.307 - -
Percent Asian 1.2 2.7 0.406 - -
Percent American Indian 1.2 1.2 0.979 - -
Age 44.7 48.2 0.001 *** 8.0 8.3
Years at this school 3.6 5.6 <0.001 *** 1.0 4.3
Years taught at this school 0.0 0.8 <0.001 *** 0.4 2.8
Years assistant principal at this school 0.0 1.0 <0.001 *** 0.0 2.1
Years principal at this school 3.6 3.7 0.218 1.0 0.7
Total years taught 7.3 10.3 <0.001 *** 5.7 6.0
Total years assistant principal 0.4 3.2 <0.001 *** 1.1 2.9
Total years as principal 3.8 3.8 0.470 0.5 0.5
Notes: combined sample of principals, N=420 (86 APP principals and 334 comparison principals). p value is from a t-test for a difference in means. *** indicates statistically significant difference at the 0.01 level; ** indicates statistically significant difference at the 0.05 level. Missing data on age and select experience variables for a small number of APP and comparison principals.
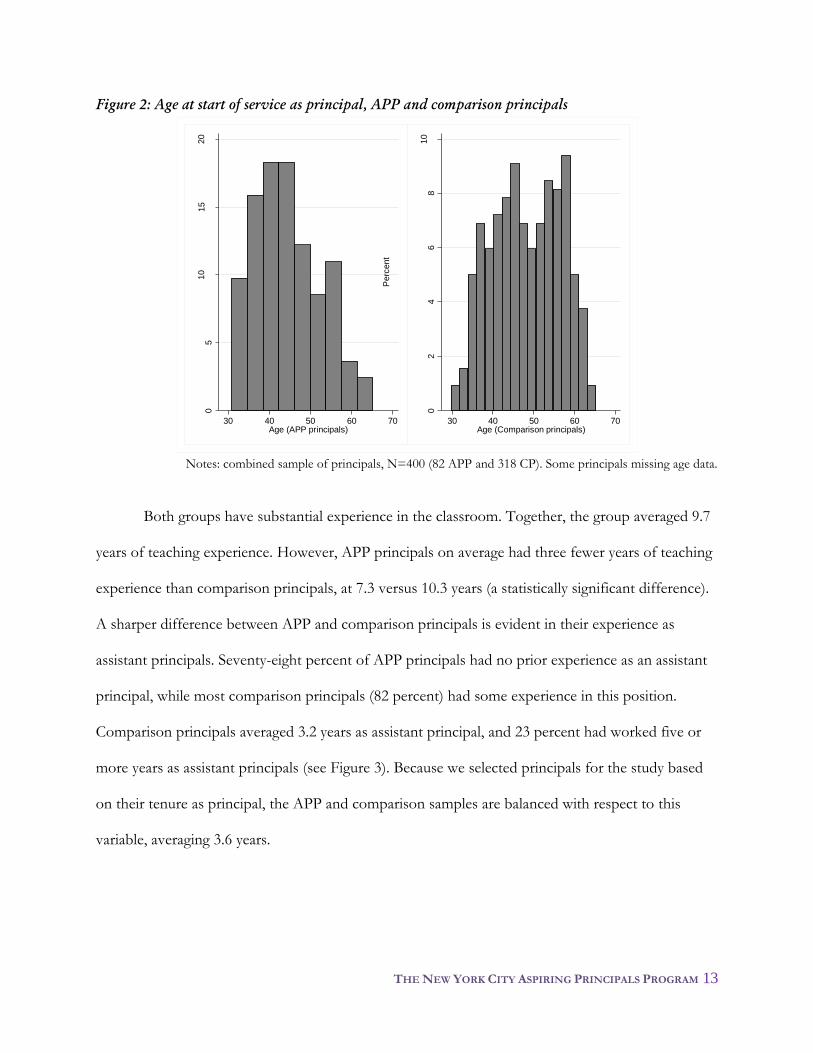
Figure 2 illustrates that there is more variation in age among comparison principals and that
the APP principal distribution leans more toward younger principals. APP principals were younger
on average than comparison principals, with a mean age of 40.9 years at the start of their service
versus 44.4 years for the comparison group (a statistically significant difference). Where 29 percent
of APP principals were age 40 or younger at the start of service, 20 percent of comparison principals
were this young. Likewise, 45 percent of comparison principals were over age 50 at the start of their
service, compared with 24 percent of APP principals.
THE NEW YORK CITY ASPIRING PRINCIPALS PROGRAM 13
Figure 2: Age at start of service as principal, APP and comparison principals
05
10
15
20
Perc
ent
30 40 50 60 70Age (APP principals)
02
46
810
Perc
ent
30 40 50 60 70Age (Comparison principals)
Notes: combined sample of principals, N=400 (82 APP and 318 CP). Some principals missing age data.
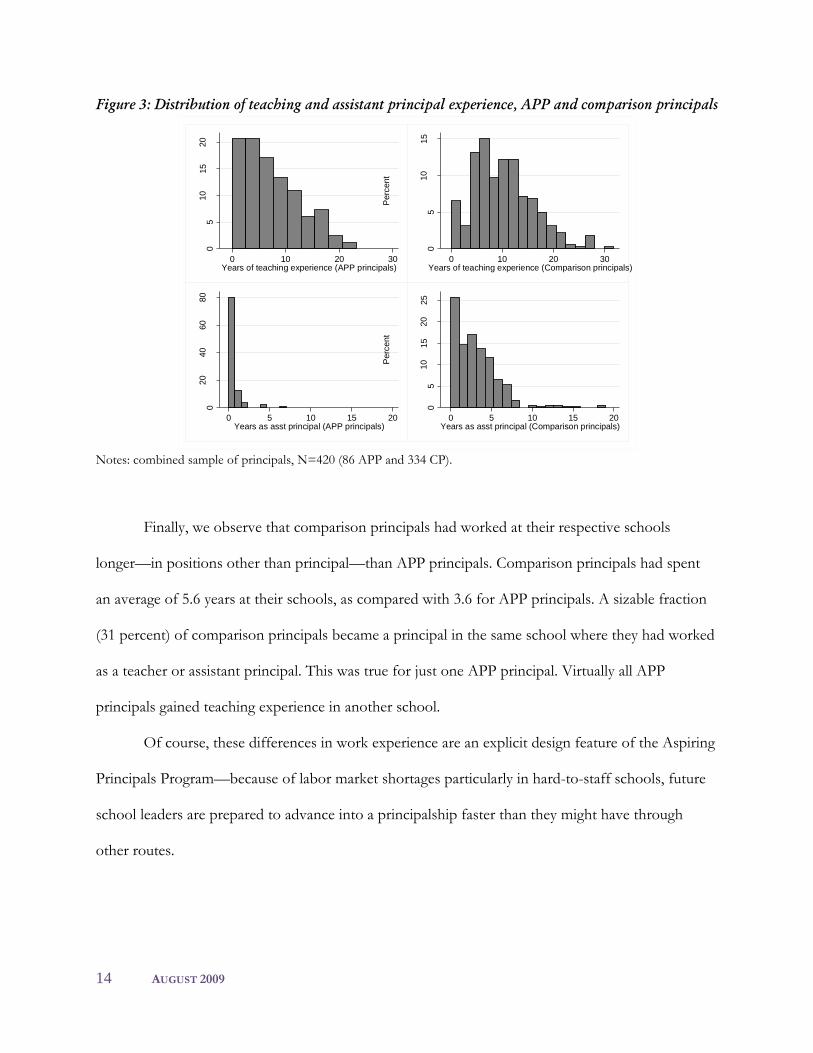
Both groups have substantial experience in the classroom. Together, the group averaged 9.7
years of teaching experience. However, APP principals on average had three fewer years of teaching
experience than comparison principals, at 7.3 versus 10.3 years (a statistically significant difference).
A sharper difference between APP and comparison principals is evident in their experience as
assistant principals. Seventy-eight percent of APP principals had no prior experience as an assistant
principal, while most comparison principals (82 percent) had some experience in this position.
Comparison principals averaged 3.2 years as assistant principal, and 23 percent had worked five or
more years as assistant principals (see Figure 3). Because we selected principals for the study based
on their tenure as principal, the APP and comparison samples are balanced with respect to this
variable, averaging 3.6 years.
14 AUGUST 2009
Figure 3: Distribution of teaching and assistant principal experience, APP and comparison principals
05
10
15
20
Perc
ent
0 10 20 30Years of teaching experience (APP principals)
05
10
15
Perc
ent
0 10 20 30Years of teaching experience (Comparison principals)
020
40
60
80
Perc
ent
0 5 10 15 20Years as asst principal (APP principals)
05
10
15
20
25
Perc
ent
0 5 10 15 20Years as asst principal (Comparison principals)
Notes: combined sample of principals, N=420 (86 APP and 334 CP).
Finally, we observe that comparison principals had worked at their respective schools
longer—in positions other than principal—than APP principals. Comparison principals had spent
an average of 5.6 years at their schools, as compared with 3.6 for APP principals. A sizable fraction
(31 percent) of comparison principals became a principal in the same school where they had worked
as a teacher or assistant principal. This was true for just one APP principal. Virtually all APP
principals gained teaching experience in another school.
Of course, these differences in work experience are an explicit design feature of the Aspiring
Principals Program—because of labor market shortages particularly in hard-to-staff schools, future
school leaders are prepared to advance into a principalship faster than they might have through
other routes.
THE NEW YORK CITY ASPIRING PRINCIPALS PROGRAM 15
IV. School Characteristics: Elementary and Middle Schools Led by APP and Comparison Principals
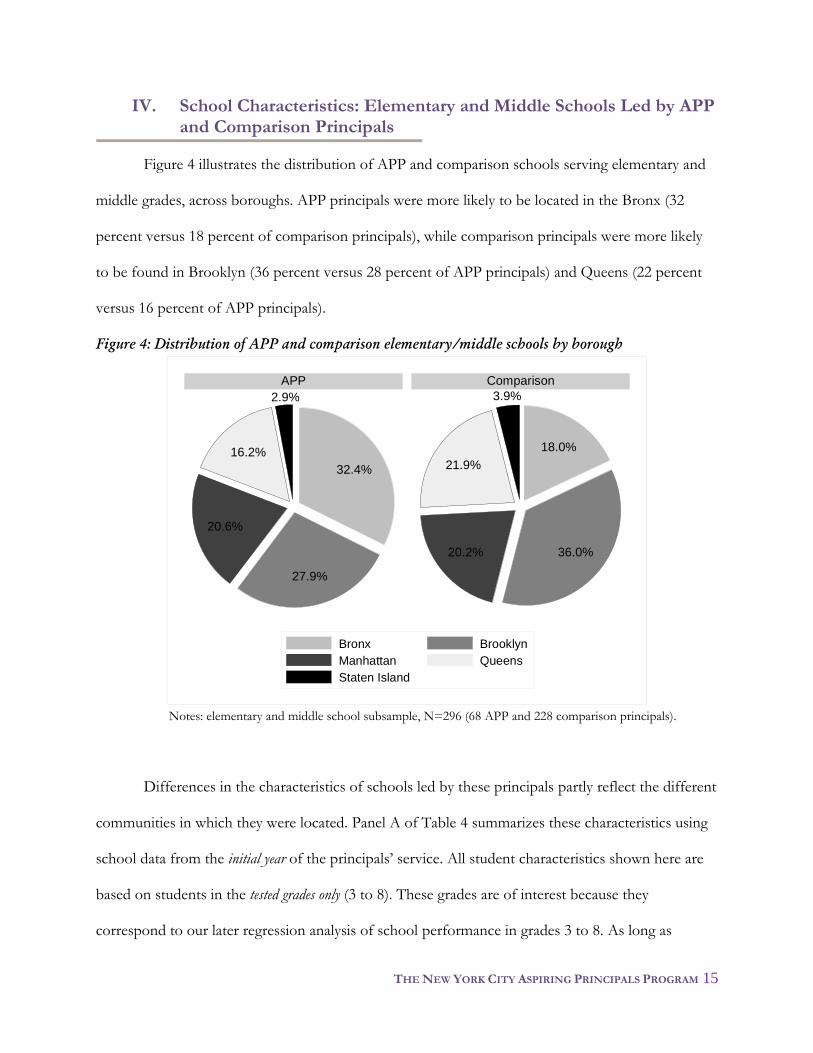
Figure 4 illustrates the distribution of APP and comparison schools serving elementary and
middle grades, across boroughs. APP principals were more likely to be located in the Bronx (32
percent versus 18 percent of comparison principals), while comparison principals were more likely
to be found in Brooklyn (36 percent versus 28 percent of APP principals) and Queens (22 percent
versus 16 percent of APP principals).
Figure 4: Distribution of APP and comparison elementary/middle schools by borough
32.4%
27.9%
20.6%
16.2%
2.9%
18.0%
36.0%20.2%
21.9%
3.9%
APP Comparison
Bronx Brooklyn
Manhattan Queens
Staten Island
Notes: elementary and middle school subsample, N=296 (68 APP and 228 comparison principals).
Differences in the characteristics of schools led by these principals partly reflect the different
communities in which they were located. Panel A of Table 4 summarizes these characteristics using
school data from the initial year of the principals’ service. All student characteristics shown here are
based on students in the tested grades only (3 to 8). These grades are of interest because they
correspond to our later regression analysis of school performance in grades 3 to 8. As long as
16 AUGUST 2009
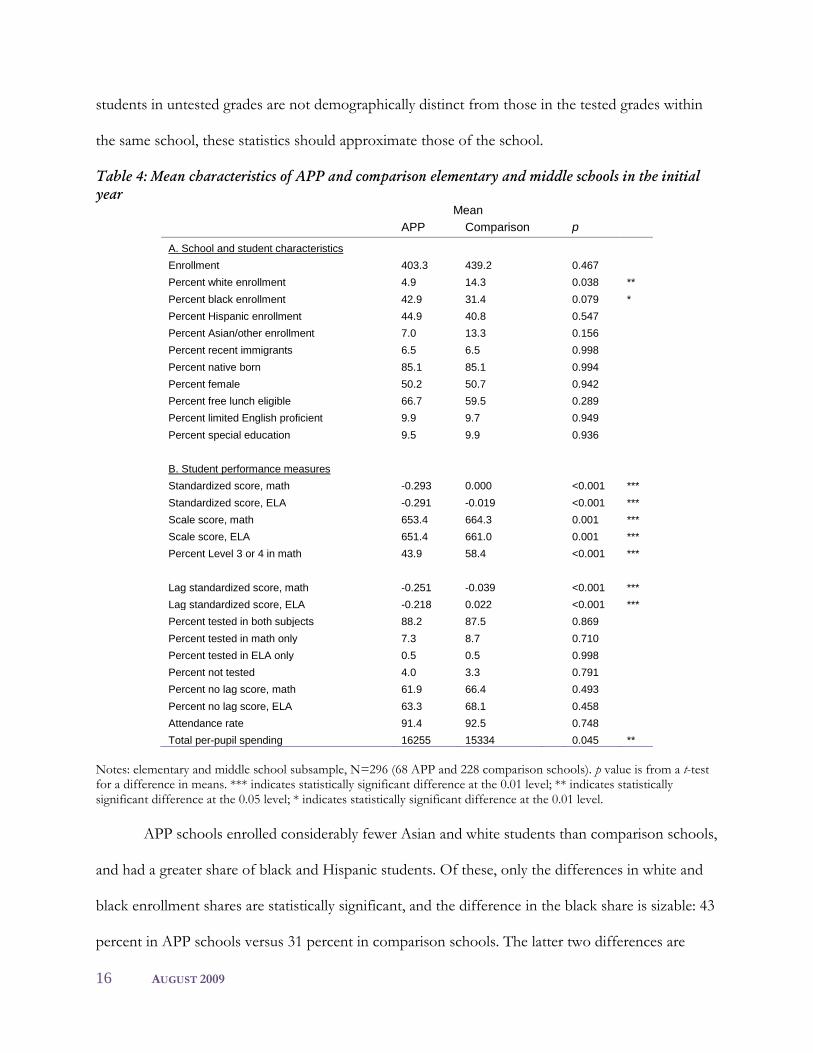
students in untested grades are not demographically distinct from those in the tested grades within
the same school, these statistics should approximate those of the school.
Table 4: Mean characteristics of APP and comparison elementary and middle schools in the initial
year
Mean
APP Comparison p
A. School and student characteristics
Enrollment 403.3 439.2 0.467
Percent white enrollment 4.9 14.3 0.038 **
Percent black enrollment 42.9 31.4 0.079 *
Percent Hispanic enrollment 44.9 40.8 0.547
Percent Asian/other enrollment 7.0 13.3 0.156
Percent recent immigrants 6.5 6.5 0.998
Percent native born 85.1 85.1 0.994
Percent female 50.2 50.7 0.942
Percent free lunch eligible 66.7 59.5 0.289
Percent limited English proficient 9.9 9.7 0.949
Percent special education 9.5 9.9 0.936
B. Student performance measures
Standardized score, math -0.293 0.000 <0.001 ***
Standardized score, ELA -0.291 -0.019 <0.001 ***
Scale score, math 653.4 664.3 0.001 ***
Scale score, ELA 651.4 661.0 0.001 ***
Percent Level 3 or 4 in math 43.9 58.4 <0.001 ***
Lag standardized score, math -0.251 -0.039 <0.001 ***
Lag standardized score, ELA -0.218 0.022 <0.001 ***
Percent tested in both subjects 88.2 87.5 0.869
Percent tested in math only 7.3 8.7 0.710
Percent tested in ELA only 0.5 0.5 0.998
Percent not tested 4.0 3.3 0.791
Percent no lag score, math 61.9 66.4 0.493
Percent no lag score, ELA 63.3 68.1 0.458
Attendance rate 91.4 92.5 0.748
Total per-pupil spending 16255 15334 0.045 **
Notes: elementary and middle school subsample, N=296 (68 APP and 228 comparison schools). p value is from a t-test for a difference in means. *** indicates statistically significant difference at the 0.01 level; ** indicates statistically significant difference at the 0.05 level; * indicates statistically significant difference at the 0.01 level.
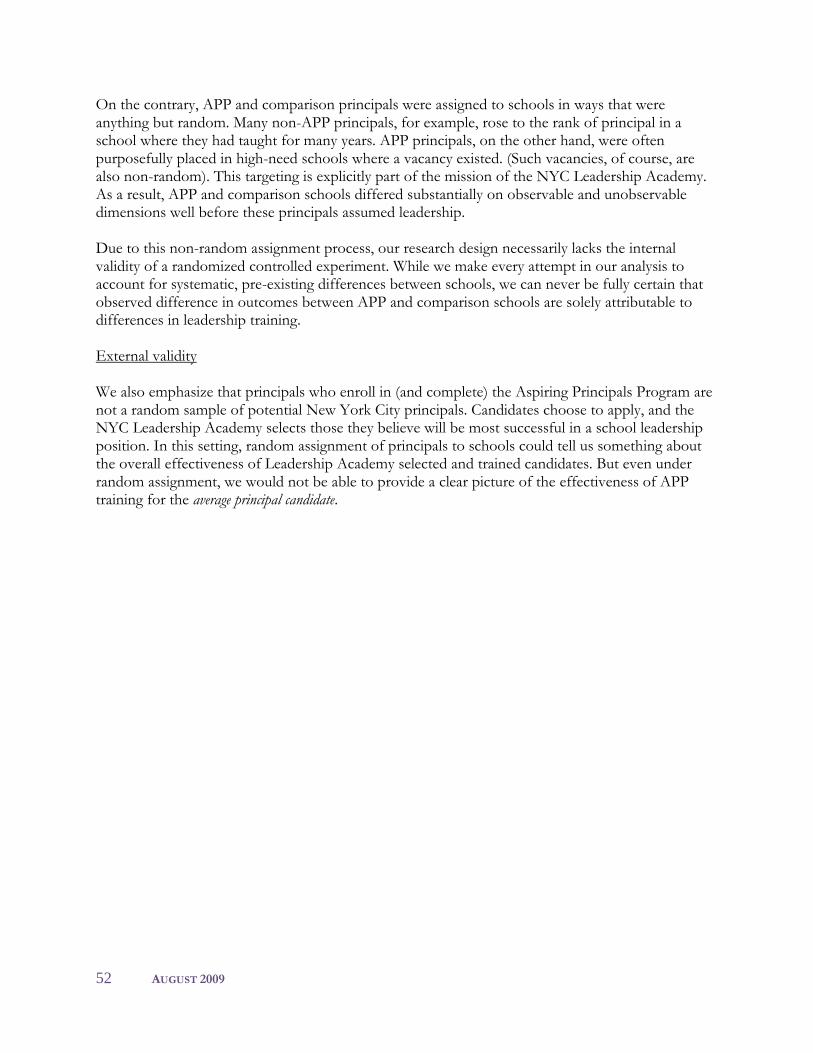
APP schools enrolled considerably fewer Asian and white students than comparison schools,
and had a greater share of black and Hispanic students. Of these, only the differences in white and
black enrollment shares are statistically significant, and the difference in the black share is sizable: 43
percent in APP schools versus 31 percent in comparison schools. The latter two differences are
THE NEW YORK CITY ASPIRING PRINCIPALS PROGRAM 17
statistically significant. Likewise, a greater share of students at APP schools was eligible to receive
free lunch (67 percent versus 60 percent in comparison schools), though this difference is not
statistically significant. Few differences were observed in the percent female, recent immigrant,
native born, limited English proficient, and full-time special education.14 Virtually the same fraction
of students was tested in mathematics and/or ELA in the two types of schools, indicating little
difference in test exemptions, on average. Average per-student spending was also similar.
Attendance rates were comparable (91.4 percent in APP schools, versus 92.5 percent in comparison
schools). Appendix Figure 1 provides the complete distribution of percent black, Hispanic, and
eligible for free lunch within each school group in the initial year.
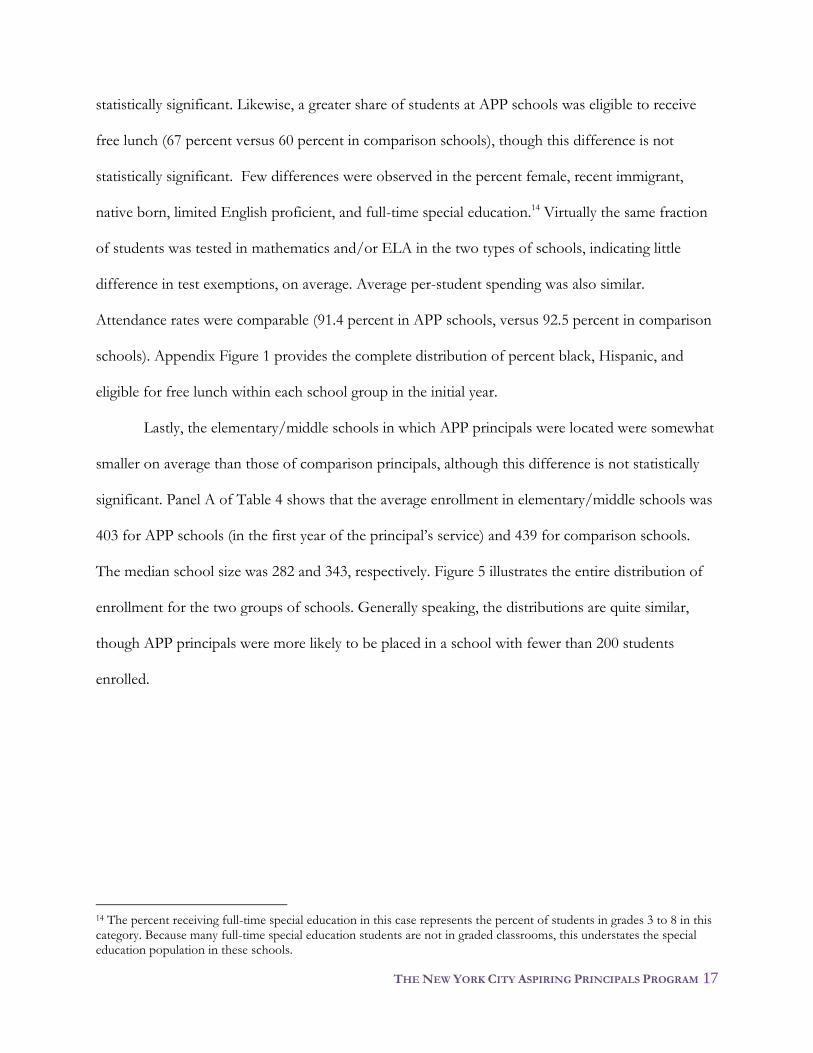
Lastly, the elementary/middle schools in which APP principals were located were somewhat
smaller on average than those of comparison principals, although this difference is not statistically
significant. Panel A of Table 4 shows that the average enrollment in elementary/middle schools was
403 for APP schools (in the first year of the principal’s service) and 439 for comparison schools.
The median school size was 282 and 343, respectively. Figure 5 illustrates the entire distribution of
enrollment for the two groups of schools. Generally speaking, the distributions are quite similar,
though APP principals were more likely to be placed in a school with fewer than 200 students
enrolled.
14 The percent receiving full-time special education in this case represents the percent of students in grades 3 to 8 in this category. Because many full-time special education students are not in graded classrooms, this understates the special education population in these schools.
18 AUGUST 2009
Figure 5: Initial year distribution of school size, APP and comparison schools serving
elementary/middle grades
010
20
30
40
Perc
ent
0 500 1000 1500School size (APP)
010
20
30
40
Perc
ent
0 500 1000 1500 2000School size (Comparison)
Notes: elementary/middle school subsample, N=296 (68 APP and 228 comparison principals, in their first year as principal (2005 or 2006)).
V. School Characteristics: High Schools Led by APP and Comparison Principals
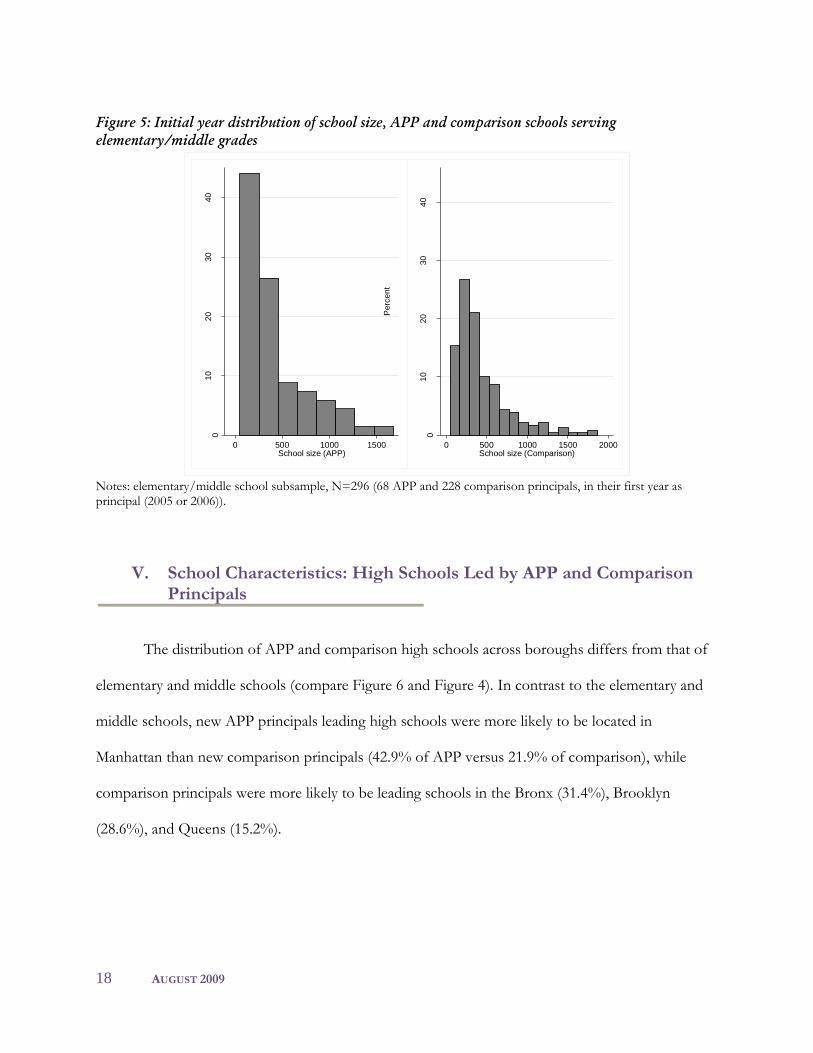
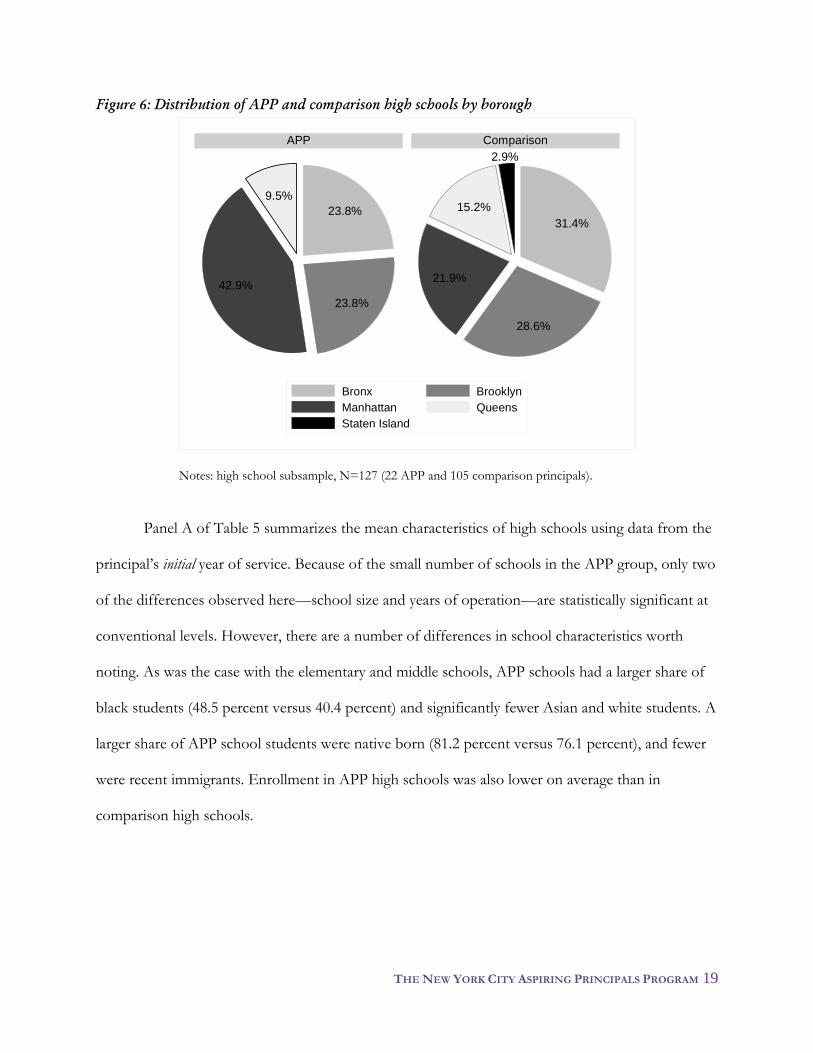
The distribution of APP and comparison high schools across boroughs differs from that of
elementary and middle schools (compare Figure 6 and Figure 4). In contrast to the elementary and
middle schools, new APP principals leading high schools were more likely to be located in
Manhattan than new comparison principals (42.9% of APP versus 21.9% of comparison), while
comparison principals were more likely to be leading schools in the Bronx (31.4%), Brooklyn
(28.6%), and Queens (15.2%).
THE NEW YORK CITY ASPIRING PRINCIPALS PROGRAM 19
Figure 6: Distribution of APP and comparison high schools by borough
23.8%
23.8%
42.9%
9.5%
31.4%
28.6%
21.9%
15.2%
2.9%
APP Comparison
Bronx Brooklyn
Manhattan Queens
Staten Island
Notes: high school subsample, N=127 (22 APP and 105 comparison principals).
Panel A of Table 5 summarizes the mean characteristics of high schools using data from the
principal’s initial year of service. Because of the small number of schools in the APP group, only two
of the differences observed here—school size and years of operation—are statistically significant at
conventional levels. However, there are a number of differences in school characteristics worth
noting. As was the case with the elementary and middle schools, APP schools had a larger share of
black students (48.5 percent versus 40.4 percent) and significantly fewer Asian and white students. A
larger share of APP school students were native born (81.2 percent versus 76.1 percent), and fewer
were recent immigrants. Enrollment in APP high schools was also lower on average than in
comparison high schools.
20 AUGUST 2009
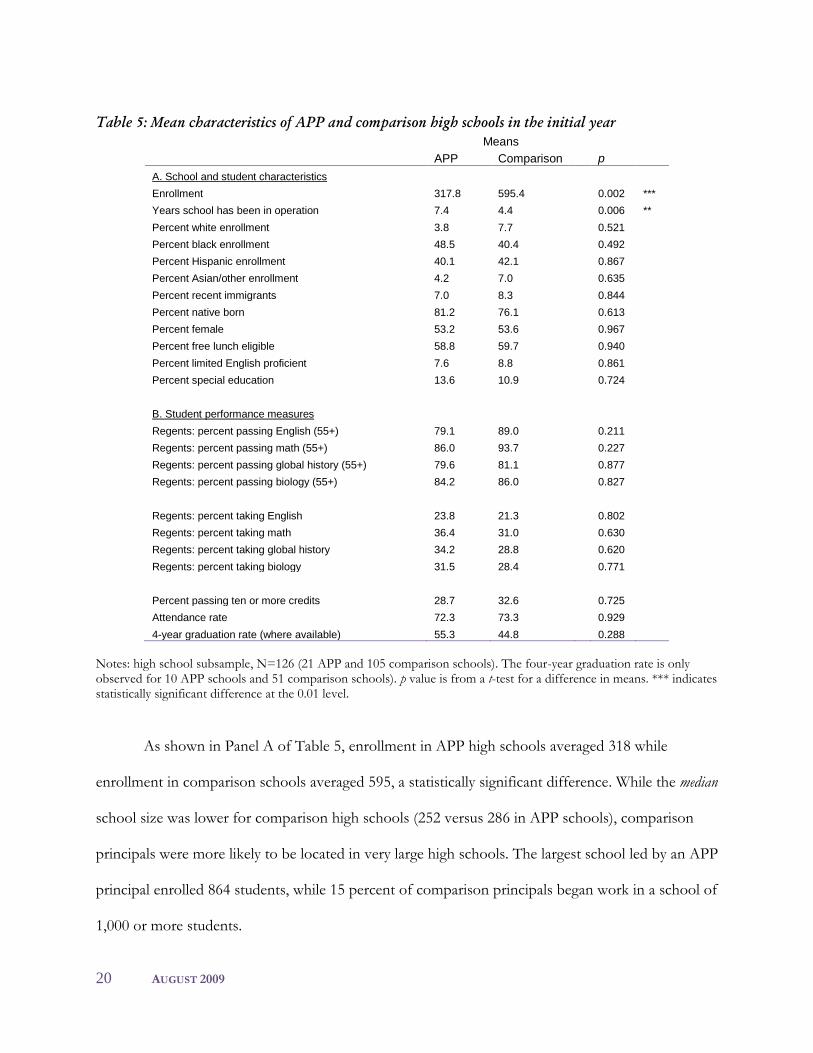
Table 5: Mean characteristics of APP and comparison high schools in the initial year
Means
APP Comparison p
A. School and student characteristics
Enrollment 317.8 595.4 0.002 ***
Years school has been in operation 7.4 4.4 0.006 **
Percent white enrollment 3.8 7.7 0.521
Percent black enrollment 48.5 40.4 0.492
Percent Hispanic enrollment 40.1 42.1 0.867
Percent Asian/other enrollment 4.2 7.0 0.635
Percent recent immigrants 7.0 8.3 0.844
Percent native born 81.2 76.1 0.613
Percent female 53.2 53.6 0.967
Percent free lunch eligible 58.8 59.7 0.940
Percent limited English proficient 7.6 8.8 0.861
Percent special education 13.6 10.9 0.724
B. Student performance measures
Regents: percent passing English (55+) 79.1 89.0 0.211
Regents: percent passing math (55+) 86.0 93.7 0.227
Regents: percent passing global history (55+) 79.6 81.1 0.877
Notes: high school subsample, N=126 (21 APP and 105 comparison schools). The four-year graduation rate is only observed for 10 APP schools and 51 comparison schools). p value is from a t-test for a difference in means. *** indicates statistically significant difference at the 0.01 level.
As shown in Panel A of Table 5, enrollment in APP high schools averaged 318 while
enrollment in comparison schools averaged 595, a statistically significant difference. While the median
school size was lower for comparison high schools (252 versus 286 in APP schools), comparison
principals were more likely to be located in very large high schools. The largest school led by an APP
principal enrolled 864 students, while 15 percent of comparison principals began work in a school of
1,000 or more students.
THE NEW YORK CITY ASPIRING PRINCIPALS PROGRAM 21
Our sample of high schools included a large number of new schools. Panel A of Table 5
indicates that APP principals led an older set of schools, on average, than comparison schools. This
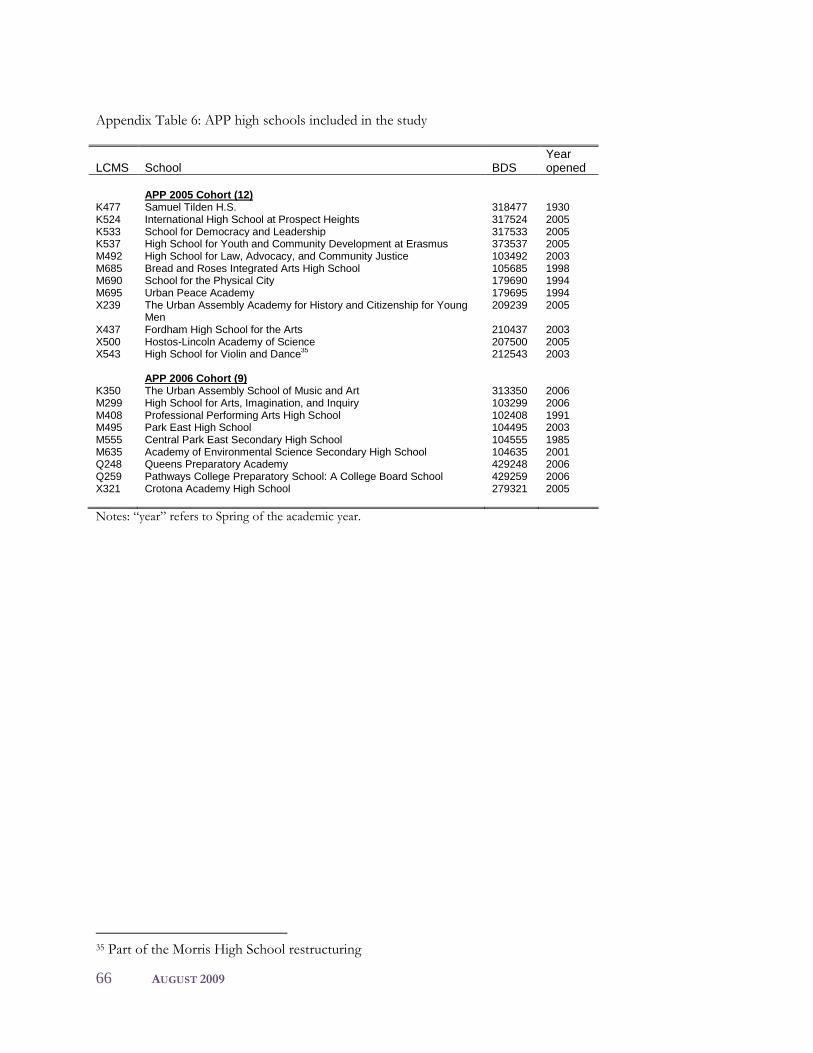
difference, however, is attributable mainly to the small sample of schools. Of the 21 APP principals,
9 (or 43 percent) were leading new schools (a list of all APP high schools is provided in Appendix
Table 6). A similar proportion of comparison principals (47 percent) had taken the helm of new
schools. Because a greater share of APP principals led older schools, the APP average appears to be
much higher than the comparison group. Again, due to the large number of new schools we are very
limited in the kinds of ―pre‖ and ―post‖ comparisons that can be made for high schools.
VI. Average Achievement in APP and Comparison Schools
Measures and definitions
For elementary and middle schools, our primary student outcome measures are average test
scores on the New York State exams in English Language Arts (ELA) and mathematics,
administered in 3rd through 8th grade. At the high school level, our key school performance measures
are passing rates on the Regents exams (Comprehensive English, Mathematics ―A,‖ Global History,
and Biology), four-year cohort graduation rates, and annual rates of credit accumulation. 15
Test performance on the ELA and mathematics tests can be expressed in three ways: scale
scores, performance levels, and standardized scores. A student’s scale score is a re-scaled version of
his/her number of correct test answers. This scale score ranges from (roughly) 470 to 800, and is
intended to be comparable across grades.16 A school’s average scale score in a given subject is simply the
average of its students’ scale scores on that subject’s test.
15 Four- year graduation rates are taken from the Annual School Report Cards. 16 The New York State tests are not ―vertically scaled.‖ That is, the scale scores from these tests cannot be used to measure student progress from grade to grade on a continuum of learned skills. Rather, student progress can only be measured relative to proficiency in meeting the state standards. It is for this reason that New York does not provide averages of scale scores across grades. For more information, see the New York City Department of Education’s guide
22 AUGUST 2009
Performance levels are discrete ranges of scale scores determined by state educational standards:
(Meeting Learning Standards) and Level 4 (Meeting Learning Standards with Distinction). Students
scoring at Level 3 or Level 4 on a given subject exam are considered to be ―proficient‖ in that
subject, or meeting state standards. A school’s proficiency rate in a given subject is the percent of
students reaching Level 3 or 4 in that subject.
Finally, a standardized score (also known as a ―z‖-score) indicates where a student’s scale score
falls in the distribution of test scores. This score is calculated as the difference between a student’s
scale score and the city average score, divided by the overall standard deviation in test scores.17 (This
calculation is done with respect to the student’s own grade). Its interpretation is straightforward: a
student’s standardized score tells us how far he/she scored from the city average test-taker in
his/her grade, in standard deviation units. A standardized score of 1.5 indicates a student scored 1.5
standard deviations above average. Similarly, a standardized score of -0.3 indicates a student who
scored 0.3 standard deviations below average.18 A score at grade level average has a standardized
score of zero. At the school level, the average standardized score in a given subject is simply the average
of its students’ standardized scores on that test.
Each of these three measures has advantages and shortcomings. Scale scores are an
―absolute‖ measure of performance, but the citywide (and statewide) average fluctuates from year to
year and is sensitive to test inflation or changes in test design. Cross-grade comparisons of scale
scores may be problematic in practice, even if they are intended to be comparable. These problems
to the state tests here: http://schools.nyc.gov/Accountability/YearlyTesting/TestInformation/Tests/default.htm and the New York State Department of Education documentation here: http://www.emsc.nysed.gov/irts/ela-math/. For a readable explanation of these concepts used in this section, see Koretz (2008). 17 The standard deviation is a measure of dispersion, or variation, in scores. Loosely, it can be thought of as how far away from the mean the average student scored. If all students receive the same score, the standard deviation is zero. 18 When test scores are distributed normally, roughly 68 percent of students fall between 1 standard deviation below and 1 standard deviation above the mean. Similarly, roughly 95 percent fall between 2 standard deviations below and 2 standard deviations above the mean.
may stem from the lack of vertical scaling, or shifts over time in the grade composition of schools.19
Proficiency rates are easy to understand ―absolute‖ measures of performance, and are the most
commonly cited student achievement measure as the centerpiece of No Child Left Behind. They are
also a critical component of the New York City School Progress Reports. On the other hand, they
mask a great deal of information and frequently provide misleading comparisons of school
performance.20
While less transparent to the average reader, standardized scores address most of the
shortcomings cited above. Their use is standard practice in educational research and evaluation,
given their comparability across tests, across grades, and over time. We report mean scale scores and
average proficiency rates for APP and comparison schools only in this section, and we rely strictly
on standardized scores in our regression analysis in Sections VII – VIII. In addition to
contemporaneous standardized scores, we also calculate for each school their students’ average
standardized scores from the prior year.21 In other words, these lagged standardized scores represent
the average achievement of a school’s currently enrolled students who were tested in the prior year.
In the case of the Regents exams, we define passing as a score of 55 or higher, the minimum
for a local diploma during this period. The minimum passing score for a Regents’ diploma is 65.
Regents exam results were available for all years of our high school data series (2003-04 to 2007-08),
while graduation rates were only available through 2006-07.22 Because many of the high schools in
19 A comparison of average scale scores for two schools at two points in time may make sense if the grade composition of these schools remains constant. But if one school increases its population of 6th graders (for example) relative to the other, and 6th grade scale scores are typically lower than other grades, then the former school will be ―penalized‖ for its growth in its 6th grade population. 20 To illustrate, suppose two schools make equal improvements in their students’ scale scores. Assume the first school’s students were originally just below the Level 3 cut score and the second’s were much further below the cut score. Even if the two schools make identical progress, the first school’s proficiency rate is likely to rise much more than the second. This example can be extended to include a third school where many students are already above the Level 3 threshold, but still make the same progress in scale scores as the other two schools. In this case, the first school will appear to have significantly greater ―gains,‖ as measured by proficiency rates, than both the second and third school. 21 Only students with scores observed in the prior year can be used in this calculation. Because 3rd grade is the first year of testing, none of the students in this grade have lagged scale scores. 22 Four-year cohort graduation rates for 2007-08 were not available as of this writing.
24 AUGUST 2009
our analysis were new in 2005 or 2006, many do not yet have four-year cohort graduation rates
available. We do have a benchmark measure of credit accumulation, which indicates the percent of
students in grades 9 – 12 who passed ten or more credits in a given academic year.
The only other measure at both the elementary/middle and high school levels that might be
considered an outcome is the average rate of student attendance. There tends to be little variation in
attendance at the elementary/middle school levels (most of the elementary and middle schools in
our study have attendance rates of 90 percent or higher). However, we do observe more variation at
the high school level, where half of our school observations have attendance rates that fall between
59 percent and 78 percent (with a mean of 62 percent). We do not use attendance rates as an
outcome measure in this report, but plan to do so in future research.
Initial year achievement in APP and comparison schools
A comparison of average mathematics and ELA achievement in APP and comparison
schools reveals stark differences in APP and comparison schools before the arrival of their new
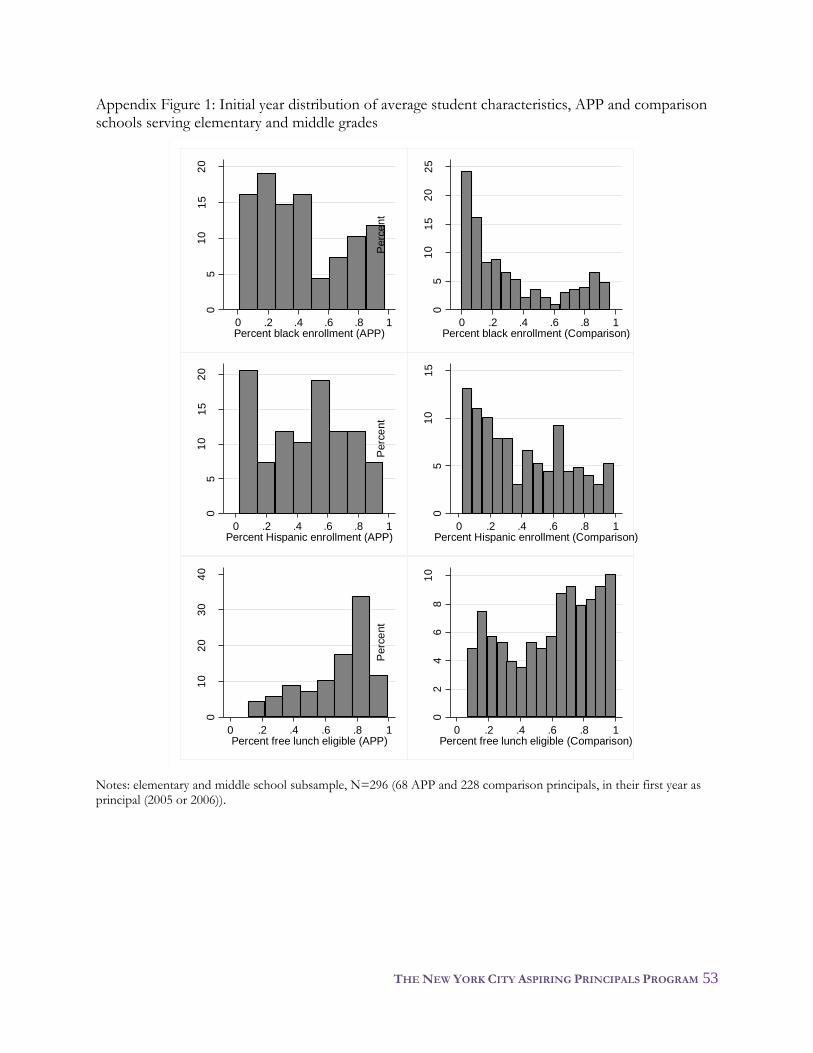
principals.23 As shown in Panel B of Table 4, which presents the average achievement in APP and
comparison schools in the principal’s initial year of service, students at APP schools performed
substantially lower on the state ELA and mathematics tests, with students scoring an average of 0.29
standard deviations below their grade-level mean.24 Students at comparison schools scored mostly at
grade-level mean, on average. Appendix Figure 2 illustrates the complete distribution of school-level
average standardized scores, by group, in the principals’ initial year.
23 As we noted in Section II, we refer to schools eventually lead by an APP principal as ―APP schools.‖ ―Comparison schools‖ are schools eventually lead by a comparison group principal. 24 We use the principal’s initial year of service to describe the conditions of the school in the year the principal took the helm of that school. It is possible, of course, that a principal can have an immediate impact on their school in his or her first year. Many of the principals in our sample, however, took the leadership of a school in the middle of the academic year. For this reason, we assume here that the initial year impact is relatively modest. In our regression analysis we are able to relax this assumption and examine changes in the principal’s first year.
THE NEW YORK CITY ASPIRING PRINCIPALS PROGRAM 25
When comparing average lagged performance of students in ELA and mathematics—that is,
the average performance of students enrolled in APP and comparison schools in the prior year—we
observe an identical pattern (Panel B of Table 4). Students attending APP schools on average scored
0.25 standard deviations below their grade level average in mathematics and ELA in the prior year.
Students in comparison schools scored 0.02 to 0.04 of a standard deviation below their grade level
average in the prior year.
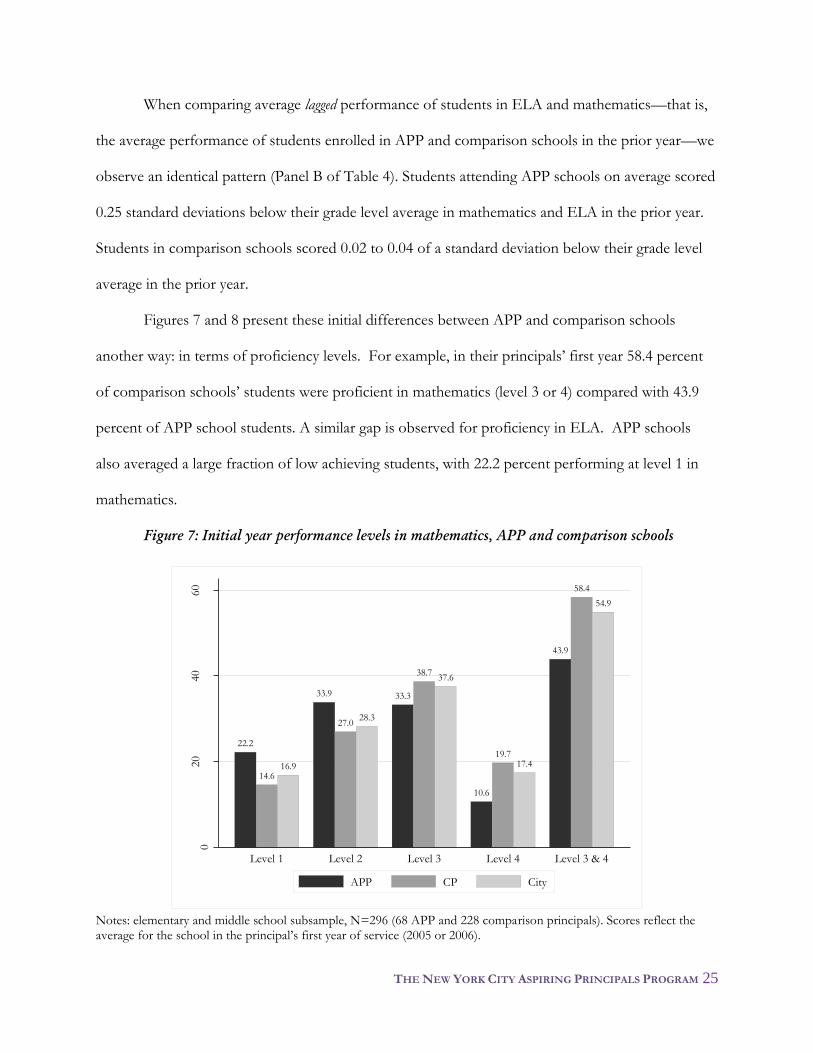
Figures 7 and 8 present these initial differences between APP and comparison schools
another way: in terms of proficiency levels. For example, in their principals’ first year 58.4 percent
of comparison schools’ students were proficient in mathematics (level 3 or 4) compared with 43.9
percent of APP school students. A similar gap is observed for proficiency in ELA. APP schools
also averaged a large fraction of low achieving students, with 22.2 percent performing at level 1 in
mathematics.
Figure 7: Initial year performance levels in mathematics, APP and comparison schools
22.2
14.616.9
33.9
27.028.3
33.3
38.737.6
10.6
19.717.4
43.9
58.4
54.9
020
40
60
Per
cen
t
Level 1 Level 2 Level 3 Level 4 Level 3 & 4
APP CP City
Notes: elementary and middle school subsample, N=296 (68 APP and 228 comparison principals). Scores reflect the average for the school in the principal’s first year of service (2005 or 2006).
26 AUGUST 2009
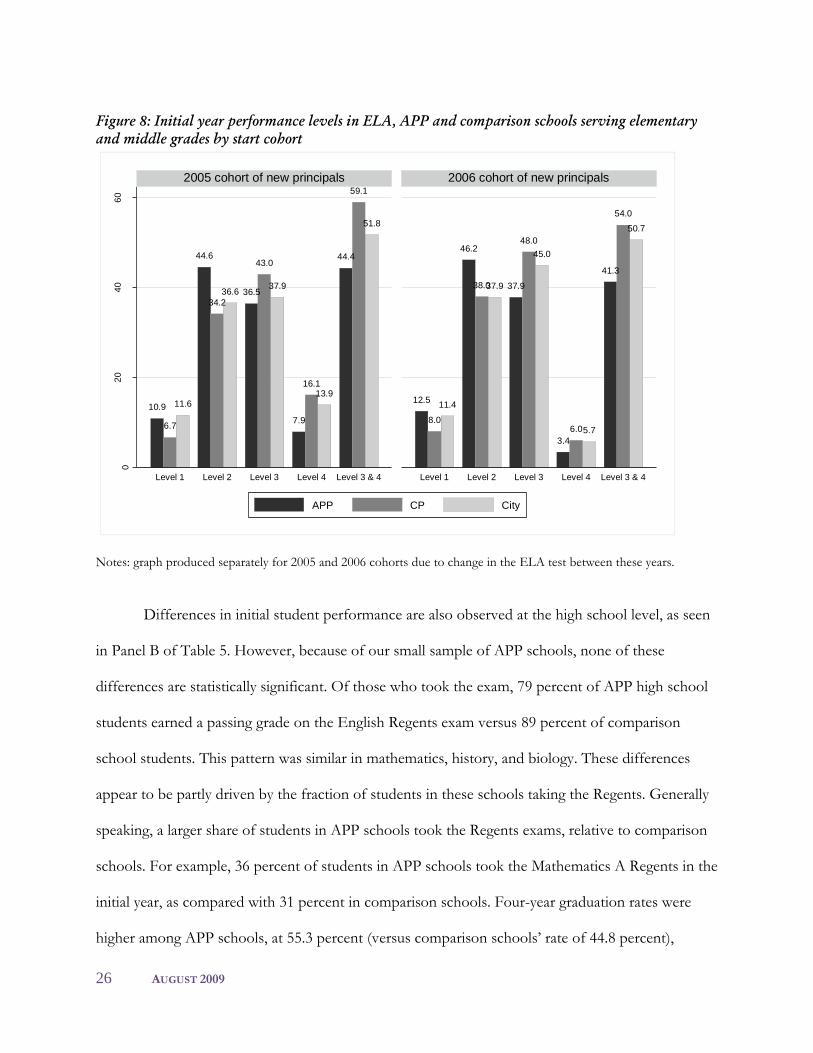
Figure 8: Initial year performance levels in ELA, APP and comparison schools serving elementary
2005 cohort of new principals 2006 cohort of new principals
APP CP City
Notes: graph produced separately for 2005 and 2006 cohorts due to change in the ELA test between these years.
Differences in initial student performance are also observed at the high school level, as seen
in Panel B of Table 5. However, because of our small sample of APP schools, none of these
differences are statistically significant. Of those who took the exam, 79 percent of APP high school
students earned a passing grade on the English Regents exam versus 89 percent of comparison
school students. This pattern was similar in mathematics, history, and biology. These differences
appear to be partly driven by the fraction of students in these schools taking the Regents. Generally
speaking, a larger share of students in APP schools took the Regents exams, relative to comparison
schools. For example, 36 percent of students in APP schools took the Mathematics A Regents in the
initial year, as compared with 31 percent in comparison schools. Four-year graduation rates were
higher among APP schools, at 55.3 percent (versus comparison schools’ rate of 44.8 percent),
THE NEW YORK CITY ASPIRING PRINCIPALS PROGRAM 27
though this difference is not statistically significant. Finally, the fraction of high school students
earning 10 or more credits in the principal’s initial year was lower among APP schools (28.7 percent)
than comparison schools (32.6 percent).
As emphasized above, all comparisons of high school achievement in this report should be
made with caution because of the small sample of APP high schools. This is particularly problematic
for the graduation rates, given only 10 APP and 51 comparison high schools had graduation data
available.
Achievement trends in APP and comparison schools
All comparisons of student achievement made thus far reflect a single point in time—the
principal’s initial year of service. An alternative view of student performance is provided in Figures 9
- 12, which show average achievement in APP and comparison schools over time. These figures
track average achievement in these schools both before and after the arrival of their new principal. It is
important to emphasize that these figures represent simple averages that do not take into account
differences in student characteristics or prior achievement. Our regression analyses in Sections VII
and VIII do make such adjustments. Furthermore, in the cases where we use standardized scores,
we re-emphasize that these measures represent relative achievement—that is, the average student’s
test performance relative to the citywide grade-level average in a given year.
Figure 9 shows that average scale scores in APP and comparison schools were generally on
an upward trend during this six-year period, as was the case citywide. The initial differences in APP
and comparison schools are also evident here; in the years preceding the installation of a new
principal, APP schools’ average scale scores were significantly below those of comparison schools.
This difference was especially true for the 2005 cohort, in both subjects, and for the 2006 cohort in
28 AUGUST 2009
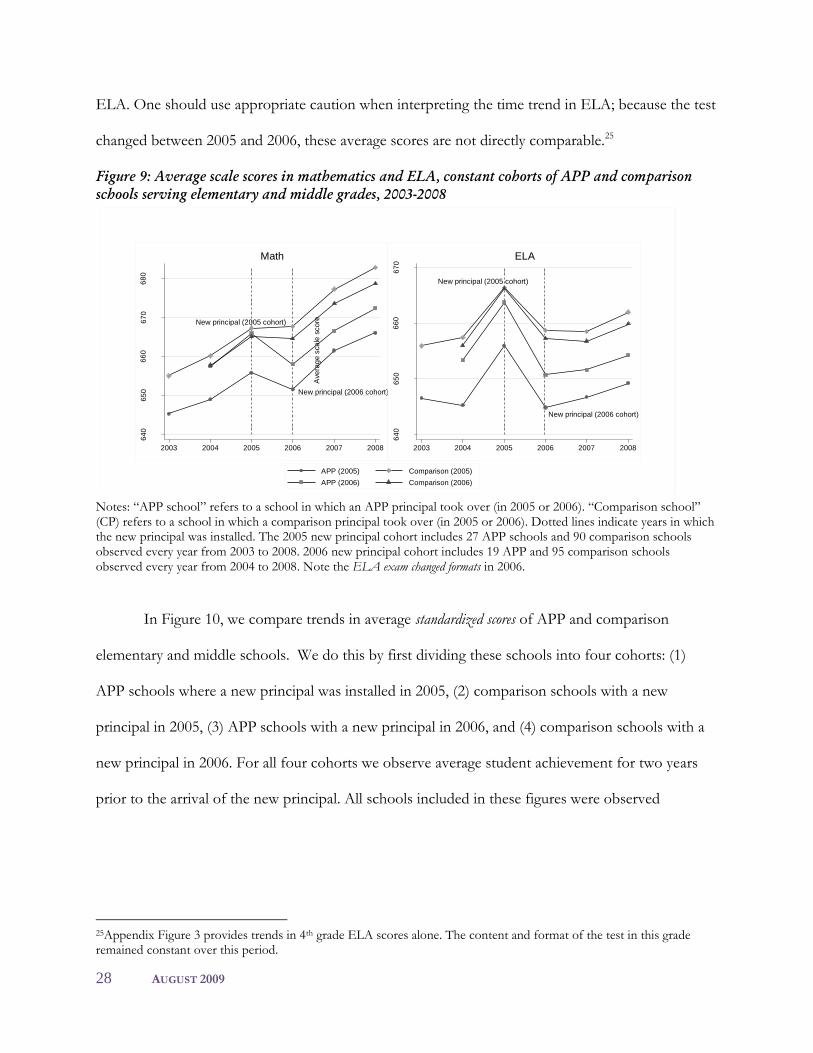
ELA. One should use appropriate caution when interpreting the time trend in ELA; because the test
changed between 2005 and 2006, these average scores are not directly comparable.25
Figure 9: Average scale scores in mathematics and ELA, constant cohorts of APP and comparison
schools serving elementary and middle grades, 2003-2008
New principal (2005 cohort)
New principal (2006 cohort)
64
06
50
66
06
70
68
0
Ave
rag
e s
ca
le s
co
re
2003 2004 2005 2006 2007 2008
Math
New principal (2005 cohort)
New principal (2006 cohort)
64
06
50
66
06
70
Ave
rag
e s
ca
le s
co
re
2003 2004 2005 2006 2007 2008
APP (2005) Comparison (2005)
APP (2006) Comparison (2006)
ELA
Notes: ―APP school‖ refers to a school in which an APP principal took over (in 2005 or 2006). ―Comparison school‖ (CP) refers to a school in which a comparison principal took over (in 2005 or 2006). Dotted lines indicate years in which the new principal was installed. The 2005 new principal cohort includes 27 APP schools and 90 comparison schools observed every year from 2003 to 2008. 2006 new principal cohort includes 19 APP and 95 comparison schools observed every year from 2004 to 2008. Note the ELA exam changed formats in 2006.
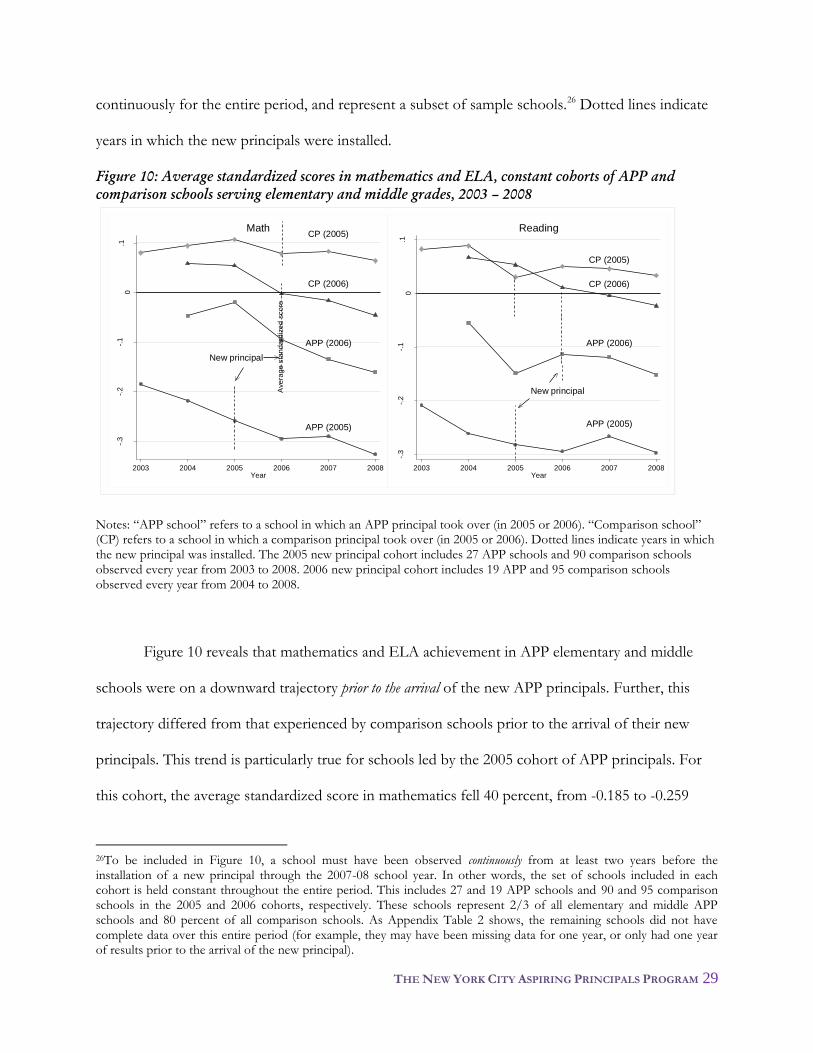
In Figure 10, we compare trends in average standardized scores of APP and comparison
elementary and middle schools. We do this by first dividing these schools into four cohorts: (1)
APP schools where a new principal was installed in 2005, (2) comparison schools with a new
principal in 2005, (3) APP schools with a new principal in 2006, and (4) comparison schools with a
new principal in 2006. For all four cohorts we observe average student achievement for two years
prior to the arrival of the new principal. All schools included in these figures were observed
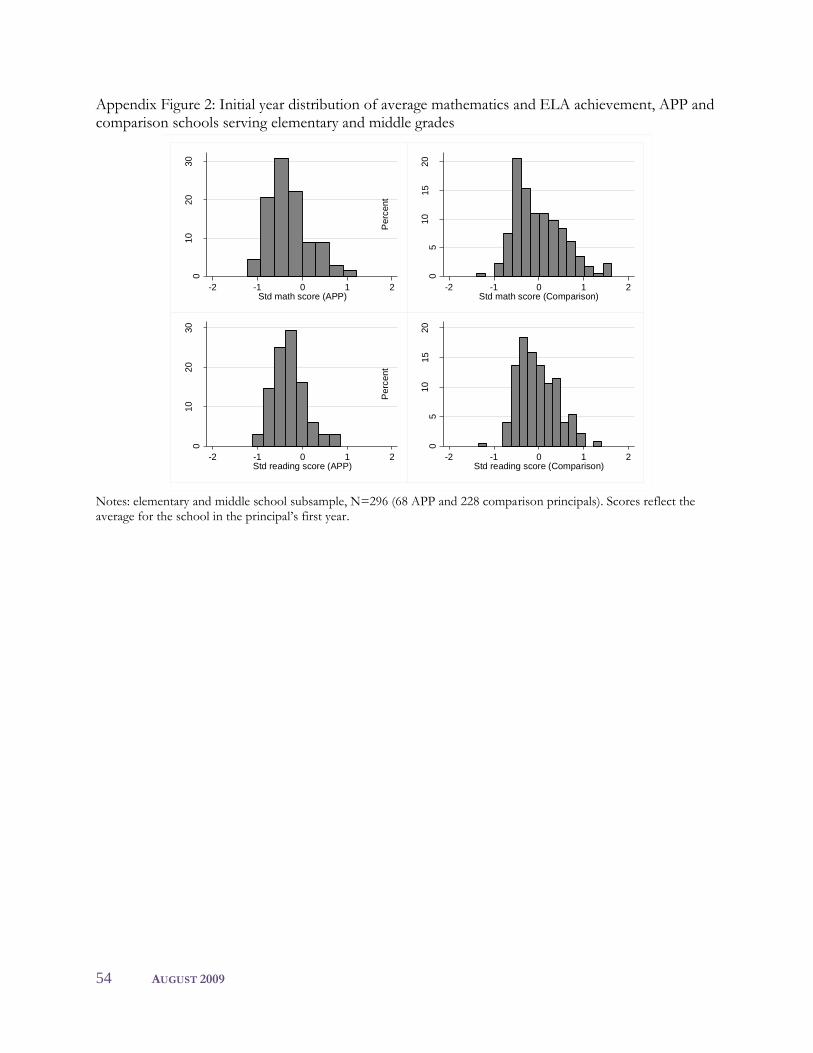
25Appendix Figure 3 provides trends in 4th grade ELA scores alone. The content and format of the test in this grade remained constant over this period.
THE NEW YORK CITY ASPIRING PRINCIPALS PROGRAM 29
continuously for the entire period, and represent a subset of sample schools.26 Dotted lines indicate
years in which the new principals were installed.
Figure 10: Average standardized scores in mathematics and ELA, constant cohorts of APP and
comparison schools serving elementary and middle grades, 2003 – 2008
APP (2005)
APP (2006)
CP (2006)
CP (2005)
New principal
-.3
-.2
-.1
0.1
Ave
rag
e s
tan
da
rdiz
ed
sco
re
2003 2004 2005 2006 2007 2008Year
Math
APP (2005)
APP (2006)
CP (2006)
CP (2005)
New principal-.
3-.
2-.
10
.1
Ave
rag
e s
tan
da
rdiz
ed
sco
re
2003 2004 2005 2006 2007 2008Year
Reading
Notes: ―APP school‖ refers to a school in which an APP principal took over (in 2005 or 2006). ―Comparison school‖ (CP) refers to a school in which a comparison principal took over (in 2005 or 2006). Dotted lines indicate years in which the new principal was installed. The 2005 new principal cohort includes 27 APP schools and 90 comparison schools observed every year from 2003 to 2008. 2006 new principal cohort includes 19 APP and 95 comparison schools observed every year from 2004 to 2008.
Figure 10 reveals that mathematics and ELA achievement in APP elementary and middle
schools were on a downward trajectory prior to the arrival of the new APP principals. Further, this
trajectory differed from that experienced by comparison schools prior to the arrival of their new
principals. This trend is particularly true for schools led by the 2005 cohort of APP principals. For
this cohort, the average standardized score in mathematics fell 40 percent, from -0.185 to -0.259
26To be included in Figure 10, a school must have been observed continuously from at least two years before the installation of a new principal through the 2007-08 school year. In other words, the set of schools included in each cohort is held constant throughout the entire period. This includes 27 and 19 APP schools and 90 and 95 comparison schools in the 2005 and 2006 cohorts, respectively. These schools represent 2/3 of all elementary and middle APP schools and 80 percent of all comparison schools. As Appendix Table 2 shows, the remaining schools did not have complete data over this entire period (for example, they may have been missing data for one year, or only had one year of results prior to the arrival of the new principal).
30 AUGUST 2009
between 2003 and 2005, the years leading up to and including the APP principal’s initial year.
Average standardized scores in ELA fell from -0.209 to -0.282 over the same period. By contrast, in
comparison schools average mathematics achievement rose during these same three years and fell
only slightly in ELA. In both ELA and mathematics, average achievement in the 2005 cohort of
APP schools stabilized somewhat after the arrival of the new principal, but dipped again in 2008 (in
relative terms; recall these are standardized scores).
The initial downward trend in student performance on the state exams was less strong
among the 2006 cohort of APP schools. In this case, average achievement in mathematics fell from -
0.047 to -0.096 between 2004 and 2006—the years leading up to and including the principal’s initial
year—and in ELA from -0.055 to -0.114. (Scores in mathematics increased from 2004 to 2005, but
fell again in 2006). Performance fell to a similar extent among the 2006 cohort of comparison
schools in these years, in both subjects. At least in mathematics, the relative achievement of the 2006
APP cohort continued to fall, but at a more modest rate than the years prior.
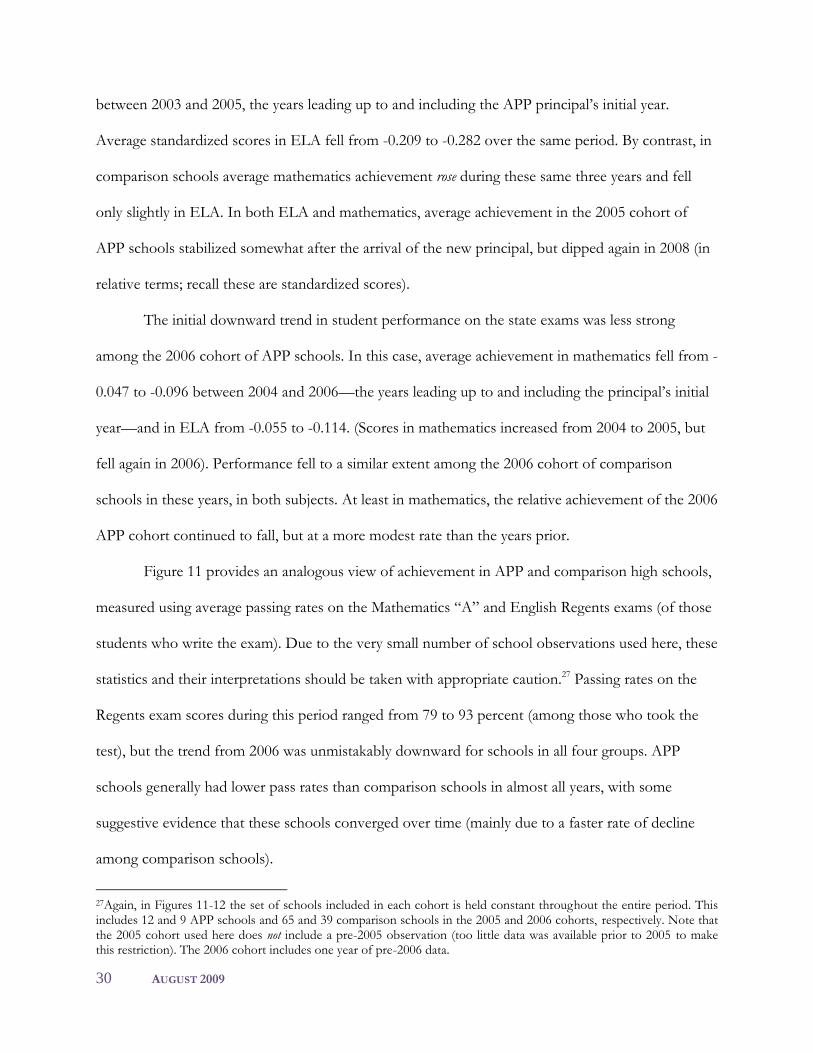
Figure 11 provides an analogous view of achievement in APP and comparison high schools,
measured using average passing rates on the Mathematics ―A‖ and English Regents exams (of those
students who write the exam). Due to the very small number of school observations used here, these
statistics and their interpretations should be taken with appropriate caution.27 Passing rates on the
Regents exam scores during this period ranged from 79 to 93 percent (among those who took the
test), but the trend from 2006 was unmistakably downward for schools in all four groups. APP
schools generally had lower pass rates than comparison schools in almost all years, with some
suggestive evidence that these schools converged over time (mainly due to a faster rate of decline
among comparison schools).
27Again, in Figures 11-12 the set of schools included in each cohort is held constant throughout the entire period. This includes 12 and 9 APP schools and 65 and 39 comparison schools in the 2005 and 2006 cohorts, respectively. Note that the 2005 cohort used here does not include a pre-2005 observation (too little data was available prior to 2005 to make this restriction). The 2006 cohort includes one year of pre-2006 data.
THE NEW YORK CITY ASPIRING PRINCIPALS PROGRAM 31
Figure 11: Average pass rates in Mathematics and English Regents exams, constant cohorts of APP
and comparison high schools, 2005 – 2008
.8.8
5.9
.95
1
Pe
rce
nt
pa
ssin
g R
eg
en
ts 5
5+
2005 2006 2007 2008Year
Math Regents
.8.8
5.9
.95
1
Pe
rce
nt
pa
ssin
g R
eg
en
ts 5
5+
2005 2006 2007 2008Year
APP (2005) Comparison (2005)
APP (2006) Comparison (2006)
English Regents
Notes: 2005 new principal cohort includes 12 APP schools and 65 comparison schools observed every year from 2005 to 2008 (note there are no “before new principal” observations in this case). 2006 new principal cohort includes 9 APP schools and 39 comparison schools observed every year from 2005 to 2008 (the first year precedes the new principal).
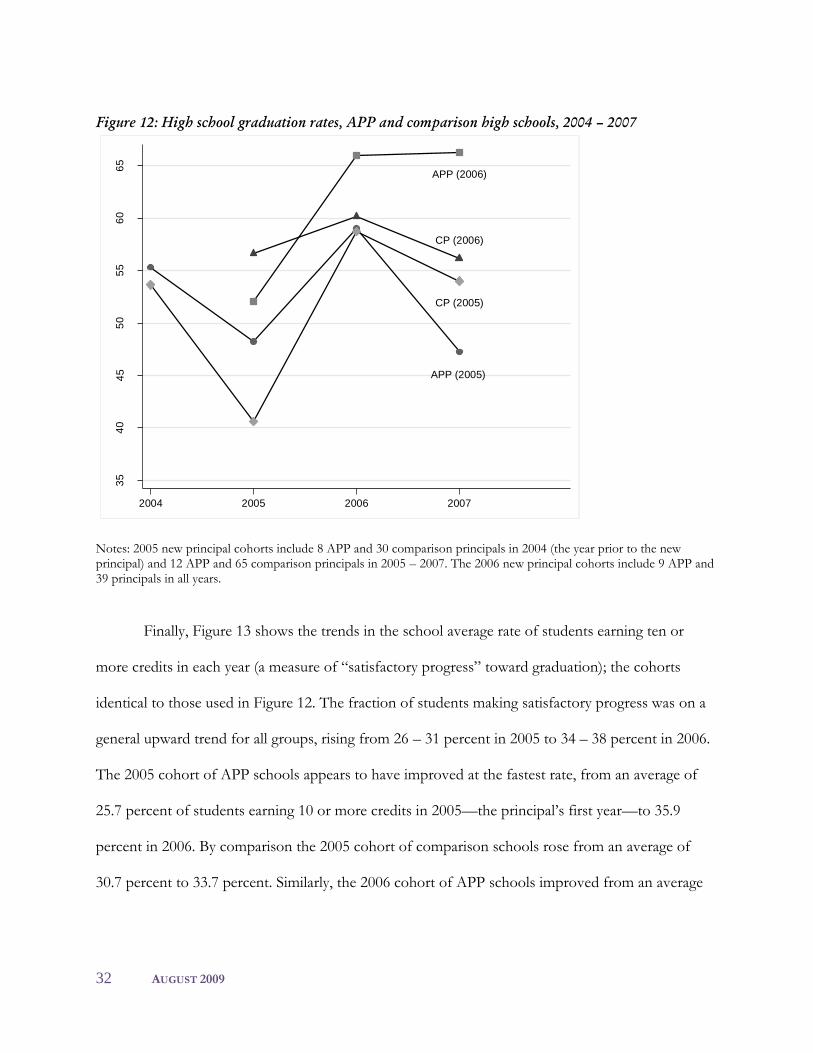
Figure 12 illustrates the trend in average four-year graduation rates for these same four
cohorts of high schools, at least for the small number of schools for which we have this data.
Graduation rates improved between 2005 and 2007 for most cohorts, with the exception of the
2005 cohort of APP schools, in which graduation rates fell from 59.0 percent to 47.3 percent
between 2006 and 2007, after rising from 2005 to 2006. Again, the number of schools used in these
calculations is very small, especially for the APP cohorts. Consequently, the inferences we can draw
from these comparisons are quite limited.
32 AUGUST 2009
Figure 12: High school graduation rates, APP and comparison high schools, 2004 – 2007
APP (2005)
APP (2006)
CP (2006)
CP (2005)
35
40
45
50
55
60
65
Gra
dua
tio
n r
ate
2004 2005 2006 2007
Notes: 2005 new principal cohorts include 8 APP and 30 comparison principals in 2004 (the year prior to the new principal) and 12 APP and 65 comparison principals in 2005 – 2007. The 2006 new principal cohorts include 9 APP and 39 principals in all years.
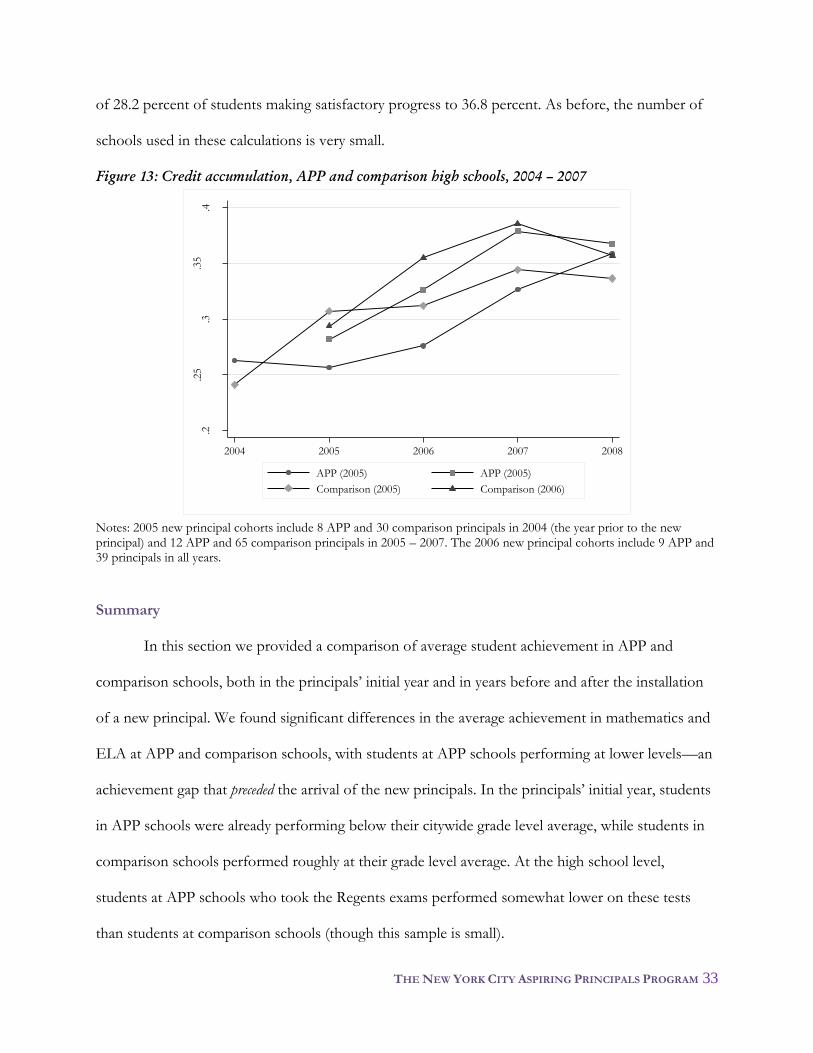
Finally, Figure 13 shows the trends in the school average rate of students earning ten or
more credits in each year (a measure of ―satisfactory progress‖ toward graduation); the cohorts
identical to those used in Figure 12. The fraction of students making satisfactory progress was on a
general upward trend for all groups, rising from 26 – 31 percent in 2005 to 34 – 38 percent in 2006.
The 2005 cohort of APP schools appears to have improved at the fastest rate, from an average of
25.7 percent of students earning 10 or more credits in 2005—the principal’s first year—to 35.9
percent in 2006. By comparison the 2005 cohort of comparison schools rose from an average of
30.7 percent to 33.7 percent. Similarly, the 2006 cohort of APP schools improved from an average
THE NEW YORK CITY ASPIRING PRINCIPALS PROGRAM 33
of 28.2 percent of students making satisfactory progress to 36.8 percent. As before, the number of
schools used in these calculations is very small.
Figure 13: Credit accumulation, APP and comparison high schools, 2004 – 2007
.2.2
5.3
.35
.4
Per
cen
t p
assi
ng
10 o
r m
ore
cre
dit
s
2004 2005 2006 2007 2008
APP (2005)
Comparison (2005)
APP (2005)
Comparison (2006)
Notes: 2005 new principal cohorts include 8 APP and 30 comparison principals in 2004 (the year prior to the new principal) and 12 APP and 65 comparison principals in 2005 – 2007. The 2006 new principal cohorts include 9 APP and 39 principals in all years.
Summary
In this section we provided a comparison of average student achievement in APP and
comparison schools, both in the principals’ initial year and in years before and after the installation
of a new principal. We found significant differences in the average achievement in mathematics and
ELA at APP and comparison schools, with students at APP schools performing at lower levels—an
achievement gap that preceded the arrival of the new principals. In the principals’ initial year, students
in APP schools were already performing below their citywide grade level average, while students in
comparison schools performed roughly at their grade level average. At the high school level,
students at APP schools who took the Regents exams performed somewhat lower on these tests
than students at comparison schools (though this sample is small).
34 AUGUST 2009
An important difference between APP schools and comparison schools was revealed in
Figure 10. Schools where an APP principal was placed were generally on a sharp downward trend in
mathematics and ELA in the years preceding the new principal. This was especially evident for the
2005 cohort of APP schools. Comparison schools, by contrast, experienced relatively stable
performance in these subjects prior to their new principal.
We emphasize that the results presented in this section are only simple comparisons of
group averages. As is true for all analyses of school-level performance, there is likely to be a myriad
of other factors not accounted for here that partly explain observed differences in test scores. These
factors include student composition such as poverty (which varies both between schools and within
schools over time) and prior achievement. Our regression analyses in the following sections
explicitly attempt to account for these differences.
VII. Regression Analysis: Elementary and Middle Schools
Overview of the analytical approach
As shown in Section IV - VI, the first two cohorts of APP principals were placed in schools
that were demographically, geographically, and academically distinct from comparison schools led by
other new principals. Elementary and middle school APP principals were almost twice as likely to be
located in the Bronx, and the average student attending these schools was significantly more likely to
be black and slightly more likely to be poor. Most importantly, elementary and middle school APP
principals were disproportionately placed in schools that were already lower achieving, on average,
than their peer schools led by other new principals. Average achievement in APP schools was largely
on a downward trend, relative to the city average, prior to the arrival of the APP principals.
In this section, we provide a more formal comparison of outcomes in elementary and middle
schools led by APP and comparison principals. This analysis involves estimating a series of multiple
THE NEW YORK CITY ASPIRING PRINCIPALS PROGRAM 35
regression models that attempt to compare performance in APP and comparison schools after
controlling for observable differences between these groups of schools (including prior year
performance of students in those schools).
Here we rely strictly on average standardized scores as our measure of ELA and mathematics
achievement. As explained in Section VI, these measures are the most reliable for making
comparisons between schools, across grades, and over time. The reader should keep in mind that
these are measures of relative performance; they indicate how the average student in a school
performed relative to his/her citywide grade level average. These scores are in standard deviation
units—a measure of the overall grade-level variation in scores. A standardized score of 1, for
example, indicates that the average student scored one standard deviation above their grade level
average. All of the standardized scores used here are school-level averages.28
As described in the Methodological Appendix, we begin by estimating a simple ―difference-
in-difference‖ regression model that compares APP school outcomes before and after the arrival of
their APP principal with comparison school outcomes before and after the arrival of their new
principal. This approach allows achievement in APP and comparison schools to differ in the years
before the new principal (which we know from Section VI to be true) as well as after. We can then
test whether APP schools experienced greater improvements in average achievement after the
installation of new leadership than similar comparison schools.29
We then extend this model by estimating a difference-in-difference regression model with
school-level ―fixed effects.‖ Because we observe most APP and comparison schools before and
after the arrival of a new principal, we can effectively allow each school to have its own baseline
28 Across all schools in our sample, the standard deviation of these school-level average scores is approximately 0.48 in math and 0.45 in ELA. 29 Our model does not make use of student-level achievement gains. Rather, we are comparing average school scores in a given year conditional on the average score of students in that school, in the prior year. Further, these average scores are standardized, meaning they are all interpreted relative to the citywide average.
36 AUGUST 2009
level of achievement. In this case, changes in outcomes within schools over time provide our estimate of
APP effects. While this is our preferred model, it relies on having a sufficient number of schools
observed both before and after the arrival of a new principal.
In all cases, our regression model controls for the average prior year test scores for the
students in each school.30 We also provide regression estimates that alternately include and exclude
other school-level controls, such as the student racial and gender composition, percent eligible for
free lunch, percent native born or immigrant, and the like. Our findings are largely unaffected by the
inclusion of these controls. We have also estimated all models without controlling for prior year test
scores, and with and without controls for the percent of students not tested; again, the results are
quite similar.
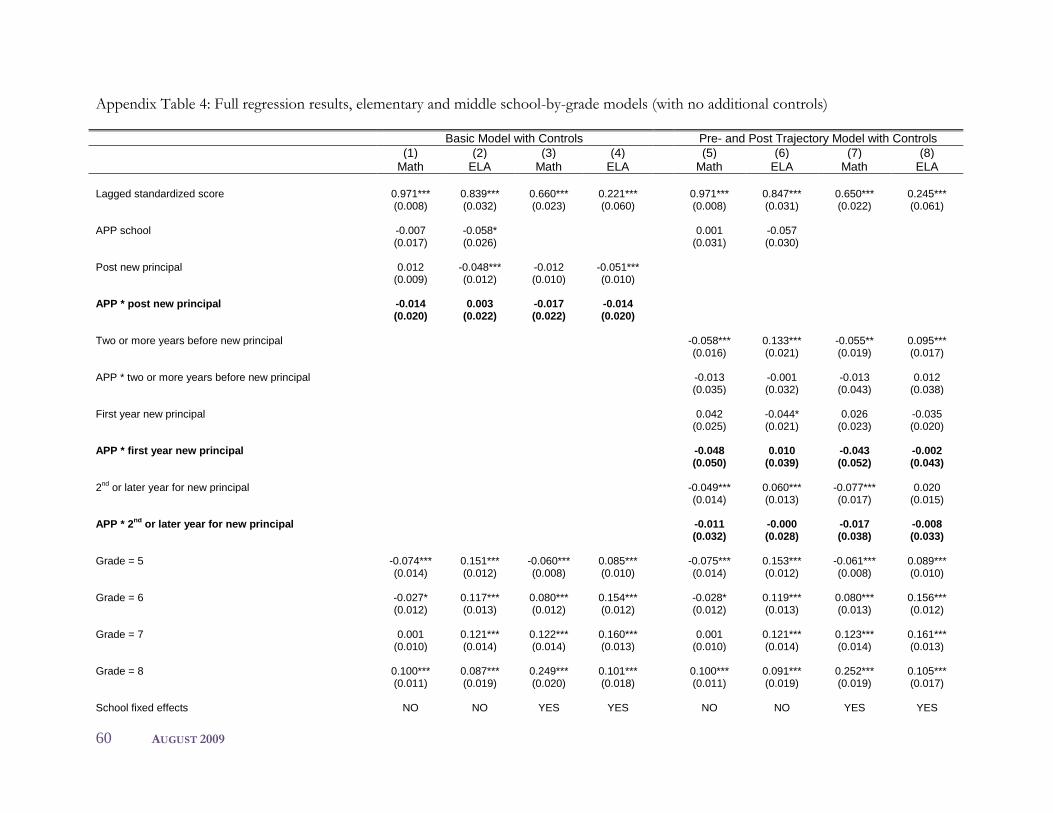
As a final extension, we re-estimate all of the above models under an alternative specification
where APP and comparison schools are allowed to have different pre- and post-new principal trends.
In these models, ―one year before new principal‖ represents the baseline one reference year, while
―two or more years before new principal,‖ ―first year under new principal,‖ ―second year under new
principal,‖ and ―third or later year under new principal‖ are differences in average achievement
relative to the baseline year. This approach allows us to examine whether these two types of schools
followed different trajectories prior to the new principal (as was suggested in Figure 10), as well as
whether these schools followed different trajectories after the new principal took the helm. As we
discuss below, this alternative model proves to be informative.
Results
Table 6 presents results from our basic difference-in-difference regression model for
elementary and middle school ELA and mathematics. Columns (1) – (4) provide coefficient
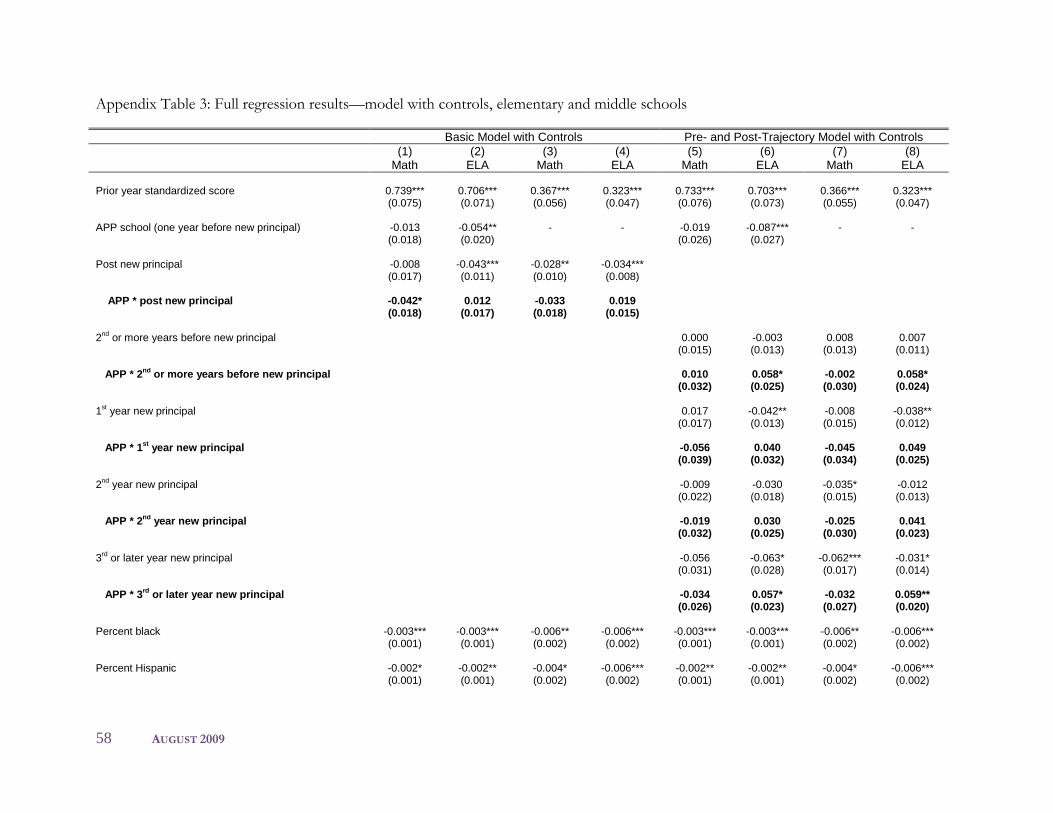
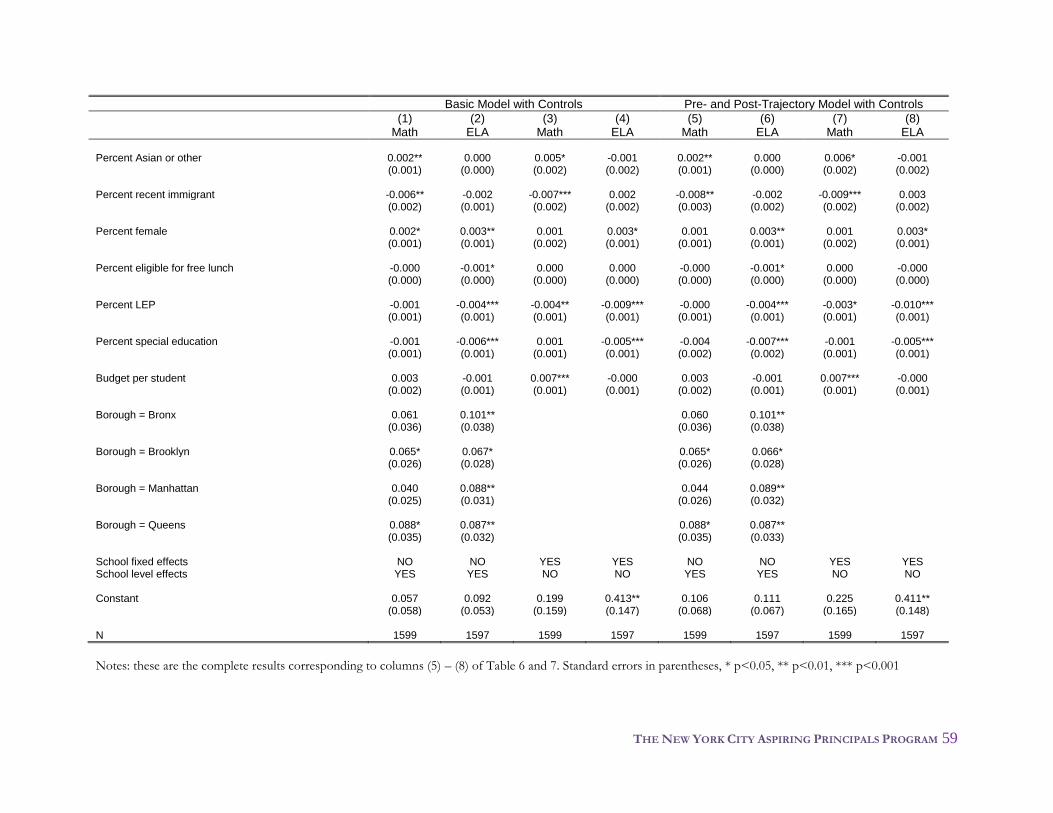
30 Controlling for prior year achievement is similar in spirit to more refined ―value-added‖ models. Bear in mind that our measures of contemporaneous and lagged achievement are generated from individual student-level data.
THE NEW YORK CITY ASPIRING PRINCIPALS PROGRAM 37
estimates from a model with no additional school controls beyond lagged student achievement and
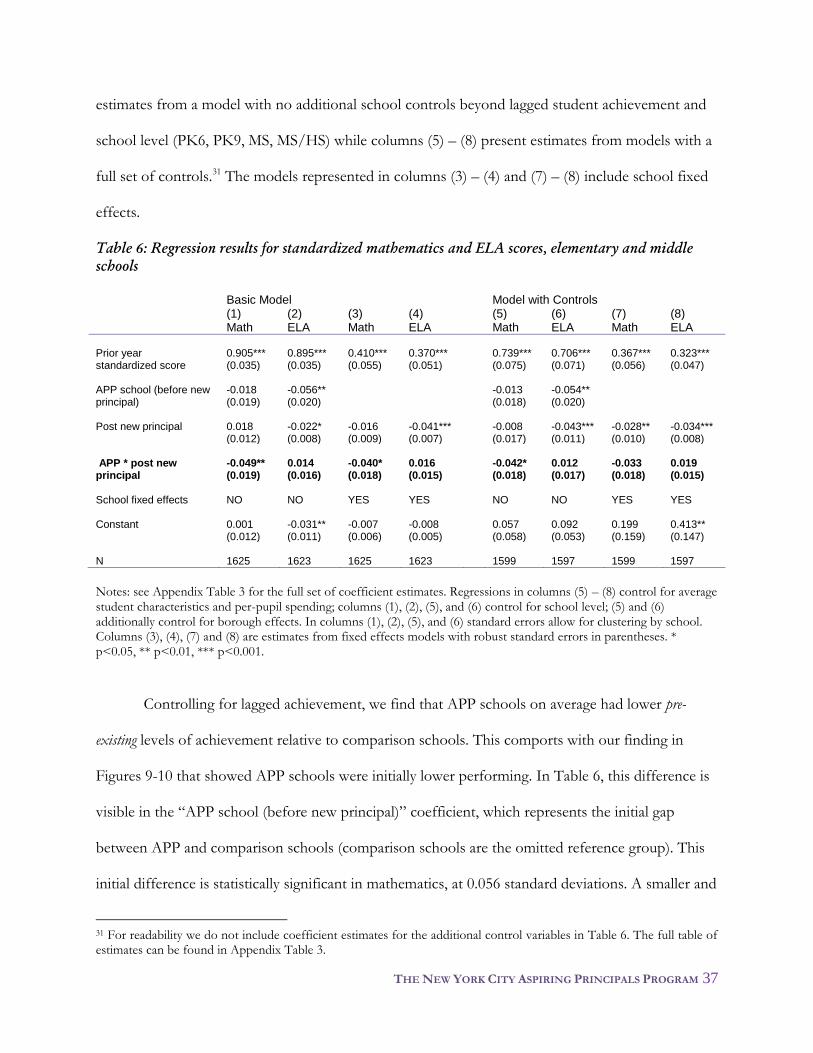
school level (PK6, PK9, MS, MS/HS) while columns (5) – (8) present estimates from models with a
full set of controls.31 The models represented in columns (3) – (4) and (7) – (8) include school fixed
effects.
Table 6: Regression results for standardized mathematics and ELA scores, elementary and middle
schools
Basic Model Model with Controls (1) (2) (3) (4) (5) (6) (7) (8) Math ELA Math ELA Math ELA Math ELA Prior year 0.905*** 0.895*** 0.410*** 0.370*** 0.739*** 0.706*** 0.367*** 0.323*** standardized score (0.035) (0.035) (0.055) (0.051) (0.075) (0.071) (0.056) (0.047) APP school (before new -0.018 -0.056** -0.013 -0.054** principal) (0.019) (0.020) (0.018) (0.020) Post new principal 0.018 -0.022* -0.016 -0.041*** -0.008 -0.043*** -0.028** -0.034*** (0.012) (0.008) (0.009) (0.007) (0.017) (0.011) (0.010) (0.008) APP * post new -0.049** 0.014 -0.040* 0.016 -0.042* 0.012 -0.033 0.019 principal (0.019) (0.016) (0.018) (0.015) (0.018) (0.017) (0.018) (0.015) School fixed effects NO NO YES YES NO NO YES YES Constant 0.001 -0.031** -0.007 -0.008 0.057 0.092 0.199 0.413** (0.012) (0.011) (0.006) (0.005) (0.058) (0.053) (0.159) (0.147) N 1625 1623 1625 1623 1599 1597 1599 1597
Notes: see Appendix Table 3 for the full set of coefficient estimates. Regressions in columns (5) – (8) control for average student characteristics and per-pupil spending; columns (1), (2), (5), and (6) control for school level; (5) and (6) additionally control for borough effects. In columns (1), (2), (5), and (6) standard errors allow for clustering by school. Columns (3), (4), (7) and (8) are estimates from fixed effects models with robust standard errors in parentheses. * p<0.05, ** p<0.01, *** p<0.001.
Controlling for lagged achievement, we find that APP schools on average had lower pre-
existing levels of achievement relative to comparison schools. This comports with our finding in
Figures 9-10 that showed APP schools were initially lower performing. In Table 6, this difference is
visible in the ―APP school (before new principal)‖ coefficient, which represents the initial gap
between APP and comparison schools (comparison schools are the omitted reference group). This
initial difference is statistically significant in mathematics, at 0.056 standard deviations. A smaller and
31 For readability we do not include coefficient estimates for the additional control variables in Table 6. The full table of estimates can be found in Appendix Table 3.
38 AUGUST 2009
statistically insignificant difference of 0.018 is observed in ELA. These estimates are virtually the
same when including a full set of school controls (columns (5) – (8)).
Interestingly, relative student test performance falls modestly in the years following the
installation of a new principal, in both APP and comparison schools. This finding may represent a
―transition‖ effect for new principals, not unlike those observed for novice teachers, who are found
to be less effective than their peers in their first few years of teaching.32 In Table 6, this difference is
seen in the ―post new principal‖ coefficient, which applies to both school types. We find that
average standardized scores in ELA are lower by 0.022 to 0.043 standard deviations after the arrival
of a new principal (a statistically significant difference). Scores in mathematics are as much as 0.028
standard deviations lower. This finding is robust to the inclusion of school fixed effects; in our full
model with controls and fixed effects, we find a statistically significant negative relationship between
new principals and achievement in both mathematics and ELA.
The important question for this study is whether APP schools—after controlling for prior
student achievement and pre-existing differences in school performance—perform differently from
comparison schools following the installation of a new principal. In Table 6, this relationship is
captured in the ―APP * post new principal‖ interaction coefficient, which represents the difference in
the ―post new principal‖ effect between APP and comparison schools.
Here we find that in ELA average standardized scores in APP schools were marginally
higher after the installation of the new principal, relative to comparison schools after the installation
of a new principal. However, these estimates—which range from 0.012 to 0.019 standard
deviations—are not statistically significant. Relative to the overall standard deviation across schools
in average scores (about 0.45 to 0.48), all of these differences are also quite small. In mathematics,
APP schools performed relatively worse than comparison schools in the years following the new
32 See for example Boyd et al. (2008).
THE NEW YORK CITY ASPIRING PRINCIPALS PROGRAM 39
principal. Our estimate of the difference in the ―post new principal‖ effect in mathematics ranges
from -0.033 to -0.049 standard deviations. While this estimate is statistically significant in our models
without controls, the estimate slips below statistical significance in our full model with controls
(column (7)).
The results shown in Table 6 effectively consider two periods for these groups of schools:
before the arrival of their new principal, and after. In Table 7, we estimate a more flexible model
that allows for differential pre-and post- trends in school achievement. The structure of this table is
identical to that of Table 6: columns (1) – (4) omit additional school level controls while (5) – (8)
include them. Columns (3), (4), (7), and (8) represent models with fixed effects. All regressions
control for lagged student achievement. As described above, ―one year before new principal‖ is the
baseline period for this analysis. ―Two or more years before new principal,‖ ―first year new
principal,‖ ―second year under new principal,‖ and ―third or later year under new principal‖ are all
differences with respect to the baseline year. (The coefficient ―APP school (one year before new principal)‖
contrasts APP schools with comparison schools in the baseline year, i.e. the year before the new
principal). This model is also useful in that it allows us to see how average achievement changes with
the accumulated experience of new principals.
40 AUGUST 2009
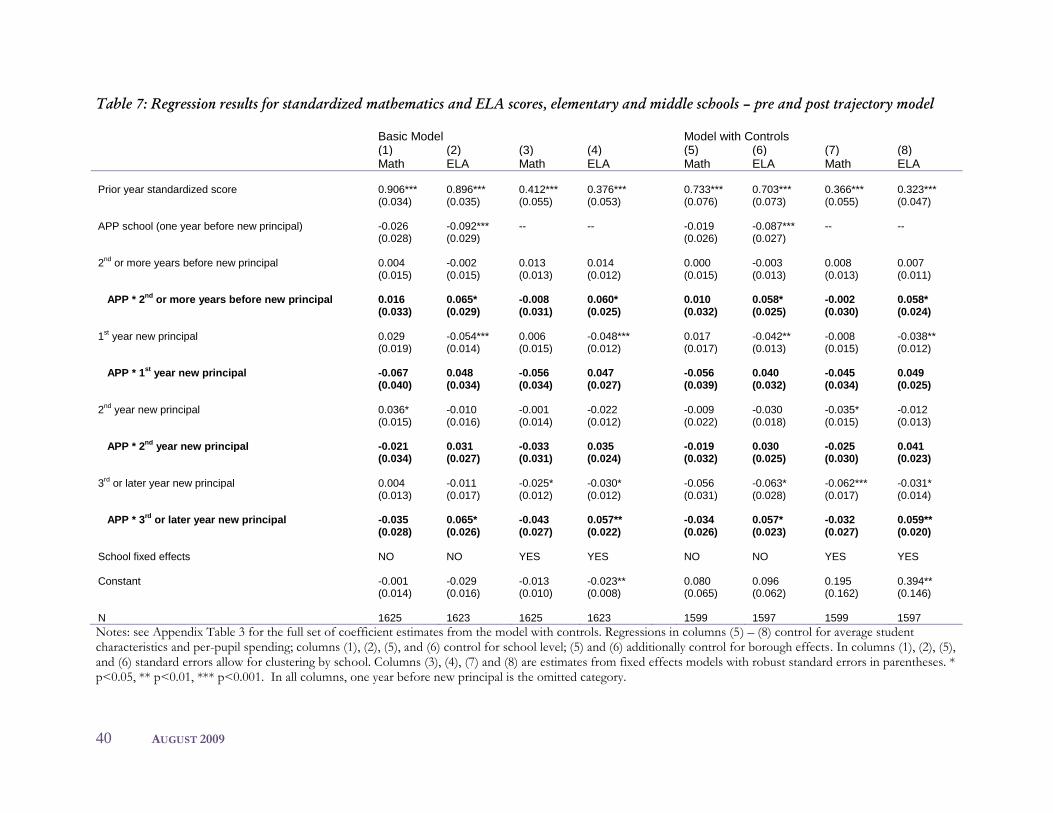
Table 7: Regression results for standardized mathematics and ELA scores, elementary and middle schools – pre and post trajectory model
Basic Model Model with Controls (1) (2) (3) (4) (5) (6) (7) (8) Math ELA Math ELA Math ELA Math ELA Prior year standardized score 0.906*** 0.896*** 0.412*** 0.376*** 0.733*** 0.703*** 0.366*** 0.323*** (0.034) (0.035) (0.055) (0.053) (0.076) (0.073) (0.055) (0.047) APP school (one year before new principal) -0.026 -0.092*** -- -- -0.019 -0.087*** -- -- (0.028) (0.029) (0.026) (0.027) 2
nd or more years before new principal 0.004 -0.002 0.013 0.014 0.000 -0.003 0.008 0.007
rd or later year new principal -0.035 0.065* -0.043 0.057** -0.034 0.057* -0.032 0.059**
(0.028) (0.026) (0.027) (0.022) (0.026) (0.023) (0.027) (0.020) School fixed effects NO NO YES YES NO NO YES YES Constant -0.001 -0.029 -0.013 -0.023** 0.080 0.096 0.195 0.394** (0.014) (0.016) (0.010) (0.008) (0.065) (0.062) (0.162) (0.146) N 1625 1623 1625 1623 1599 1597 1599 1597
Notes: see Appendix Table 3 for the full set of coefficient estimates from the model with controls. Regressions in columns (5) – (8) control for average student characteristics and per-pupil spending; columns (1), (2), (5), and (6) control for school level; (5) and (6) additionally control for borough effects. In columns (1), (2), (5), and (6) standard errors allow for clustering by school. Columns (3), (4), (7) and (8) are estimates from fixed effects models with robust standard errors in parentheses. * p<0.05, ** p<0.01, *** p<0.001. In all columns, one year before new principal is the omitted category.
THE NEW YORK CITY ASPIRING PRINCIPALS PROGRAM 41
With respect to mathematics achievement, the results in Table 7 roughly mirror those in
Table 6. APP principals’ schools perform marginally worse in mathematics during their first years on
the job, relative to comparison schools, although these differences are statistically insignificant. This
gap is visible in the ―APP * 1st year new principal‖ coefficient. Importantly, this gap in the principal’s
first year is typically about twice as large as that estimated for later years (such as the ―APP * 2nd year
new principal‖ coefficient). This may suggest that mathematics performance in APP schools,
relatively speaking, take an initial downturn in mathematics, relative to comparison schools, but then
begin to rebound. However, none of these estimates are statistically significant.
Our findings for ELA are a bit more interesting and complex. Our descriptive look at trends
in mean achievement presented in Section VI found that achievement in APP schools—particularly
in ELA—was on a downward trajectory prior to their new principals’ hiring. This pattern is visible
here as well. In Table 7 we see that ELA performance two or more years before the new principal was
higher than one year before (see the coefficient on ―APP * 2nd or more years before new principal,‖
which represents average achievement relative to the baseline year, one year before the new
principal). In their first year as principal, comparison principals witnessed an average decline in
standardized ELA scores. However, APP schools appear to have made offsetting improvements in
ELA in their first year, relative to comparison schools. That is, APP schools did not experience the
same ―first year penalty‖ in ELA that the comparison schools did. In their second year, APP schools
held steady, relative to comparison schools who had not yet recovered from their ―first year
penalty.‖ Notably, by their third year, APP schools had risen to a level comparable to the baseline
year while comparison schools continued to decline. These differences are statistically significant in
the principals’ third (and later) year.
Taken together, the pattern of ELA results in Table 7 are easily reconciled with those in
Table 6 which provided a more crude ―before and after‖ comparison. There we found that new
42 AUGUST 2009
APP principals’ schools may have performed marginally better in ELA than comparison schools,
but the differences were statistically insignificant. Table 7 illustrates why. In APP schools, the
preceding years were characterized by ELA scores on a sharp downward trajectory. Scores modestly
rebounded in the years following—relative to comparison principals—such that a ―before and after‖
comparison shows only minor differences.
Figure 14 provides a visual summary of the ELA coefficients found in column (6) of Table 7
(the model with controls).33 The points on these line graphs represent average school achievement in
APP and comparison schools after accounting for observable differences in schools via regression. Average ELA
achievement in APP schools fell below that of comparison schools in the years leading up to the
new principal. Further, in the year just prior to the installation of the new principal, achievement in
APP schools fell relative to that in comparison schools (which remained relatively constant). Then,
while achievement fell in the first year of the comparison principals’ tenure, achievement in APP
schools remained stable. In the second and third years, APP schools held steady while standardized
scores continued to fall in comparison schools.
33 We do not provide this figure for math, as most of the coefficients in that model are statistically insignificant.
THE NEW YORK CITY ASPIRING PRINCIPALS PROGRAM 43
Figure 14: Time pattern of ELA coefficients from Table 7 column (6)
-0.10
-0.05
0.00
0.05
0.10
0.15
Two or more years before One year before First year Second year Third or later year
Sta
nd
ard
ized
sco
re u
nit
s
APP Comparison
As described in the Methodological Appendix, we have also estimated a school-by-grade
regression model, where each grade within a school is considered individually (with some accounting
for common factors at the school level). While we do not have a theory for why new principals
would have differing effects by grade, this model does improve somewhat on those presented in
Tables 6-7 by making grade-specific comparisons. The results of this regression model can be found
in Appendix Tables 5A and 5B. We find few differences using this approach.
VIII. Regression Analysis: High Schools
In this section we use a similar approach to that taken in Section VII to formally compare
outcomes in high schools led by APP and comparison principals. As stated before, because of the
very small sample of APP high schools we are limited in our ability to learn much from a multiple
regression analysis of these schools. In addition, because there are a large number of new high
schools represented here (see Appendix Table 6), we are further constrained in our ability to make
―before‖ and ―after‖ comparisons of APP and comparison high schools.
44 AUGUST 2009
With these limitations in mind, we begin by estimating a simple difference-in-difference
model for Regents exam pass rates, similar to that in Table 6. We consider four Regents exams as
our measures of high school student achievement: English, mathematics, biology, and global history.
Passing is defined as a score of 55 and higher—the minimum requirement for a local diploma during
this period—and a school’s passing rate is defined as the fraction of students who write the test that
pass with a score of 55 or higher. For high school students, we do not have a measure of lagged
achievement as we did with elementary and middle school students. We do, however, control in our
regressions for the same school characteristics used in Section VII (student race, free lunch
eligibility, and the like). Because passing rates are influenced by the fraction of students who actually
write the test in a given year, we also control for the percent of all students taking each exam.
Columns (1) – (4) of Table 8 represent the simple difference-in-difference regression model,
while columns (5) – (8) represent the same model with district fixed effects (refer again to Section
VII for an explanation of these models). As before, only those schools with observed student outcomes before
and after a new principal contribute to the ―APP * post new principal‖ estimate. Because there are
many new schools among APP high schools, this constitutes only a small number of schools.
We find in Table 8 that—controlling for other school characteristics—APP schools
performed as well, if not slightly better than comparison schools in the years leading up to the new
principal transition. In global history, APP schools appear to have performed much better in these
earlier years (9.6 percentage points, a statistically significant difference). This is visible in the ―APP
school (before new principal)‖ coefficient in Table 8. As was the case with elementary and middle
schools, the first year with a new principal appears to have a small negative effect on student
achievement in both APP and comparison schools, although English is the only subject for which
this effect is statistically significant. (This is read from the ―post new principal‖ coefficient in Table
8).
THE NEW YORK CITY ASPIRING PRINCIPALS PROGRAM 45
Table 8: Regression results for high school Regents exam pass rates
Notes: clustered standard errors in parentheses; * p<0.05, ** p<0.01, *** p<0.001. Due to the small number of observations, these models do not include borough effects (although models that do include borough effects are similar).
46 AUGUST 2009
As before, the important question for this study is whether APP high schools—after
controlling for other pre-existing differences in schools—perform differently from comparison
schools following the installation of a new principal. In Table 8, this relationship is captured in the
―APP * post new principal‖ interaction coefficient, which represents the difference in the ―post new
principal‖ effect between APP and comparison schools. We find that this differential is negative in
all subjects, and statistically significant in both mathematics and history. This suggests that APP high
schools may have performed relatively worse after the arrival of a new principal than similar
comparison schools with new principals. However, as emphasized before, these estimates are
generated from a very small number of schools for which data is available both before and after the
new principal. In addition, we do not have a satisfactory measure of prior student achievement
differences to rule out pre-existing differences academic achievement. As such, we cannot say with
much confidence that these observed differences are attributable to school leadership.
Finally, in Table 9 we present results from a cross-sectional regression model that compares
APP and comparison schools only in the ―post new principal‖ years. In these models, we avoid the
problem encountered in Table 8 from the large number of new schools. On the other hand, we
introduce a potentially more serious problem of having no ―before‖ observations to account for pre-
existing differences in academic achievement. (Thus, these models make an even weaker case for a
causal relationship between school leadership and outcomes). In this case, we continue to find a
negative and statistically significant difference between APP and comparison schools on the
Mathematics A Regents. APP schools also fell below comparison schools on the other three Regents
exams, though these differences are statistically insignificant.
THE NEW YORK CITY ASPIRING PRINCIPALS PROGRAM 47
Table 9: Regression results for high school Regents exam pass rates – cross-sectional model with “post
Notes: clustered standard errors in parentheses, * p<0.05, ** p<0.01, *** p<0.001
IX. Conclusion
The results of this analysis are encouraging, indicating that the NYC Leadership Academy
has succeeded in bringing new principals to some of NYC's most challenging schools and curtailing
their downward trends in performance, relative to the city. Although APP principals take charge of
schools that had fallen behind other city schools, performance on standardized tests appear to have
stabilized under their leadership and schools that had been falling relative to city-wide performance
began to improve apace with city-wide growth. Further, there is some evidence that even more
48 AUGUST 2009
improvement lies ahead. These results suggest the need for continued monitoring and follow-up
study to understand whether—and to what extent—improvements in test scores persist and to
identify the kinds of schools or conditions under which Aspiring Principal Program graduates are
particularly successful (or unsuccessful). For the purpose of longitudinal analysis, this study was only
able to focus on two cohorts of principals and aggregate school-level data, and examined
performance over a relatively short period of time. Follow-up work using student-level data would
allow us to understand the impact of Leadership Academy principals more fully and determine
whether there are groups of students—such as initially low performing students—that are served
particularly well.
THE NEW YORK CITY ASPIRING PRINCIPALS PROGRAM 49
References
Boyd, Donald, Hamilton Lankford, Susanna Loeb, Jonah Rockoff, and James Wyckoff. 2008. ―The Narrowing Gap in New York City Teacher Qualifications and Its Implications for Student Achievement in High-Poverty Schools.‖ Journal of Policy Analysis and Management 27(4): 793-818. Fullan, Michael and Suzanne M. Stiegelbauer. 1991. The New Meaning of Educational Change. New York: Teachers College Press. Koretz, Daniel. 2008. Measuring Up. Cambridge: Harvard University Press. Lankford, Hamilton, R.H. O’Connell, and James Wyckoff. 2003. Our Next Generation: School Leadership in New York State. Albany, NY: New York State Education Department [http://www.albany.edu/edfin/Our%20Next%20Generation.pdf] Olsen, Lynn. 2007. ―Academy in N.Y.C. Prepares Principals for Toughest Jobs.‖ Education Week, December 5, 2007. Papa Jr., Frank C., Hamilton Lankford, and James Wyckoff. 2002. ―The Attributes and Career Paths of Principals: Implications for Improving Policy.‖ Working Paper, University at Albany, SUNY [http://www.teacherpolicyresearch.org/portals/1/pdfs/Career_Paths_of_Principals.pdf]
Methodological Appendix In the following appendix, we outline our empirical approach to comparing academic outcomes in APP and comparison schools. Empirical model A contemporaneous comparison of APP and comparison schools (indexed with i) might be drawn by estimating the following regression model, for some school outcome variable Y (such as average mathematics performance):
(1) ititititit XAPPXAPPYE 10],|[
This model assumes that average school outcomes in year t (E[Yit]) can be expressed as a linear function of student and school characteristics Xit (such as school poverty and the percent of students classified as ELLs) and an indicator of APP principal leadership APPit (which equals one if school i is led by an APP principal). If after controlling for observed student and school characteristics APP-led schools have superior outcomes, then β1 should be positive. A contemporaneous comparison falls far short of an ideal test for differences in school leadership, however. In most cases, the vector of observed school characteristics Xit is unlikely to completely capture the myriad of ways in which APP and comparison schools differ with respect to outcomes. APP principals are new to their leadership roles, and are often placed in high-need schools with leadership vacancies. These vacancies may be indicative of poor past school performance or a generally challenging work environment. As a result, APP and comparison schools will typically differ in both observable and unobservable ways, even prior to their principals’ arrival. While this empirical challenge cannot be fully overcome here, we address the weaknesses of model (1) in several ways. First, we limit our analysis to schools led by principals with comparable tenure to our APP principals. In doing so, we avoid comparing schools led by APP principals to schools with experienced leadership that are likely to be more stable environments. Second, in most models we control for the past outcomes of students attending school i in year t:
(2) ititititititit XYAPPYXAPPYE 1101],,|[
This model tests whether, after controlling for observed school characteristics Xit and students past performance Yit-1, APP-led schools have better outcomes than non-APP-led schools. (Yit-1 represents the average outcomes of students attending school i in year t regardless of whether or not they attended i in year t-1). Third, we implement a difference-in-difference approach that compares APP school outcomes before and after the arrival of their APP principal to comparison school outcomes before and after the arrival of their new principal. Here, Postt is a variable that equals one in the years following the placement of a new principal, and APPi is an indicator of whether school i was eventually led by an APP principal:
This is the empirical model estimated in columns (1), (2), (5), and (6) of Tables 6 and 7. This approach improves on models (1) and (2) by controlling for pre-existing outcomes in APP schools, allowing us to test whether APP schools experienced greater improvements after the installation of new leadership than similar comparison schools (this difference is captured by the coefficient β3). Finally, we estimate model (3) with the addition of school fixed effects.34 In this case, each school effectively has its own baseline level of achievement, and changes in outcomes within schools over time provide our estimate of the effect of APP leadership. From an internal validity standpoint, the difference-in-difference model with school fixed effects is our preferred model. However, estimation of this model (as well as model (3)) relies on having observed outcomes for schools both before and after the arrival of a new principal. As seen in Appendix Table 1, there are many cases where school observations are not available prior to the new principal’s arrival. This is especially true at the high school level, where new principals were more likely to be placed in a newly opened school with no prior history. The usual assumption in econometric models is that the error term is identically and independently distributed. In models (1) – (3), however, we have repeated observations on schools over multiple years. Thus there is good reason to believe that the error term—representing explanatory factors not captured in the regressors—are correlated within schools over time. Because of this, we assume ―clustered‖ errors within each school group i. This assumption presumes zero correlation across groups (schools) but leaves the correlation within groups unspecified. In model (3) with school fixed effects, we instead use Huber-White heteroskedasticity robust standard errors. As an alternative model, we also estimate a school-by-grade regression model, where each grade within a school is considered individually. That is, each data point used in the regression is a school (i) * grade (j) combination:
While we do not have a theory for why new principals would have differing effects by grade, this model does improve somewhat on (3) by making grade-specific comparisons. The outcomes (Y) of students in grade j are better matched with those students past performance and observable characteristics (X). School-by-grade models also allow us to include a grade-specific fixed effect κj
that accounts for differential initial levels of achievement by grade. Finally, model (4) allows for further interaction between Post, APP, and grade j. Estimates of model (4) are provided in Appendix Tables 5A (with interaction effects) and 5B (without interaction effects). Internal validity Ideally, one would assess the relative effectiveness of APP-prepared principals by randomly assigning APP and other new, non-APP principals to schools, and then testing for differences in outcomes at a later date. Unfortunately for purposes of evaluation, principals are never assigned in this way.
34 In practice this implies the use of a set of dummy variables for each individual school.
52 AUGUST 2009
On the contrary, APP and comparison principals were assigned to schools in ways that were anything but random. Many non-APP principals, for example, rose to the rank of principal in a school where they had taught for many years. APP principals, on the other hand, were often purposefully placed in high-need schools where a vacancy existed. (Such vacancies, of course, are also non-random). This targeting is explicitly part of the mission of the NYC Leadership Academy. As a result, APP and comparison schools differed substantially on observable and unobservable dimensions well before these principals assumed leadership. Due to this non-random assignment process, our research design necessarily lacks the internal validity of a randomized controlled experiment. While we make every attempt in our analysis to account for systematic, pre-existing differences between schools, we can never be fully certain that observed difference in outcomes between APP and comparison schools are solely attributable to differences in leadership training. External validity We also emphasize that principals who enroll in (and complete) the Aspiring Principals Program are not a random sample of potential New York City principals. Candidates choose to apply, and the NYC Leadership Academy selects those they believe will be most successful in a school leadership position. In this setting, random assignment of principals to schools could tell us something about the overall effectiveness of Leadership Academy selected and trained candidates. But even under random assignment, we would not be able to provide a clear picture of the effectiveness of APP training for the average principal candidate.
THE NEW YORK CITY ASPIRING PRINCIPALS PROGRAM 53
Appendix Figure 1: Initial year distribution of average student characteristics, APP and comparison schools serving elementary and middle grades
05
10
15
20
Perc
ent
0 .2 .4 .6 .8 1Percent black enrollment (APP)
05
10
15
20
25
Perc
ent
0 .2 .4 .6 .8 1Percent black enrollment (Comparison)
Notes: elementary and middle school subsample, N=296 (68 APP and 228 comparison principals, in their first year as principal (2005 or 2006)).
54 AUGUST 2009
Appendix Figure 2: Initial year distribution of average mathematics and ELA achievement, APP and comparison schools serving elementary and middle grades
010
20
30
Perc
ent
-2 -1 0 1 2Std math score (APP)
05
10
15
20
Perc
ent
-2 -1 0 1 2Std math score (Comparison)
010
20
30
Perc
ent
-2 -1 0 1 2Std reading score (APP)
05
10
15
20
Perc
ent
-2 -1 0 1 2Std reading score (Comparison)
Notes: elementary and middle school subsample, N=296 (68 APP and 228 comparison principals). Scores reflect the average for the school in the principal’s first year.
THE NEW YORK CITY ASPIRING PRINCIPALS PROGRAM 55
Appendix Figure 3: Average grade 4 scale scores in mathematics and ELA, constant cohorts of APP and comparison schools, 2003 - 2008
640
650
660
670
680
690
Ave
rage
sca
le s
core
2003 2004 2005 2006 2007 2008Year
Math - Grade 4
630
640
650
660
670
Ave
rage
sca
le s
core
2003 2004 2005 2006 2007 2008Year
APP (2005) Comparison (2005)
APP (2006) Comparison (2006)
ELA - Grade 4
Notes: see notes to Figure 10.
56 AUGUST 2009
Appendix Table 1: Mean characteristics of APP and comparison principals in 2007-08, split elementary/middle and high school samples
Percent American Indian 0.0 0.9 0.067 4.8 1.9 0.433
Age 44.7 48.8 <0.001 *** 44.4 46.8 0.172
Years at this school 3.6 6.1 <0.001 *** 4.0 5.1 0.005 **
Years taught at this school 0.1 1.1 <0.001 *** 0.2 0.4 0.509
Years asst principal at this school 0.0 1.2 <0.001 *** 0.0 0.6 <0.001 ***
Years principal at this school 3.6 3.7 0.013 * 3.8 3.9 0.470
Total years taught 7.1 10.7 <0.001 *** 7.7 9.4 0.269
Total years asst principal 0.4 3.3 <0.001 *** 0.2 2.8 <0.001 ***
Total years as principal 3.7 3.8 0.833 3.8 3.9 0.382
Notes: separate calculations for elementary/middle and high school subsamples. See Tables 4-5 for sample sizes. p value is from a t-test for a difference in means. *** indicates statistically significant difference at the 0.01 level; ** indicates statistically significant difference at the 0.05 level; * indicates statistically significant difference at the 0.01 level.
THE NEW YORK CITY ASPIRING PRINCIPALS PROGRAM 57
Appendix Table 2: Principal cohorts and years of available pre- and post- data
Years of data observed Elementary/Middle High school
APP Comparison APP Comparison First year as principal was 2004-05: 38 114 13 66 Pre: 2002-03 and 2003-04 Post: 2004-05 through 2007-08 27 90 Pre: 2003-04 Post: 2004-05 through 2007-08 4 8 30 Pre: none Post: 2004-05 through 2007-08 10 18 4 35 Pre: none Post: 2005-06 through 2007-08 2 1 Pre: 2003-04 Post: 2004-05 only 1 First year as principal was 2005-06: 31 116 9 39 Pre: 2002-03 through 2004-05 Post: 2005-06 through 2007-08 19 95 Pre: 2004-05 Post: 2005-06 through 2007-08 3 7 5 24 Pre: 2003-04 and 2004-05 Post: 2005-06 through 2007-08 4 15 Pre: 2002-03 through 2004-05 Post: 2005-06 1 Pre: none Post: 2005-06 through 2007-08 9 13 Total 69 230 22 105
58 AUGUST 2009
Appendix Table 3: Full regression results—model with controls, elementary and middle schools
Basic Model with Controls Pre- and Post-Trajectory Model with Controls
(1) (2) (3) (4) (5) (6) (7) (8) Math ELA Math ELA Math ELA Math ELA Prior year standardized score 0.739*** 0.706*** 0.367*** 0.323*** 0.733*** 0.703*** 0.366*** 0.323*** (0.075) (0.071) (0.056) (0.047) (0.076) (0.073) (0.055) (0.047) APP school (one year before new principal) -0.013 -0.054** - - -0.019 -0.087*** - - (0.018) (0.020) (0.026) (0.027) Post new principal -0.008 -0.043*** -0.028** -0.034*** (0.017) (0.011) (0.010) (0.008) APP * post new principal -0.042* 0.012 -0.033 0.019 (0.018) (0.017) (0.018) (0.015) 2
nd or more years before new principal 0.000 -0.003 0.008 0.007
(0.015) (0.013) (0.013) (0.011) APP * 2
nd or more years before new principal 0.010 0.058* -0.002 0.058*
(0.032) (0.025) (0.030) (0.024) 1
st year new principal 0.017 -0.042** -0.008 -0.038**
(0.017) (0.013) (0.015) (0.012) APP * 1
st year new principal -0.056 0.040 -0.045 0.049
(0.039) (0.032) (0.034) (0.025) 2
nd year new principal -0.009 -0.030 -0.035* -0.012
(0.022) (0.018) (0.015) (0.013) APP * 2
nd year new principal -0.019 0.030 -0.025 0.041
(0.032) (0.025) (0.030) (0.023) 3
rd or later year new principal -0.056 -0.063* -0.062*** -0.031*
(0.031) (0.028) (0.017) (0.014) APP * 3
rd or later year new principal -0.034 0.057* -0.032 0.059**
Basic Model with Controls Pre- and Post-Trajectory Model with Controls
(1) (2) (3) (4) (5) (6) (7) (8) Math ELA Math ELA Math ELA Math ELA Percent Asian or other 0.002** 0.000 0.005* -0.001 0.002** 0.000 0.006* -0.001 (0.001) (0.000) (0.002) (0.002) (0.001) (0.000) (0.002) (0.002) Percent recent immigrant -0.006** -0.002 -0.007*** 0.002 -0.008** -0.002 -0.009*** 0.003 (0.002) (0.001) (0.002) (0.002) (0.003) (0.002) (0.002) (0.002) Percent female 0.002* 0.003** 0.001 0.003* 0.001 0.003** 0.001 0.003* (0.001) (0.001) (0.002) (0.001) (0.001) (0.001) (0.002) (0.001) Percent eligible for free lunch -0.000 -0.001* 0.000 0.000 -0.000 -0.001* 0.000 -0.000 (0.000) (0.000) (0.000) (0.000) (0.000) (0.000) (0.000) (0.000) Percent LEP -0.001 -0.004*** -0.004** -0.009*** -0.000 -0.004*** -0.003* -0.010*** (0.001) (0.001) (0.001) (0.001) (0.001) (0.001) (0.001) (0.001) Percent special education -0.001 -0.006*** 0.001 -0.005*** -0.004 -0.007*** -0.001 -0.005*** (0.001) (0.001) (0.001) (0.001) (0.002) (0.002) (0.001) (0.001) Budget per student 0.003 -0.001 0.007*** -0.000 0.003 -0.001 0.007*** -0.000 (0.002) (0.001) (0.001) (0.001) (0.002) (0.001) (0.001) (0.001) Borough = Bronx 0.061 0.101** 0.060 0.101** (0.036) (0.038) (0.036) (0.038) Borough = Brooklyn 0.065* 0.067* 0.065* 0.066* (0.026) (0.028) (0.026) (0.028) Borough = Manhattan 0.040 0.088** 0.044 0.089** (0.025) (0.031) (0.026) (0.032) Borough = Queens 0.088* 0.087** 0.088* 0.087** (0.035) (0.032) (0.035) (0.033) School fixed effects NO NO YES YES NO NO YES YES School level effects YES YES NO NO YES YES NO NO Constant 0.057 0.092 0.199 0.413** 0.106 0.111 0.225 0.411** (0.058) (0.053) (0.159) (0.147) (0.068) (0.067) (0.165) (0.148) N 1599 1597 1599 1597 1599 1597 1599 1597
Notes: these are the complete results corresponding to columns (5) – (8) of Table 6 and 7. Standard errors in parentheses, * p<0.05, ** p<0.01, *** p<0.001
60 AUGUST 2009
Appendix Table 4: Full regression results, elementary and middle school-by-grade models (with no additional controls)
Basic Model with Controls Pre- and Post Trajectory Model with Controls
(1) (2) (3) (4) (5) (6) (7) (8) Math ELA Math ELA Math ELA Math ELA
Lagged standardized score 0.971*** 0.839*** 0.660*** 0.221*** 0.971*** 0.847*** 0.650*** 0.245*** (0.008) (0.032) (0.023) (0.060) (0.008) (0.031) (0.022) (0.061) APP school -0.007 -0.058* 0.001 -0.057 (0.017) (0.026) (0.031) (0.030) Post new principal 0.012 -0.048*** -0.012 -0.051*** (0.009) (0.012) (0.010) (0.010) APP * post new principal -0.014 0.003 -0.017 -0.014 (0.020) (0.022) (0.022) (0.020) Two or more years before new principal -0.058*** 0.133*** -0.055** 0.095*** (0.016) (0.021) (0.019) (0.017) APP * two or more years before new principal -0.013 -0.001 -0.013 0.012 (0.035) (0.032) (0.043) (0.038) First year new principal 0.042 -0.044* 0.026 -0.035 (0.025) (0.021) (0.023) (0.020) APP * first year new principal -0.048 0.010 -0.043 -0.002 (0.050) (0.039) (0.052) (0.043) 2
nd or later year for new principal -0.049*** 0.060*** -0.077*** 0.020
(0.014) (0.013) (0.017) (0.015) APP * 2
nd or later year for new principal -0.011 -0.000 -0.017 -0.008
Notes: in columns (1), (2), (5), and (6) standard errors allow for clustering by school. Columns (3), (4), (7) and (8) are estimates from fixed effects models with robust standard errors in parentheses. * p<0.05, ** p<0.01, *** p<0.001. In columns (5) – (8), two or more years before new principal is the omitted category.
62 AUGUST 2009
Appendix Table 5A: Full regression results, elementary and middle school-by-grade models (with controls and grade interactions)
No interactions No interactions Including interactions
No interactions No interactions Including interactions
(1) (2) (3) (4) (5) (6) Math ELA Math ELA Math ELA APP school * grade 5 0.009 0.034 (0.031) (0.030) APP school * grade 6 0.016 0.048 (0.040) (0.035) APP school * grade 7 -0.017 0.065 (0.041) (0.037) APP school * grade 8 -0.003 0.069 (0.074) (0.074) Post new principal * grade 5 -0.079*** -0.004 (0.018) (0.018) Post new principal * grade 6 -0.038* -0.034 (0.019) (0.018) Post new principal * grade 7 -0.065*** -0.058** (0.019) (0.019) Post new principal * grade 8 -0.130** 0.021 (0.045) (0.045) APP * post * grade 5 -0.065 -0.010 (0.042) (0.038) APP * post * grade 6 -0.042 -0.015 (0.039) (0.036) APP * post * grade 7 -0.020 -0.071 (0.034) (0.037) APP * post * grade 8 -0.014 -0.060 (0.084) (0.082) School fixed effects NO NO YES YES YES YES Constant -0.051 0.153* 0.066 0.579*** 0.010 0.566*** (0.042) (0.073) (0.124) (0.165) (0.127) (0.165) N 4293 4270 4293 4270 4293 4270
64 AUGUST 2009
Appendix Table 5B: Full regression results, elementary and middle school-by-grade models (with controls and no grade interactions)
(1) (2) (3) (4)
Math ELA Math ELA Lagged standardized score 0.830*** 0.538*** 0.612*** 0.197*** (0.016) (0.058) (0.022) (0.054) APP school 0.003 -0.053 (0.028) (0.032) Two or more years before new principal -0.057*** 0.107*** -0.055** 0.080*** (0.015) (0.016) (0.018) (0.017) APP * two or more years before new principal -0.016 -0.004 -0.009 0.019 (0.035) (0.028) (0.042) (0.038) First year new principal 0.035 -0.038* 0.025 -0.033 (0.025) (0.019) (0.023) (0.020) APP * first year new principal -0.048 0.006 -0.041 0.000 (0.051) (0.040) (0.051) (0.043) 2
nd or later year for new principal -0.067*** -0.009 -0.079*** -0.003
(0.015) (0.012) (0.017) (0.015) APP * 2
nd or later year for new principal -0.011 0.012 -0.012 0.005
Math ELA Math ELA Grade = 6 -0.031** 0.093*** 0.071*** 0.134*** (0.012) (0.012) (0.013) (0.012) Grade = 7 -0.005 0.088*** 0.113*** 0.138*** (0.011) (0.013) (0.014) (0.014) Grade = 8 0.104*** 0.035* 0.241*** 0.071*** (0.011) (0.014) (0.019) (0.018) School effects NO NO YES YES Constant 0.038 0.073 0.156 0.476** (0.040) (0.070) (0.123) (0.166) N 4293 4270 4293 4270
66 AUGUST 2009
Appendix Table 6: APP high schools included in the study
LCMS
School
BDS
Year opened
APP 2005 Cohort (12) K477 Samuel Tilden H.S. 318477 1930 K524 International High School at Prospect Heights 317524 2005 K533 School for Democracy and Leadership 317533 2005 K537 High School for Youth and Community Development at Erasmus 373537 2005 M492 High School for Law, Advocacy, and Community Justice 103492 2003 M685 Bread and Roses Integrated Arts High School 105685 1998 M690 School for the Physical City 179690 1994 M695 Urban Peace Academy 179695 1994 X239 The Urban Assembly Academy for History and Citizenship for Young
Men 209239 2005
X437 Fordham High School for the Arts 210437 2003 X500 Hostos-Lincoln Academy of Science 207500 2005 X543 High School for Violin and Dance
35 212543 2003
APP 2006 Cohort (9) K350 The Urban Assembly School of Music and Art 313350 2006 M299 High School for Arts, Imagination, and Inquiry 103299 2006 M408 Professional Performing Arts High School 102408 1991 M495 Park East High School 104495 2003 M555 Central Park East Secondary High School 104555 1985 M635 Academy of Environmental Science Secondary High School 104635 2001 Q248 Queens Preparatory Academy 429248 2006 Q259 Pathways College Preparatory School: A College Board School 429259 2006 X321 Crotona Academy High School 279321 2005
Notes: ―year‖ refers to Spring of the academic year.
35 Part of the Morris High School restructuring
The Institute for Education and Social Policy is a joint research center of NYU’s Wagner and Stein-hardt Schools. Founded in 1995, IESP brings the talents of a diverse group of NYU faculty, graduate students and research scientists to bear on questions of education and social policy. We are one of the nation’s leading academic research centers addressing urban education issues and a substantial amount of our work focuses on New York City public schools and students. More information is available on our website at http://steinhardt.nyu.edu/iesp.
82 Washington Square East, 7th Floor New York, NY 10003 p 212.998.5880 f 212.995.4564