[email protected]http://www.flll.jku.at/staff/francisco Francisco Serdio, Edwin Lughofer, Kurt Pichler, Thomas Buchegger, Hajrudin Efendic Condition Monitoring at Rolling Mills with Data-Driven Residual-Based Fault Detection Francisco Serdio Fernández Department of Knowledge-Based Mathematical Systems Johannes Kepler University Linz - Austria
Francisco Serdio, Edwin Lughofer, Kurt Pichler, Thomas Buchegger, Hajrudin Efendic
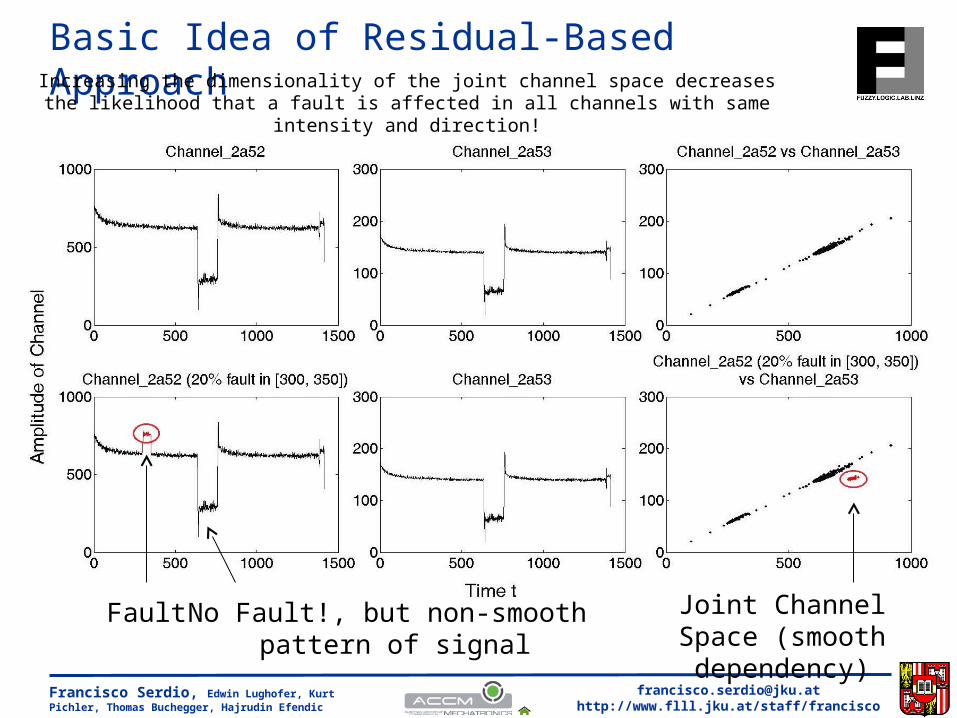
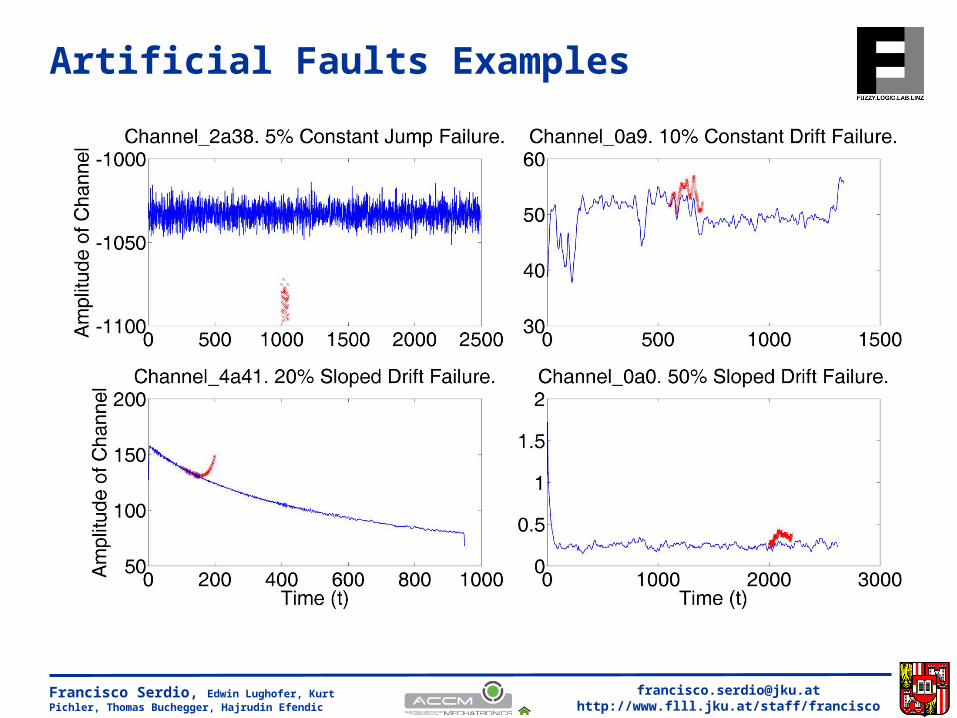
Basic Idea of Residual-Based Approach
Fault No Fault!, but non-smooth pattern of signal
Joint Channel Space (smooth dependency)
Increasing the dimensionality of the joint channel space decreases the likelihood that a fault is affected in all channels with same intensity and direction!
“T. Hastie, R. Tibshirani, and J. Friedman. The Elements of Statistical Learning: Data Mining, Inference and Prediction - Second Edition. Springer, New York Berlin Heidelberg, 2009“
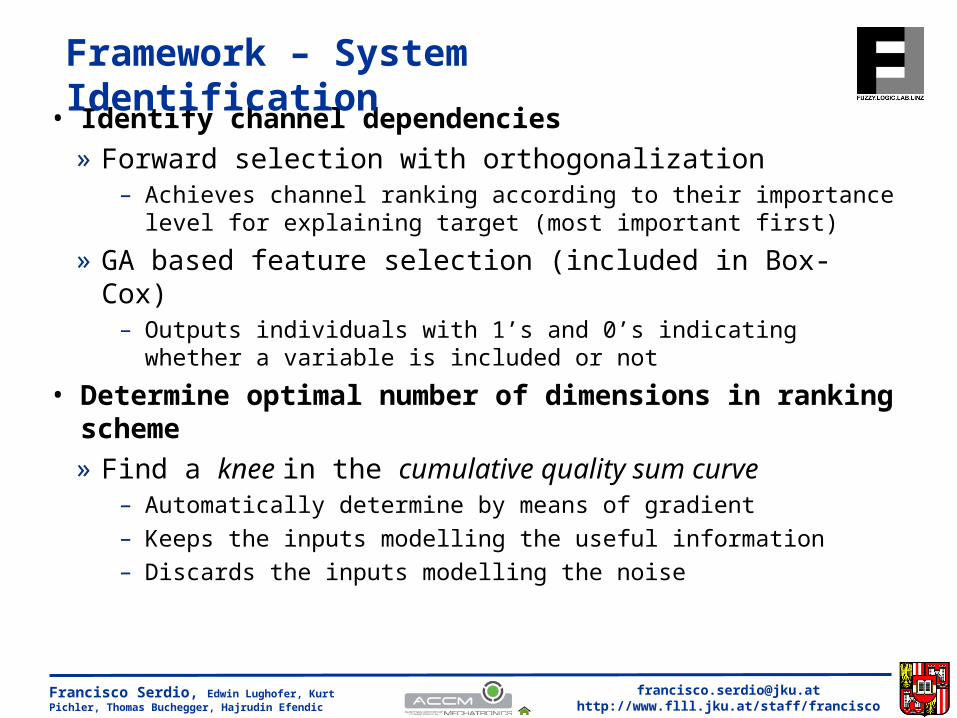
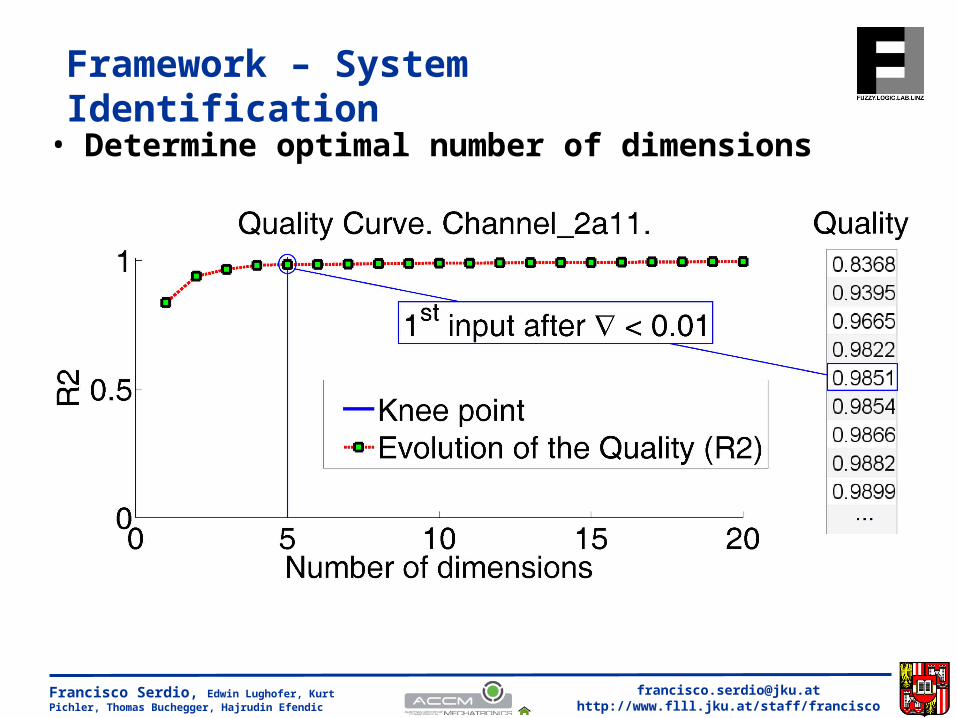
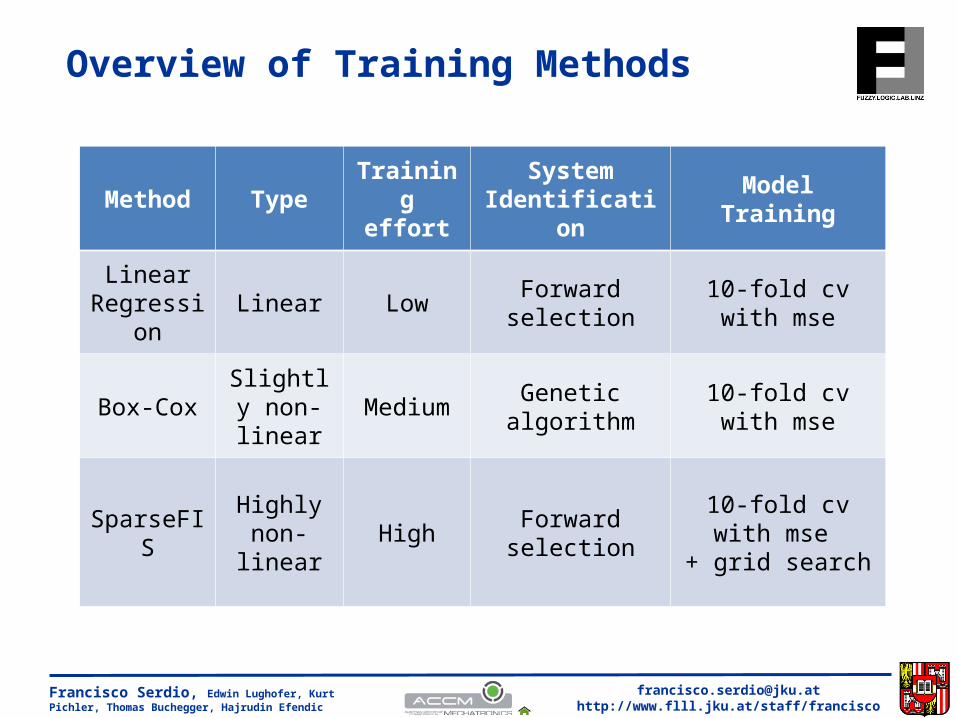
– Global MLR with Tichonov regularization included
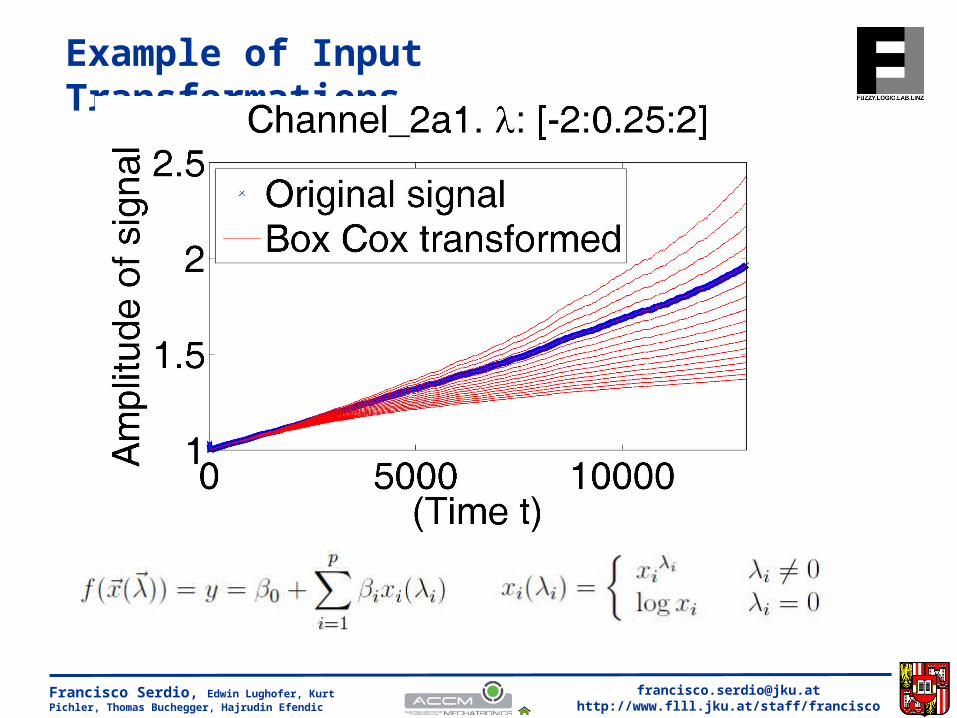
» Genetic Box-Cox (slightly non-linear)”R.M. Sakia. The Box-Cox transformation technique: a review. The Statistician, 41:168--178, 1992.“
– Combining original Box-Cox with GA Transform the inputs to introduce slight non-linearities
Use linear regression over the transformed inputs
The transformations are learnt using a GA
» SparseFIS (highly non-linear)“E. Lughofer and S. Kindermann. SparseFIS: Data-driven learning of fuzzy systems with sparsity constraints. IEEE Transactions on Fuzzy Systems, 18(2): 396--411, 2010.“
– Top down fuzzy modeling approach applying numerical sparsity constraints optimization, out-weighting unimportant rules and parameters
– Employing iterative VQ, projected gradient descent and Semi-Smooth Newton
Francisco Serdio, Edwin Lughofer, Kurt Pichler, Thomas Buchegger, Hajrudin Efendic
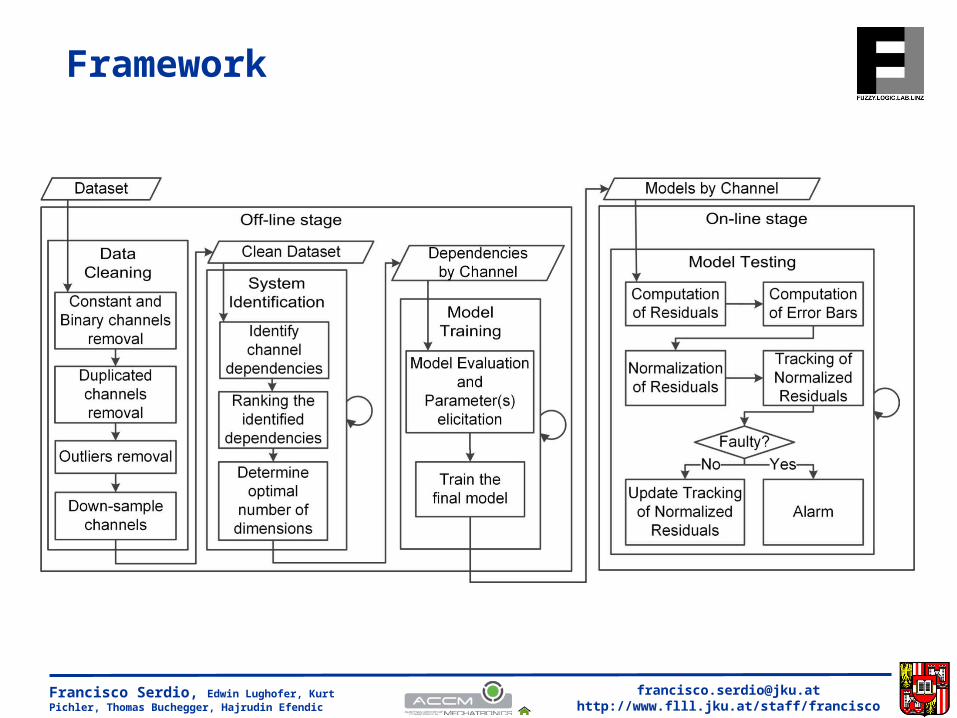
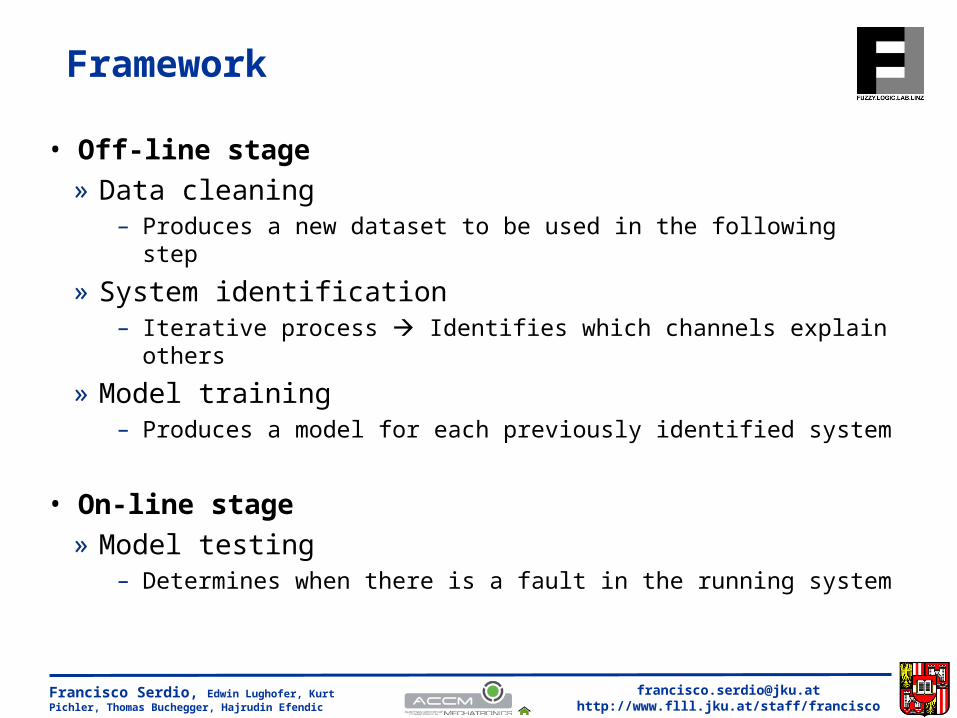
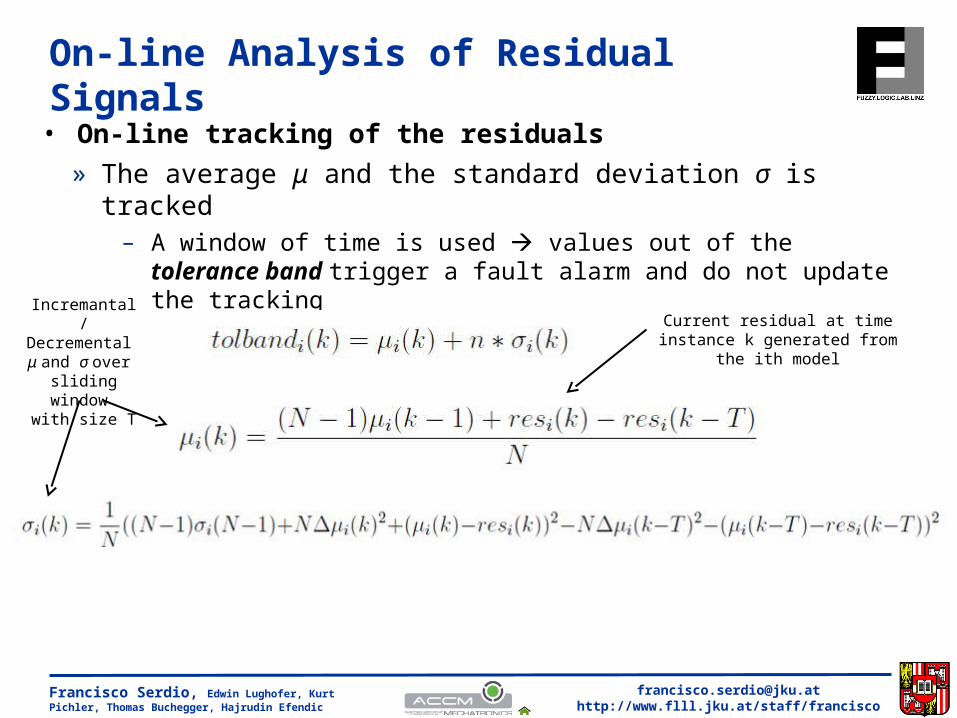
• Computation of residuals
» The residuals are the differences between the observed values and the predicted ones
• Computation of error bars
» Two types: global and local– Global: based on CV model error a unique value for each point in
the testing data set is provided
– Local: based on adaptive confidence intervals according to variation in the data distribution over space a different value for each point in the testing data set is provided
• Combine residuals and error bars
» The error bars are used to normalize the residuals– The residuals are now expressed in error bar units
Francisco Serdio, Edwin Lughofer, Kurt Pichler, Thomas Buchegger, Hajrudin Efendic
• Principal Components Analysis – PCA» State of the art in fault detection
– D. Garcia-Alvarez. Fault detection using principal component analysis (pca) in a wastewater treatment plant (wwtp). In Proceedings of the 62-th Int. Student's Scientic Conference, 13-17, Saint-Peterburg, Russia, 2009.
– P.F. Odgaard, B. Lin, and S.B. Jorgensen. Observer and data-driven-model-based fault detection in power plant coal mills. IEEE Transactions on Energy Conversion, 23(2): 659-668, 2008.
» The monitoring can be reduced to two variables (T2 and Q) characterizing two orthogonal subsets of the original space
– T-Hotelling (T2) represents the major variation in the data
Francisco Serdio, Edwin Lughofer, Kurt Pichler, Thomas Buchegger, Hajrudin Efendic
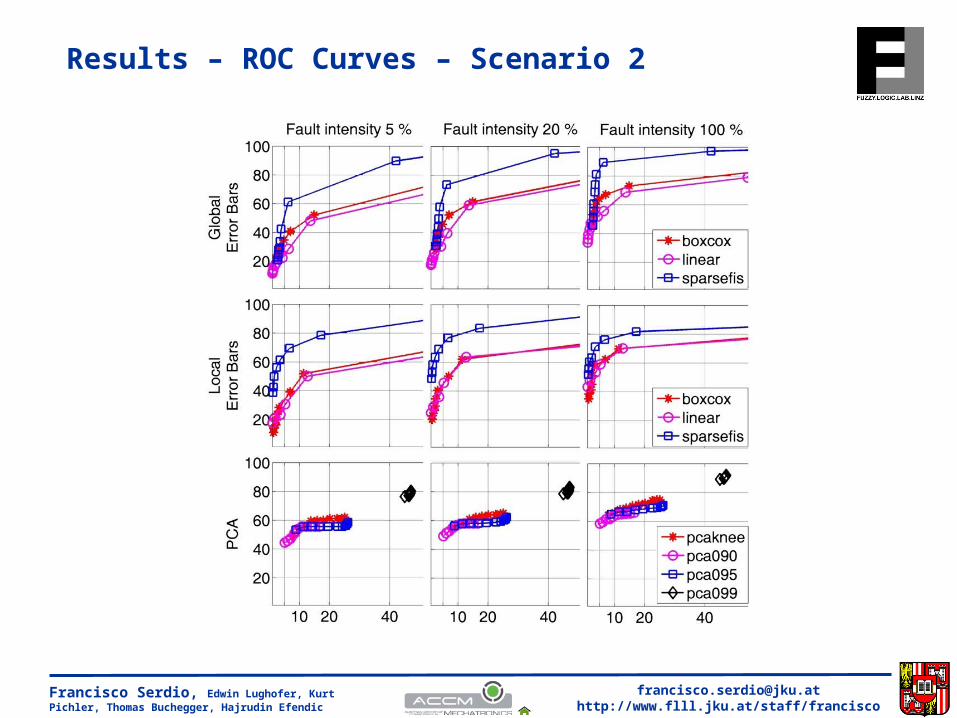
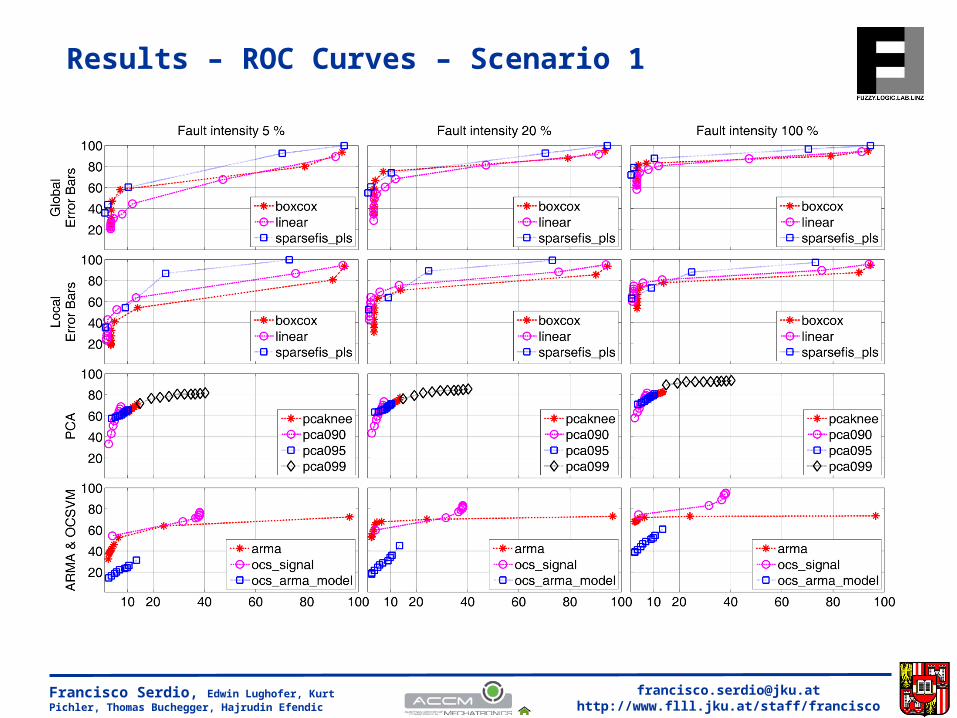
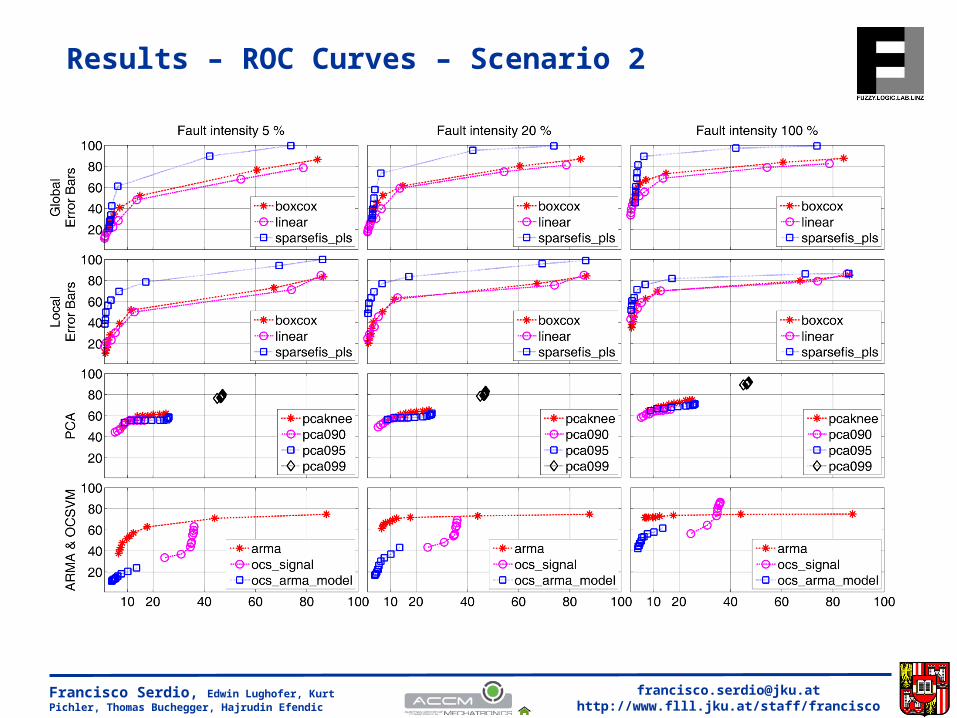
Results
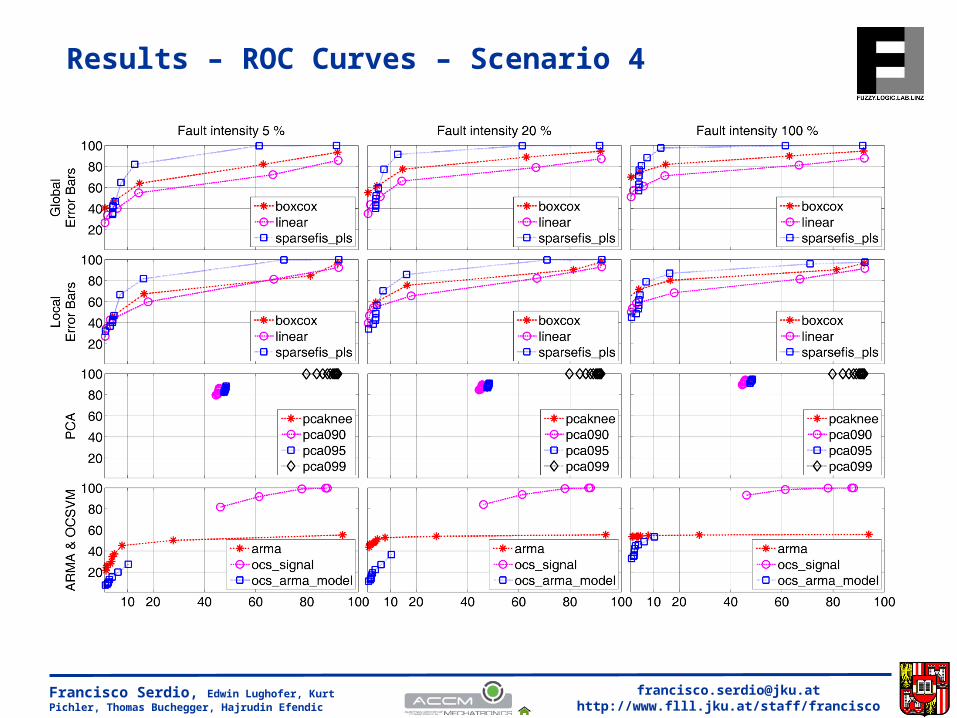
• ROC Curves» For sensibility analysis facing true positives vs. false
positives Detection vs. Overdetection
» Depict the following useful information– How much the detection rate influences the overdetection rate– How much sensible is the method to its parameters– Which method is best
– A higher AUC (Area Under the Curve) points to a better method, as higher detection rates (y-axis, values far from x-axis) can be achieved with lower false alarm rates (x-axis, values close to y-axis).
Francisco Serdio, Edwin Lughofer, Kurt Pichler, Thomas Buchegger, Hajrudin Efendic
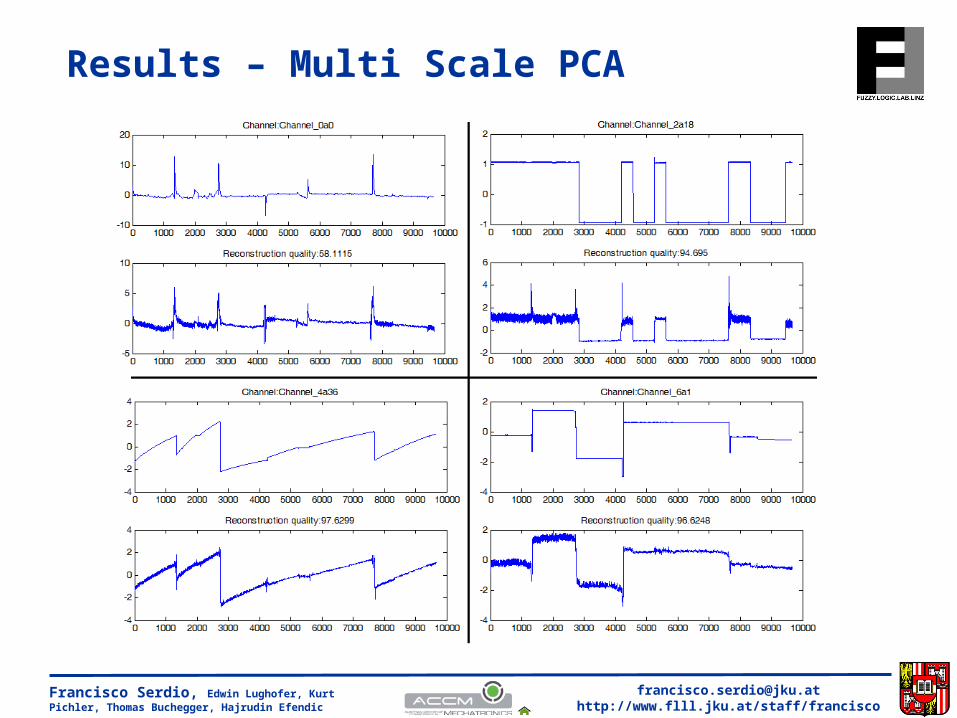
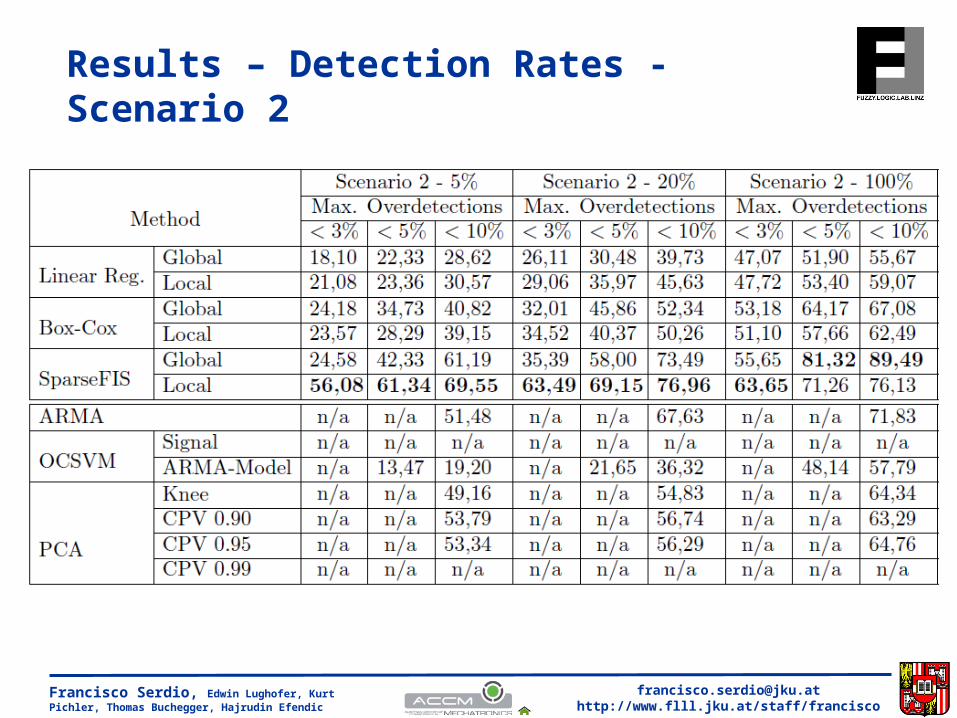
• MSPCA is not applicable in our problem
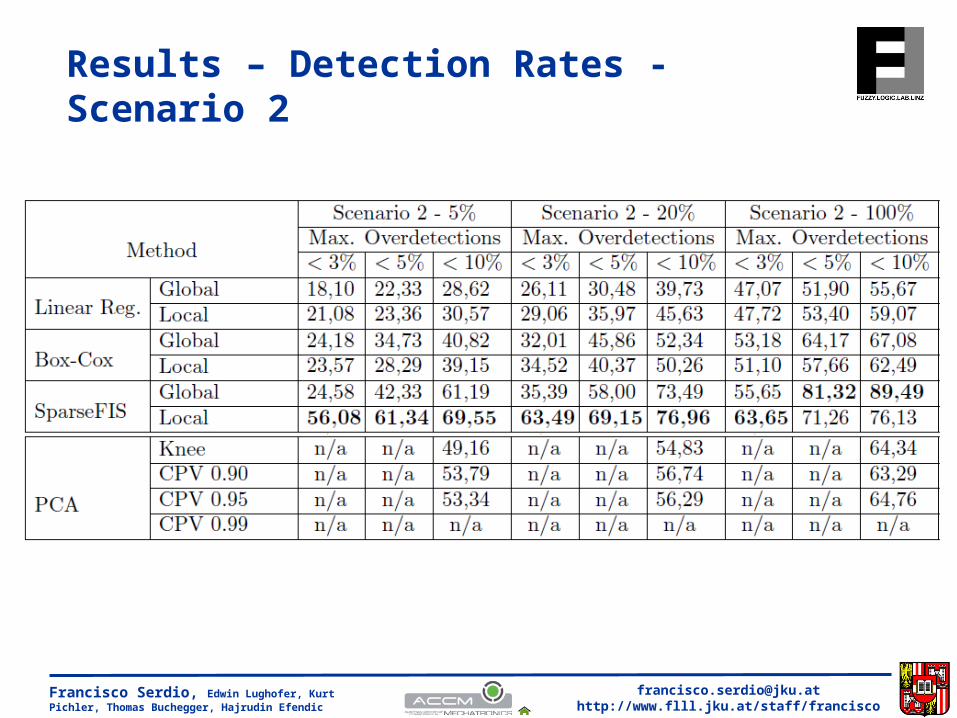
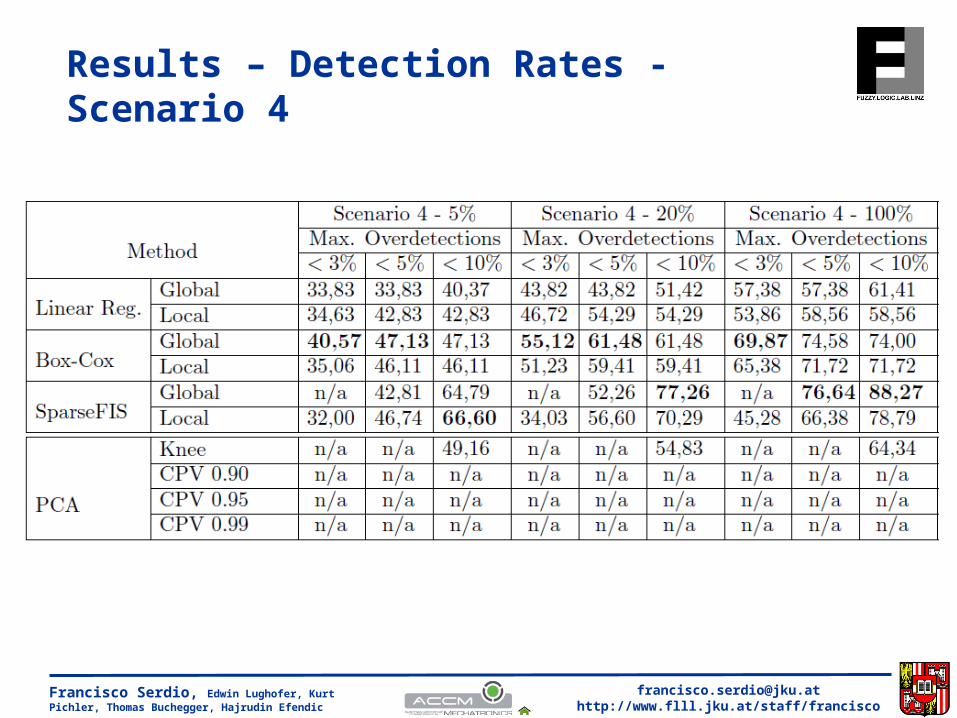
• PCA is either not applicable or outperformed by our residual-based approach
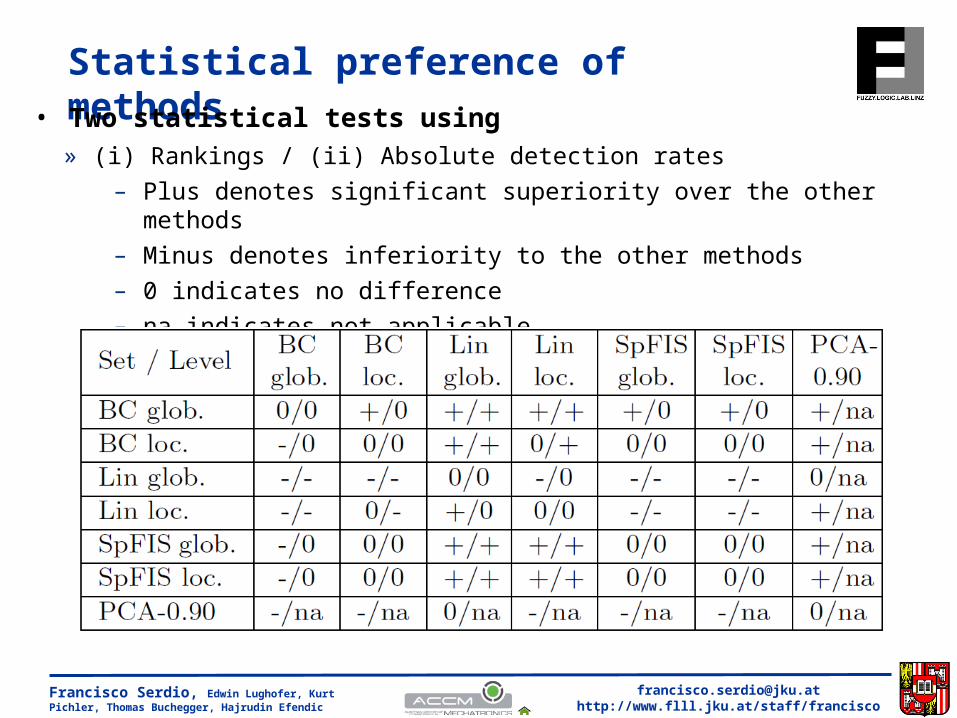
• In the pessimistic (real-world) case, Box-Cox showed best performance, thus favoring slight non-linearities in the models
• A significant performance boost over pessimistic case could be recognized for all models times» Fault misses can be largely explained by having not a (good) model