Page 1
© 2015 UZH, CSG@IFI
VoIP-based Calibration of the DQX Model
Christos Tsiaras, Manuel Rösch, Burkhard StillerDepartment of Informatics IFI, Communication Systems Group CSG,
University of Zürich UZH[tsiaras,stiller]@ifi.uzh.ch [email protected]
IFIP Networking 2015, Toulouse, France, May 20, 2015
QoE Models for VoIPDQX and Goals
Experiments and ResultsConclusion
Page 2
© 2015 UZH, CSG@IFI
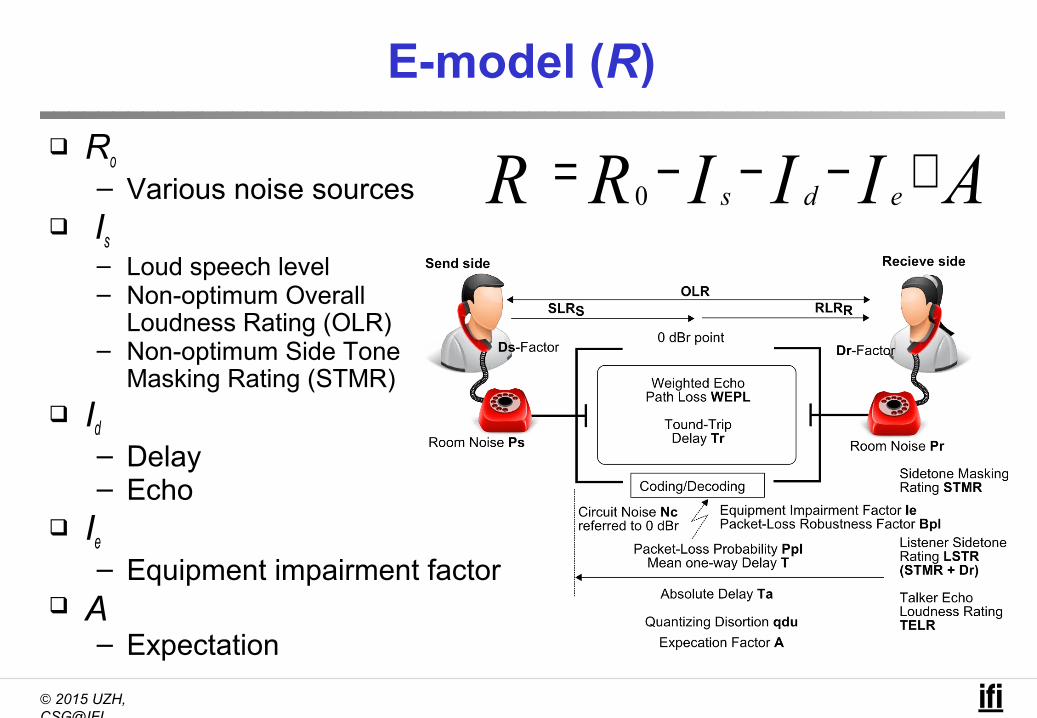
E-model (R)
Ro
– Various noise sources Is
– Loud speech level– Non-optimum Overall
Loudness Rating (OLR)– Non-optimum Side Tone
Masking Rating (STMR) Id
– Delay– Echo
Ie
– Equipment impairment factor A
– Expectation
R =0R −
sI −dI −
eI +A
Page 3
© 2015 UZH, CSG@IFI
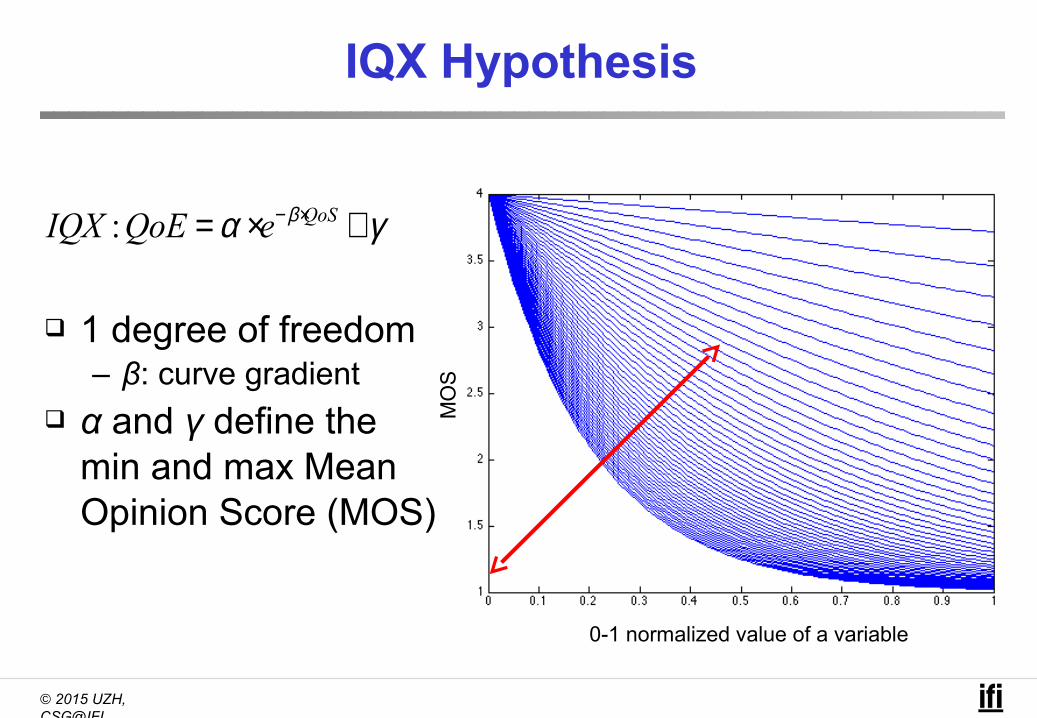
IQX Hypothesis
IQX :QoE = α ×e−β×QoS +γ
1 degree of freedom– β: curve gradient
α and γ define the min and max Mean Opinion Score (MOS)
0-1 normalized value of a variable
MO
S
Page 4
© 2015 UZH, CSG@IFI
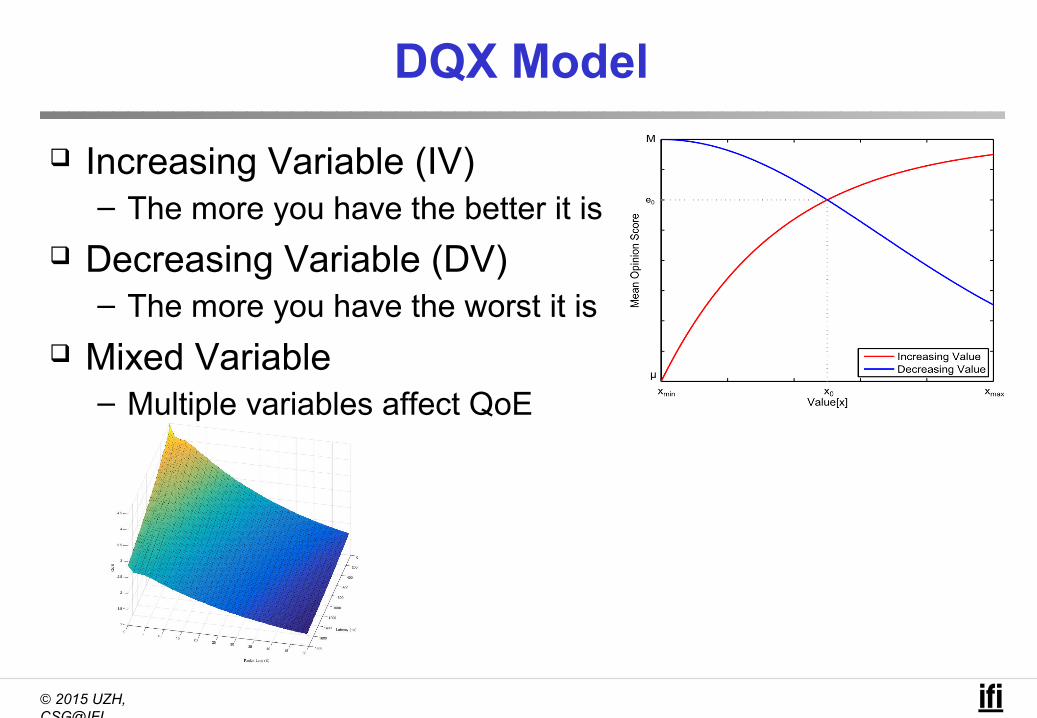
DQX Model
Increasing Variable (IV)– The more you have the better it is
Decreasing Variable (DV)– The more you have the worst it is
Mixed Variable– Multiple variables affect QoE
Page 5
© 2015 UZH, CSG@IFI
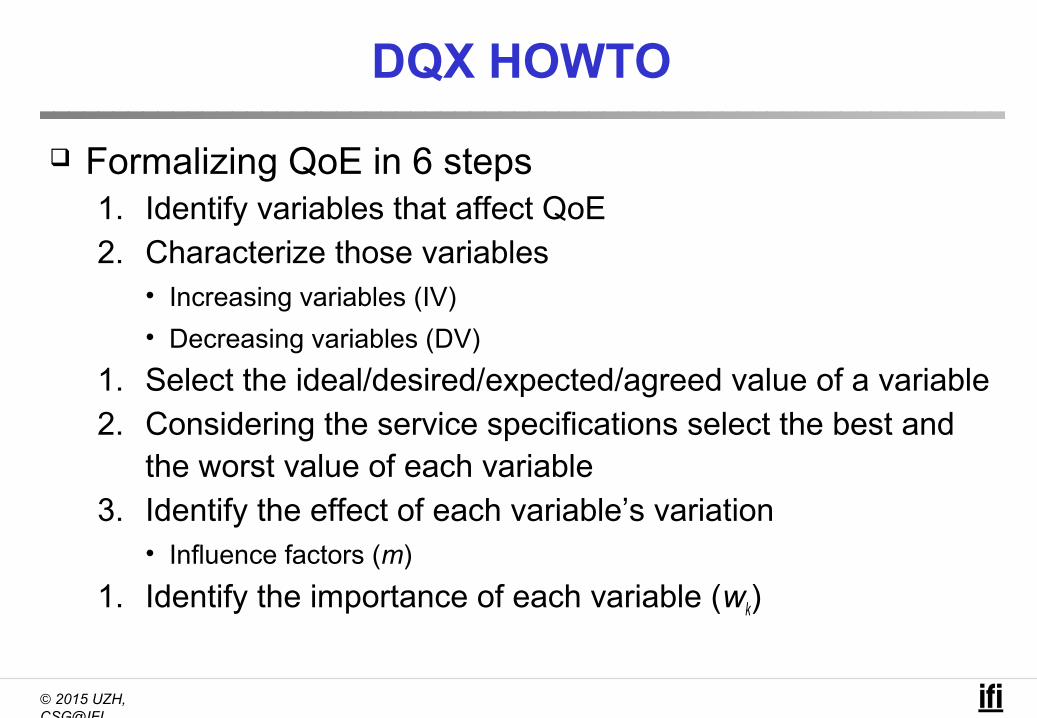
DQX HOWTO
Formalizing QoE in 6 steps1. Identify variables that affect QoE2. Characterize those variables
• Increasing variables (IV)
• Decreasing variables (DV)
1. Select the ideal/desired/expected/agreed value of a variable2. Considering the service specifications select the best and
the worst value of each variable3. Identify the effect of each variable’s variation
• Influence factors (m)
1. Identify the importance of each variable (wk)
Page 6
© 2015 UZH, CSG@IFI
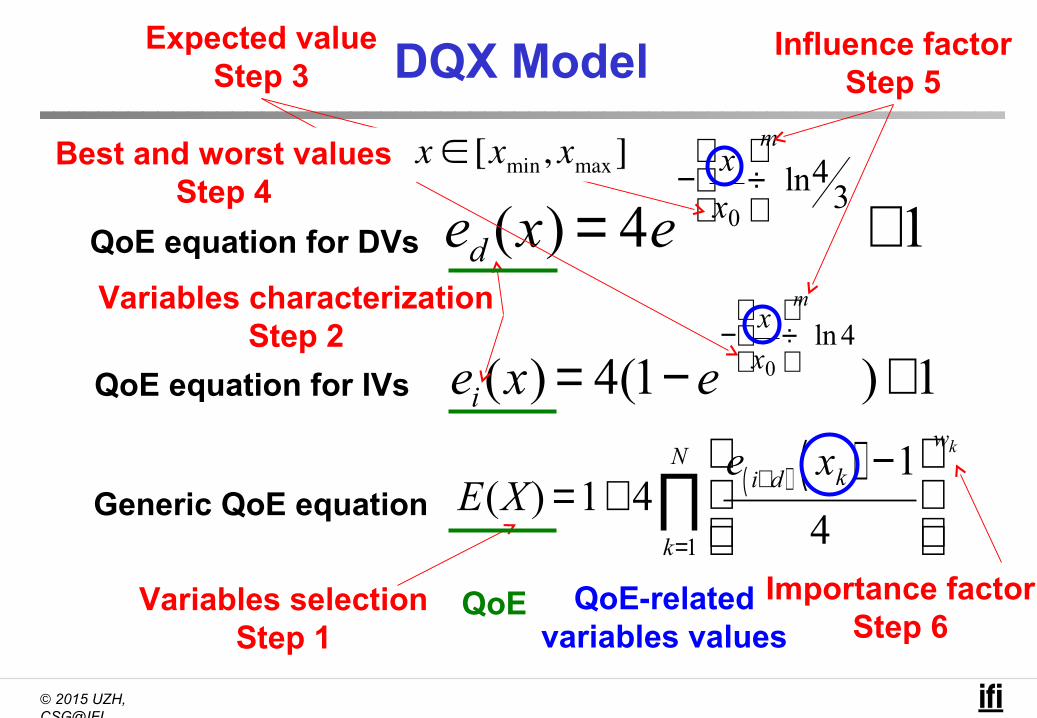
DQX Model
ed (x) = 4e− x
x0
÷m
ln43+1QoE equation for DVs
ei (x) = 4(1− e− x
x0
÷m
ln 4
)+1QoE equation for IVs
E(X) =1+ 4e i∨d( ) xk( ) −1
4
k=1
N
∏wk
Generic QoE equation
Importance factorStep 6
Influence factorStep 5
Expected valueStep 3
Variables selectionStep 1
Variables characterizationStep 2
QoE QoE-related variables values
Best and worst valuesStep 4
Page 7
© 2015 UZH, CSG@IFI
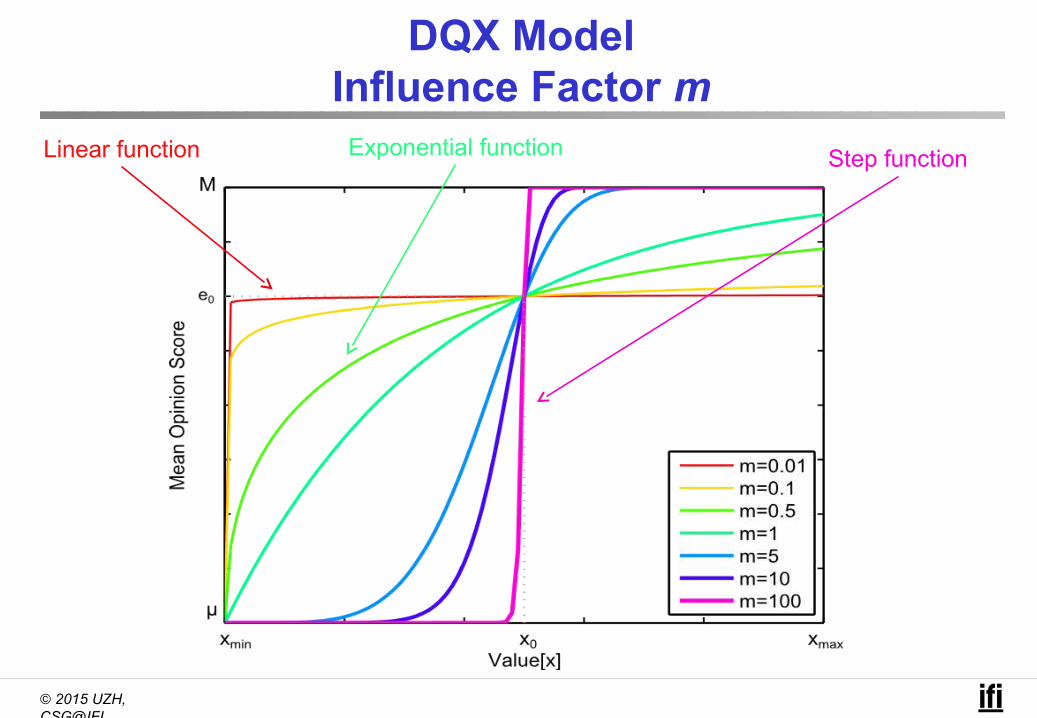
DQX ModelInfluence Factor m
Exponential functionLinear function Step function
Page 8
© 2015 UZH, CSG@IFI
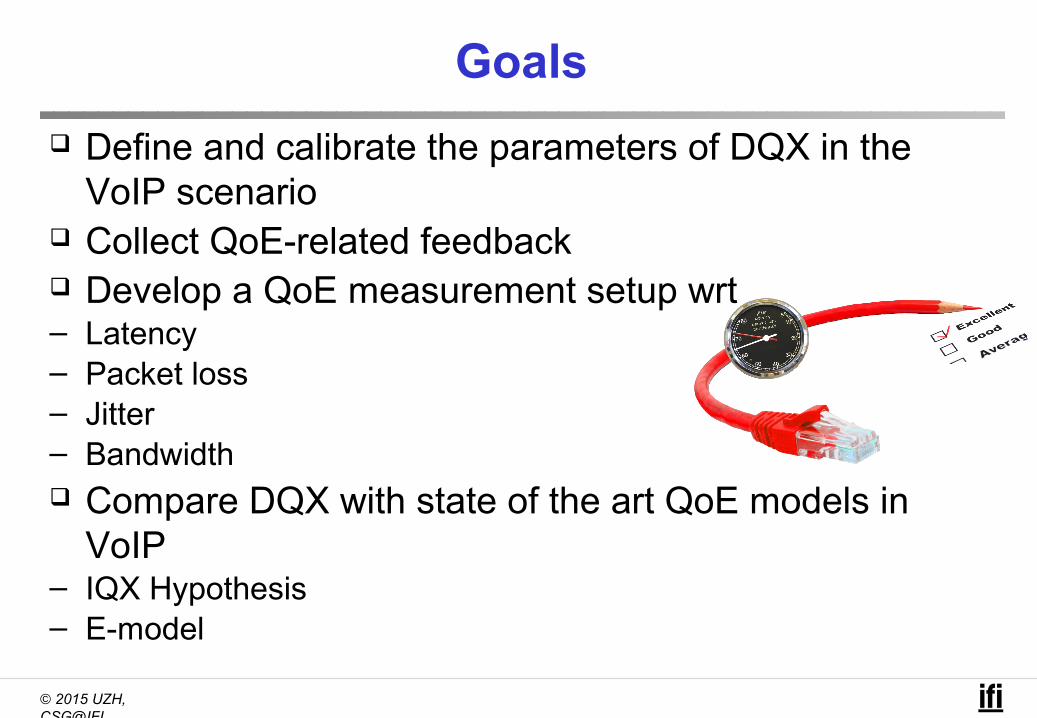
Goals
Define and calibrate the parameters of DQX in the VoIP scenario
Collect QoE-related feedback Develop a QoE measurement setup wrt– Latency– Packet loss– Jitter– Bandwidth Compare DQX with state of the art QoE models in
VoIP– IQX Hypothesis– E-model
Page 9
© 2015 UZH, CSG@IFI
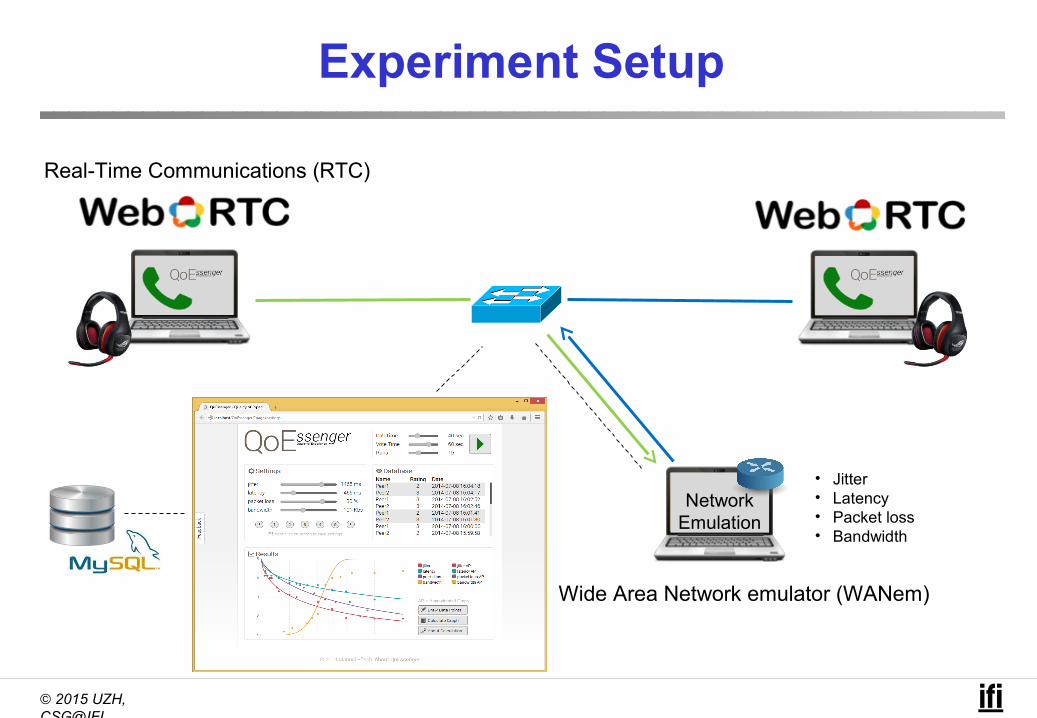
Experiment Setup
NetworkEmulation
• Jitter• Latency • Packet loss• Bandwidth
Real-Time Communications (RTC)
Wide Area Network emulator (WANem)
Page 10
© 2015 UZH, CSG@IFI
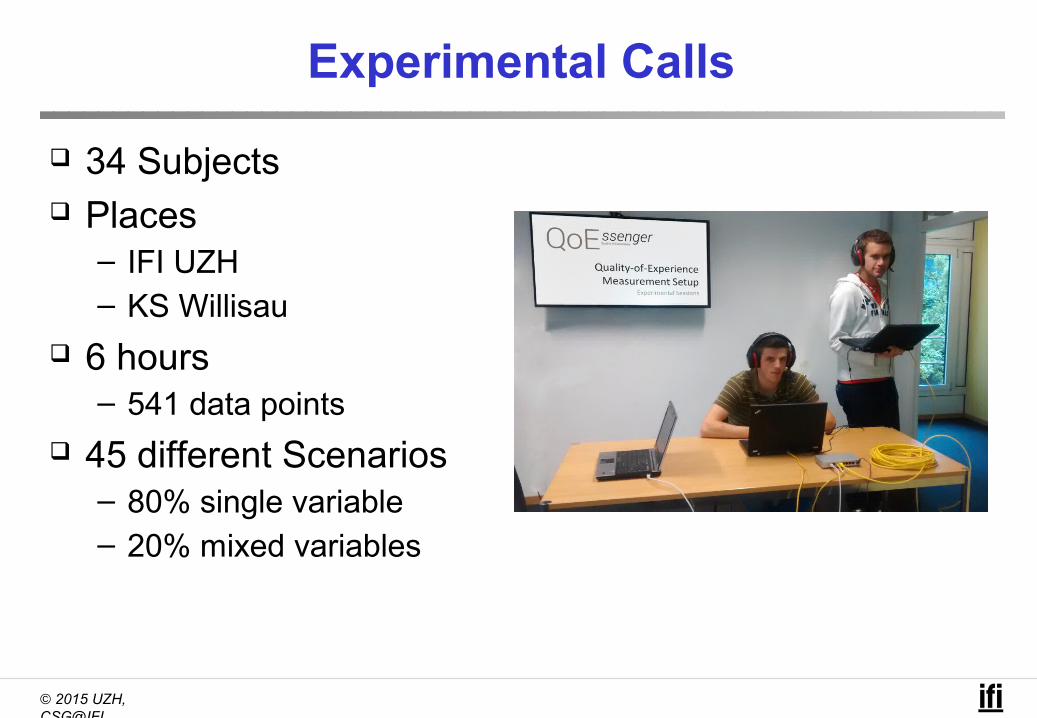
Experimental Calls
34 Subjects Places
– IFI UZH– KS Willisau
6 hours– 541 data points
45 different Scenarios– 80% single variable– 20% mixed variables
Page 11
© 2015 UZH, CSG@IFI
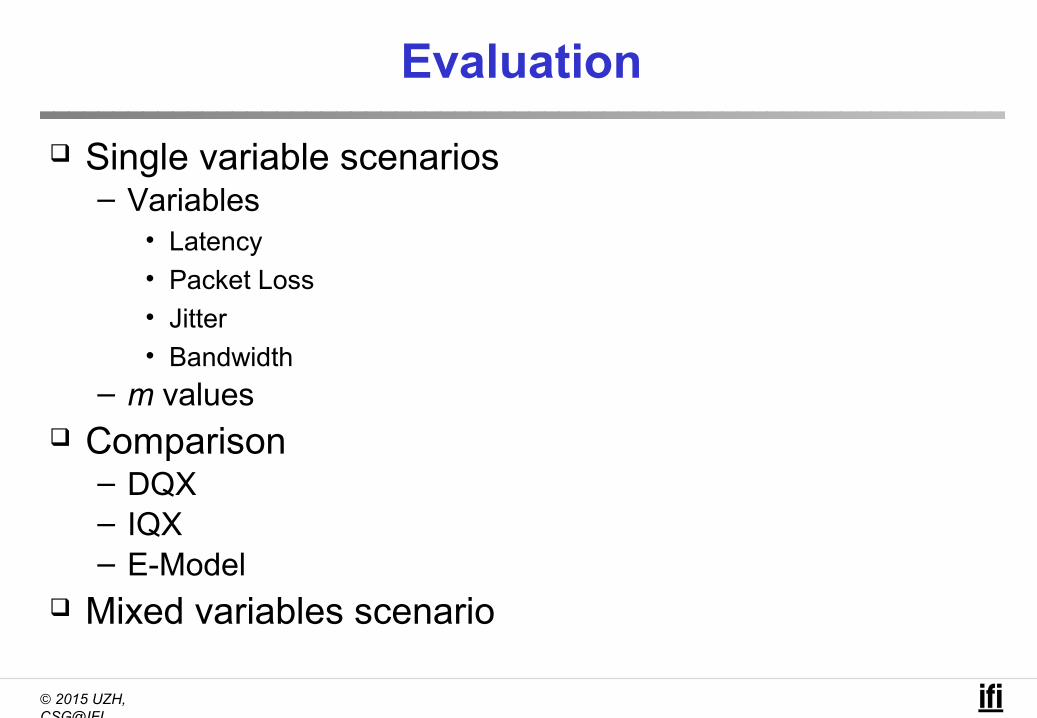
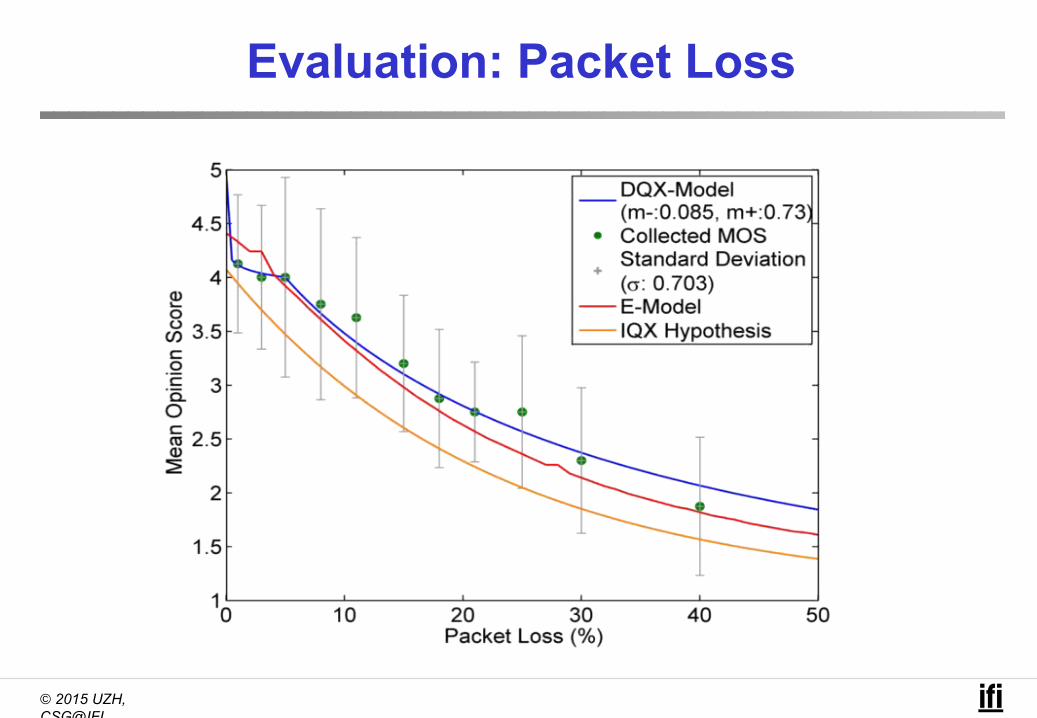
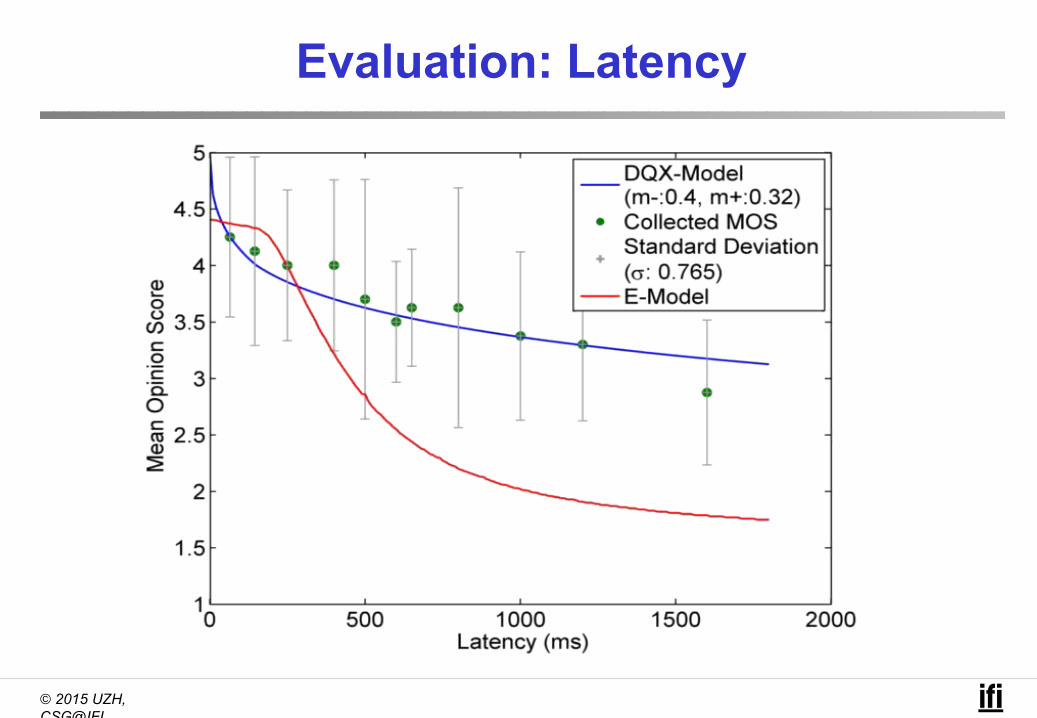
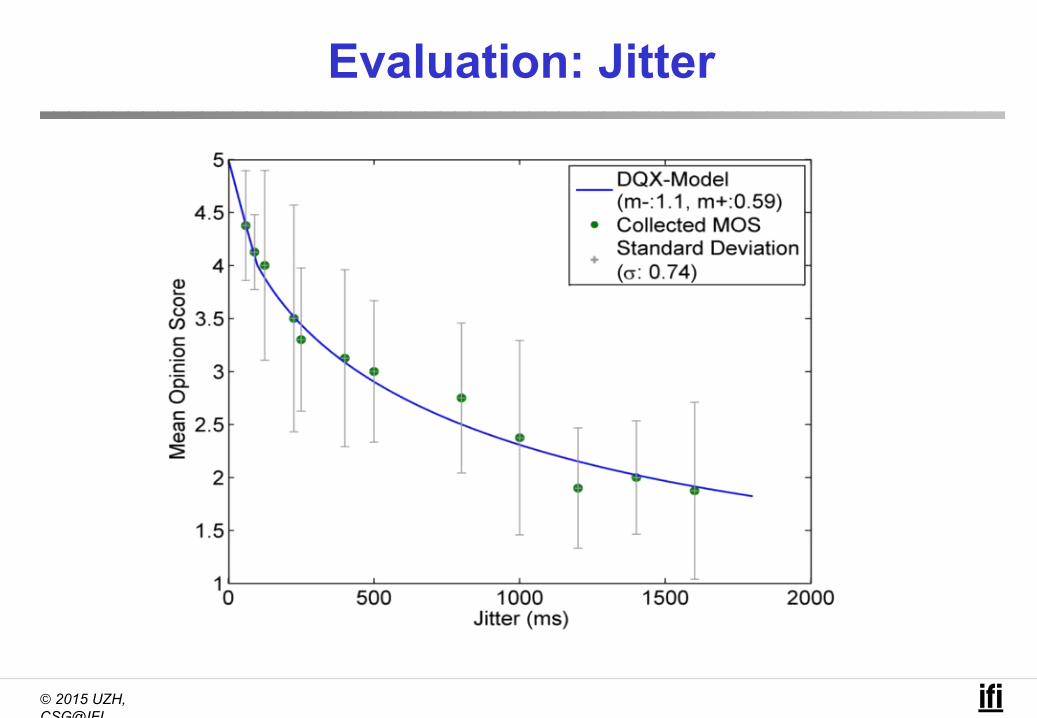
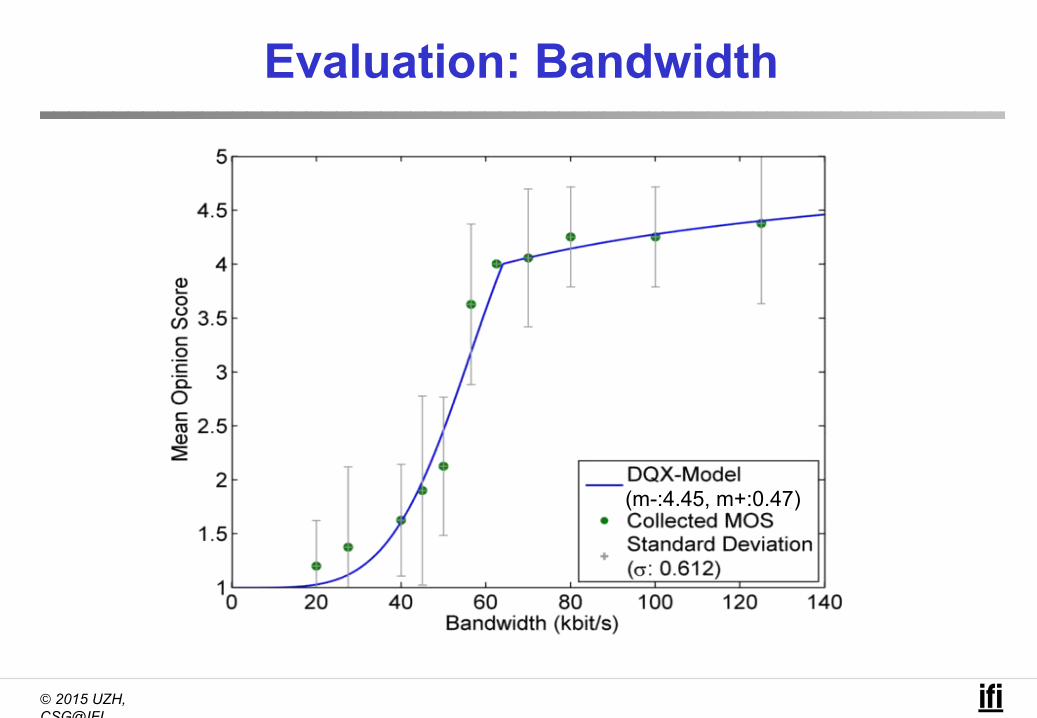
Evaluation
Single variable scenarios– Variables
• Latency• Packet Loss• Jitter• Bandwidth
– m values Comparison
– DQX– IQX– E-Model
Mixed variables scenario
Page 12
© 2015 UZH, CSG@IFI
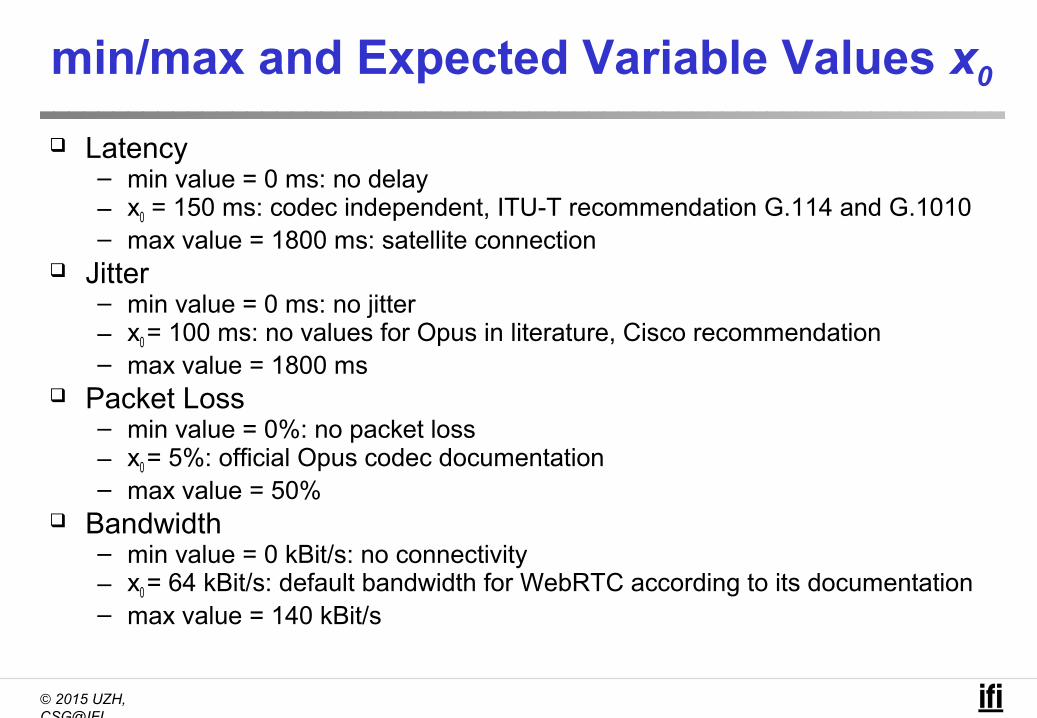
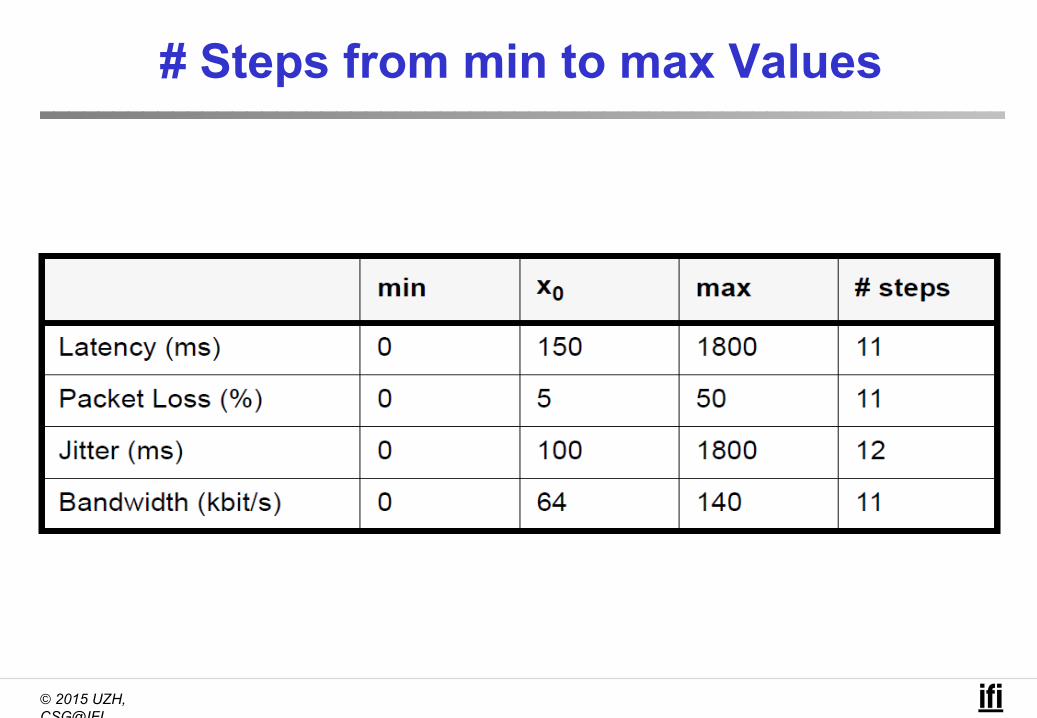
min/max and Expected Variable Values x0 Latency
– min value = 0 ms: no delay– x0 = 150 ms: codec independent, ITU-T recommendation G.114 and G.1010– max value = 1800 ms: satellite connection
Jitter– min value = 0 ms: no jitter– x0 = 100 ms: no values for Opus in literature, Cisco recommendation– max value = 1800 ms
Packet Loss– min value = 0%: no packet loss– x0 = 5%: official Opus codec documentation– max value = 50%
Bandwidth– min value = 0 kBit/s: no connectivity– x0 = 64 kBit/s: default bandwidth for WebRTC according to its documentation– max value = 140 kBit/s
Page 13
© 2015 UZH, CSG@IFI
Evaluation: Packet Loss
Page 14
© 2015 UZH, CSG@IFI
Evaluation: Latency
Page 15
© 2015 UZH, CSG@IFI
Evaluation: Jitter
Page 16
© 2015 UZH, CSG@IFI
Evaluation: Bandwidth
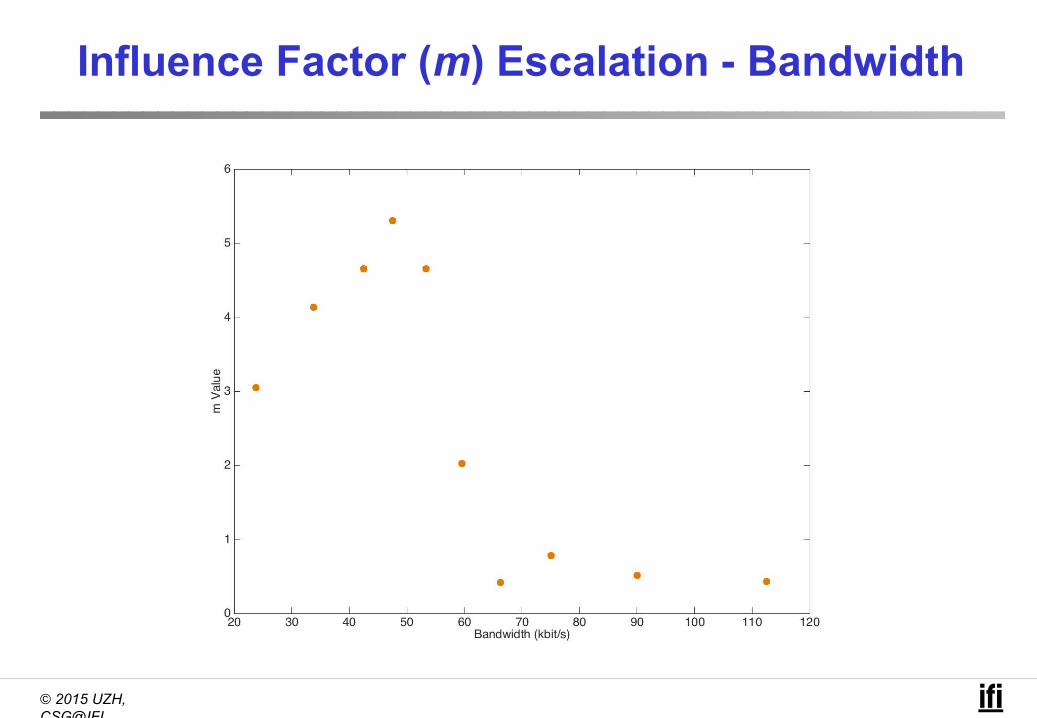
(m-:4.45, m+:0.47)
Page 17
© 2015 UZH, CSG@IFI
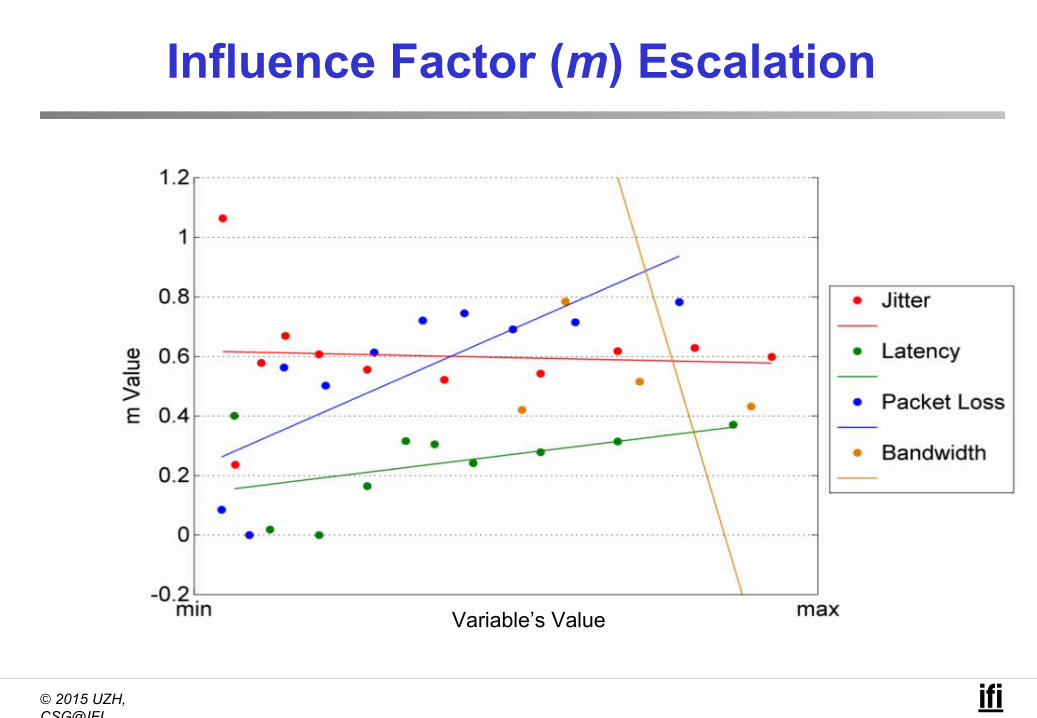
Influence Factor (m) Escalation
Variable’s Value
Page 18
© 2015 UZH, CSG@IFI
Influence Factor (m) Escalation - Bandwidth
Page 19
© 2015 UZH, CSG@IFI
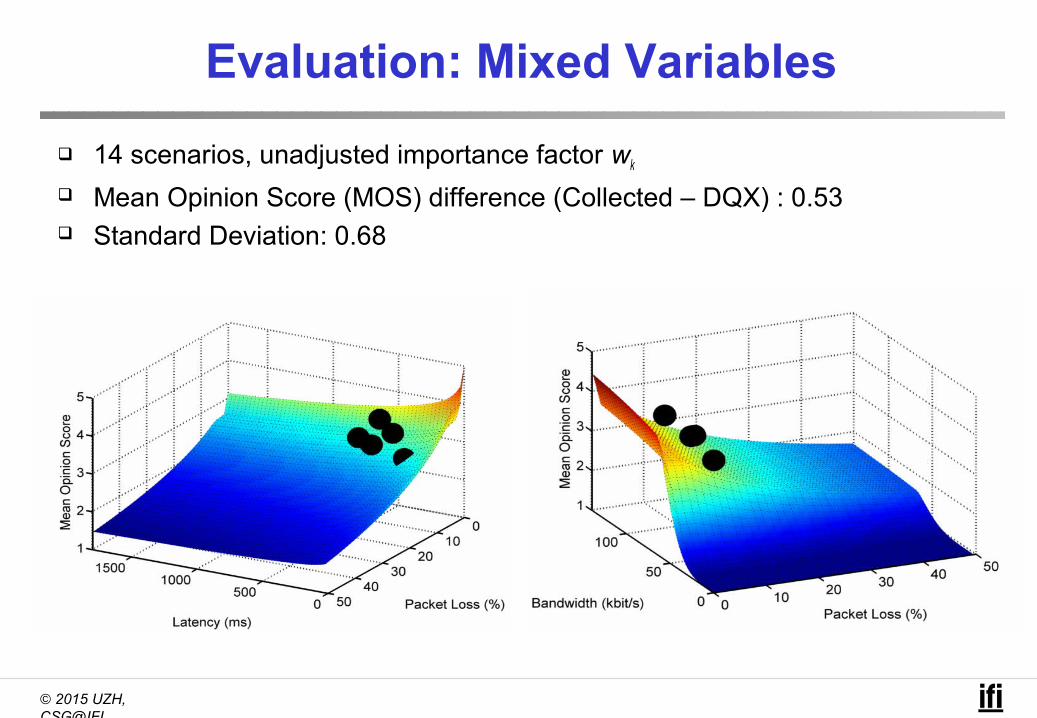
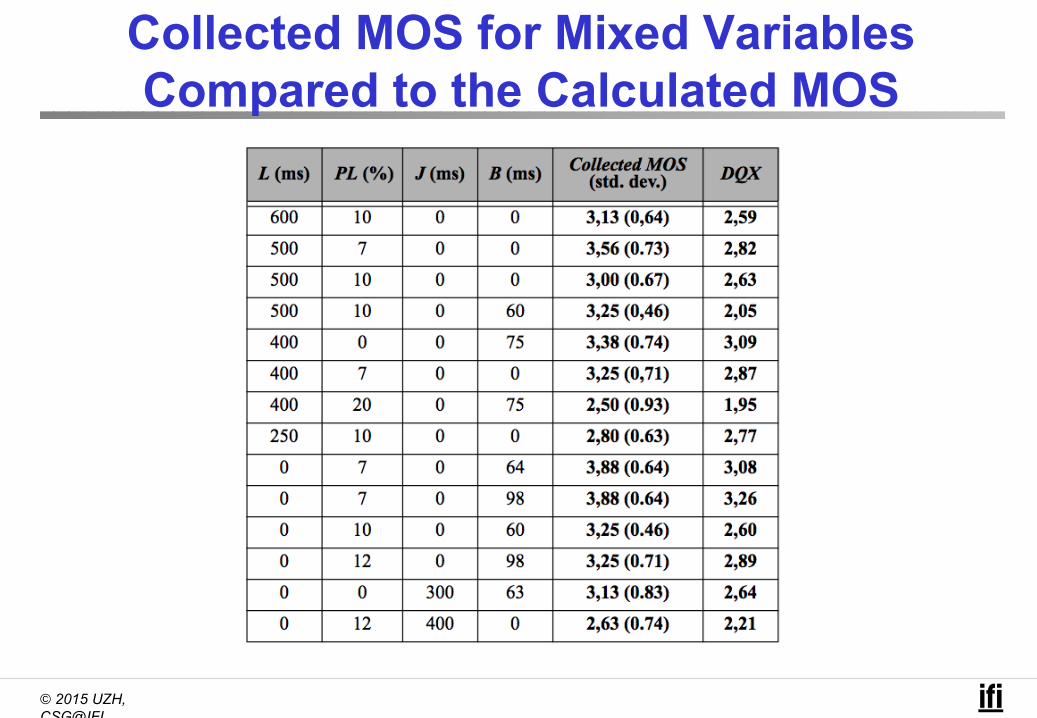
Evaluation: Mixed Variables
14 scenarios, unadjusted importance factor wk
Mean Opinion Score (MOS) difference (Collected – DQX) : 0.53 Standard Deviation: 0.68
Page 20
© 2015 UZH, CSG@IFI
Conclusion & Future Work
Conclusion– DQX is flexible– Influence factor m is not constant– Importance factors w and further calibration of the min, max, expected values
can improve the DQX results – Critical thoughts
• Subjects: men between 20 and 25• Headsets and duration of the test calls• WebRTC, Browser Interoperability
Future Work– QoE measurement setup
• Other variables• More tests• Different services
– Videoconference– Video streaming
– Further analysis of the m value and the formula for mixed variables
Page 21
© 2015 UZH, CSG@IFI
Thank you!
Q&A
Page 22
© 2015 UZH, CSG@IFI
# Steps from min to max Values
Page 23
© 2015 UZH, CSG@IFI
Collected MOS for Mixed Variables Compared to the Calculated MOS
Page 24
© 2015 UZH, CSG@IFI
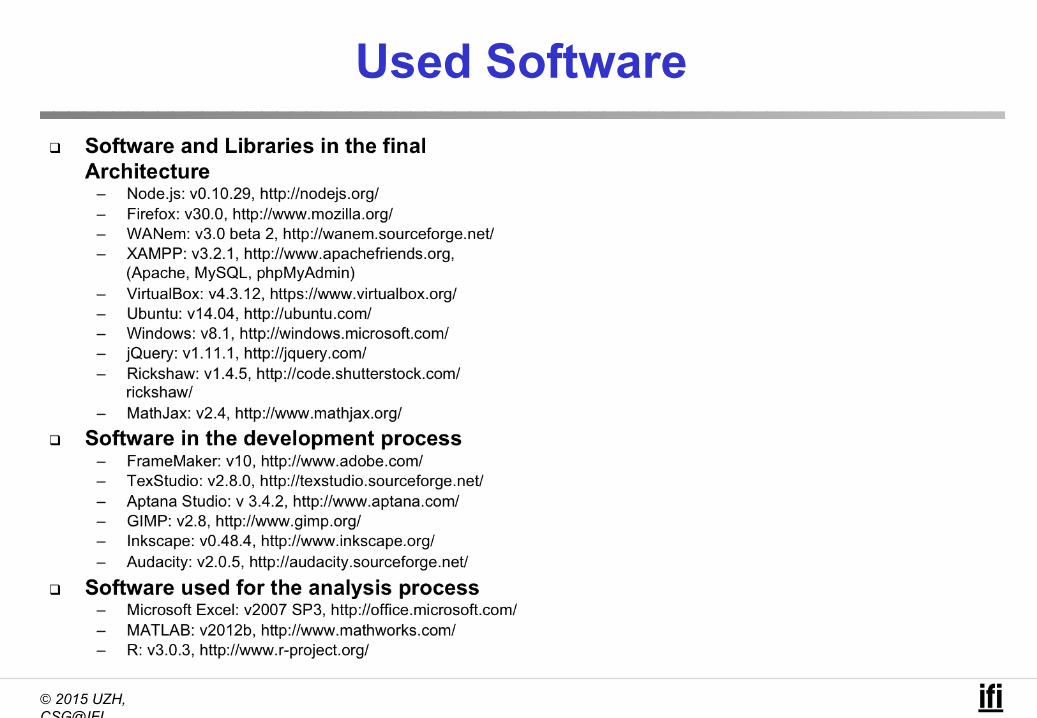
Used Software


![[ARM 15 | ACM/IFIP/USENIX Middleware 2015] Research Paper Presentation](https://static.documents.pub/doc/80x56/58f051b51a28ab74788b4635/arm-15-acmifipusenix-middleware-2015-research-paper-presentation.jpg)


