Role of Technology in PMFBY Mahalanobis National Crop Forecast Centre (MNCFC) Department of Agriculture, Cooperation & Farmers’ Welfare Ministry of Agriculture & Farmers’ Welfare, New Delhi Web: www.ncfc.gov.in, Email: [email protected]Shibendu Shankar Ray
Transcript
Role of Technology in PMFBY
Mahalanobis National Crop Forecast Centre (MNCFC)
Department of Agriculture, Cooperation & Farmers’ Welfare
Ministry of Agriculture & Farmers’ Welfare, New Delhi
Summary of block wise LSWI Groups Count Sum Average Variance
Lakhnadu 49 10.4 0.21 0.0023
Seoni Tehasil 34 9.7 0.28 0.0033
Barghat 33 11.5 0.35 0.0025
Ghansaur 29 6.7 0.23 0.0037
Kurai 16 4.8 0.30 0.0025
Kewlari 13 4.1 0.32 0.0013
ANOVA
Source of Variation SS df MS F P-value F crit
Between Groups 0.45 5 0.091 33.6 1.07E-23 2.3
Within Groups 0.45 168 0.003
Total 0.91 173
Summary of block wise Yield Groups Count Sum Average Variance
Lakhnadu 45 23153 514 89013
Seoni Tehasil 34 65409 1923 1559536
Barghat 33 82603 2503 1266351
Ghansaur 29 25712 886 365378
Kurai 16 43522 2720 1784747
Kewlari 13 11378 875 155580
ANOVA
Source of
Variation SS df MS F P-value F crit
Between Groups 122757874 6 20459646 24.74468 9.66E-21 2.15
Within Groups 134773289 163 826830
Total 257531163 169
Other Inferences from Yield Data Analysis
• The Analysis of Variance Showed the variance of yield and remote sensing indices within the block is less compared to between the blocks
• There is strong auto-correlation of yield values spatially (Range 0.65 degree)
13
Optimum Number of CCE points
• From large number of CCE points, smaller sets were selected randomly.
• Mean, standard deviation and standard error of each set were assessed.
• The optimum number of CCE is the minimum number, where the mean yield is not significantly different from the original and standard error is below a threshold value (5% for District and 10% for block)
• It was found around 30 CCEs are optimum for district level assessment and 15 CCEs for block level assessment (PMFBY Guidelines: District 24 and Block 16)
District level Block level
Yield Estimation from Remote Sensing based Indices
State Range
R2 SEE F value
Gujarat 0.40-0.78 1.69-10.04 4.72-24.84
Haryana 0.33-0.68 4.02-11.02 4.53-19.28
Karnataka 0.26-0.85 3.45-9.90 2.53-39.91
Maharashtra 0.12-0.66 8.08-22.29 1.23-18.13
Uttar Pradesh 0.35-0.85 1.21-04.55 4.51-52.61
• Yield Estimation from VCI (Vegetation Condition Index) : District level yield models for Sugarcane and Cotton
Sugarcane
Rice, r2 = 0.74 Wheat, r2 = 38
Wheat, r2 = 0.58
Semi-Physical Model Simulation Model
• Yield modelling using field data and multiple approaches
Biomass estimation from Microwave Data
Rice, r2 = 0.27
State Range
R2 SEE F value
Haryana 0.30-0.78 38.36-91.65 3.8-33.1
Maharashtra 0.22-0.71 32.13-122.32 2.6-13.7
Gujarat 0.48-0.80 68.55-97.38 6.47-20.13
Punjab 0.15-0.49 73.0-93.8 1.68-8.6
Karnataka 0.20-0.69 41.38-113.95 2.3-20.0
Cotton
NDVI Stratum LSWI Stratum
NDVI+LSWI Stratum
CCE Points Generation Steps in Kalburgi (Gulbarga) district
Dadri Block, Bhiwani District, Haryana
Landsat -8 (09-March-2016), 30 m data
Sentinel-2 (06-Feb-2016), 10 m Data
Landsat -8 (22-Feb-2016), 30 m data
Mustard
Wheat
Mustard
Wheat
Mustard
Wheat
Mustard
Wheat
Classified Map
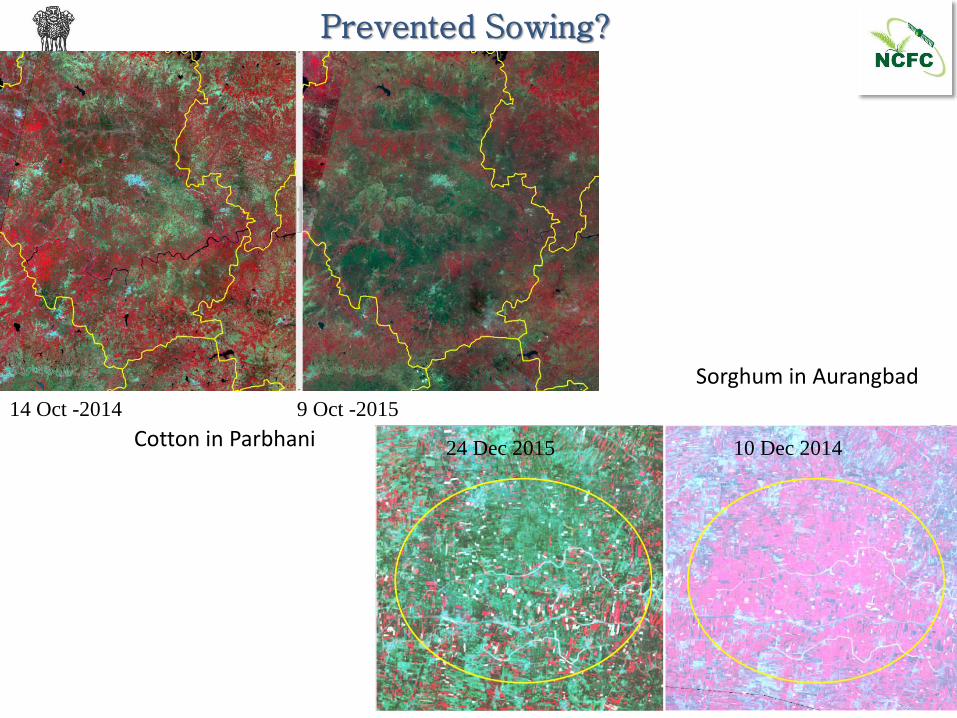
Satellite Data for Area Discrepancy
14 Oct -2014 9 Oct -2015
Cotton in Parbhani
Sorghum in Aurangbad
24 Dec 2015 10 Dec 2014
Prevented Sowing?
Agricultural Loss Assessment
Flood Affected Area
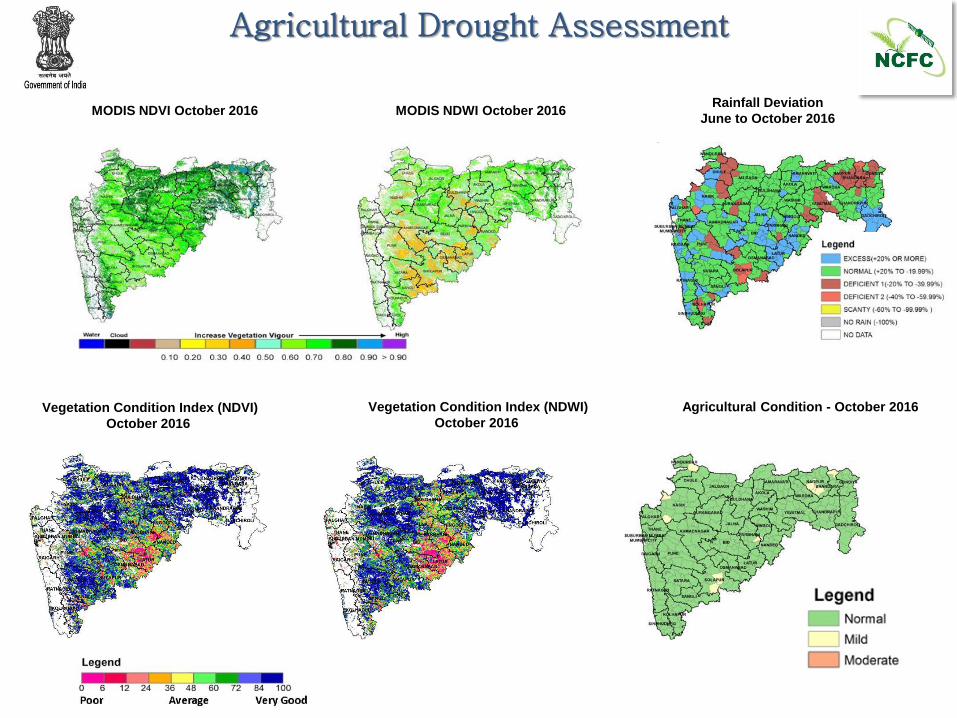
MODIS NDWI October 2016 MODIS NDVI October 2016
Agricultural Condition - October 2016 Vegetation Condition Index (NDVI)
October 2016
Vegetation Condition Index (NDWI)
October 2016
Rainfall Deviation
June to October 2016
Agricultural Drought Assessment
Other Products for Crop Insurance
Drought Frequency
(May be used for computation of Premium, Indemnity etc.)
Phenology/Crop Calendar
(May be used for Seasonality)
UAS/UAV/Drone in Agriculture
• Platform: Fixed Wing/ Rotary Wing Aircrafts with different degrees of Autonomy
• Cameras: Digital Colour, Multispectral • Flying Height: Around 50 – 200 m
• Image Resolution: Few cm to sub-meter
• Organizations in India: NECTAR, DRDO, ISRO,
DTU/IARI, Quidich, Precision Hawk, Amigo Optima, techbaaz, etc.
• Clearances Needed: • For Flying: DGCA, MHA, MoD, Local Authority • For Data Use: SoI
• Adv.: As and When (?), High Resolution • Disadv.: Low coverage, Complex Analysis
(Source: NECTAR)
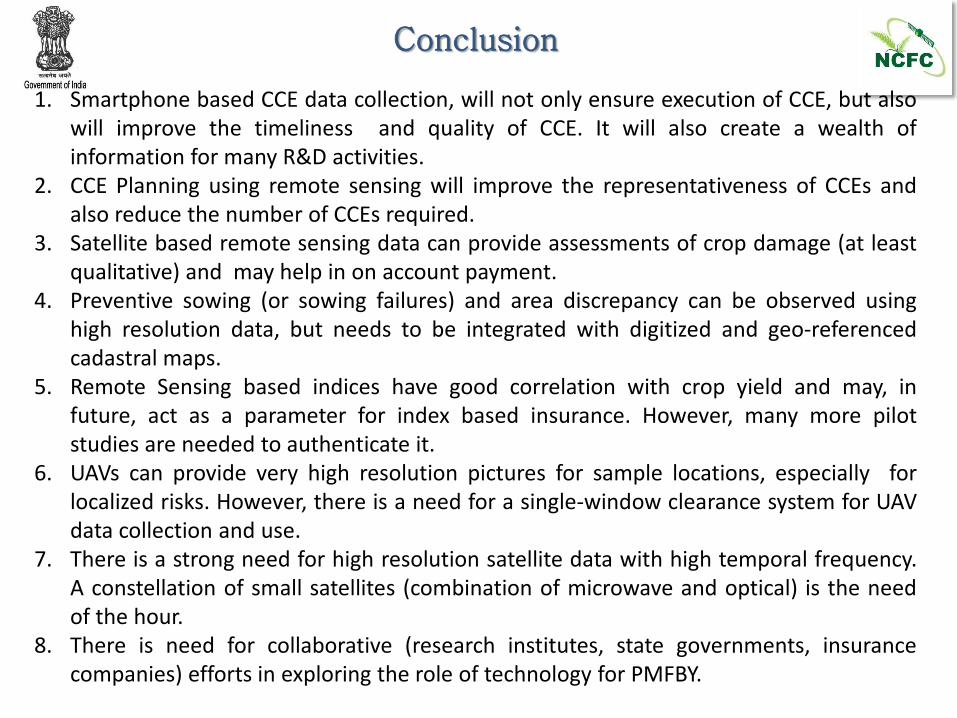
Conclusion
1. Smartphone based CCE data collection, will not only ensure execution of CCE, but also will improve the timeliness and quality of CCE. It will also create a wealth of information for many R&D activities.
2. CCE Planning using remote sensing will improve the representativeness of CCEs and also reduce the number of CCEs required.
3. Satellite based remote sensing data can provide assessments of crop damage (at least qualitative) and may help in on account payment.
4. Preventive sowing (or sowing failures) and area discrepancy can be observed using high resolution data, but needs to be integrated with digitized and geo-referenced cadastral maps.
5. Remote Sensing based indices have good correlation with crop yield and may, in future, act as a parameter for index based insurance. However, many more pilot studies are needed to authenticate it.
6. UAVs can provide very high resolution pictures for sample locations, especially for localized risks. However, there is a need for a single-window clearance system for UAV data collection and use.
7. There is a strong need for high resolution satellite data with high temporal frequency. A constellation of small satellites (combination of microwave and optical) is the need of the hour.
8. There is need for collaborative (research institutes, state governments, insurance companies) efforts in exploring the role of technology for PMFBY.
Acknowledgment
Thank You
The results presented here have been derived from the KISAN (C[K}rop Insurance using Space technology And geoiNFormatics) Project of DAC&FW, MoAFW