Page 1
Click to edit Master title style
• Click to edit Master text styles
• Second level
• Third level
• Fourth level
• Fifth level
Slide 1 0
Influence Network Mapping
Toolbox
Eva Schiffer, IFPRI
Eva [email protected]
http://netmap.ifpriblog.org
IFPRI
Tool Pool Seminar
14th May 2008
Page 2
Click to edit Master title style
• Click to edit Master text styles
• Second level
• Third level
• Fourth level
• Fifth level
1
Structure Part 1: 12:30 – 2:00
• Introduction: The Basin Board’s Dilemma
• What is Net-Map?
• How to do Net-Map step-by-step
• Basic network parameters
• Case-study examples
Page 3
Click to edit Master title style
• Click to edit Master text styles
• Second level
• Third level
• Fourth level
• Fifth level
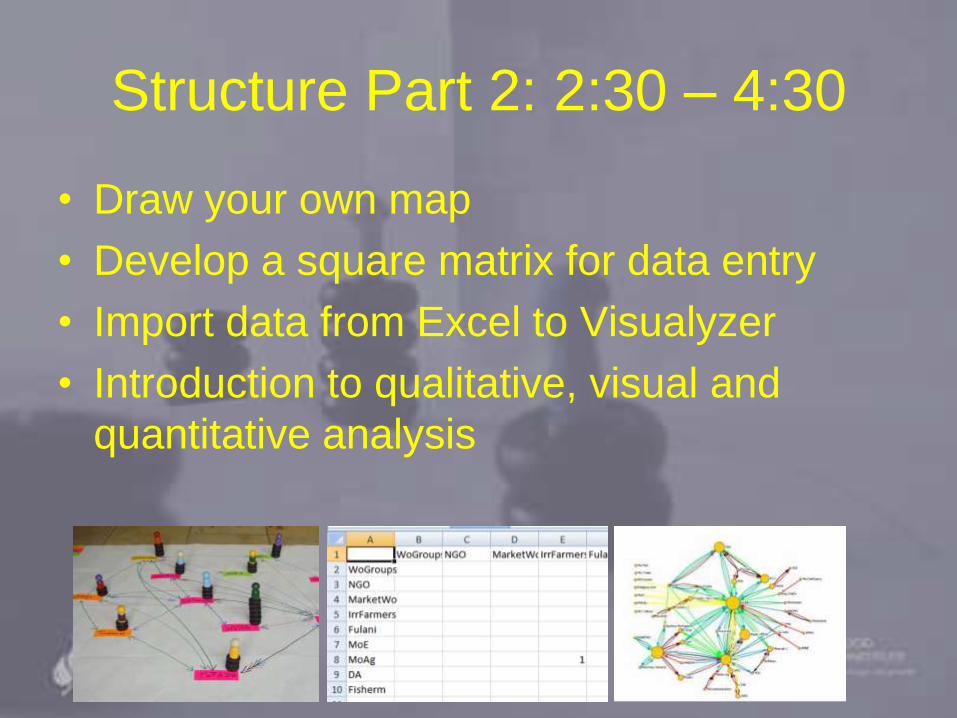
Structure Part 2: 2:30 – 4:30
• Draw your own map
• Develop a square matrix for data entry
• Import data from Excel to Visualyzer
• Introduction to qualitative, visual and
quantitative analysis
Page 4
Click to edit Master title style
• Click to edit Master text styles
• Second level
• Third level
• Fourth level
• Fifth level
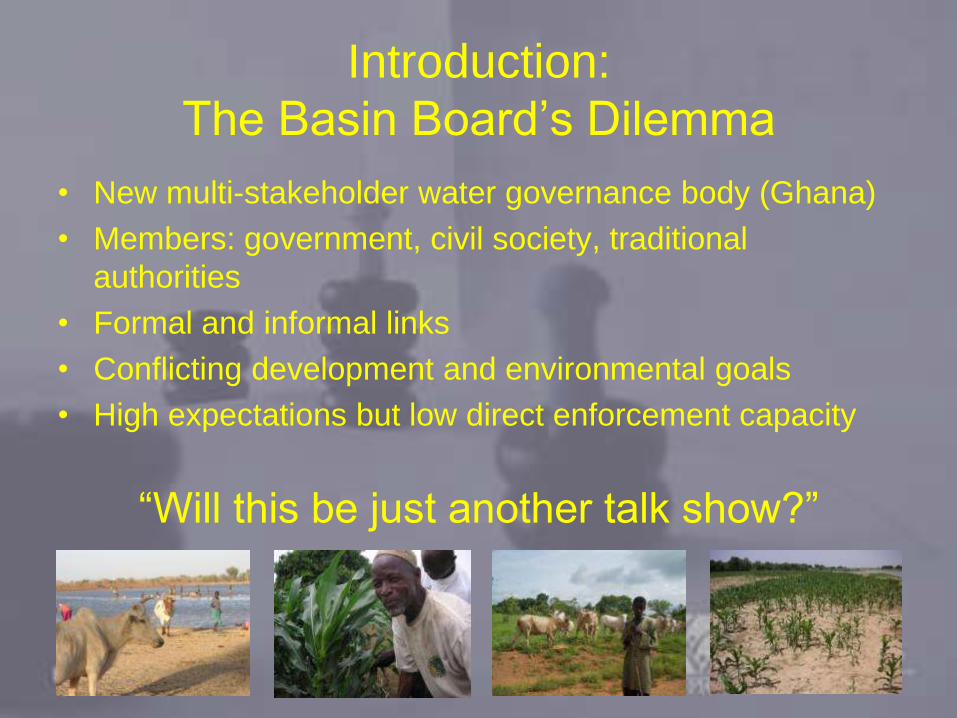
Introduction:
The Basin Board’s Dilemma
• New multi-stakeholder water governance body (Ghana)
• Members: government, civil society, traditional
authorities
• Formal and informal links
• Conflicting development and environmental goals
• High expectations but low direct enforcement capacity
“Will this be just another talk show?”
Page 5
Click to edit Master title style
• Click to edit Master text styles
• Second level
• Third level
• Fourth level
• Fifth level
Basin Board needed to know
• Who can influence our success?
• What formal and informal canals can we use?
• Who is how influential? Who are the core actors?
• What are their roles? What are their goals?
• What are the networks of other board members?
• Have my colleagues collaborated with these
organizations in the past?
• What are potential coalitions, cut-points, bottle-necks?
Strategic Influence Network Planning
Page 6
Click to edit Master title style
• Click to edit Master text styles
• Second level
• Third level
• Fourth level
• Fifth level
Research Interest
We wanted to know:
• What is the water-governance landscape?
• How does multi-stakeholder governance work?
• Do people see influence connected to position in the
network?
• Which kind of link is crucial for determining influence?
• Can improved network understanding improve
collaboration?
• What are clusters, cut-points, brokers etc.
• How does network develop over time?
Page 7
Click to edit Master title style
• Click to edit Master text styles
• Second level
• Third level
• Fourth level
• Fifth level
We needed tool that:
• Satisfies both, research interest and immediate
stakeholder needs
• Is low-tech, low-cost, intuitive, inter-culturally
applicable
• Connects to existing research tools and methods
• Makes implicit knowledge explicit
• Structures complex governance reality
• Is flexible for use in different contexts
Page 8
Click to edit Master title style
• Click to edit Master text styles
• Second level
• Third level
• Fourth level
• Fifth level
Net-Map
Visualize, discuss, analyze and improve
influence networks:
• Actors
• Links (formal and informal)
• goals and
• influence
Page 9
Click to edit Master title style
• Click to edit Master text styles
• Second level
• Third level
• Fourth level
• Fifth level
Based on:
– Social Network Analysis (e.g. Hanneman
2001)
– Power Mapping (e.g. Schiffer 2007)
– Participatory and Action Research (e.g.
Chambers 1983; Freire 1990)
– Stakeholder Analysis (e.g. DFID and World
Bank 2005)
Page 10
Click to edit Master title style
• Click to edit Master text styles
• Second level
• Third level
• Fourth level
• Fifth level
9
Equipment needed
• Large sheets of paper (e.g. flip charts)
• Pens of different color (4-5)
• Actor cards (e.g. “post-it”) of different color
• Influence pieces (e.g. checkers pieces, bicycle spare
parts, bottle caps) that can be stacked into towers
• Actor figurines (optional)
• Recording device / note book
Page 11
Click to edit Master title style
• Click to edit Master text styles
• Second level
• Third level
• Fourth level
• Fifth level
• Define research question
• Define links
• Define goals of actors (if needed)
• Define kinds of actors (if needed)
• Draw a map of your own understanding of
the influence network as first pre-test
Before going to the field:
Page 12
Click to edit Master title style
• Click to edit Master text styles
• Second level
• Third level
• Fourth level
• Fifth level
Step 1. Who is involved (photo)? Add actor cards,
color according to kind of actor.
Page 13
Click to edit Master title style
• Click to edit Master text styles
• Second level
• Third level
• Fourth level
• Fifth level
12
Step 1: Who is involved (sketch)? Add actor cards,
color according to kind of actor.
Ministry of Environ.
Market Women
Fishermen
Irrigation Farmers
Women’s Groups
NGO
District Assembly
Fulani Herdsmen
Ministry of Agric
Name: Moses Ayemba
Date: 12.07.2007
Study: Impact on local irrigation
Kinds of links:
Red: Money
Black: Command
Green: Advice
Blue: Information
Page 14
Click to edit Master title style
• Click to edit Master text styles
• Second level
• Third level
• Fourth level
• Fifth level
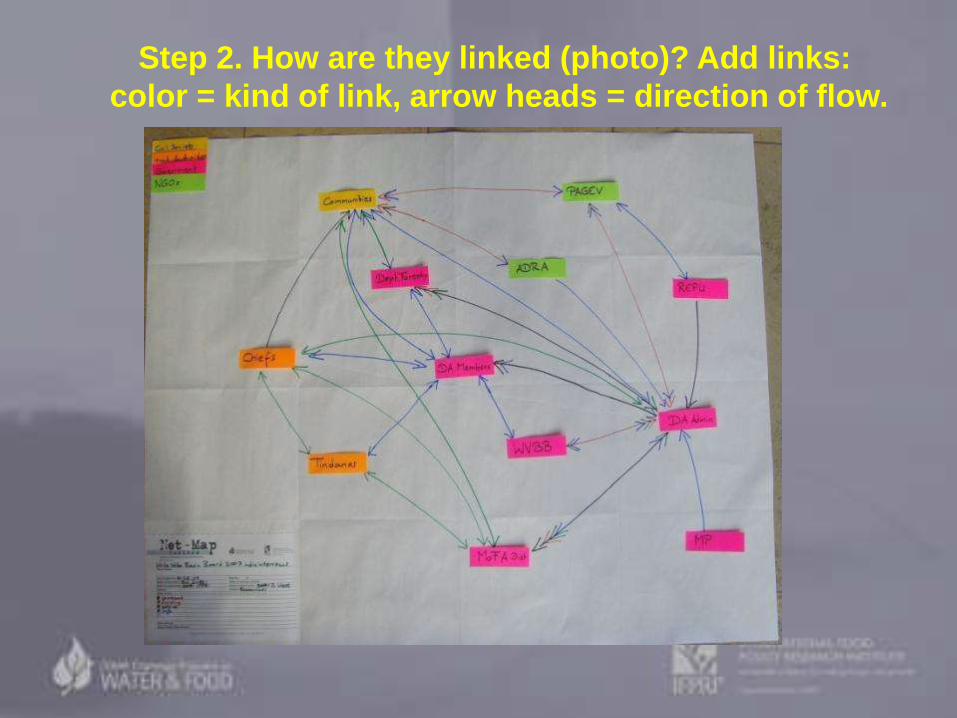
Step 2. How are they linked (photo)? Add links:
color = kind of link, arrow heads = direction of flow.
Page 15
Click to edit Master title style
• Click to edit Master text styles
• Second level
• Third level
• Fourth level
• Fifth level
Ministry of Environ.
Market Women
Fishermen
Irrigation Farmers
Women’s Groups
NGO
District Assembly
Fulani Herdsmen
Ministry of Agric
Name: Moses Ayemba
Date: 12.07.2007
Study: Impact on local irrigation
Kinds of links:
Red: Money
Black: Command
Green: Advice
Blue: Information
Step 2. How are they linked (sketch)? Add links:
color = kind of link, arrow heads = direction of flow.
Page 16
Click to edit Master title style
• Click to edit Master text styles
• Second level
• Third level
• Fourth level
• Fifth level
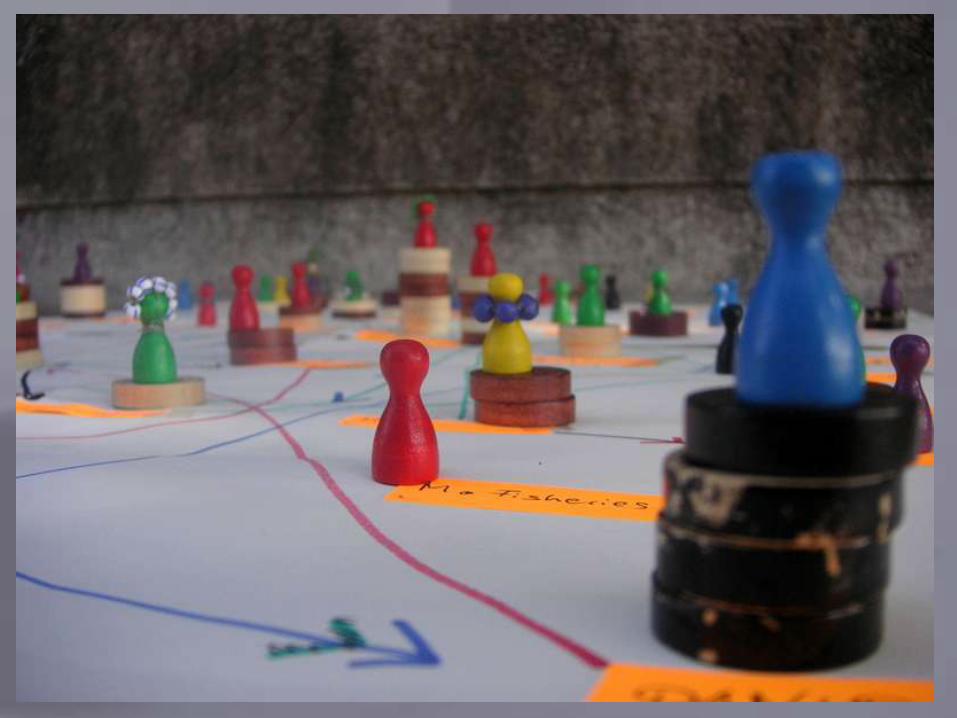
Step 3. How strongly can they influence (photo)?
Add influence towers: Higher influence = higher tower
Page 17
Click to edit Master title style
• Click to edit Master text styles
• Second level
• Third level
• Fourth level
• Fifth level
Step 3. How strongly can they influence (sketch)?
Add influence towers: Higher influence = higher tower
Ministry of Environ.
Market Women
Fishermen
Irrigation Farmers
Women’s Groups
NGO
District Assembly
Fulani Herdsmen
Ministry of Agric
Name: Moses Ayemba
Date: 12.07.2007
Study: Impact on local irrigation
Kinds of links:
Red: Money
Black: Command
Green: Advice
Blue: Information
Page 18
Click to edit Master title style
• Click to edit Master text styles
• Second level
• Third level
• Fourth level
• Fifth level
Slide 1
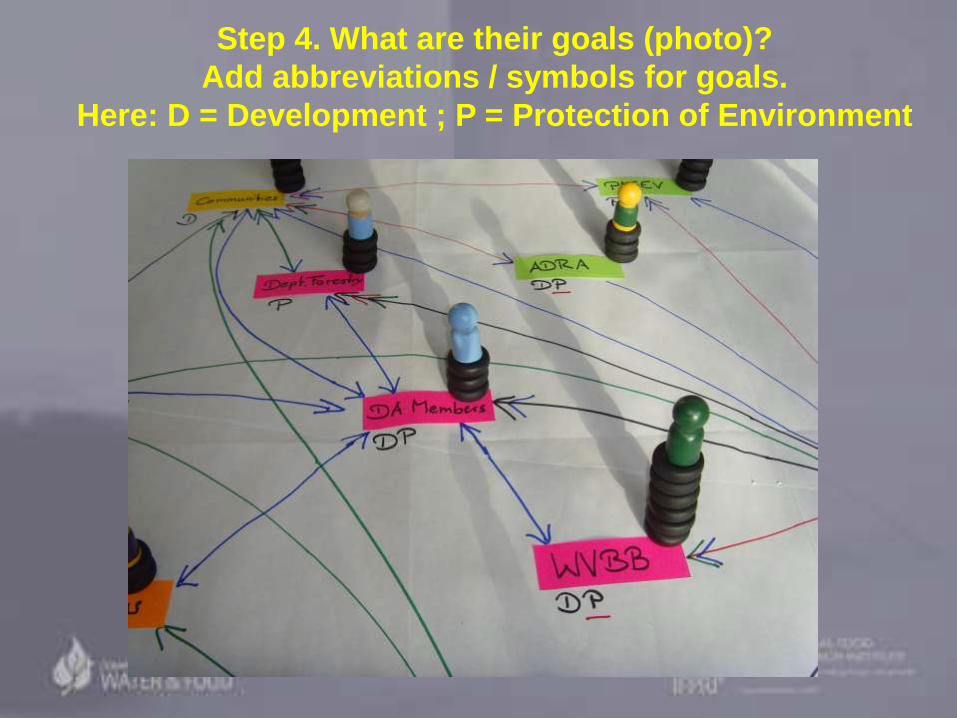
Step 4. What are their goals (photo)?
Add abbreviations / symbols for goals.
Here: D = Development ; P = Protection of Environment
Page 19
Click to edit Master title style
• Click to edit Master text styles
• Second level
• Third level
• Fourth level
• Fifth level
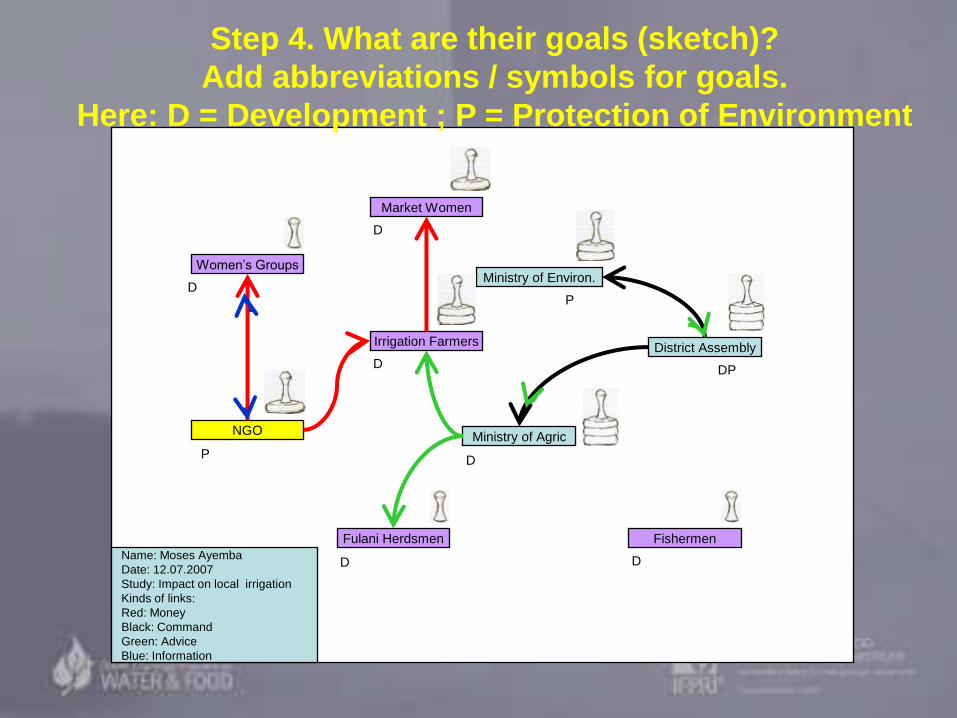
Ministry of Environ.
Market Women
Fishermen
Irrigation Farmers
Women’s Groups
NGO
District Assembly
Fulani Herdsmen
Ministry of Agric
Name: Moses Ayemba
Date: 12.07.2007
Study: Impact on local irrigation
Kinds of links:
Red: Money
Black: Command
Green: Advice
Blue: Information
D
D
D D
D
D
P
P
DP
Step 4. What are their goals (sketch)?
Add abbreviations / symbols for goals.
Here: D = Development ; P = Protection of Environment
Page 20
Click to edit Master title style
• Click to edit Master text styles
• Second level
• Third level
• Fourth level
• Fifth level
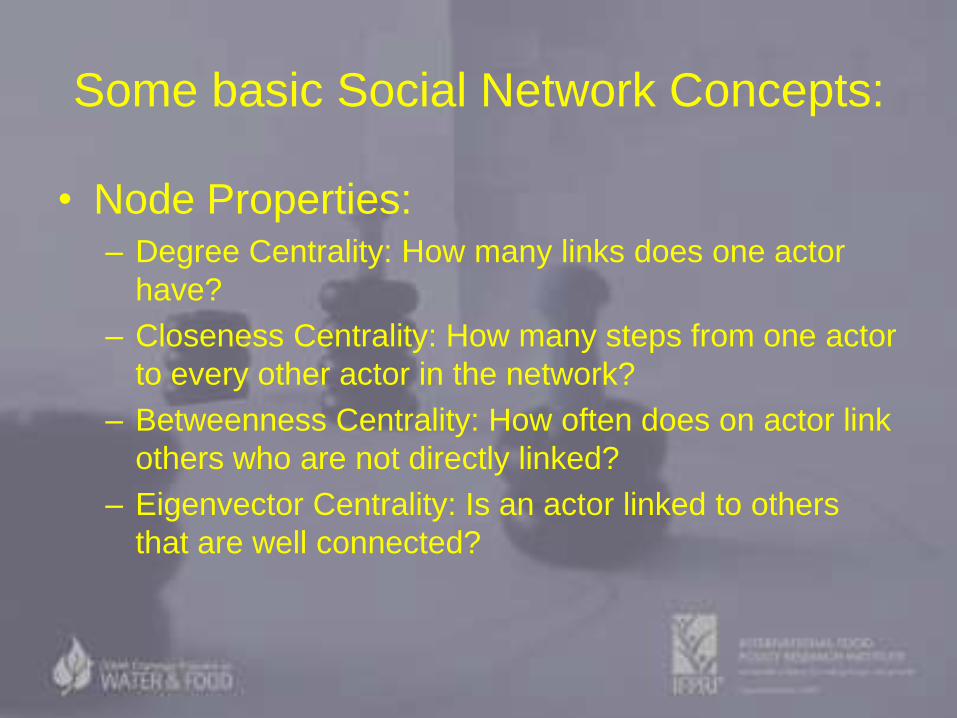
Some basic Social Network Concepts:
• Node Properties:– Degree Centrality: How many links does one actor
have?
– Closeness Centrality: How many steps from one actor
to every other actor in the network?
– Betweenness Centrality: How often does on actor link
others who are not directly linked?
– Eigenvector Centrality: Is an actor linked to others
that are well connected?
Page 21
Click to edit Master title style
• Click to edit Master text styles
• Second level
• Third level
• Fourth level
• Fifth level
Some basic Social Network Concepts:
• Network Properties / Network Roles:– Clusters: Groups of actors where everyone is linked
to everyone
– Centralization: Degree to which a network is
organized around one central node
– Cut-Point / Broker: If you remove this actor, the
network will be disconnected
– Heterogeneity/Homogeneity: Important for innovation
and stability
Page 22
Click to edit Master title style
• Click to edit Master text styles
• Second level
• Third level
• Fourth level
• Fifth level
Case Study Examples:
• Multi-stakeholder water governance
• African Peer Review Mechanism Process
• Fisheries governance in small community
based reservoirs
• Indicators for Benchmarking Agricultural
Innovation Systems
Page 23
Click to edit Master title style
• Click to edit Master text styles
• Second level
• Third level
• Fourth level
• Fifth level
Multi-stakeholder water governance:
The Basin Board
Common network map:
Formal lines of command (black)
Flow of funds (red)
Giving advice (green)
Common network map:
Formal lines of command
http://netmap.files.wordpress.com/2007/11/schiffer07_net_map_water_governance_ghana.pdf
Page 24
Click to edit Master title style
• Click to edit Master text styles
• Second level
• Third level
• Fourth level
• Fifth level
Multi-stakeholder water governance:
The Basin Board
Common network: height of influence tower
Page 25
Click to edit Master title style
• Click to edit Master text styles
• Second level
• Third level
• Fourth level
• Fifth level
Slide 1
24
Black =
command
Red = money
Green =
support /
advice
Blue = info
Yellow =
future links
Cut-point
Multi-stakeholder water governance:
The Basin Board
Learning network concepts
Example: Cut-point in Net-Map of individual board member
Page 26
Click to edit Master title style
• Click to edit Master text styles
• Second level
• Third level
• Fourth level
• Fifth level
African Peer Review
Mechanism Process
• “Who is the civil society?”
• Determine membership for civil society District
Oversight Committees in Ghana
• Info flows concerning:
– Physical infrastructure
– Governance perception
– Whistle blowing
• Part of project planning and implementation(see http://netmap.files.wordpress.com/2008/03/waale_07_netmap_aprm_ghana.pdf)
Page 27
Click to edit Master title style
• Click to edit Master text styles
• Second level
• Third level
• Fourth level
• Fifth level
Fisheries governance in small
community based reservoirs
• “How do local communities organize the multiple
use of small reservoirs?”
• Use Net-Map in rural
African communities
• Determine actors impacting
on fisheries activities in
Multiple Use Systems
• Understand linkages of support and disturbance
• Use Net-Map to support group formation
http://netmap.files.wordpress.com/2007/11/hauck07_net_map_fisheries_ghana.pdf
Page 28
Click to edit Master title style
• Click to edit Master text styles
• Second level
• Third level
• Fourth level
• Fifth level
Indicators for benchmarking Agricultural
Innovation Systems in various countries
• “How can you compare innovativeness of
agricultural systems between sectors and
countries?”
• Use Net-Map in a combination of methods
• Explore systemic nature of innovation system
• Develop standardized approach to allow cross
sector and cross country comparison
http://netmap.wordpress.com/2008/05/08/podcast-on-maize-and-chicken-in-ethiopia/
Page 29
Click to edit Master title style
• Click to edit Master text styles
• Second level
• Third level
• Fourth level
• Fifth level
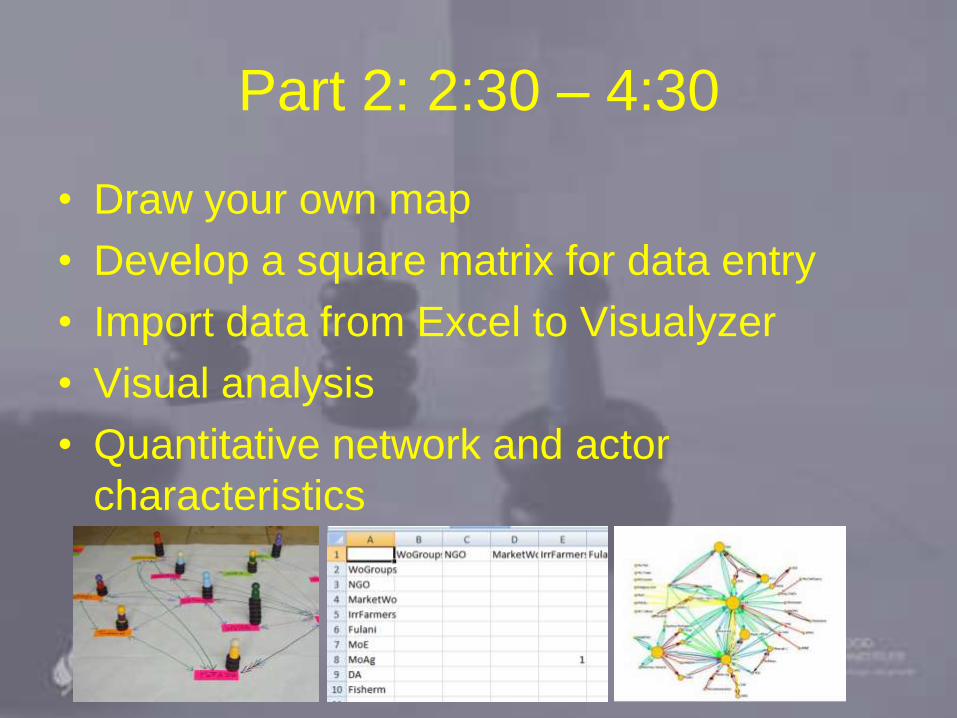
Part 2: 2:30 – 4:30
• Draw your own map
• Develop a square matrix for data entry
• Import data from Excel to Visualyzer
• Visual analysis
• Quantitative network and actor
characteristics
Page 30
Click to edit Master title style
• Click to edit Master text styles
• Second level
• Third level
• Fourth level
• Fifth level
Draw your own map:
How to define your question:
– “Who influences XY in what way?”
– XY is a complex issue influenced by different
actors with various goals, who are linked by
formal and informal links
– XY could be e.g. your project success, the
change of a legislation, the adoption of an
innovation, the solution of a conflict, your
personal career etc.
– Formulate XY concretely (but not too narrow)
Page 31
Click to edit Master title style
• Click to edit Master text styles
• Second level
• Third level
• Fourth level
• Fifth level
Draw your own map
How to define links:• “How do actors interact to influence XY?”
• Select not more than 4-5 links
• Formal and informal links
• Links that are different from each other
• No links that everybody or nearly nobody shares
• Pre-test links and wording!
• Define links before or in the interview
• Links could be i.e. giving info, advice, funding,
command, conflict, family ties, political pressure etc.
Page 32
Click to edit Master title style
• Click to edit Master text styles
• Second level
• Third level
• Fourth level
• Fifth level
Draw your own map
Define goals:
• “Do actors follow different goals concerning xy?”
• Develop abbreviations or symbols
Define actor groups:
• Do actors belong to distinct groups e.g.
– Government, NGO, private sector or
– Local, regional, national level
• Assign card colors to groups
Page 33
Click to edit Master title style
• Click to edit Master text styles
• Second level
• Third level
• Fourth level
• Fifth level
Draw your own map:
Group exercise: Follow step 1-4 (above):
1.Who is involved: Write actors on card and
distribute on map
2.How are they linked: Draw arrows of different
color
3.How influential are they: Build influence towers
4.What are their goals: Assigns goals to actors
5.What does this mean: Discuss Net-Map
Page 34
Click to edit Master title style
• Click to edit Master text styles
• Second level
• Third level
• Fourth level
• Fifth level
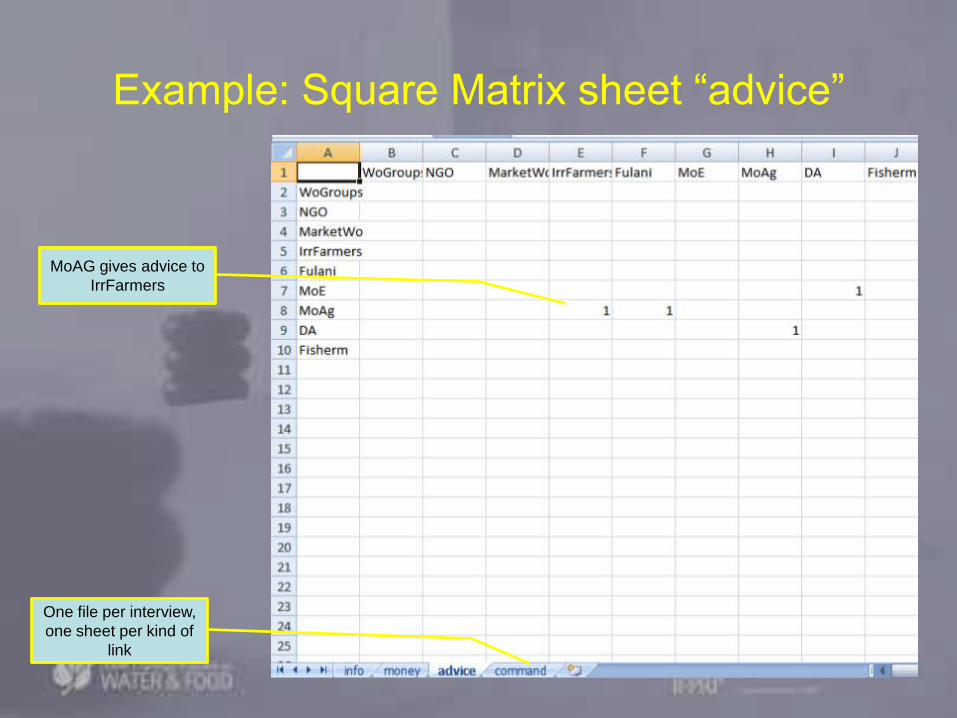
How to enter paper maps into matrix
• Primary data entry in Excel
• Symmetric square matrix: All actors (in
same order) as labels for columns and
rows
• Actor A gives something to Actor B: Put
“1” in row A, column B
• If no interaction, leave blank
Page 35
Click to edit Master title style
• Click to edit Master text styles
• Second level
• Third level
• Fourth level
• Fifth level
Example: Square Matrix sheet “advice”
MoAG gives advice to
IrrFarmers
One file per interview,
one sheet per kind of
link
Page 36
Click to edit Master title style
• Click to edit Master text styles
• Second level
• Third level
• Fourth level
• Fifth level
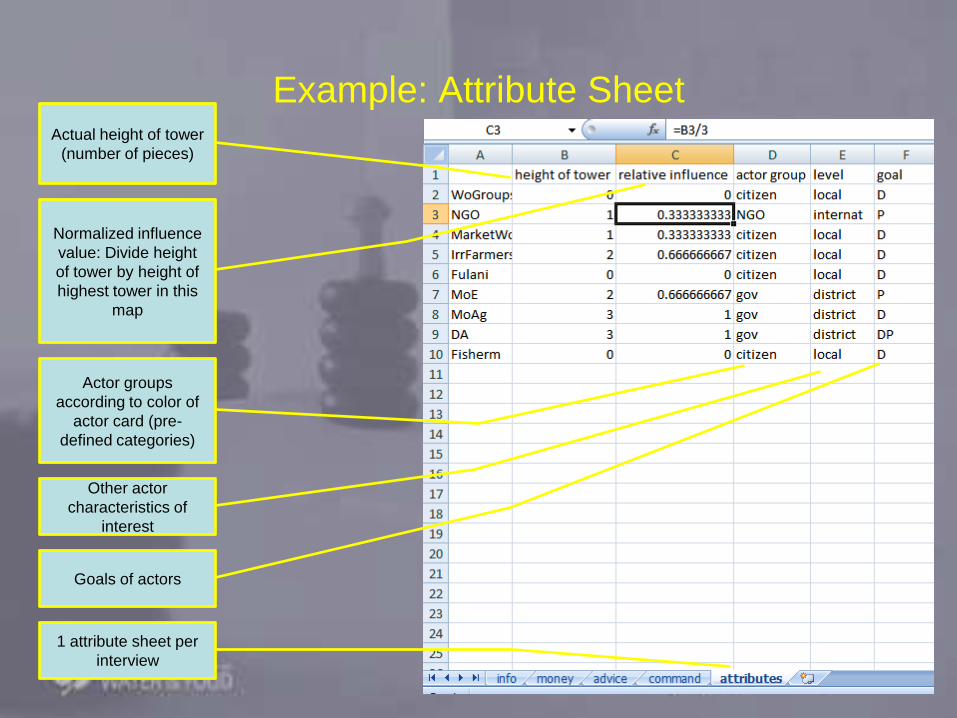
Example: Attribute SheetActual height of tower
(number of pieces)
Normalized influence
value: Divide height
of tower by height of
highest tower in this
map
1 attribute sheet per
interview
Actor groups
according to color of
actor card (pre-
defined categories)
Other actor
characteristics of
interest
Goals of actors
Page 37
Click to edit Master title style
• Click to edit Master text styles
• Second level
• Third level
• Fourth level
• Fifth level
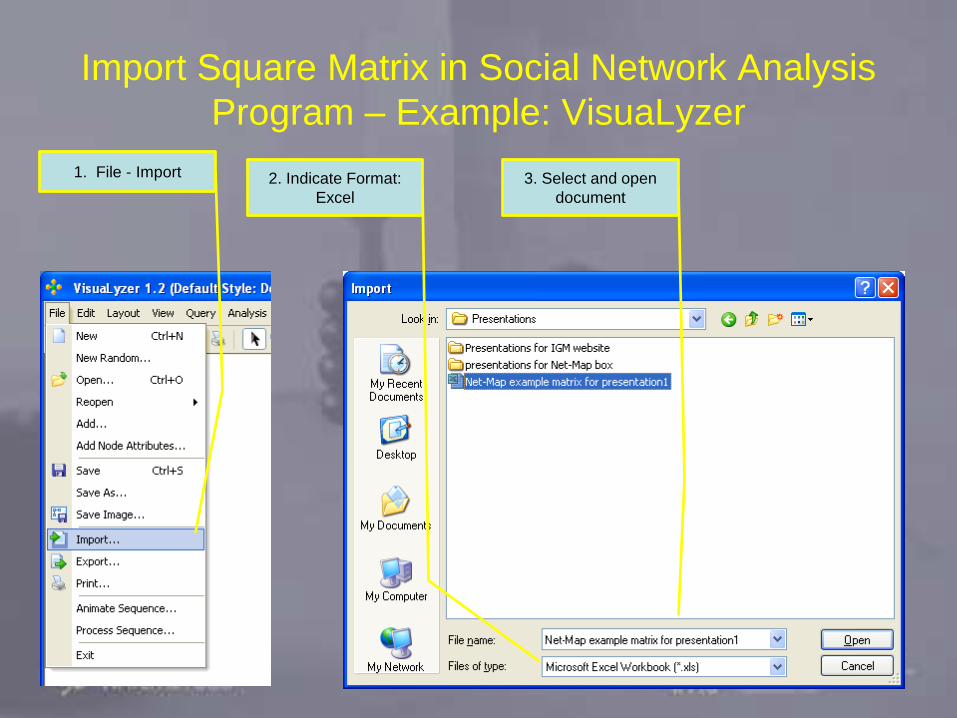
Import Square Matrix in Social Network Analysis
Program – Example: VisuaLyzer
1. File - Import 2. Indicate Format:
Excel
3. Select and open
document
Page 38
Click to edit Master title style
• Click to edit Master text styles
• Second level
• Third level
• Fourth level
• Fifth level
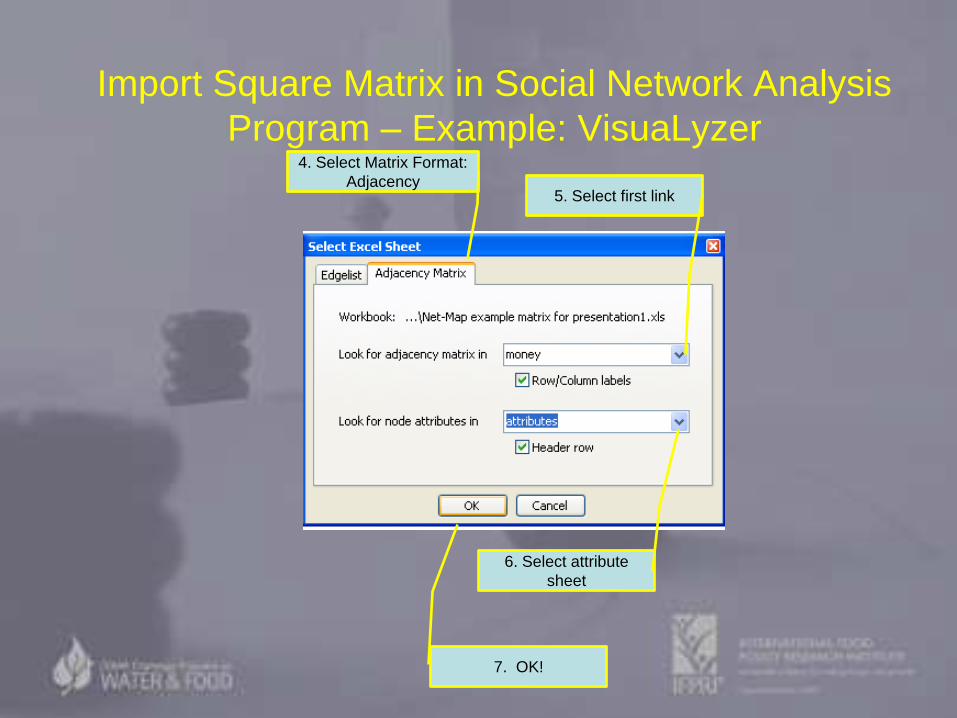
Import Square Matrix in Social Network Analysis
Program – Example: VisuaLyzer
5. Select first link
4. Select Matrix Format:
Adjacency
6. Select attribute
sheet
7. OK!
Page 39
Click to edit Master title style
• Click to edit Master text styles
• Second level
• Third level
• Fourth level
• Fifth level
Rename relation
9. Click: Select
Relation Icon8. First link imported
10. Change
“is_linked_to” into
name of link e.g.
“money”
11. Change color of
link if desired
Page 40
Click to edit Master title style
• Click to edit Master text styles
• Second level
• Third level
• Fourth level
• Fifth level
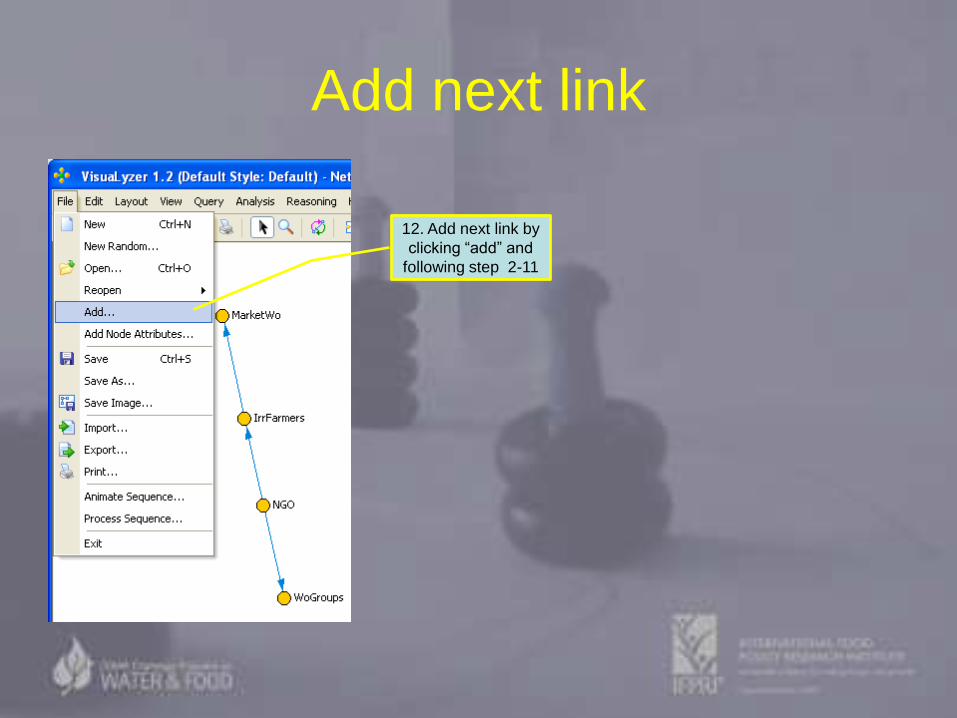
Add next link
12. Add next link by
clicking “add” and
following step 2-11
Page 41
Click to edit Master title style
• Click to edit Master text styles
• Second level
• Third level
• Fourth level
• Fifth level
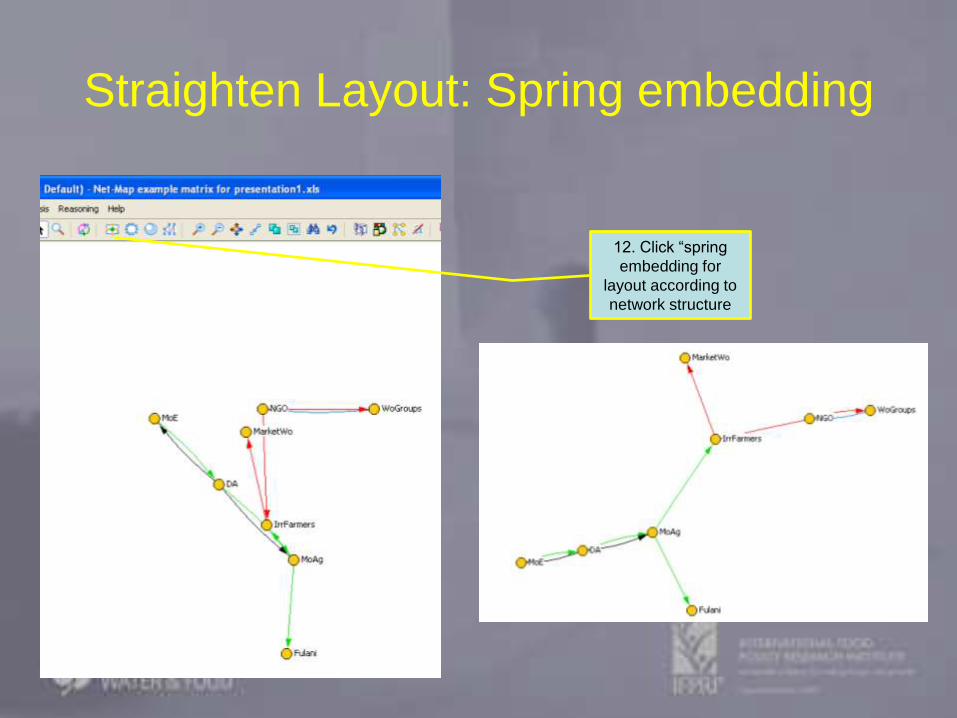
Straighten Layout: Spring embedding
12. Click “spring
embedding for
layout according to
network structure
Page 42
Click to edit Master title style
• Click to edit Master text styles
• Second level
• Third level
• Fourth level
• Fifth level
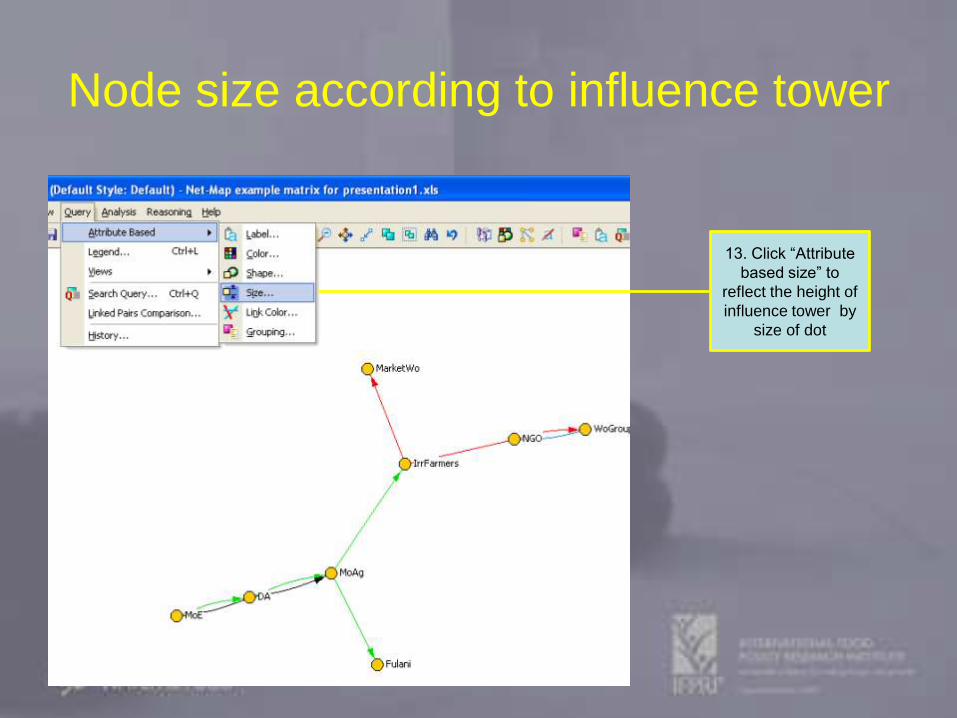
Node size according to influence tower
13. Click “Attribute
based size” to
reflect the height of
influence tower by
size of dot
Page 43
Click to edit Master title style
• Click to edit Master text styles
• Second level
• Third level
• Fourth level
• Fifth level
Node size according to influence tower
14. Choose “relative
influence” to determine size
Page 44
Click to edit Master title style
• Click to edit Master text styles
• Second level
• Third level
• Fourth level
• Fifth level
Start quantitative analysis
15. Click “Analysis” ;“Network Properties” and
“Node Centrality” to start quantitative analysis
Page 45
Click to edit Master title style
• Click to edit Master text styles
• Second level
• Third level
• Fourth level
• Fifth level
How to read a Net-Map
• Follow your visual intuition: What is strange,
unique, striking?
• Initiate qualitative discussion with interviewee
But: Visual representation might be misleading, for
more reliable analysis:
• Familiarize yourself with basic network concepts
• Transform drawn map into computerized format
and embark on quantitative analysis
Page 46
Click to edit Master title style
• Click to edit Master text styles
• Second level
• Third level
• Fourth level
• Fifth level
Page 47
Click to edit Master title style
• Click to edit Master text styles
• Second level
• Third level
• Fourth level
• Fifth level
Further Reading:
• Borgatti, S.P. 2003. Centrality and Network Flow 27(1): 55-71.
• Cross, R., S.P. Borgatti, and A. Parker. 2002. Making Invisible Work Visible: Using Social Network
Analysis to Support Strategic Collaboration. California Management Review 44(2).
• Davies, R. 2003. Network Perspectives in the Evaluation of Development Interventions: More than
a Metaphor. EDAIS Conference: New Directions in Impact Assessment for Development: Methods
and Practice, November 24–25.
• DFID and World Bank. 2005. Tool for Understanding Institutional, Political and Social Analysis
(TIPS). Poverty Analysis and MDGs Team/World Bank. Social Development Division.
https://www.worldbank.org/tips.
• Douthwaite, B., A. Carvajal, S. Alvarez, E. Claros, and L.A. Hernández. 2006. Building Farmers’
Capacities for Networking (Part 1): Strengthening Rural Groups in Colombia through Network
Analysis. KM4D Journal 2(2): 4-18.
• Chambers, R. 1983. Rural Development: Putting the Last First, Longmans
• Freire, P.; Horton, M. 1990. We make the road by walking: conversations on education and social
change. Ed. by Brenda Bell (et al). Philadelphia, Temple University Press, 1990, XXXVII, 256 p.
• Hanneman, R.A. 2001. Introduction to Social Network Methods. Department of Sociology,
University of California, Riverside.
• Krebs, V. 2004. Power in Networks. http://www.orgnet.com.
• Schiffer, E. 2007. The Power Mapping Tool: A Method for the Empirical Research of Power
Relations. IFPRI Discussion Paper No. 703. http://www.ifpri.org/pubs/dp/ifpridp00703.asp