IFS-Axxxx Ed. 02/2005 Invest Like the Professionals Asset Allocation and Diversification Are Key JennisonDryden is a registered trademark of The Prudential Insurance Company of JennisonDryden is a registered trademark of The Prudential Insurance Company of America. America. IFS-A103119 Ed. 4/2005 IFS-A103119 Ed. 4/2005
Transcript
IFS-Axxxx Ed. 02/2005
Invest Like the Professionals…Asset Allocation and Diversification Are Key
JennisonDryden is a registered trademark of The Prudential Insurance Company of America.JennisonDryden is a registered trademark of The Prudential Insurance Company of America.
IFS-A103119 Ed. 4/2005IFS-A103119 Ed. 4/2005
Smart Investing Begins With An Investment Plan
One that reflects your unique needs and goals The time you have to achieve them Your attitude toward risk.
Step One: Review your current portfolio
Step Two: Determine your future needs.
Step Three: Make a plan and stick to your plan.
Invest Like the Professionals
Time-tested strategies
Asset allocation Diversification
91.5%
1.8% 2.1%4.6%
Asset Allocation
Security Selection
Market Timing
Other
Asset Allocation Is the Primary Determinant of Total Portfolio Volatility
Source: Brinson, Singer, and Beebower (1991)
Which Asset Allocation Model Is Accurate?
A. Conservative?
B. Moderate?
C. Aggressive?
Blue – BondsBlue – Bonds
Purple – Stocks Purple – Stocks
Answer: They Are All Correct!
Your personal answer is based on yourindividual risk/reward profile
Standard Deviation (Risk)
Expected Return
0.0 30.03.0 6.0 9.0 12.0 15.0 18.0 21.0 24.0 27.0
0.0
20.0
3.0
6.0
9.0
12.0
15.0
Stocks
Cash
ModerateConservative
Growth
Standard Deviation represents the volatility or risk of an asset. It measures how Standard Deviation represents the volatility or risk of an asset. It measures how scattered actual returns are around the average return or mean over a period of time. scattered actual returns are around the average return or mean over a period of time. The greater the degree of dispersion, the greater the risk associated with the asset.The greater the degree of dispersion, the greater the risk associated with the asset.
Blue – BondsBlue – Bonds
Purple – Stocks Purple – Stocks
Source: Investment Company Institute and Bloomberg, 12/31/2004. Net equity sales measure the amount of net sales into retail equity mutual funds on an annual basis. The S&P 500 Index is an unmanaged, weighted index of 500 U.S. stocks, providing a broad indicator of price movement. Investors cannot invest directly in the index. Index performance is not representative of the performance of a specific security. Past performance is not indicative of future results.
Emotional Investing Is a Common Mistake
Everyone wants to “buy low and sell high,” but most investors do the opposite
So How Do You Build An Asset Allocation Strategy
• You need the right mix of stocks and bonds.
• Regular Monitoring and adjusting is necessary to maintain your desired allocation.
• Periodic Rebalancing
13.0%
3.1% 3.5%
11.2%
3.8%
Long-Term Gov’t Bond Index
Average BondFund Investor
Average Annual ReturnsJanuary 1984 – December 2003
AverageStock Fund
Investor
InflationS&P 500
Source: Index Performance of the S&P 500 and Lehman Brothers Long-Term Government Bond Indexes Source: Index Performance of the S&P 500 and Lehman Brothers Long-Term Government Bond Indexes between January 1984 and December 2003 was generated using Hysales (Thomson Financial Company. between January 1984 and December 2003 was generated using Hysales (Thomson Financial Company. The negative effects of actively trading mutual funds were researched by DALBAR, a Boston-based The negative effects of actively trading mutual funds were researched by DALBAR, a Boston-based financial research firm that is independent from JennisonDryden Mutual Funds. Average stock investor financial research firm that is independent from JennisonDryden Mutual Funds. Average stock investor and average bond investor performances were used from a DALBAR Study. The Lehman Brothers Long-and average bond investor performances were used from a DALBAR Study. The Lehman Brothers Long-Term Government Bond Index includes U.S. government, corporate, and mortgage-backed securities Term Government Bond Index includes U.S. government, corporate, and mortgage-backed securities with maturities up to 30 years. with maturities up to 30 years.
Past performance is no guarantee of future results. Past performance is no guarantee of future results.
Trying to Time the Market Can Lead to Long-Term Underperformance Trying to Time the Market Can Lead to Long-Term Underperformance
Hypothetical Growth, Moderate, and Conservative allocation returns are based on the performance of relevant indexes over the graphed time period. All returns assume a $10,000 investment on 1/1/1984. Performance of three hypothetical portfolios does not include any fees, expenses, or taxes. Performance would have been lower if fees, expenses, and taxes were included. Investors cannot invest directly in an index.
Past performance is not indicative of future results.
Graph does not reflect the performance of JennisonDryden Asset Allocation Funds.
Market leadership Changes from Year to Year Benefits of Asset Allocation 1995 – 2004
Diversified Portfolio
15% Large Value 15% Large Growth
10% Small Value 10% Small Growth
10% International 40% Int.Gov/Credit
Source: Ibbotson Associates, Chicago. Government bonds and Treasury Bills are guaranteed by the U.S. Government and, if held to maturity, offer a fixed rate of return and fixed principal value. Stocks offer growth potential, but fluctuate more than other investments. The prices of small company stocks are generally more volatile than those of large company stocks. Investing in foreign/international securities presents certain unique risks not associated with domestic investments, such as currency fluctuation and political/economic changes. Past performance is not a guarantee of future results. Individual investor results will vary. See Glossary of Indices for index descriptions. Diversification seeks to balance (as in an investment portfolio) defensively by dividing funds among securities of different industries or of different classes. Corporate bonds are subject to credit risk, interest rate risk, and market risk. An investment cannot be made directly into an index. Past performance in not indicative of future results.
Market Leadership Changes Year to Year Disclosure
Large Cap Growth and Large Cap Value are represented by S&P/BARRA Growth and S&P/BARRA Value Indexes that measure the performance of the growth and value styles of investing in large-cap U.S. stocks. The Indexes are constructed by dividing the stocks in the S&P 500 Index according to price-to-book ratios. The Growth Index contains stocks with higher price-to-book ratios. The Value Index contains stocks with lower price-to-book ratios. The Indexes are market-capitalization weighted, and their constituents are mutually exclusive.
Small Cap is represented by the Russell 2000 Total Return Index that measures the performance of small-capitalization U.S. stocks. The Russell 2000 is a market-value-weighted index of the 2,000 smallest stocks in the broad-market Russell 3000 Index. These securities are traded on the NYSE, AMEX, and NASDAQ.
Small-Cap Growth and Small-Cap Value are represented by the Russell 2000 Growth and the Russell 2000 Value Indexes that measure the performance of growth and value styles of investing in small-cap U.S. stocks. The Value Index contains those Russell 2000 securities with a less-than-average growth orientation, while the Growth Index contains those securities with a greater-than-average growth orientation.Securities in the Value Index generally have lower price-to-book and price/earnings ratios than those in the Growth Index. The constituent securities are NOT mutually exclusive.
International is represented by the MSCI EAFE, a Morgan Stanley Capital International index that is designed to measure the performance of the developed country/global stock markets of Europe, Australasia, and the Far East.
Fixed Income is represented by the Lehman Brothers Aggregate Bond Index. This Index includes U.S. government, corporate, mortgage-backed securities, and asset-backed securities with at least $100 million par amount outstanding and at least one year to final maturity.
Benefits of DiversificationBenefits of Asset Allocation 1995– 2004
Diversified Portfolio
15% Large Value 15% Large Growth
10% Small Value 10% Small Growth
10% International 40% Int.Gov/Credit
Source: Ibbotson Associates, Chicago. Government bonds and Treasury Bills are guaranteed by the U.S. Government and, if held to maturity, offer a fixed rate of return and fixed principal value. Stocks offer growth potential, but fluctuate more than other investments. The prices of small company stocks are generally more volatile than those of large company stocks. Investing in foreign/international securities presents certain unique risks not associated with domestic investments, such as currency fluctuation and political/economic changes. Past performance is not a guarantee of future results. Individual investor results will vary. See Glossary of Indices for index descriptions. Diversification seeks to balance (as in an investment portfolio) defensively by dividing funds among securities of different industries or of different classes. Corporate bonds are subject to credit risk, interest rate risk, and market risk. An investment cannot be made directly into an index. Past performance in not indicative of future results.
Introducing JennisonDryden Asset Allocation Funds
One step to a diversified long-term investment plan
Diversified allocation strategies designed in consultation with Ibbotson Associates
Covers key asset classes
Multiple style funds
Leading asset managers
Day-to day management and portfolio rebalancing by Quantitative Management Associates
Ibbotson Associates is not a Prudential Financial company.Ibbotson Associates is not a Prudential Financial company.
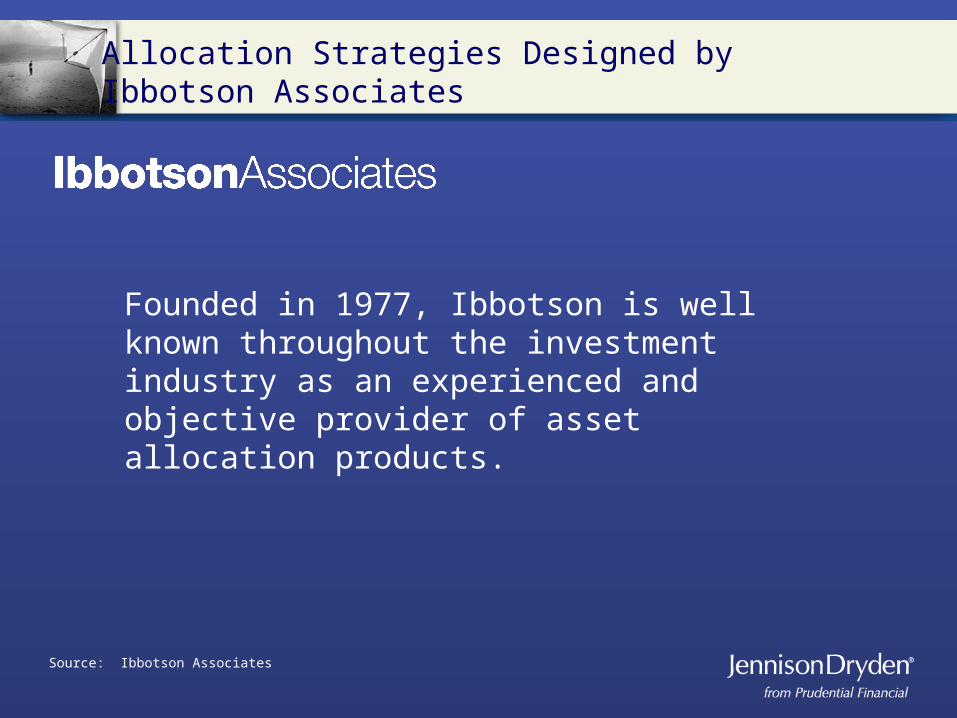
Allocation Strategies Designed by Ibbotson Associates
Asset class modeling Portfolio design Quarterly review of fund style consistency Annual review of asset class modeling
Source: Ibbotson Associates
Allocation Strategies Designed by Ibbotson Associates
Founded in 1977, Ibbotson is well known throughout the investment industry as an experienced and objective provider of asset allocation products.
The Efficient Frontier Strategy works by using a mathematical formula, which takes the historical total return of a portfolio of securities as well as their volatility, as measured by its standard deviation, and plots them to determine the precise blend which would have provided the highest level of overall return with the lowest degree of volatility for the period measured.
Risk
Return
JennisonDryden Moderate Allocation Fund
JennisonDryden Conservative
Allocation Fund
JennisonDryden Growth Allocation Fund
40%
60%
Stocks
Bonds
35%65%
Choose a Portfolio That’s Right for You
90%
10%
Conservative Allocation Fund
60% bond funds/40% stock funds
Allocation percentages reflect estimated target holdings. Actual percentages may fluctuate due to market changes. The manager may also vary the allocation ranges for each underlying fund of a portfolio at any time if the manager believes that doing so will better enable the portfolio to pursue its investment objective. Please see the prospectus for allowable ranges.
Underlying Fund
EquityDryden Large-Cap Core 5%Jennison 20/20 4%Jennison Equity Opportunity 6%Jennison Growth 8%Dryden International Equity 10%Jennison U.S. Emerging Gr 3%Jennison Value 4%Fixed IncomeDryden Ultra Short 20%Dryden Government Income 20%Dryden High Yield 4%Dryden Short-Term Corporate 16%
Stocks
Cash
Moderate
Conservative
Growth
U.S. Large-Cap Value11%
Small to Mid6%
International Equity10%
High Yield4%Intermediate Govt
Bond20%
ST Bond16%
Ultra Short Bond20%
Large-Cap Core5%
U.S. Large-Cap Growth
8%
Moderate Allocation Fund
65% stock funds/35% bond funds
Allocation percentages reflect estimated target holdings. Actual percentages may fluctuate due to market changes. The manager may also vary the allocation ranges for each underlying fund of a portfolio at any time if the manager believes that doing so will better enable the portfolio to pursue its investment objective. Please see the prospectus for allowable ranges.
Underlying FundEquityDryden Large-Cap Core 7%Dryden Small-Cap Core 3%Jennison 20/20 8%Jennison Equity Opportunity 8%Jennison Growth 11%Dryden International Equity 17%Jennison U.S. Emerging Gr 5%Jennison Value 6%Fixed IncomeDryden Ultra Short 5%Dryden Government Income 15%Dryden High Yield 5%Dryden Short-Term Corporate 10%
Stocks
Cash
Moderate
Conservative
Growth
U.S. Large- Cap Value17%
Small to Mid12%
International Equity17%
High Yield5%
Intermediate Govt Bond15%
ST Bond10%
Ultra Short Bond5%
Large- Cap Core7%
U.S. Large- Cap Growth
8%
Growth Allocation Fund
90% stock funds/10% bond funds
Allocation percentages reflect estimated target holdings. Allocation percentages reflect estimated target holdings. Actual percentages may fluctuate due to market changes. The manager may also vary the allocation ranges for each underlying fund of a portfolio at any time if the manager believes that doing so will better enable the portfolio to pursue its investment objective. Please see the prospectus for allowable ranges.
Underlying FundsEquityDryden Large-Cap Core 9%Dryden Small-Cap Core 9%Jennison 20/20 9%Jennison Equity Opportunity 10%Jennison Growth 16%Dryden International Equity 25%Jennison U.S. Emerging Gr 6%Jennison Value 6%Fixed IncomeDryden Total Return Bond 10%
Stocks
Cash
Moderate
Conservative
Growth
U.S. Large-Cap Value20%
Small to Mid20%
International Equity25%
High Yield2%
Intermediate Govt Bond8%
Large-Cap Core9%
U.S. Large-Cap Growth
16%
Fund Disclosures
Investors should keep in mind that the Funds will not be diversified for the purposes of the Investment Company Act of 1940. Investment in a nondiversified fund involves greater risks than a diversified investment because a loss resulting from a particular security will have a greater impact on the fund’s overall return. The Funds may not be appropriate for all investors, nor should they be considered a complete investment program. There is no assurance that the Funds’ investment objectives will be achieved. They may invest in small- and mid-cap stocks, which may have limited marketability and may be subject to more abrupt or erratic movements than larger-capitalization stocks. The Funds may engage in the following nonprincipal strategies. The Funds may invest in foreign securities, which are subject to the risk of currency fluctuation and the impact of political, social, and economic change. Noninvestment-grade debt securities, commonly referred to as high yield or “junk” bonds, may be subject to greater market fluctuations and risk of loss of income and principal than securities in higher-rating categories. The Funds also may trade their portfolio securities actively and frequently, resulting in an annual portfolio turnover rate of up to approximately 100%. High portfolio turnover can result in higher costs, which may affect Fund performance. The Funds also may invest in derivative securities, which have their own risks. These risks may result in greater share price volatility.
Three Leading Asset Managers
JennisonDryden Mutual FundsJennisonDryden is Prudential Financial’s mutual fund and managed accounts family. We offer a broad spectrum of investments—from core portfolio building blocks to strong sector funds. The managers of our funds are known and respected by major corporations and pension funds throughout the world. When you invest with us, you benefit from the same process, research, risk management, and competitive performance demanded by today’s largest investors.
Three Successful Asset Managers
Jennison Associates
Quantitative Management Associates
Prudential Fixed IncomePrudential Fixed Income is a division of Prudential Investment Management, Inc. (PIM). Jennison Associates, Quantitative Management Associates, and PIM are registered investment advisers and Prudential Financial companies.
Investment Teams
1Prudential Investment Management, Inc. or one of its predecessor organizations has been managing proprietary fixed income portfolios since 1875 and portfolios for institutional clients since 1928.2Credit analysts only.
Assets Under Management(Retail/Institutional as of 12/31/2004
The Need for Rebalancing
What happens over time to a portfolio that starts off 50% equity and 50% fixed income? If no rebalancing takes place, market fluctuations may have a significant impact on portfolio holdings. After 20 years the portfolio is almost two-thirds equity and one-third fixed income.
Asset Mix Drift – 1/1/1984 Through 12/31/2004
Source: Lipper. Equity returns reflect performance of the S&P 500 Index The S&P 500 Index is an unmanaged, weighted index of 500 U.S. stocks, providing a broad indicator of price movement in stocks. Fixed Income returns reflect performance of Lehman Brothers Aggregate Bond Index. The Lehman Brothers Aggregate Bond Index is an unmanaged index composed of securities from the Lehman Brothers Government/Corporate Bond Index, Mortgage-Backed Securities Index, and the Asset-Backed Securities Index. Total return comprises price appreciation/depreciation and income as a percentage of the original investment. Indexes are rebalanced monthly by market capitalization. Index performance is not representative of the performance of a specific security. Investors cannot invest directly in an index. Past performance is not indicative of future results.
50%47%
43%
28%34%
50%53%
57%
72%66%
0%
10%
20%
30%
40%
50%
60%
70%
80%
1984 1988 1994 1998 2004
Bonds Stocks
Why Diversification and Rebalancing Are Important
Consider the following two long-term strategies for investing $200,000 over a 20-year period (1984–2004)
Source: Prudential Investments, using Wisenberger. For the purpose of this illustration, the following indexes were used: S&P/BARRA 500 Value, Russell 2000 Growth, Russell 2000 Value, MSCI EAFE, and Lehman Brothers Aggregate Bond. Investors cannot buy or invest directly into any of these indexes, and the indexes do not represent the performance of the JennisonDryden Asset Allocation Funds. The six asset classes used here are: Large Cap Growth, Large Cap Value, Small Cap Growth, Small Cap Value, International, and Fixed Income. Past performance is not indicative of future results.
$10,000.00$60,000.00
$110,000.00$160,000.00$210,000.00$260,000.00$310,000.00$360,000.00$410,000.00$460,000.00$510,000.00$560,000.00$610,000.00$660,000.00Invests $10,000 into top-
performing market segment at the end of each year.
Strategy Strategy 11
Invests $10,000 equally in six different market segments at the end of each year, and rebalances the portfolio each year so it remains equally diversified among the six market segments.
Strategy Strategy 22
Keeping Your Asset Allocation on Track
JennisonDryden Asset Allocation Funds Automatic Rebalancing- we do the work for you.
Quantitative Management Associates periodically rebalances the three asset class portfolios to bring them back to their original allocations
What JennisonDryden Asset Allocation Funds Offer You
Immediate and consistent diversification Asset management expertise of the JennisonDryden
fund family Three funds for differing risk profiles Automatic portfolio rebalancing Simplicity—one investment, one NAV Accessibility—investment minimums
as low as $1,000
You Have Needs
Secure retirement
College education for children or grandchildren
New home
Growing/protecting your nest egg
We can help
JennisonDryden Asset Allocation Funds
How Do You Get Started
Fill out an Asset Allocation Questionnaire
Based on your answers, a Financial Professional can help identify an asset allocation model that is appropriate for your investment objectives, risk tolerance, and time horizon
Disclosures
For more information about the JennisonDryden Asset Allocation Funds, call your financial professional for a free prospectus. You should consider the Funds’ investment objectives, risks, and charges and expenses carefully before investing. The prospectus will contain this and other information about the investment company. Please read the prospectus carefully before investing.
Shares of the JennisonDryden Asset Allocation Funds are distributed by Prudential Investment Management Services LLC (PIMS), a Prudential Financial company and member SIPC. JennisonDryden is a registered trademark of The Prudential Insurance Company of America.
Mutual Funds:
ARE NOT INSURED BY THE FDIC OR ANY FEDERAL GOVERNMENT AGENCY, MAY LOSE VALUE, AND ARE NOT A DEPOSIT OF OR GUARANTEED BY ANY BANK OR ANY BANK AFFILIATE.