130
Experimental investigation of oil mist explosion hazards (Phase 2) Prepared by Cardiff University Gas Turbine Research Centre for the Health and Safety Executive RR1110 Research Report

Experimental investigation of oil mist explosion hazards (Phase 2)
Prepared by Cardiff University Gas Turbine Research Centre for the Health and Safety Executive
RR1110 Research Report

© Crown copyright 2017
Prepared 2015 First published 2017
You may reuse this information (not including logos) free of charge in any format or medium, under the terms of the Open Government Licence. To view the licence visit www.nationalarchives.gov.uk/doc/open-government-licence/, write to the Information Policy Team, The National Archives, Kew, London TW9 4DU, or email [email protected].
Some images and illustrations may not be owned by the Crown so cannot be reproduced without permission of the copyright owner. Enquiries should be sent to [email protected].
This report and the work it describes were funded through a Joint Industry Project. Its contents, including any opinions and/or conclusions expressed, are those of the authors alone and do not necessarily reflect HSE policy or the views of the Joint Industry Project sponsors.
Many types of industrial equipment can potentially produce an explosive oil mist if a fault develops. However, information on the conditions in which a mist can be ignited and continue to burn is limited. To help address this, HSE and 14 industry sponsors co-funded a Joint Industry Project (JIP) on oil mist formation and ignition.
This report, produced for the JIP, describes the second phase of experimental tests to examine the ignition of mists produced by small leaks of pressurised, combustible fluids.
The size, concentration and movement of droplets were examined. The results differed significantly from those predicted by simple mist formation theories. This appeared to be the result of fundamental fluid behaviour. For all the test conditions, the droplets in the core of the spray were larger and had higher velocities than those closer to the edge. With viscous fluids the core included long ligaments, though these were difficult to measure.
These results show that simple spray models are not always appropriate for assessing the ignitability of oil mists from pressurised leaks.
ii

Lorem ipsum dolor sit amet consectetuer adipiscing elit
Kyriakos Mouzakitis and Anthony Giles (Technical Contacts) Gas Turbine Research Centre Energy Research Building Cardiff University Heol Cefn Gwrgan Margam Wales SA13 2EZ
Experimental investigation of oil mist explosion hazards (Phase 2)
iii

ABSTRACT
Flammable liquids released under pressure, at temperatures below their flash point may form
a mist which can be ignited and explode. The objective of this test programme is to provide
HSE's Buxton laboratory with experimental data that will help facilitate the development
by others of guidance on the likelihood of flammable mist formation.
This extended report describes the methodology used and the results obtained for Phase two
of the test program and an additional study of high pressure releases. The liquids concerned
with Phase two were Jet-A1, hydraulic oil and light fuel oil at ambient conditions (20 ⁰C);
and light fuel oil at an elevated temperature (70 ⁰C), with pressures varying from 5 to20 barg.
For the high pressure work, the spray characterisation and flammability of hydraulic oil at
ambient temperature and elevated pressures ranging from 30-150 barg were investigated. The
mists were generated from a 1mm plain orifice, being representative of a small leak.
The work described was conducted by staff at Cardiff University’s Gas Turbine Research
Centre (GTRC) and funded as part of an HSE Joint Industry Project.
iv

Table of Contents page no
ABSTRACT ...................................................................................................................... iv1.0 INTRODUCTION ................................................................................................. 1
2.0 EXPERIMENTAL FACILITIES........................................................................... 2
2.1 Spray Characterisation techniques ..................................................................... 2
2.2 Phase Two Rig Design ....................................................................................... 4
2.3 High Pressure study Rig design ......................................................................... 8
3.0 EXPERIMENTAL METHODS............................................................................. 11
3.1 Experimental set up ............................................................................................ 11
3.2 Experimental procedure ..................................................................................... 13
4.0 EXPERIMENTAL RESULTS............................................................................... 14
4.1 Introduction ........................................................................................................ 14
4.2 Concentration Calculation Methodology ........................................................... 14
4.3 JET-A1 Experimental Results ............................................................................ 16
4.3.1 Droplet Diameters ....................................................................................... 19
4.3.2 Concentration .............................................................................................. 22
4.4 Hydraulic Oil Experimental Results .................................................................. 25
4.4.1 Droplet Diameters ....................................................................................... 25
4.4.2 Concentration .............................................................................................. 28
4.5 LFO Ambient Experimental Results .................................................................. 30
4.5.1 Droplet Diameters ....................................................................................... 32
4.5.2 Concentration .............................................................................................. 34
4.6 LFO Heated at 70 oC Experimental Results ....................................................... 37
4.6.1 Droplet Diameters ....................................................................................... 37
4.6.2 Concentration .............................................................................................. 41
4.7 Impingement Results .......................................................................................... 44
4.8 High Pressure Hydraulic Oil Tests ..................................................................... 47
4.8.1 Droplet Diameters ....................................................................................... 48
4.8.2 Concentration .............................................................................................. 49
5.0 OBSERVATIONS ................................................................................................. 50
REFERENCES ................................................................................................................. 54
APPENDIX A: MEASURING PRINCIPLES OF A PDA SYSTEM .............................. 55
APPENDIX B: RAW PDA DATA FOR JET-A1 ............................................................ 59
APPENDIX C: RAW DATA FOR HYDRAULIC OIL................................................... 79
APPENDIX D: RAW DATA FOR LFO AT AMBIENT CONDITIONS ....................... 91
APPENDIX E: RAW DATA FOR FOR LFO HEATED 70 OC ..................................... 103
APPENDIX F: RAW DATA FOR FOR HIGH PRESSURE HYDRAULIC OIL .......... 118
v

1
1.0 INTRODUCTION
The European ATEX directives (99/92/EC and 94/9/EC) which are implemented in the UK
under the Dangerous Substances and Explosive Atmospheres Regulations (DSEAR, 2002)
require employers to classify areas into zones where explosive hazards may occur. Hazardous
Area Classification (HAC) for explosive gas atmospheres is well established, however, the
same situation is not currently the case for high flashpoint liquid releases that could give rise
to an explosive mist atmosphere. This issue was first highlighted by Bowen and Shirvill
(1994) and extended to demonstrate the relevance of low-pressure impinging releases by
Maragkos and Bowen (2002).
The test program comprised of two phases of work. Phase one consisted of ‘basic’
experiments designed to generate flammability maps for a range liquids spray releases. Phase
two incorporated more detailed analysis of the release using Phase Doppler Anemometry
(PDA) to determine droplet size and velocities to improve the understanding of conditions
leading to mist flammability.
A report describing the Phase one activity “Phase one: Flammability of Pressurized
Liquid Releases” was accepted by HSE in March 2014. An initial Phase two report
describing results and observations for work carried out during Phase two of the test program
was accepted by HSE in January 2015. This extended report describes additional high
pressure experimental study; investigating the flammability and characterising the spray
generated from high pressure releases of hydraulic oil.

2
2.0 EXPERIMENTAL FACILITIES
2.1 Spray Characterisation techniques
Phase two of the experimental program concentrated on explaining and understanding the
spray combustion physics underlying the observations from Phase one, and under-pinning
them with limited additional runs using a suite of (optical) diagnostics. There are several non-
intrusive ethods to characterise a spray such as Interferometic Particle Imaging (IPI), Shadow
sizing, Laser Induced Fluorescence, Particle Image Velocimetry and Phase Doppler
Anemometry.
The IPI technique utilises a laser with light sheet optics, a dual camera system and
appropriate software package. It can measures the size and velocity of spherical, transparent
particles such as spray droplets, glass beads or air bubbles in water.
Shadowgraphy is a technique based on high resolution imaging with pulsed backlight
illumination. The measurement volume is defined by the focal plane and the depth of field of
the imaging system. This technique measures size, shape and velocity of a wide range of
particles.
Planar Laser Induced Fluorescence (PLIF) is a diagnostic tool for the investigation of non-
reacting as well as reacting gas and liquid flows. PLIF is a non-intrusive, instantaneous flow
visualization technique with high spatial and temporal resolution and is applied to determine
different flow-field variables in the plane of a laser light sheet: concentration (mole fraction),
density, temperature and velocity fields can be derived from calibrated LIF images.
Particle Image Velocimetry (PIV) is a non-intrusive laser optical measurement technique
that measures whole velocity fields by taking two images shortly after each other and
calculating the distance individual particles travelled within this time.
Phase Doppler Anemometry (PDA) is a non-intrusive optical diagnostic technique capable
of simultaneously measuring the diameter, and up to three components of velocity of
spherical particles and droplets. The measurements are performed on single particles and are
applicable to both liquid droplets in a gas medium (e.g. a spray) and gas bubbles in a liquid
medium (e.g. gas bubbles in two-phase flows). PDA is also capable of measuring particle

3
concentrations and mass flux via interpolation (Aisa et al, 2002).It is a technique based on
absolute physical effects (e.g. light scattering, phase Doppler shift) that requires no in-situ
calibration. Also, no prerequisite assumptions on size and velocity distributions are required.
It is a technique widely used in industry for liquid spray applications, capable of dense spray
measurements. With an appropriate choice of hardware, particle sizes from 0.1 μm to over 1
mm, and velocities up to supersonic can be measured.
All the aforementioned spray measurement techniques are non- intrusive. There are also
intrusive techniques for spray analysis such as isokinetic sampling for the determination of
mass flux over a defined cross sectional area. Isokinetic sampling can increase the accuracy
and reliability of results by collecting particles in a moving stream which moves at the same
velocity in the sampling nozzle as elsewhere in the stream in order to provide a uniform,
unbiased sample.
Taking into consideration the aforementioned techniques, PDA was selected as the preferred
method for the spray characterisation as it is an absolute non- intrusive technique that
requires no calibration, no pre-requisite assumptions on droplet size distributions or velocities
and can be applied in dense sprays. Additionally, it is a point source method allowing the
examination of specific points of interest (ignition – non ignition points). Moreover, it is a
technique that can be used in all three liquids (with set- up changes) providing a “common-
ground” comparison of results; as some other optical diagnostics cannot cope with opaque
liquids and another technique would have to be implemented. In some techniques, PIV, LIF,
a seeding particle is required, which would somewhat affect the viscosity of the liquid
altering its atomisation characteristics.
Isokinetic sampling was also considered for providing more accurate results on volume flux
measurements but through a literature search was found that:
In general, the agreement between the mist fluxes measured with the PDA and iso-
kinetic sampling was within 7% near the spray centreline (Ditch and Yu, 2004).
The implementation of isokinetic sampling in a spray consisting of various droplet
sizes moving with various axial and radial velocity trajectories would be rather
challenging in determining the sampling inlet position and flow conditions.

4
In addition to the utilisation of the PDA technique for quantitatively characterising the spray
the use of high speed imaging would also be beneficial in providing a qualitative analysis of
the spray.
2.2 Phase Two Rig Design
The experimental program of Phase one was conducted in the Atmospheric Spray Rig (ASR)
(Figure 2.1) at the Gas Turbine Research Centre (GTRC), Cardiff University, Port Talbot.
The experimental apparatus consisted of three main constituents:
The pressurised fuel vessel and fuel delivery lines.
The spray chamber.
The ignition system.
Figure 2.1: The Atmospheric Spray Rig (Phase one)
Figure 2.2 provides a schematic representation of the experimental apparatus utilised to
complete Phase one.
Spray boothTraverse
Traverse Controller Fuel vessel
Heated fuel line
Flow Straightener

5
Figure 2.2: Schematic representation of the Atmospheric Spray Rig (Phase one)
Following the findings from Phase one, the rig was significantly modified in order to
undertake Phase two of the experimental program. The main constituents of the experimental
apparatus remained nominally the same, with use of a Phase Doppler Anemometry system
instead of the ignition system:
Pressurised fuel vessel delivery system.
Spray Chamber.
The Phase Doppler Anemometry (PDA) system.
Figure 2.3 shows a picture of the ASR as modified for Phase two and Figure 2.4 a schematic
representation of the rig.
The fuel vessel and Coriolis flow meter are encased in a purposed built enclosure (see
Figure 2.3) to contain any secondary releases. The fuel vessel was pressurised using nitrogen
as the pressurising medium up to 20bar and can be heated via an external electric heating
element. The two fuel delivery lines fitted in Phase one (a ½” hydraulic hose for the delivery
of high viscosity liquids, and a ¼” solid heated line) were replaced by a ½” - one piece solid
stainless steel line capable of pressures up to 200bar that can be heated via an external
electric heating element.

6
Figure 2.3: The Atmospheric Spray Rig (Phase two)
Figure 2.4: Schematic representation of the Atmospheric Spray Rig (Phase two)
Control Room
Outside½”Heated fuel line
Traverse
PDA optics
Waste fuel collector with dual flame arresters
Master PC and Data Logging Computer
Fuel Control
Traverse e-stop
Flame quenching mesh
Spray Chamber
Nitrogen Line
CO
2 Pur
ge s
yste
m
Fuel Vessel relief valve
CO
2 ga
s bo
ttle
N2 g
as b
ottle
ATEX Rated fan Extraction
Traverse controller
PDA ProcessorBSA flow processor
CO2 line
Fuel vessel enclosure
Electrically heated fuel vessel

7
The spray chamber dimensions are 1.2x1.2x2.5m. The nozzle (see Figure 2.5) was mounted
centrally and down-fired so that it created an axisymmetric spray. The nozzle diameter was
1mm with an L/D ratio of 2. The release conditions were monitored via a K-type
thermocouple and a pressure transducer at the nozzle. To protect the sensors from the flame
tracking back to the nozzle, a custom made steel enclosure was constructed. This enclosure
also encased the nozzle and would contain any potential releases from the connection joints.
Moreover steel door protectors were made and fitted, minimising reflection/glare within the
chamber for optimum data collection with the use of a PDA system.
Figure 2.5: The nozzle mounted on the spray chamber
After each release the fuel is collected in a safety can fitted with dual flame arresters via a
drain at the bottom of the spray rig. During Phase one, to prevent fuel “pooling” at the bottom
of the chamber that could potentially lead to pool fires, inclined metal plates (see Figure 2.6)
were fitted to assist and accelerate the drainage of the waste fuel accumulating at the bottom
of the ASR. Moreover nitrogen purge nozzles (see Figure 2.6) were also fitted to extinguish
any pool fires and a flame quenching mesh (see Figure 2.7) was also used to prevent the
flames from propagating to the bottom of the chamber and to the drainage pipework.
Figure 2.6: Inclined plates and nitrogen purge
nozzles (Phase one) Figure 2.7: Flame quenching mesh (Phase one)

8
Figure 2.8: Fuel collecting tray and flame quenching mesh (Phase two)
For Phase two, the fuel collection system was the main area that required a redesign. The
chamber’s support bars were removed along with the inclined plates, and were replaced by a
fuel collecting tray (see Fig 2.8) that was mounted in the base of the chamber with a centrally
located drain leading to the waste fuel collecting can. The flame quenching mesh that was
previously made of two perforated aluminium plates was replaced by a much finer gauge
“frameless” wire quenching mesh to avoid the collection of fuel on the mesh and the
possibility of any flame tracking through the join between the two mesh panels used
previously.
The nitrogen used in the purge system was replaced by carbon dioxide as it is a superior fire
extinguishing medium and as it is less buoyant, it is better suited to create an “inert”
atmosphere at the bottom of the rig. In addition, an ATEX compliant extract fan was installed
to remove any fuel vapour and carbon dioxide at the end of each test run.
2.3 High Pressure study Rig design
In order to accommodate the high pressures (up to 150 barg) of this test program, further
modifications to the ASR’s fuel pressurisation, delivery system and nozzle had to be made;
with all pipework and safety equipment checked and upgraded. Figure 2.9 depicts a
schematic representation of the experimental rig during the high pressure work.

9
Figure 2.9: Schematic representation of the Atmospheric Spray Rig (High Pressure)-PDA set up
The fuel vessel used in the previous phases was replaced by a four litre hydro pneumatic
bladder accumulator (see Figure 2.10) capable of delivering pressures up to 200 barg. The
liquid is stored in a closed cup storage vessel and pumped to the accumulator, which is
subsequently pressurised via nitrogen to the desired delivery pressure.
Figure 2.10: Hydro pneumatic accumulator capable of deliver pressures up to 200 barg
Control Room
Outside½”Heated fuel line
Traverse
PDA optics
Waste fuel collector with dual flame arresters
Master PC and Data Logging Computer
Fuel Control
Traverse e-stop
Flame quenching mesh
Spray Chamber
Nitrogen Line
CO
2 Pur
ge s
yste
m
Accumulator C
O2 ga
s bo
ttle
N2 g
as b
ottle
ATEX Rated fan Extraction
Traverse controller
PDA ProcessorBSA flow processor
CO2 line
Fuel vessel enclosure

10
Moreover, a new nozzle (see Figure 2.11) was constructed to ensure it would endure the
elevated pressures. The nozzle diameter was 1mm with an L/D ratio of 2. The release
conditions were monitored via a K-type thermocouple and a pressure transducer at the nozzle.
All other rig components remained nominally the same.
Figure 2.11: Nozzle assembly for high pressure work.

11
3.0 EXPERIMENTAL METHODS
The PDA system used in Phase two of the experimental program was an off-the-shelf system
provided by DANTEC DYNAMICS. This system is comprised of a transmitter, a BSA P60
Flow and Particle Processor, and a Fiber PDA detector unit (which is shown in Figure 3.1).
The laser used was a Coherent Innova 70-5 Series Argon-Ion Laser. A brief description of the
PDA measuring principles can be found in Appendix A.
Figure 3.1: PDA optics set up
3.1 Experimental set up
In Phase two set up the Coherent Innova 70-5 Series Argon-Ion laser was set at a power
output of 4W. The laser light was split into three pairs of beams providing six in total – two
green, two blue and two violet beams. One beam from each of the three pairs was shifted in
frequency by 40MHz to overcome directional ambiguity inherent in the PDA technique. Four
of the six beams (the two greens and two blues) were sent to the transmitting optics via fibre
optic cables. The laser wavelengths of 514.5 nm (corresponding to green visible light) and
488 nm (corresponding to blue visible light) were used to perform velocity measurements in

12
the nozzle axial and radial directions respectively. The green pair were used for velocity (v
component) and droplet size measurements and the blue pair were used for velocity (u
component) and validation checks. The violet beams (with a wavelength of 476.5 nm) were
not required for 2D PDA systems but were used to help align the green and blue beams
within the control volume to ensure an optimal set-up.
The receiving optics was located in the same plane as the transmitting optics but off-set at an
angle which is dependent on the liquids refractive index and scattering method used. For
PDA testing of fuels with dominant first order refraction (JET-A1 and Hydraulic oil) an angle
of 69 degrees was used (calculated from their respective refractive indices). For the LFO
Ambient and LFO Heated to 70 oC test cases, the preferred scattering mode was reflection
with an angle of 105 degrees, due to LFO’s high refractive index.
A 112 mm FiberPDA transmitting optic with a beam spacing of 74 mm and a nominal beam
diameter of 1.5mm was used. The transmitting and receiving optics were equipped with
lenses with a focal length of 600 mm to cope with the large dimensions of the spray chamber.
Both the transmitting and receiving optics were mounted on a computer-controlled traverse
allowing remote fine adjustment of the optics location. The traverse employed allowed
controlled motion in 3-axes, with over 1m of travel and an accuracy of 0.1 mm in each axis.
The measurable droplet size ranges are affected by beam separation, focal length and aperture
plates selected. The first two parameters cannot be altered in the given set-up (beam
separation is determined by the transmitting optics used and focal length cannot be less than
600 mm to accommodate the dimensions of the spray chamber). However, different aperture
plates can be used to modify the measurable droplet size ranges and therefore optimise PDA
arrangement for the sprays investigated. For the JET-A1 tests aperture plate B was used
which allowed measurements of droplets up to 265 μm, since the expected SMD was in the
order 100-190 μm. For the hydraulic oil and light fuel oil testing, aperture plate C was used
which allowed for measurements of droplets up to 967.4 μm. However, for the high pressure
hydraulic oil test cases a combination of aperture plate C and B was used, as the anticipated
droplet size would reduce. These size ranges were found to capture droplet size data at all
investigated operating conditions. A spherical validation band of 20% was selected for all
tests performed. DANTEC DYNAMICS BSA Flow Software v. 4.50 was used for all PDA
tests in this investigation.

13
3.2 Experimental procedure
Prior to initiating testing of the current phase the PDA hardware and software had to be
configured. This involved the following:
Aligning the transmitting optics to ensure the green pair and blue pair of beams were
in the same vertical and horizontal planes.
Aligning all four fibre optic cables at the laser so as much of the laser beams as
possible was captured and sent to the transmitting optics.
Maximising and regulating beam power so all beams possessed the same power
ratings.
Aligning both pairs of beams within the control volume using a photo-sensitive cell.
Focussing the receiving optics on the control volume using a controlled spray from a
nebuliser.
Setting up appropriate data acquisition files in the BSA flow software and fine tuning
the PDA receiving optics to ensure optimal set up at each radial and axial location.
Once these steps were completed the PDA system was traversed to the desired location. The
data acquisition system and PDA were initiated before the fuel being released. The PDA
system was set to acquire a maximum of 50000 samples or to sample continuously for a 40
second window spanning the entire duration of the 30second release, allowing an extra ten
seconds for capturing any quiescent droplets. Once the data had been collected it was then
saved in an appropriate file format for further processing.
For the high pressure work the experimental procedure was modified due to the high
flowrates:
For the flammability studies the fuel was released for six seconds, with up to five
repetitions to prove a non-ignition event.
For the spray characterisation the liquid was released for ten seconds in each
characterisation run.
All other steps of the experimental procedure remained the same as in each respective test
phase.

14
4.0 EXPERIMENTAL RESULTS
4.1 Introduction
As previously mentioned, Phase two of this project involved carrying out limited additional
testing in order to gather data to aid in explaining and understanding the spray combustion
physics underlying the observations from Phase one. The main parameters of interest in the
characterisation of a liquid release / spray are the type of break-up, the break-up length, the
droplet size distribution produced and the velocity profiles of the droplets / jet. In addition,
the calculation of the local droplet concentration is useful for determining the minimum
amount of fuel required for flame propagation through the release.
Comparisons were made between the correlations from literature and the results of
measurements taken during Phase two; with the aim being to develop understanding in order
to progress towards practical guidance.
4.2 Concentration Calculation Methodology
This section describes the methodology used to calculate the local concentration of droplets
within the spray for the liquid spray releases.
For all the nozzle pressures analysed the spray produced by the liquid releases consisted of a
high velocity central dense liquid core surrounded by a slower moving, less dense spray.
Different problems exist in measuring the fuel concentration within the central core of the
spray to that near the flammable limit, as the droplet concentration within the high velocity
central jet is many times higher than that in the surrounding finer spray. In determining the
local concentration, the methodology by which PDA measures individual droplets needs to be
examined.
The measurement of droplet sizes using PDA takes place in the intersection between two
incident laser beams, and the measuring volume is defined as the volume within which the
modulation depth is higher than e-2
times the peak core value. Due to the Gaussian intensity

15
distribution in the laser beams the measuring volume is an ellipsoid as indicated in Figure
4.1.
Figure 4.1: PDA measuring volume
The size of the measuring volume can be calculated from the beam waist diameter df of the
focused laser beams and the angle θ between them:
𝑑𝑥 =𝑑𝑓
𝑐𝑜𝑠(𝜃2⁄ )
𝑑𝑦 = 𝑑𝑓 𝑑𝑧 =𝑑𝑓
𝑠𝑖𝑛(𝜃2⁄ )
(4.1)
In order to increase the resolution of the measuring volume, the PDA receiving optics view
the control volume through a slit aperture. The effective length of the cross-section of the
control volume visible is given by:
𝑑𝐿 = 𝐿𝑠𝑠𝑖𝑛𝜑⁄ (4.2)
where Ls is the slit aperture size (0.2mm) and φ is the scattering angle.
During the gathering of data, the PDA system measures the Doppler bursts for droplets as
they pass through the measuring volume. Each Doppler burst detected is counted, but to
optimise data gathering droplet velocities and sizes cannot be determined for every detected
burst. However, it is accepted that the measured velocity and size profiles of the validated
droplet samples is representative of the overall distributions.
To calculate from first principles a basic concentration value for the low density mist near the
“flammable limit”, first the total number of detected droplets (N), and the Volume Mean
Diameter (D30) can be used to provide a value for the total fuel volume of fuel that travelled
through the control volume during the sample period (T).

16
𝑇𝑜𝑡𝑎𝑙 𝐹𝑢𝑒𝑙 𝑣𝑜𝑙𝑢𝑚𝑒 =4
3𝑁𝜋 (
𝐷30
2)
3
(4.3)
The mean residence time of a droplet within the measuring volume is dx/U, where U is the
mean axial velocity of the droplets. Therefore the instantaneous fuel volume of fuel within
the control volume is:
𝐼𝑛𝑠𝑡𝑎𝑛𝑡𝑎𝑛𝑒𝑜𝑢𝑠 𝐹𝑢𝑒𝑙 𝑉𝑜𝑙𝑢𝑚𝑒 = 4
3𝑁𝜋 (
𝐷30
2)
3
.𝑑𝑥
𝑈𝑇(4.4)
Knowing the size of the measuring volume and the density of the fuel it is therefore
straightforward to provide a mean mass concentration for each measurement location.
In addition to this basic methodology for calculating the droplet concentration, for some
release points the Dantec PDA software was able to provide a concentration value based on
an inbuilt algorithm.
4.3 JET-A1 Experimental Results (Flashpoint = 38⁰C)
JET- A1 liquid spray characterisation results together with a limited analysis of the data are
presented in this section.
Figure 4.2 shows the positions at which PDA measurements of the JET-A1 releases were
undertaken together with the results of the flammability studies carried out in Phase one. For
each of the three axial locations at which PDA measurements could be taken, results were
obtained for the central axial position as well as radial positions either side of the “flammable
limit”. Measurements of any droplet distributions for all of the points within the releases are
to be used to ascertain the likely droplet distribution for the overall release, which can then be
compared to that predicted within the literature.
Figure 4.3 displays a sample of the PDA measurements obtained (at the 600mm axial,
000mm radial position for a 15barg release of JET-A1); with histograms showing the
measured axial and radial velocity and droplet size distributions. The axial velocity profile is
represented by LDA1, with the negative velocity representing the downwards spray direction.
The radial velocity profile is represented in LDA4, with negative velocities being outwards
from the spray centre (towards the detector).

17
The overall shape profile of the JET-A1 releases for all the pressures at which measurements
were taken (5 to 20barg) consisted of a high velocity central dense liquid core surrounded by
a slower moving, less dense spray. At the centreline (000mm radial) location at which the
results shown in Figure 4.3 were taken, the measured droplets within the central jet are seen
to be moving over a range of axial velocities between 11 and 52m/s; with a mean axial jet
velocity of 33.8m/s. The profile of the radial velocities of the droplets measured is centred at
approximately 0m/s, signifying that at the centreline positions there is very little overall radial
motion of the droplets seen in the release; which is to be expected with an axisymmetric
spray.
The measured droplet sizes shown in Figure 4.3 for the 600mm axial, 000mm radial position
illustrate that for liquids such as JET-A1, a pressurised release produces a wide range of
droplet sizes (further analysis of the droplet measurements taken for the full JET-A1 dataset
are described in the section 4.3.1).
The results of the PDA droplet characterisation for the JET-A1 dataset are shown in Table
4.1. It can be seen that at each of the axial locations that when the release pressure is
increased, the mean axial centreline velocity of the measured droplets also increases. Also it
can be seen that as the axial distance is increased (i.e. the measurement position is moved
further away from the nozzle), there is also a decrease in the mean axial velocity of the
droplets measured. At all pressures and axial distances the mean radial velocity of the
droplets measured is negligible when compared to the downwards velocity of the central
liquid core.
Comparing the mean axial velocity measured for the droplets near to the flammable limit to
that observed within the central core of the spray, it can be seen that the velocities are
significantly lower away from the central core.

18
Figure 4.2: JET- A1 flammability study results and PDA measurement positions

19
Figure 4.3: Sample PDA results (15barg release, 600mm axial, 000mm radial)
4.3.1 Droplet Diameters
For each of the locations at which droplet measurements were taken, histograms have been
obtained for the axial and radial velocities as well as the droplet sizes (the histograms for
each measurement location are included in Appendix B).
From the compiled droplet size data several different mean diameters can be calculated, some
of which are presented in Table 4.1. Each of the mean diameters shown in Table 4.1 has
applications in different types of spray analysis; such as that used in calculating volumetric
and mass fluxes as well as in reaction rate, evaporation and combustion calculations. For the
purposes of the analysis carried out here the most important of these mean diameters are the
Arithmetic Mean Diameter (D10), the Volume Mean Diameter (D30) and the Sauter Mean
Diameter (D32).

20
Table 4.1: JET-A1 droplet measurement summary
Pressure
(barg)
Position
(mm)
Number
of
Droplets
Mean Droplet
Velocity (m/s) Mean Droplet Diameter (μm)
Axial Radial Axial Radial D10 D20 D21 D30 D31 D32 D43
5
300
000 148117 -22.1 -0.11 43.7 61.9 87.8 79.5 107.2 131.0 159.5
045 44 -0.49 -0.15 69.3 84.9 104.1 93.5 108.6 113.2 116.4
055 30 -0.21 -0.18 27.4 31.4 36.1 34.3 38.4 40.9 43.9
600
000 165304 -20.9 -0.10 61.3 81.6 108.6 99.2 126.1 146.4 170.3
045 4510 -1.45 0.09 59.1 76.9 100.0 92.2 115.1 132.6 156.8
055 1435 -1.05 0.23 56.0 73.3 96.0 88.5 111.2 128.8 154.2
900
000 168940 -17.7 -0.14 69.2 88.4 112.9 104.6 128.6 146.5 168.6
050 10759 -2.81 0.23 51.2 69.1 93.2 85.2 109.8 129.4 154.9
080 1755 -1.15 0.07 42.2 57.0 77.0 70.0 90.2 105.6 125.3
10
300
000 132889 -29.6 -0.13 37.8 51.1 69.1 65.3 85.8 106.5 138.3
045 523 -0.47 -0.19 30.7 44.5 64.5 58.0 79.6 98.4 119.0
055 162 -0.30 -0.12 30.9 45.4 66.9 58.8 81.0 98.3 115.8
600
000 217291 -28.4 -0.10 52.2 67.3 86.8 81.9 102.5 121.1 148.1
075 2425 -0.71 -0.03 44.7 59.0 77.8 71.8 90.9 106.2 131.0
085 1386 -0.39 -0.06 36.9 47.5 61.1 56.1 69.1 78.1 89.7
900
000 173767 -23.3 -0.12 57.7 73.6 93.9 88.2 109.1 126.8 151.6
095 5969 -0.82 0.03 45.7 59.7 78.0 71.2 88.9 101.3 118.0
105 2856 -0.75 0.08 37.6 51.6 70.7 63.4 82.2 95.6 111.1
15
300
000 242638 -36.5 -0.21 38.0 48.0 60.8 59.3 74.1 90.4 121.8
060 475 -0.49 -0.17 20.0 28.1 39.3 36.4 49.0 61.1 74.5
075 714 -0.17 -0.19 16.7 22.7 30.8 29.5 39.3 50.2 64.6
600
000 252098 -33.8 -0.14 48.8 61.2 76.7 73.7 90.5 106.8 133.7
110 5122 -0.26 -0.07 27.0 39.4 57.5 51.4 71.0 87.6 107.0
130 557 -0.10 -0.13 17.7 22.5 28.7 26.9 33.2 38.4 44.4
900
000 215973 -27.4 -0.16 54.5 68.0 84.9 81.0 98.8 115.1 140.4
125 6136 -0.44 -0.09 26.6 38.9 56.8 50.2 69.0 83.8 99.3
150 2165 -0.20 -0.15 24.8 34.4 47.6 43.8 58.1 70.9 87.8
20
300
000 309297 -43.3 -0.23 38.6 48.2 60.2 59.2 73.3 89.3 122.2
060 1506 -0.17 -0.29 15.2 18.8 23.1 22.1 26.7 30.9 36.6
075 473 -0.30 -0.24 17.6 20.6 24.1 23.2 26.6 29.3 33.0
600
000 441127 -36.2 -0.40 61.0 72.3 85.7 83.4 97.6 111.1 135.2
110 5364 -0.17 -0.10 17.8 22.2 27.7 26.8 32.9 39.0 48.7
155 1212 -0.15 -0.12 19.7 25.4 32.6 30.6 38.1 44.6 52.4
900
000 280262 -30.8 -0.41 50.1 62.8 78.7 75.6 92.8 109.3 137.0
150 1865 -0.21 -0.09 15.8 22.0 30.7 29.0 39.3 50.3 65.3
170 1999 -0.10 -0.20 16.1 21.1 27.7 26.6 34.1 42.0 53.9

21
The Arithmetic Mean Diameter (D10) is the ensemble or (arithmetic) number mean diameter
of the measured droplet samples and is useful for analysing the general composition of the
spray. Looking at the calculated values for D10 there is a general trend in which the
Arithmetic Mean Diameter of the measured droplets increases as the axial distance from the
orifice is increased; possibly due to larger droplets having greater momentum and being less
buoyant than the smaller droplets, and are therefore less able to move away from the central
core.
The Volume Mean Diameter (D30) is calculated from the mean of the measured droplet
volumes and is most useful for the analysis of a sprays mass flux. The measured values for
D30 obtained for the JET- A1 releases show that away from the central core of the spray, the
values for D30 are consistent. Within the central core of the spray the D30 are larger than the
surrounding spray, and tend to increase as the spray moves away from the release; suggesting
that the smaller droplets are either coalescing or moving away from the central core.
The Sauter Mean Diameter (D32 or SMD) is probably the most widely used mean diameter
for assessing the quality of a spray and is defined as the diameter of a sphere that has the
same volume/surface area ratio as that of the entire spray. From Table 4.1 It can be seen that
the SMD calculated for the JET-A1 releases is larger in the central core of the spray and
again increases as the distance from the orifice is increased.
Figure 4.4: Comparison of measured SMD to literature correlations

22
Figure 4.4 displays the measured SMD values for all location points and compares them to
the global SMD predicted by correlations in literature (using the measured nozzle pressure
differential and release flow rates). It can be seen in Figure 4.3 that the Miesse (1955)
correlation predict SMD values for the spray releases much larger than that measured in this
study. The TNO Yellow book (2005) and Faeth (1991) correlations predict larger SMD
values at the lower release pressures than that measured. The measured SMD values compare
favourably to that predicted by the Maragkos (2002) correlation, with the largest measured
SMD at each release pressure being near to the predicted value. Whilst providing reasonably
good predictions for the well-atomised kerosene releases, it is expected to perform less well
in predicting mean droplet size for poorly atomised jet releases.
From Table 4.1 it can be seen that the average measured SMD for the positions at which
ignitions occurred and did not occur during Phase one are 86.15 μm and 64.93 μm.
Therefore, it can be seen that SMD cannot be used on its own to assess the flammability of a
mist.
4.3.2 Concentration
This section presents the results obtained for the local droplet concentration calculations for
JET-A1. The calculated JET-A1 concentrations for all the test locations are listed in Table 4.2
and the mass per unit volume concentration values are shown in Figure 4.5.
The Dantec PDA software is capable of calculating mass flux and concentrations, however
the software requires a statistically large enough sample before this calculation is carried out.
Near the edge of the “ignition envelope” (i.e. away from the central core of the spray) the
droplet numbers are too low for the Dantec software to provide a concentration / mass flux
value. The concentrations calculated for the centreline locations are presented in Table 4.2 for
comparison.
From an examination of the calculated concentration values shown in Table 4.2 and Figure
4.5 it can be seen that the minimum calculated concentration from the PDA measurements for
an “Ignition” point can be as low as 2.67 g/m3. However the average concentration of the
ignition positions (which represent the outer ignitable limit found during Phase one) was

23
68.53 g/m3. In addition, the average value of the “Non-Ignition” points from the PDA
measurements was 21.13 g/m3.
Figure 4.5: Calculated mass per unit volume concentrations for all JET-A1 measurement points
At the centreline positions, for all release pressures and axial locations the average number of
detected droplets per second was in excess of 12,000. This illustrates how dense the JET-A1
spray is in the central core compared to near the edge of the “ignition envelope”, where the
maximum mean droplet detection rate was 280 droplets per second. Obtaining measurements
of dense sprays, such as that seen in the central core of the JET-A1 releases studied is very
challenging; as such the uncertainty in the derived concentration values for the centreline
positions is much greater.
The very low droplet numbers in the region surrounding the “ignition envelope” for the JET-
A1 releases means that even though there is a high degree in confidence of the calculated
mean concentrations, the instantaneous concentration during the release is likely to have a
much higher degree of variation due to the transient nature of the spray formed in the releases
studied.

24
Table 4.2: Concentration Calculations
Pressure (barg)
Position (mm) Mean Droplet
Axial Velocity
(m/s)
Sample Period
(s)
Number of
Droplets
Total Measured
Droplet Volume
(m3)
Droplet Concentration
Axial Radial Vol/Vol Mass/Vol
(g/m3)
Dantec Derived
Mass/Vol (g/m
3)
5
300
000 -22.11 10.06 148117 3.90E-08 9.55E-04 764.1 886.7
045 -0.49 40 44 1.88E-11 5.22E-06 4.180 NA
055 -0.21 40 30 6.30E-13 4.09E-07 0.327 NA
600
000 -20.87 11.83 165304 8.45E-08 1.87E-03 1493.3 1160.0
045 -1.45 40 4510 1.85E-09 1.74E-04 139.3 NA
055 -1.05 40 1435 5.21E-10 6.76E-05 54.11 NA
900
000 -17.73 10.16 168940 1.01E-07 3.07E-03 2452.1 1803.9
050 -2.81 40 10759 3.48E-09 1.69E-04 135.3 215.5
080 -1.15 40 1755 3.15E-10 3.74E-05 29.90 NA
10
300
000 -29.57 10.10 132889 1.94E-08 3.54E-04 283.0 313.9
045 -0.47 40 523 5.34E-11 1.55E-05 12.39 NA
055 -0.30 40 162 1.73E-11 7.86E-06 6.287 NA
600
000 -28.35 14.66 217291 6.25E-08 8.21E-04 656.5 518.9
075 -0.71 40 2425 4.70E-10 9.03E-05 72.23 NA
085 -0.39 40 1386 1.28E-10 4.48E-05 35.84 NA
900
000 -23.27 10.0 173767 6.24E-08 1.46E-03 1170.6 696.4
095 -0.82 40 5969 1.13E-09 1.88E-04 150.1 225.73
105 -0.75 40 2856 3.81E-10 6.93E-05 55.44 NA
15
300
000 -36.51 16.34 242638 2.65E-08 2.42E-04 193.8 177.9
060 -0.49 40 475 1.20E-11 3.34E-06 2.671 NA
075 -0.17 40 714 9.59E-12 7.70E-06 6.157 NA
600
000 -33.8 16.18 252098 5.28E-08 5.27E-04 421.6 316.4
110 -0.26 40 5122 3.64E-10 1.91E-04 152.9 NA
130 -0.10 40 557 5.67E-12 7.74E-06 6.189 NA
900
000 -27.36 13.80 215973 6.01E-08 8.68E-04 694.6 677.6
125 -0.44 40 6136 4.06E-10 1.26E-04 100.8 NA
150 -0.20 40 2165 9.53E-11 6.50E-05 51.97 NA
20
300
000 -43.31 20.95 309297 3.36E-08 2.02E-04 161.6 134.3
060 -0.17 40 1506 8.51E-12 6.83E-06 5.462 NA
075 -0.30 40 473 3.09E-12 1.41E-06 1.125 NA
600
000 -36.15 40 441127 1.34E-07 5.05E-04 404.4 213.3
110 -0.17 40 5364 5.41E-11 4.34E-05 34.70 44.29
155 -0.15 40 1212 1.82E-11 1.65E-05 13.23 NA
900
000 -30.79 17.63 280262 6.34E-08 6.37E-04 509.8 520.3
150 -0.21 40 1865 2.38E-11 1.55E-05 12.37 NA
170 -0.10 40 1999 1.97E-11 2.69E-05 21.49 NA

25
4.4 Hydraulic Oil Experimental Results (Flashpoint = 223⁰C)
Hydraulic oil liquid spray characterisation results together with a limited analysis of the data
are presented in this section.
Figure 4.6 shows the positions at which PDA measurements of the hydraulic oil releases were
carried out together with the results of the flammability studies carried out in Phase one. For
each of the three axial locations at which PDA measurements could be taken, results were
obtained for the central axial position and the radial position at which ignition was attempted
during Phase one. Analysis of the droplet measurements and concentration calculations for
the hydraulic oil dataset are described in sections 4.4.1 and 4.4.2 respectively.
4.4.1 Droplet Diameters
The results of the PDA droplet characterisation for the hydraulic oil dataset are shown in
Table 4.3. For each of the locations at which droplet measurements were taken, histograms
have been obtained for the axial and radial velocities as well as the droplet sizes (the
histograms for each measurement location are included in Appendix C).
The overall release profile of the hydraulic oil for all the pressures at which measurements
were taken (5 to 20barg) consisted of a central high velocity liquid core, which was
surrounded by a very small number of slower moving droplets in the form of a low density
spray.
From Table 4.3 it can be observed that at all pressure cases and axial distances, the mean
radial velocity of the droplets is significantly lower compared to the axial velocity
component. Also, as the pressure increases the mean axial velocity increases. Unlike the JET-
A1 liquid releases no other velocity trends can be identified due to low droplet count in most
test points. On the other hand, the low droplet count highlights the fact that the hydraulic oil
consists of a solid jet which possibly only shows signs of breaking-up at the 900mm
downstream position at the higher pressures tested. Even, at the 20bar case the droplet count
is merely about one thousand droplets at the 300 mm and 600mm axial locations and only at

26
the 900mm central position do we see several thousand droplets recorded, indicating that the
break- up of the liquid core begins to occur in that region.
Figure 4.6: Hydraulic oil flammability study results and PDA measurement positions

27
Moreover, Table 4.3 shows that at each axial location as the release pressure is increased the
SMD decreases (when a sample of at least several hundred droplets is considered). Also it
can be observed that as the axial distance is increased the SMD decreases. Figure 4.7
compares the experimentally measured SMD to SMD predictions from the literature (using
the measured nozzle pressure differential and release flow rates). For the hydraulic oil
releases there is a much greater range of measured SMD values; however it can be seen in
Figure 4.7 that the Miesse (1955) correlation again predicts SMD values for the spray
releases much larger than those measured in this study. The TNO Yellow book (2005) and
Faeth (1991) correlations predict larger SMD values at the lowest release pressures than that
measured. If only the positions at which more than 1000 droplets were seen are considered,
the Maragkos (2002) correlation consistently predicts a SMD value close to that measured
over the range of release pressures.
Table 4.3: Hydraulic Oil droplet measurement summary
Pressure
(barg)
Position
(mm)
Number
of
Droplets
Mean Droplet
Velocity (m/s) Mean Droplet Diameter (μm)
Axial Radial Axial Radial D10 D20 D21 D30 D31 D32 D43
5
300 0 1084 -18.75 -0.34 367.3 405.3 447.2 425.4 457.8 468.8 482.4
12 0 0.00 0.00 0.00 0.00 0.00 0.00 0.00 0.00 0.00
600 0 400 -9.98 0.00 161.8 198.9 244.5 220.3 257.1 270.5 276.5
18 1 -9.04 3.82 88.2 88.2 88.2 88.2 88.2 88.2 88.2
900 0 4 -2.68 -1.22 5.90 5.90 5.90 5.90 5.90 5.90 5.90
20 0 0.00 0.00 0.00 0.00 0.00 0.00 0.00 0.00 0.00
10
300 0 21 -23.18 -1.56 274.2 316.1 364.3 345.6 388.0 413.2 443.0
15 132 -0.02 -0.02 6.67 7.00 1.58 7.34 7.70 8.06 8.65
600 0 296 -37.66 -4.15 341.2 391.3 448.8 412.7 454.0 459.2 464,0
20 235 -0.18 0.08 20.6 21.9 23.3 23.2 24.7 26.1 29.0
900 0 269 -5.71 -0.30 52.3 81.5 126.9 119.2 179.9 254.9 342.7
25 18 -0.60 -0.20 9.8 11.3 12.9 12.5 14.2 15.5 16.8
15
300 0 58 -0.09 -0.06 10.6 12.1 13.7 13.2 14.8 16.0 17.0
17 0 0.00 0.00 0.00 0.00 0.00 0.00 0.00 0.00 0.00
600 0 54 -8.65 -0.47 63.4 139.7 307.9 214.9 395.5 508.2 549.0
20 108 -0.70 0.12 17.1 27.3 43.4 39.1 59.1 80.3 103.6
900 0 1873 -6.97 0.13 46.9 83.2 147.5 125.4 205 284.9 356.6
30 270 -0.67 0.07 39 50.8 66.2 59.3 73.2 81.0 88.3
20
300 0 2599 -13.15 -0.18 34.6 86.3 215.1 143.2 291.4 394.7 442.4
20 102 -0.10 -0.05 14.0 16.0 18.3 17.6 19.8 21.4 23.5
600 0 1307 -9.52 -0.30 44.4 94.5 200.9 149.2 273.5 372.3 441.3
25 694 -0.29 -0.04 12.1 19.6 31.7 27.9 42.3 56.5 66.9
900 0 13936 -8.98 -0.22 44.8 80.2 143.5 128.9 218.6 333.1 441.2
35 518 -0.53 0.04 24.6 54.3 120.2 106.9 222.9 413.3 547

28
Figure 4.7: Comparison of measured SMD to literature correlations for Hydraulic oil
4.4.2 Concentration
The calculated concentrations for all the test locations are listed in Table 4.4 and the mass per
unit volume concentration values are shown in Figure 4.8. The droplet numbers are too low
for the Dantec software to provide a concentration / mass flux value. To note that no ignition
was observed for hydraulic oil at any test condition.
Concentration values shown in Table 4.4 and Figure 4.8 show that in most cases the
calculated concentration is below the widely accepted LEL of 50 g/m3. However, in three test
points the concentration was higher than 50 g/m3 but due to the low volatility of the hydraulic
oil, the low number of droplets present in the region and their large SMD value ignition was
not observed during Phase one.

29
Table 4.4: Hydraulic Oil Concentration Calculation
Pressure
(barg)
Position (mm) Mean
Droplet
Axial
Velocity
(m/s)
Sample
Period
(s)
Number
of
Droplets
Total
Measured
Droplet
Volume
(m3)
Droplet Concentration
Axial Radial Vol/Vol Mass/Vol
(g/m3)
Dantec
Derived
Mass/Vol
(g/m3)
5
300 0 -18.75 40 1084 4.37E-08 3.18E-04 276.5 NA
12 0.00 40 0 0.00E+00 0.00E+00 0.0 NA
600 0 -9.98 40 400 2.24E-09 3.06E-05 26.62 NA
18 -9.04 40 1 3.59E-13 5.42E-09 4.72E-03 NA
900 0 -2.68 40 4 4.30E-16 2.19E-11 1.90E-05 NA
20 0.00 40 0 0.00E+00 0.00E+00 0.0 NA
10
300 0 -23.18 40 21 4.54E-10 2.67E-06 2.323 NA
15 -0.02 40 132 2.74E-14 1.87E-07 0.162 NA
600 0 -37.66 40 296 1.09E-08 3.95E-05 34.36 NA
20 -0.18 40 235 1.54E-12 1.16E-06 1.014 NA
900 0 -5.71 40 269 2.38E-10 5.69E-06 4.950 NA
25 -0.60 40 18 1.84E-14 4.18E-09 0.004 NA
15
300 0 -0.09 40 58 6.93E-14 1.05E-07 0.091 NA
17 0.00 40 0 0.00E+00 0.00E+00 0.0 NA
600 0 -8.65 40 54 2.81E-10 4.43E-06 3.855 NA
20 -0.70 40 108 3.38E-12 6.58E-07 0.573 NA
900 0 -6.97 40 1873 1.93E-09 3.78E-05 32.93 NA
30 -0.67 40 270 2.95E-11 6.01E-06 5.226 NA
20
300 0 -13.15 40 2599 4.00E-09 4.15E-05 36.06 NA
20 -0.10 40 102 2.90E-13 3.95E-07 0.344 NA
600 0 -9.52 40 1307 2.27E-09 3.25E-05 28.32 NA
25 -0.29 40 694 7.90E-12 3.71E-06 3.231 NA
900 0 -8.98 40 13936 1.56E-08 2.37E-04 206.5 NA
35 -0.53 40 518 3.31E-10 8.52E-05 74.16 NA

30
Figure 4.8: Calculated mass per unit volume concentrations for all Hydraulic oil measurement points
4.5 LFO Ambient Experimental Results (Flashpoint = 81⁰C)
Light Fuel Oil at Ambient conditions spray characterisation results together with a limited
analysis of the data are discussed in this section.
Figure 4.9 shows the positions at which PDA measurements of the LFO Ambient releases
were carried out together with their relation to the results of the flammability studies carried
out in Phase one. For each of the three axial locations at which PDA measurements could be
taken, results were obtained for the central axial position and the radial position at which
ignition was attempted during Phase one. Analysis of the droplet measurements and
concentration calculations for the LFO at ambient conditions dataset are described in section
4.5.1 and 4.5.2.

31
Figure 4.9: LFO Ambient flammability study results and PDA measurement positions

32
4.5.1 Droplet Diameters
The results of the PDA droplet characterisation for the LFO Ambient dataset are shown in
Table 4.5. For each of the locations at which droplet measurements were taken, distributions
have been obtained for the axial and radial velocities as well as the droplet sizes (the
histograms for each measurement location are included in Appendix D).
The overall release profile of the LFO ambient is similar to the hydraulic oil. For all the
pressures at which measurements were taken (5 to 20barg) consisted of a central high
velocity liquid core surrounded by slower moving droplets in the form of a much less dense
spray.
It is noted from Table 4.5 that for all pressure cases and axial distances, the mean radial
velocity of the droplets is significantly lower when compared to the axial velocity
component. Moreover, as the pressure increases the mean axial velocity increases. In
common with the hydraulic oil liquid releases no other velocity trends can be identified due
to low droplet count at most test points. The low droplet count highlights the fact that the
LFO ambient releases consisted of a liquid core which only possibly starts to break-up at the
900mm downstream position at higher release pressures. Even, at the 20bar case the droplet
count is only just over one thousand droplets at the 600mm axial location and at the 900mm
axial position we get to see several thousand droplets recorded, indicating that the break-up
of the liquid core begins to occur in that region.
Moreover, from Table 4.5 shows that at each axial location as the release pressure is
increased the SMD decreases1. Also it can be observed that as the axial distance is increased
the SMD decreases1. Figure 4.10 compares the experimentally measured SMDs for the LFO
ambient releases to the SMDs predicted in the literature (using the measured nozzle pressure
differential and release flow rates). Similar to that shown for the hydraulic oil releases, there
is large range in measured SMD values at each of the release pressures studied; however it
can be seen in Figure 4.10 that the Miesse (1955) correlation is again predicting SMD values
for the spray releases larger than that measured in this study for the lower release pressures.
The TNO Yellow book (2005), Faeth (1991) and Maragkos (2002) correlations predict SMD
values that sit within the range of that measured. If only the positions at which more than
1 Mostly evident in the 900mm axial position where the sample is in the order of a few hundred to thousands
droplets

33
1000 droplets were recorded are considered, the Maragkos (2002) correlation under-predicts
the SMD over the range of release pressures by a similar margin to the over-prediction by
Miesse (1955); with the measured SMD sitting in between the values predicted by these
correlations. As it is more conservative to use a correlation that under predicts the droplet
SMD produced during a release, of the correlations applied that of Maragkos (2002) is
suggested for modelling work.
Table 4.5: LFO Ambient droplet measurement summary
Pressure
(barg)
Position
(mm)
Number
of
Droplets
Mean Droplet
Velocity (m/s) Mean Droplet Diameter (μm)
Axial Radial Axial Radial D10 D20 D21 D30 D31 D32 D43
5
300 000 0 0.0 0.0 0.00 0.0 0.0 0.00 0.0 0.0 0.00
010 0 0.0 0.0 0.00 0.0 0.0 0.00 0.0 0.0 0.00
600 000 0 0.0 0.0 0.00 0.0 0.0 0.00 0.0 0.0 0.00
012 0 0.0 0.0 0.00 0.0 0.0 0.00 0.0 0.0 0.00
900 000 400 -18.8 -0.31 603.5 663.7 730.0 704.1 760.6 792.4 826.5
015 0 0.0 0.0 0.00 0.0 0.0 0.00 0.0 0.0 0.00
10
300 000 14 -0.5 0.0 24.7 27.2 29.8 29.8 32.8 36.0 41.7
010 34 -4.1 0.16 74.1 123.0 204.2 186.1 295.0 426.1 505.2
600 000 11 -12.2 -0.8 77.6 84.4 91.9 91.4 99.2 107.1 119.8
012 1 -20.4 1.35 104.0 104.0 104.0 104.0 104.0 104.0 104.0
900 000 5864 -25.6 -0.45 282.3 374.3 496.3 447.7 563.8 640.5 723.9
022 40 -7.4 0.94 95.8 118.3 146.1 138.8 167.1 191.3 219.5
15
300 000 4 -30.8 0.0 454.6 471.7 489.4 488.1 505.8 522.7 551.2
015 0 0.0 0.0 0.00 0.0 0.0 0.00 0.0 0.0 0.00
600 000 237 -26.3 -0.57 235.6 315.9 423.5 384.0 490.2 567.5 669.0
017 15 -6.57 -0.12 81.8 97.6 116.5 113.1 132.9 151.7 176.4
900 000 14825 -29.5 -0.50 199.2 287.8 415.7 368.0 500.2 601.9 708.1
027 184 -5.69 0.90 86.6 129.8 194.5 204.8 314.9 509.7 790.6
20
300 000 6 -15.6 0.0 51.1 51.8 52.6 52.5 53.3 54.0 55.2
017 21 -30.6 0.0 519.6 548.4 578.9 577.5 608.8 640.3 695.9
600 000 1866 -27.6 -0.76 174.2 274.3 431.7 360.2 517.9 621.3 713.1
020 424 -6.05 0.33 68.2 95.6 134.1 152.4 227.9 387.1 670.7
900 000 20806 -32.8 -0.67 178.8 263.3 387.6 344.1 477.4 587.9 702.5
030 1700 -6.42 0.63 77.0 98.0 124.7 134.8 178.4 255.3 530.8

34
Figure 4.10: Comparison of measured SMD to literature correlations for LFO Ambient
4.5.2 Concentration
The calculated concentrations for all the test locations are listed in Table 4.6 and the mass per
unit volume concentration values are presented in Figure 4.11. The droplet numbers are
insufficient for the Dantec software to provide a concentration / mass flux value. During
Phase one, no ignitions were observed for LFO ambient under any free spray test conditions.
Examination of the concentration shown in Table 4.6 and Figure 4.11 it can be seen that in
most cases the calculated concentration is below the widely accepted LEL of 50 g/m3.
However, in three test locations from the Phase one ignition experiments the concentration
was found to be between 10 and 50 g/m3 (which could potentially be flammable), but
possibly due to the large measured SMD values and low number of droplets present in the
region no ignitions was observed.

35
Figure 4.11: Calculated mass per unit volume concentrations for LFO Ambient measurement points

36
Table 4.6: LFO Ambient Concentration Calculation
Pressure
(barg)
Position (mm) Mean
Droplet
Axial
Velocity
(m/s)
Sample
Period
(s)
Number
of
Droplets
Total
Measured
Droplet
Volume
(m3)
Droplet Concentration
Axial Radial Vol/Vol Mass/Vol
(g/m3)
Dantec
Derived
Mass/Vol
(g/m3)
5
300 000 0.0 40 0 0.00E+00 0.00E+00 0.0 NA
010 0.0 40 0 0.00E+00 0.00E+00 0.0 NA
600 000 0.0 40 0 0.00E+00 0.00E+00 0.0 NA
012 0.0 40 0 0.00E+00 0.00E+00 0.0 NA
900 000 -18.8 40 400 7.32E-08 5.12E-04 476.3 NA
015 0.0 40 0 0.00E+00 0.00E+00 0.0 NA
10
300 000 -0.5 40 14 1.94E-13 5.12E-08 0.048 NA
010 -4.1 40 34 1.16E-10 3.73E-06 3.471 NA
600 000 -12.2 40 11 4.36E-12 4.70E-08 0.044 NA
012 -20.4 40 1 5.89E-13 3.80E-09 0.004 NA
900 000 -25.6 40 5864 2.76E-07 1.42E-03 1318.3 NA
022 -7.4 40 40 5.66E-11 1.01E-06 0.940 NA
15
300 000 -30.8 40 4 2.74E-10 1.17E-06 1.092 NA
015 0.0 40 0 0.00E+00 0.00E+00 0.0 NA
600 000 -26.26 40 237 7.02E-09 3.52E-05 32.77 NA
017 -6.57 40 15 1.15E-11 2.30E-07 0.214 NA
900 000 -29.5 40 14825 3.87E-07 1.73E-03 1609.1 NA
027 -5.69 40 184 8.28E-10 1.92E-05 17.84 NA
20
300 000 -15.6 40 6 4.56E-13 3.85E-09 0.004 NA
017 -30.6 40 21 2.07E-09 8.94E-06 8.314 NA
600 000 -27.6 40 1866 4.57E-08 2.18E-04 202.8 NA
020 -6.05 40 424 7.87E-10 1.71E-05 15.95 NA
900 000 -32.8 40 20806 4.44E-07 1.78E-03 1657.0 NA
030 -6.42 40 1700 2.18E-09 4.48E-05 41.65 NA

37
4.6 LFO Heated at 70 oC Experimental Results (Flashpoint = 81⁰C)
Light Fuel Oil Heated at 70 oC spray characterisation results together with a limited analysis
of the data are presented in this section.
Figure 4.12 shows the positions at which PDA measurements of the LFO Heated at 70 oC
releases were carried out together with the results of the flammability studies carried out in
Phase one. For each of the three axial locations at which PDA measurements could be taken,
results were obtained for the central axial position as well as radial positions either side of the
“ignition envelope” where ignition was observed during Phase one. Analysis of the droplet
measurements and concentration calculations for LFO Heated at 70 oC dataset are described
in the sections 4.6.1 and 4.7.1 respectively.
4.6.1 Droplet Diameters
The results of the PDA droplet characterisation for the LFO Heated at 70 oC dataset are
shown in Table 4.7. For each of the locations at which droplet measurements were taken,
distributions have been obtained for the axial and radial velocities as well as the droplet sizes
(the histograms for each measurement location are included in Appendix E).
Heating the LFO to 70 oC significantly reduces its viscosity from 170 mm
2/s
to 18 mm
2/s,
promoting atomisation when compared to the results at ambient conditions. The overall
release profile of the LFO Ambient for all the pressures at which measurements were taken (5
to 20barg) consisted of a central high velocity liquid core surrounded by a slower moving,
much less dense spray.
From Table 4.7 can be observed that at all pressure cases and axial distances, the droplet
number recorded is significantly larger than when tested at ambient conditions. Moreover, it
can be seen that the mean radial velocity of the droplets is significantly lower when compared
to the axial velocity component. In addition, as the pressure increases the mean axial velocity
increases.

38
Figure 4.12: LFO Heated at 70 oC flammability study results and PDA measurement positions

39
Comparing the measured spray droplet characteristics shown for the LFO heated to 70 oC in
Table 4.7 to that of the unheated light fuel oil shown in Table 4.5, it can be seen that the
heated LFO produced significantly more droplets than the ambient temperature light fuel oil;
even at positions close to the release orifice. At the lowest release pressure (5 barg) the
number of droplets measured provides some evidence of primary / mechanical breakup
occurring near to the orifice, with further break-up occurring once the jet is 900mm from the
orifice. As the release pressure increased the results indicate that the breakup distance is
reduced such that it is less than 600mm at 15 barg.
Moreover, from Table 4.7 it can be seen that at each axial location as the release pressure is
increased the SMD decreases. Also, it can be observed that as the axial distance is increased
the SMD decreases. At the test points where ignitions were observed the SMD ranged from
130μm- 350μm, however the D10 ranged from 50 μm -76 μm, indicating that the spray in the
region mainly consisted of many smaller droplets. Figure 4.13 compares the experimentally
measured SMDs to the SMDs predicted in the literature.
Figure 4.13 compares the experimentally measured SMDs for the LFO heated to 70 oC
releases to the SMDs predicted in the literature (using the measured nozzle pressure
differential and release flow rates). The range of SMD values measured for each of the
release pressures studied for the heated LFO is very similar to that of the unheated LFO
shown in Figure 4.10. The Miesse (1955) correlation is again predicting SMD values for the
spray releases to be larger than that measured in this study over the range of release
pressures. The SMD trend predicted by the TNO Yellow book (2005), and Faeth (1991)
correlations does not match that seen in the measured values, as they are predicting a larger
reduction in SMD with increasing pressure than that seen in the measured values. Similar to
the results of the LFO ambient releases, the Maragkos (2002) correlation under predicts the
SMD over the range of release pressures, while the Miesse (1955) correlation over predicts
by a similar margin; the measured SMD is in between the values predicted by these two
correlations. Again, as it is more cautious to use a correlation that under predicts the droplet
SMD produced during a release the Maragkos (2002) correlation is the most suitable to be
used for modelling work.

40
Table 4.7: LFO Heated at 70 oC droplet measurement summary
Pressure
(barg)
Position
(mm)
Number
of
Droplets
Mean Droplet
Velocity (m/s) Mean Droplet Diameter (μm)
Axial Radial Axial Radial D10 D20 D21 D30 D31 D32 D43
5
300 0 18711 -18.7 -0.50 469.0 550.1 643.4 600.2 683.4 726.0 773.2
10 400 -13.9 0.07 85.6 120.2 168.6 158.8 216.2 277.3 371.4
600 0 1496 -11.5 0.03 82.3 125.5 191.1 189.5 287.4 432.3 664.3
15 645 -4 0.17 61.6 81.6 107.9 108.2 143.3 190.4 281.6
900 0 16270 -25.1 -0.29 175.0 240.1 329.3 305.6 403.9 495.3 628.1
25 1508 -3.4 0.37 85.8 139.3 226.3 214.0 338.0 504.8 702.6
10
300 0 814 -24.5 -1.41 174.7 288.3 475.6 379.2 558.7 656.3 755.6
10 2632 -15.4 -0.06 66.2 98.1 145.4 154.7 236.4 384.4 661.9
600 0 17361 -23.1 -0.55 85.3 131.8 203.6 199.8 305.9 459.5 662.1
15 6085 -4.42 0.13 65.5 101.0 155.7 157.7 244.9 385.0 605.6
900
0 51037 -31 -0.34 145.6 210.7 304.9 285.5 399.7 524.1 684.9
35 1391 -2.96 0.40 76.5 112.2 164.6 166.2 244.8 364.1 572.8
45 615 -2.46 0.46 103.7 156.5 236.2 235.1 354.0 530.5 727.3
15
300 0 17083 -37.6 -0.88 152.0 252.6 420.0 345.7 521.4 647.5 750.5
10 6563 -14.2 -0.21 54.5 96.0 169.1 165.1 287.3 488.0 695.0
600
0 41130 -30 -0.61 88.1 128.6 187.5 192.2 283.9 429.8 663.9
15 7300 -9.77 0.42 56.5 74.5 98.2 111.9 157.4 252.4 582.9
20 5313 -5.20 0.42 49.4 66.9 90.6 97.5 137.1 207.6 420.3
900
0 46750 -34.9 -0.27 134.7 188.6 264.1 257.5 356.0 479.9 664.6
25 4532 -10.8 0.43 78.4 113.0 162.9 168.9 247.9 377.4 626.1
35 5846 -5.02 0.48 67.4 120.6 215.8 198.3 340.2 536.3 738.3
20
300
0 38887 -45.8 -1.81 107.1 171.7 275.4 251.2 384.7 537.5 704.7
15 5323 -8.50 0.20 50.8 69.7 95.8 110.3 162.6 275.8 550.9
20 4692 -4.22 0.39 46.5 67.7 98.7 114.1 178.7 323.6 631.3
600 0 74081 -36.6 -0.76 89.1 128.5 185.3 190.6 278.7 419.0 648.7
20 10020 -9.1 0.53 53.3 72.1 97.6 109.7 157.3 253.8 531.8
900
0 77798 -42.6 -0.18 148.9 207.3 288.6 278.2 380.3 501.1 674.3
25 2997 -13.6 0.63 75.0 87.5 102.1 101.6 118.2 136.9 181.7
35 1202 -7.18 0.54 66.5 77.4 89.9 89.5 103.8 119.9 154.1

41
Figure 4.13: Comparison of measured SMD to literature correlations for LFO heated to 70 oC
4.6.2 Concentration
The calculated concentrations for all the test locations are listed in Table 4.8 and the mass per
unit volume concentration values are presenteded in Figure 4.14. The concentration / mass
flux values calculated from the Dantec software when a statistically large enough sample was
recorded, are also presented in Table 4.8 for comparison.
The calculated concentration values shown in Table 4.8 and Figure 4.14 show that the
minimum calculated concentration from the PDA measurements at an “ignition” point can be
as low as 14.06 g/m3. However the average concentration of the “ignition” positions (which
represent the outer ignitable limit found during Phase 1) was 76.49 g/m3.
There are test points where higher concentrations were recorded than the considered LEL of
50 g/m3
but no ignitions were observed. Although, the concentration calculated provides a
good indication of the mean concentration over the release period, the instantaneous
concentration during the release is likely to have a higher degree of variation due to the
transient nature of the spray formed. Additionally, the number of droplets present in the

42
region, spray quality as expressed by the SMD, the presence of smaller droplets (30-100μm)
would all play a significant role in droplet ignition and flame propagation.
Table 4.8: LFO Heated at 70 oC Concentration Calculation
Pressure (barg)
Position (mm) Mean Droplet
Axial Velocity
(m/s)
Sample Period
(s)
Number of
Droplets
Total Measured
Droplet Volume
(m3)
Droplet Concentration
Axial Radial Vol/Vol Mass/Vol
(g/m3)
Dantec Derived
Mass/Vol (g/m
3)
5
300 0 -18.7 40 18711 2.12E-06 1.50E-02 13163.5 12433.01
10 -13.9 40 400 8.39E-10 7.95E-06 7.000 NA
600 0 -11.5 40 1496 5.33E-09 6.09E-05 53.56 NA
15 -4 40 645 4.28E-10 1.40E-05 12.321 NA
900 0 -25.1 40 16270 2.43E-07 1.28E-03 1124.6 178.6
25 -3.4 40 1508 7.74E-09 2.97E-04 261.6 NA
10
300 0 -24.5 40 814 2.33E-08 1.25E-04 110.0 NA
10 -15.4 40 2632 5.10E-09 4.38E-05 38.51 72.87
600 0 -23.1 40 17361 7.25E-08 4.14E-04 364.0 148.9
15 -4.42 40 6085 1.25E-08 3.73E-04 327.9 NA
900
0 -31 40 51037 6.22E-07 2.64E-03 2325.0 NA
35 -2.96 40 1391 3.34E-09 1.49E-04 130.8 NA
45 -2.46 40 615 4.19E-09 2.24E-04 197.1 NA
15
300 0 -37.6 40 17083 3.70E-07 1.29E-03 1139.2 637.6
10 -14.2 40 6563 1.55E-08 1.44E-04 126.7 67.84
600
0 -30 40 41130 1.53E-07 6.71E-04 590.8 191.8
15 -9.77 40 7300 5.35E-09 7.23E-05 63.59 27.85
20 -5.20 40 5313 2.58E-09 6.54E-05 57.57 18.45
900
0 -34.9 40 46750 4.18E-07 1.58E-03 1389.0 NA
25 -10.8 40 4532 1.14E-08 1.40E-04 123.0 26.68
35 -5.02 40 5846 2.39E-08 6.27E-04 551.7 NA
20
300
0 -45.8 40 38887 3.23E-07 9.29E-04 817.5 855.7
15 -8.50 40 5323 3.74E-09 5.80E-05 51.06 68.71
20 -4.22 40 4692 3.65E-09 1.14E-04 100.3 185.8
600 0 -36.6 26.93 74081 2.68E-07 1.43E-03 1262.8 205.3
20 -9.1 40 10020 6.92E-09 1.00E-04 88.38 34.35
900
0 -42.6 40 77798 8.77E-07 2.71E-03 2388.9 469.7
25 -13.6 40 2997 1.65E-09 1.60E-05 14.06 17.09
35 -7.18 40 1202 4.52E-10 8.29E-06 7.295 8.244

43
Figure 4.14: Calculated mass per unit volume concentrations for LFO heated at 70 oC measurement
points

44
4.7 Impingement Results
During the ignition studies reported in Phase one of this project, a small number of
impingement studies were carried out to demonstrate whether the impingement of a spray on
a surface affects its ignitibility due to secondary breakup of the jet caused by its interaction /
impact with a surface.
In this phase, a single case of impingement was selected for spray characterisation. The
selected case was 20 barg Light Fuel Oil at Ambient conditions. During the Phase one
flammability studies, the free-spray LFO Ambient releases did not ignite at all pressures and
locations tested. However, in the impingement studies at 20barg a single ignition condition
was observed. Figure 4.15 shows the position at which PDA measurements of the LFO
ambient release were undertaken together with their relation to the results of the flammability
studies carried out in Phase one. For this location droplet sizes and two velocity components
(axial and radial) were recorded.
Figure 4.15: LFO Ambient-impingement flammability study results and PDA measurement positions

45
The impingement set up was the same as that used in Phase one. A flat mild steel plate was
used as an impingement surface and was positioned 400mm downstream of the orifice. The
PDA was positioned 25mm above the impingement surface and 40mm away from the
centreline of the spray, which matches the ignitor location for the release at which an ignition
was observed.
The PDA set-up was nominally the same as when sampling data for the LFO Ambient free
spray case. The only variation was that the release duration was reduced to 10 seconds as it
was anticipated that the LFO would adhere to the transmitting and receiving optics rendering
the system unable to record any data. The PDA system was set to acquire 50000 droplets or
sample for the entire 10 sec release. During the test it was found that the PDA system was
only able to acquire data for less than 2.2 seconds prior to LFO adhering to the optics and
preventing the system recording any further.
Figure 4.15 displays the PDA measurements obtained at the selected position; with
histograms showing the measured axial and radial velocity and droplet size distributions.
Figure 4.15: PDA results-LFO Amb Impingement case (20barg release, 375mm axial, 40mm radial)
46
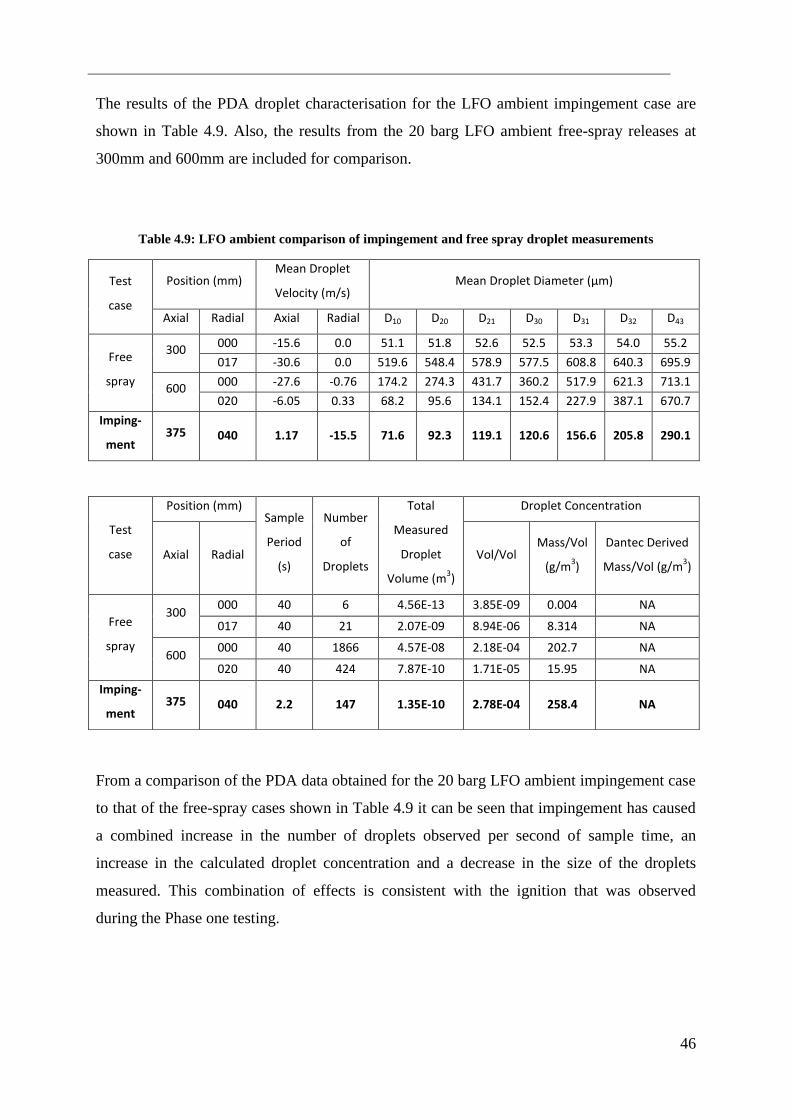
The results of the PDA droplet characterisation for the LFO ambient impingement case are
shown in Table 4.9. Also, the results from the 20 barg LFO ambient free-spray releases at
300mm and 600mm are included for comparison.
Table 4.9: LFO ambient comparison of impingement and free spray droplet measurements
Test
case
Position (mm) Mean Droplet
Velocity (m/s) Mean Droplet Diameter (μm)
Axial Radial Axial Radial D10 D20 D21 D30 D31 D32 D43
Free
spray
300 000 -15.6 0.0 51.1 51.8 52.6 52.5 53.3 54.0 55.2
017 -30.6 0.0 519.6 548.4 578.9 577.5 608.8 640.3 695.9
600 000 -27.6 -0.76 174.2 274.3 431.7 360.2 517.9 621.3 713.1
020 -6.05 0.33 68.2 95.6 134.1 152.4 227.9 387.1 670.7
Imping-
ment 375 040 1.17 -15.5 71.6 92.3 119.1 120.6 156.6 205.8 290.1
From a comparison of the PDA data obtained for the 20 barg LFO ambient impingement case
to that of the free-spray cases shown in Table 4.9 it can be seen that impingement has caused
a combined increase in the number of droplets observed per second of sample time, an
increase in the calculated droplet concentration and a decrease in the size of the droplets
measured. This combination of effects is consistent with the ignition that was observed
during the Phase one testing.
Test
case
Position (mm) Sample
Period
(s)
Number
of
Droplets
Total
Measured
Droplet
Volume (m3)
Droplet Concentration
Axial Radial Vol/Vol Mass/Vol
(g/m3)
Dantec Derived
Mass/Vol (g/m3)
Free
spray
300 000 40 6 4.56E-13 3.85E-09 0.004 NA
017 40 21 2.07E-09 8.94E-06 8.314 NA
600 000 40 1866 4.57E-08 2.18E-04 202.7 NA
020 40 424 7.87E-10 1.71E-05 15.95 NA
Imping-
ment 375 040 2.2 147 1.35E-10 2.78E-04 258.4 NA

47
4.8 High Pressure Hydraulic Oil Tests
In this test program limited studies were conducted in order to investigate the flammability of
Hydraulic oil at higher supply pressures ranging from 30-150 barg. Subsequently, droplet
characterisation data were collected. The aim of this study was to underpin the conditions
required for a high flashpoint, high viscosity liquid to ignite. Figure 4.16 presents the
positions at which PDA measurements were carried out in relation to the results of the
flammability studies. As it can be seen no ignition were observed at any pressures.
Figure 4.16: High Pressure Hydraulic oil flammability study results and PDA measurement positions

48
4.8.1 Droplet Diameters
The results of the PDA droplet characterisation for the hydraulic oil dataset are shown in
Table 4.10. For each of the locations at which droplet measurements were taken, distributions
have been obtained for the axial and radial velocities as well as the droplet sizes (the
histograms for each measurement location are included in Appendix F).
The overall release profile of the hydraulic oil for all the supply pressures at which
measurements were taken (30 to 150barg) consisted of a central high velocity liquid core,
which was surrounded by slower moving droplets in the form of a much less dense spray.
From Table 4.10 can be observed that at all pressure cases and axial distances, the mean
radial velocity of the droplets is significantly lower when compared to the axial velocity
component. Also, as the pressure increases the mean axial velocity increases. No other
velocity trends can be identified due to low droplet count in most test points. The low droplet
count highlights the fact that the hydraulic oil releases consist of a central dense high velocity
core. Also included in Table 4.10 are the droplet sizes predicted by the correlation of
Maragkos (2002), which has been found to be the most appropriate correlation for Hydraulic
oil.
Table 4.10: High Pressure Hydraulic oil droplet measurement summary

49
4.8.2 Concentration
The calculated concentrations for all the test locations are listed in Table 4.11 The droplet
numbers are insufficient for the Dantec software to provide a concentration / mass flux value.
No ignition was observed for hydraulic oil at any test conditions.
The concentration values shown in Table 4.11 show that at the release pressures used in this
study, in several cases the calculated concentration is above the widely accepted LEL of 50
g/m3. However, the low volatility of the hydraulic oil and its high flashpoint have resulted in
no observed ignitions occurring, even though the droplet sizes measured are similar to that
seen for ignition cases with JET-A1 and heated LFO.
Table 4.11: High Pressure Hydraulic oil Concentration calculation
Pressure
(barg)
Position (mm) Mean
Droplet
Axial
Velocity
(m/s)
Sample
Period
(s)
Number
of
Droplets
Total
Measured
Droplet
Volume
(m3)
Droplet Concentration
Axial Radial Vol/Vol
Mass/V
ol
(g/m3)
Dantec
Derived
Mass/Vo
l (g/m3)
30 600 0 -31.94 20 31 7.40E-10 6.10E-06 5.3 NA
10 -4.96 20 2500 3.46E-09 1.84E-04 159.8 NA
70 600 0 -10.72 20 687 3.81E-10 9.37E-06 8.148 NA
15 -10.6 20 303 2.62E-10 6.50E-06 5.7 NA
110 600 0 -17.52 20 2251 2.02E-10 3.48E-05 30.3 NA
17 -11.14 20 4151 1.15E-09 1.74E-05 15.1 NA
150
600 0 -20.64 20 5772 1.66E-09 3.93E-05 34.2 NA
20 -6.90 20 5040 5.12E-09 6.53E-05 56.8 NA
900 0 -28.04 20 8755 2.03E-09 7.77E-05 67.6 NA
15 -17.5 20 30913 9.15E-09 8.60E-05 74.8 NA
50
5.0 OBSERVATIONS
Phase two of the experimental program attempts to provide insights and a better qualititative
understanding the spray combustion physics underlying the observations from Phase one. For
the spray characterisation PDA was selected as a non-intrusive optical diagnostic method for
the determination of the droplet size and velocities of the spray particles.
This extended report also contains observations / results from the study of high pressure
hydraulic oil releases.
The key observations form the tests conducted can be summarised as follows:
For all fuels the spray release consists of a dense liquid core surrounded by finer
droplets.
For all fuels it can be seen that the droplets within the liquid core are moving at higher
velocities and have a larger SMD than the surrounding droplets. The finer surrounding
droplets have very low axial and radial velocity components, such that they form a low
velocity mist around the central core.
The measured SMD was compared with the calculated global SMD from correlations
found in the literature, and it was determined that the correlation of Maragkos (2002)
provided the best fit for the well-atomised JET-A1 releases. The Maragkos (2002)
correlation was also shown to be suitable for predicting the SMD for the hydraulic oil
releases studied although large non-spherical fluid elements will not have been
accounted for in these poorly atomised releases. For the light fuel oil (both ambient
and heated to 70⁰C), no single correlation could not be found that adequately
corresponds to the measurement data, with the measured SMD being between that
predicted by Maragkos (2002) and Miesse (1955). The Maragkos (2002) correlation
consistently under predicts the SMD for the light fuel oil releases, whereas the Miesse
(1955) over predicts.
For most of the measurement positions the Dantec BSA flow post-processing software
was unable to provide concentrations for the spray surrounding the liquid core as the
droplet numbers recorded were insufficient, so fuel concentrations have to be
calculated from raw droplet data.
51
Concentration values were calculated from first principles for all sample locations and
were found to be in reasonable agreement with the values that the Dantec algorithm
could calculate.
For the Jet-A1 liquid:
o Observations of the spray showed that even at positions very close to the
release orifice there were comparatively large numbers of droplets recorded,
suggesting that the Jet-A1 liquid was breaking up very close to the orifice and
that produces flammable mists/sprays even at low pressures.
o Towards the limits of the ignition envelope at the edge of the spray, typical
mean droplet sizes (SMD) reduce to be between 30-100 μm. This has two
implications concerning spray flammability:
- These droplet sizes on the boundary of the spray are more readily ignitable
than that closer to the centreline, and potentially burn with higher flame speed
(Ballal and Lefebvre 1979; 1981).
- In this size range, flames can propagate at concentrations below the vapour
LFL due the well established droplet-droplet relay mechanism for spray
propagation (Hayashi et al. 1981). This is consistent with measured spray
concentrations.
o In the region between ignition-propagation and no propagation, concentrations
typically reduced such they were near to or lower than the vapour LFL.
o The liquid properties of the Jet-A1 are such that even at very low release
pressures the SMD of the droplets measured are comparatively small, with a
large proportion of the droplets likely to be under that required for them to be
ignitable. Because of this, overall droplet concentration at an ignition location
is the main parameter in determining whether a Jet-A1 release is ignitable.
For the hydraulic oil, including high pressure releases:
o Observations of the jet showed that there was comparatively few droplets
formed at all the conditions tested, with a significant amount of fine droplets
only being observed once pressures approached 150barg. There was little
evidence of any Primary / mechanical breakup occurring at release pressures
less than 50 barg. Even at 150 barg the breakup observed consisted of fine
droplets forming around the central dense core at a distance of approximately

52
200mm from the orifice, with the central core only showing signs of
disintegrating at an axial distance of 600mm.
o The limited droplet measurements that could be obtained due to the very poor
nature of the spray agreed with observations made during ignition testing.
Pressures of 150barg are insufficient to fully atomise the hydraulic oil,
resulting in an inadequate number of ignitable droplets being produced.
For the light fuel oil at ambient temperature:
o Observations of the jet showed that this liquid behaved similar to hydraulic
oil, with comparatively few droplets being formed at all the conditions tested.
Again, there was little evidence of any Primary / mechanical breakup
occurring even at the highest pressures. However, at both 15 and 20 barg there
was evidence that breakup was beginning to occur at a distance of 900mm
from the orifice.
o Again, similar to the hydraulic oil the very poor nature of the spray and the
few droplets measurements taken agreed with observations made during Phase
one of the test program. The release pressures used (≤20barg) are insufficient
to atomise the light fuel oil, resulting in too few ignitable droplets being
produced.
For the light fuel oil heated to 70⁰C:
o Observations of the spray showed that the heated light fuel oil produced
significantly more droplets than the ambient temperature light fuel oil, even at
positions close to the release orifice. At the lowest release pressure (5 barg)
there was some evidence of Primary / mechanical breakup occurring near to
the orifice, with further break-up occurring near to the position 900mm from
the orifice. At higher release pressures there are indications of the liquid core
breakup distance reducing to less than 600mm at 15 barg.
o At the test positions at where ignitions were observed during Phase one of the
test program, a range of SMD values of 130μm- 350μm were measured.
However, the measured D10 values at these positions were 50 μm -76 μm,
indicating that the spray mainly consisted of many smaller droplets and that a
few comparatively large droplets are skewing the SMD value. Because of this,
the Sauter Mean Diameter may not be the most suitable parameter for
assessing the ignitability of sprays / mists such as that seen in this work.

53
o Compared to that seen with the Jet-A1 releases, the SMD of the droplets
measured for the heated LFO releases are comparatively large, suggesting a
much smaller proportion of the droplets are under the size that is required for
them to be ignitable. Therefore, for liquids such as LFO, the droplet sizes
produced as well as the overall droplet concentrations need to be assessed for
a release condition to evaluate the ignition risk of any spray / mist formed.
During the Phase one investigation, it was found that through the introduction of
impingement, releases that could not be ignited as a free spray could potentially
become flammable. Droplet measurements for the 20 barg “non-ignitable” LFO
ambient free-spray releases were compared to that obtained for the 20 barg “ignitable”
LFO impingement case; it was found that impingement resulted in a reduction in the
measured droplet diameter. This combined with the increased droplet concentration at
the ignitor location provides an explanation for the observed ignition.

54
REFERENCES
Aı́SA, L., GARCIA, J. A., CERECEDO, L. M., GARCı́A PALACı́N, I. & CALVO, E. 2002.
Particle concentration and local mass flux measurements in two-phase flows with
PDA. Application to a study on the dispersion of spherical particles in a turbulent air
jet. International Journal of Multiphase Flow, 28, 301-324.
ARTIUM-TECHNOLOGIES. Spray Diagnostics [Online]. Available:
http://www.artium.com/ [Accessed 15/01 2013].
BALLAL, D. R. & LEFEBVRE, A. H. 1979. Ignition and flame quenching of flowing
heterogeneous fuel-air mixtures. Combustion and Flame, 35, 155-168.
BALLAL, D. R. & LEFEBVRE, A. H. 1981. Flame propagation in heterogeneous mixtures
of fuel droplets, fuel vapor and air. Symposium (International) on Combustion, 18,
321-328.
BOWEN P.J. SHIRVILL L.C. 1994. Combustion Hazards Posed by the Pressurized
Atomization of High-Flash Point Liquid, Journal of loss Prevention in the Process
Industries, 7(3), 233-241
DANTEC-DYNAMICS. Spray and Particle Characterization [Online]. Available:
http://www.dantecdynamics.com/spray-and-particle-characterization [Accessed 15/01
2013].
DITCH, B. & YU, H.-Z. 2004. Characterization of Water Mist Sprays Using a Phase-
Doppler-Particle-Analyzer and an Iso-Kinetic Sampling Probe. ASME 2004 Heat
Transfer/Fluids Engineering Summer Conference. Charlotte, North Carolina, USA,.
DSEAR 2002. The Dangerous Substances and Explosive Atmpsheres Regulations 2002.
London Uk: Crown.
EU 1994. Directive 94/9/EC Of the European Parliament and the Council. Official Journal of
the European Communities.
EU 1999. Directive 1999/92/EC of The European Parliament and of the Council. Official
Journal of the European Communities.
FAETH, G. M. 1991. Structure and atomization properties of dense turbulent sprays.
Symposium (International) on Combustion, 23, 1345-1352.
HAYASHI, S., OHTANI, T., IINUMA, K. & KUMAGAI, S. 1981. Limiting factor of flame
propagation in low-volatility fuel clouds. Symposium (International) on Combustion,
18, 361-367.
LA-VISION. Spray Applications [Online]. Available:
http://www.lavision.de/en/applications/sprays.php [Accessed 15/01 2013].
MARAGKOS, A. 2002. Combustion hazard quantification of accidental releases of high-
flashpoint liquid fuels. PhD Cardiff University
MARAGKOS A., BOWEN P.J. 2002‚ Combustion hazards due to impingement of
pressurised releases of high flashpoint liquid fuels, Proceedings of the Combustion
Institute, 29 (1) 305-311
MIESSE, C. C. 1955. Correlation of Experimental Data on the Disintegration of Liquid Jets.
Industrial & Engineering Chemistry, 47, 1690-1701.
TNO 2005. Methods for the calculation of physical effects – due to releases of hazardous
materials (liquids and gases) – ‘Yellow Book'. The Hague.
TYREE, C. & ALLEN, J. 2004. Diffusional Particle Loss Upstream of Isokinetic Sampling
Inlets. Aerosol Science and Technology, 38, 1019-1026.
YOSHIDA, H., YAMASHITA, K., MASUDA, H. & IINOYA, K. 1978. EFFECT OF
PROBE DIAMETER ON ISOKINETIC SAMPLING ERRORS. Journal of Chemical
Engineering of Japan, 11, 48-52.

55
APPENDIX A: MEASURING PRINCIPLES OF A PDA
SYSTEM
The PDA technique is an extension of laser Doppler anemometry and is based upon the phase
Doppler principles. Two or more detectors collect the light scattered by single particles
passing through the measurement volume.
The measurement point (control volume) is defined by the intersection of monochromatic,
coherent, linearly polarised, collimated laser beams. The intersecting laser beams interfere
with each other creating interference fringes. The control volume and interference fringes are
shown schematically in Figure A1.
Figure A1: Schematic of control volume formed by the transmitting optics
When a droplet passes through the control volume, the droplet scatters the light with a
Doppler frequency related to the velocity of the particle. The light can be scattered in a
number of modes. Figure A2 demonstrates the typical locations of the first three light
scattering modes for a water droplet in air.

56
Figure A2: The first three light scattering modes for a water droplet in air
In terms of the Fringe model, the frequency of light intensity pattern received at the photo
detectors is directly proportional to the speed with which the droplet traverses the
interference fringes of the control volume. The droplet velocity can therefore be calculated
from the Doppler frequency. The relationship between droplet velocity and Doppler
frequency is given in Equation A.1 where λ is the wavelength of light.
𝑈 = 𝜆𝑓𝑑
2sin (𝜃
2)
(A.1)
A system such as the one described can measure velocity in only one dimension. The addition
of an extra pair of beams intersecting at the control volume allows a second component of
velocity to be measured.
In order to measure particle diameters the use of two photo detectors is needed. As illustrated
in Figure A.3 a particle traversing the control volume scatters light which is collected by a
pair of photo detectors located in the PDA receiving optics. Both photo detectors receive the
same signal – a burst with the same Doppler frequency but with a slight phase difference due
to the different optical lengths travelled by the light. The phase difference (Φ) between the
signals received by the two photo detectors is directly proportional to the particle diameter
(dp). This is demonstrated in Figure A4.

57
Figure A3: Light scattered via reflection mode by droplet traversing through PDA control volume
(a) (b) (c)
Figure A4: (a) Light intensity signal received at photo detectors; (b) The two photo detectors receive the
same signal but with a slight phase difference; (c) Phase difference can be used to calculate droplet
diameter.
For reflection as the dominant light scattering mode, the phase difference between adjacent
photo detectors is given by Equation A.2. For dominant first order refraction the phase
difference is given by Equation A.3. The relative refractive index (nrel) can be calculated via
Equation A.4.
𝛷 = 2𝜋𝑑𝑝𝑠𝑖𝑛𝜃𝑠𝑖𝑛𝜓
𝜆√2(1−𝑐𝑜𝑠𝜃𝑐𝑜𝑠𝜓𝑐𝑜𝑠𝜑)(A.2)
𝛷 = −2𝜋𝑑𝑝𝑛𝑟𝑒𝑙𝑠𝑖𝑛𝜃𝑠𝑖𝑛𝜓
𝜆√2(1+𝑐𝑜𝑠𝜃𝑐𝑜𝑠𝜓𝑐𝑜𝑠𝜑)(1+𝑛𝑟𝑒𝑙2 −𝑛𝑟𝑒𝑙√2(1+𝑐𝑜𝑠𝜃𝑐𝑜𝑠𝜓𝑐𝑜𝑠𝜑)
(A.3)

58
𝑛𝑟𝑒𝑙 = 𝑛𝑝𝑎𝑟𝑡𝑖𝑐𝑙𝑒
𝑛𝑚𝑒𝑑𝑖𝑢𝑚(A.4)
A PDA system with only two photo detectors can be used to measure particles with a
diameter corresponding to a phase shift of up to 360 degrees or 2π. A two detector system
suffers from what is termed the “2π ambiguity” – a consequence of the fact that because
phase is a multiple of 2π, a two detector system cannot distinguish between the phase
differences produced by very large and very small droplets.
The solution employed in PDA systems is to use three photo detectors grouped into two pairs
allowing the phase differences between both pairs to be cross-checked. The close pair
measure large particle size ranges at a low resolution while the distant pair measure smaller
size ranges at a greater resolution. The phase differences of both pairs will then align along
the correct droplet diameter as shown. In this three photo detector set-up cross-checking of
the two pairs of phase differences will both extend the measurable particle size ranges and
eliminate the 2π ambiguity.
Another useful outcome of this approach is the ability to perform validation checks on the
phase differences measured. For a perfectly spherical droplet both pairs of phase differences
will indicate exactly the same droplet diameter. The particle sphericity validation check, as it
is called, is one means of assessing the quality of a PDA set-up. Throughout this study a
sphericity error of up to 20% was deemed acceptable. Droplets with a sphericity error larger
than this were rejected by the processor and did not influence results.

59
APPENDIX B: RAW PDA DATA FOR JET-A1
JET-A1 5 Bar(g) Test case
Figure B1: JET-A1-5bar- y=300- x=000mm Figure B2: JET-A1-5bar- y=300- x=045mm

60
Figure B3: JET-A1-5bar- y=300- x=055mm Figure B4: JET-A1-5bar- y=600- x=000mm

61
Figure B5: JET-A1-5bar- y=600- x=045mm Figure B6: JET-A1-5bar- y=600- x=055mm

62
Figure B7: JET-A1-5bar- y=900- x=000mm Figure B8: JET-A1-5bar- y=900- x=050mm

63
Figure B9: JET-A1-5bar- y=900- x=080mm

64
JET-A1 10 Bar(g) Test case
Figure B10: JET-A1-10bar- y=300- x=000mm Figure B11: JET-A1-10bar- y=300- x=045mm

65
Figure B12: JET-A1-10bar- y=300- x=055mm Figure B13: JET-A1-10bar- y=600- x=000mm

66
Figure B14: JET-A1-10bar- y=600- x=075mm Figure B15: JET-A1-10bar- y=600- x=085mm

67
Figure B16: JET-A1-10bar- y=900- x=000mm Figure B17: JET-A1-10bar- y=900- x=095mm

68
Figure B18: JET-A1-10bar- y=900- x=105mm

69
JET-A1 15 Bar(g) Test case
Figure B19: JET-A1-15bar- y=300- x=000mm Figure B20: JET-A1-15bar- y=300- x=060mm

70
Figure B21: JET-A1-15bar- y=300- x=075mm Figure B22: JET-A1-15bar- y=600- x=000mm

71
Figure B23: JET-A1-15bar- y=600- x=110mm Figure B24: JET-A1-15bar- y=600- x=130mm

72
Figure B25: JET-A1-15bar- y=900- x=000mm Figure B26: JET-A1-15bar- y=900- x=125mm

73
Figure B27: JET-A1-15bar- y=900- x=150mm

74
JET-A1 20 Bar(g) Test case
Figure B28: JET-A1-20bar- y=300- x=000mm Figure B29: JET-A1-20bar- y=300- x=060mm

75
Figure B30: JET-A1-20bar- y=300- x=075mm Figure B31: JET-A1-20bar- y=600- x=000mm

76
Figure B32: JET-A1-20bar- y=600- x=110mm Figure B33: JET-A1-20bar- y=600- x=155mm

77
Figure B34: JET-A1-20bar- y=900- x=000mm Figure B35: JET-A1-20bar- y=900- x=140mm

78
Figure B36: JET-A1-20bar- y=900- x=170mm

79
APPENDIX C: RAW PDA DATA FOR HYDRAULIC OIL
HYDRAULIC OIL 5 Bar(g) Test case
Figure C1: Hydraulic Oil-5bar- y=300- x=000mm Figure C2: Hydraulic Oil - y=300- x=012mm

80
Figure C3: Hydraulic Oil -5bar- y=600- x=000mm Figure C4: Hydraulic Oil -5bar- y=600- x=018mm

81
Figure C5: Hydraulic Oil -5bar- y=900- x=000mm Figure C6: Hydraulic Oil 5bar- y=900- x=020mm
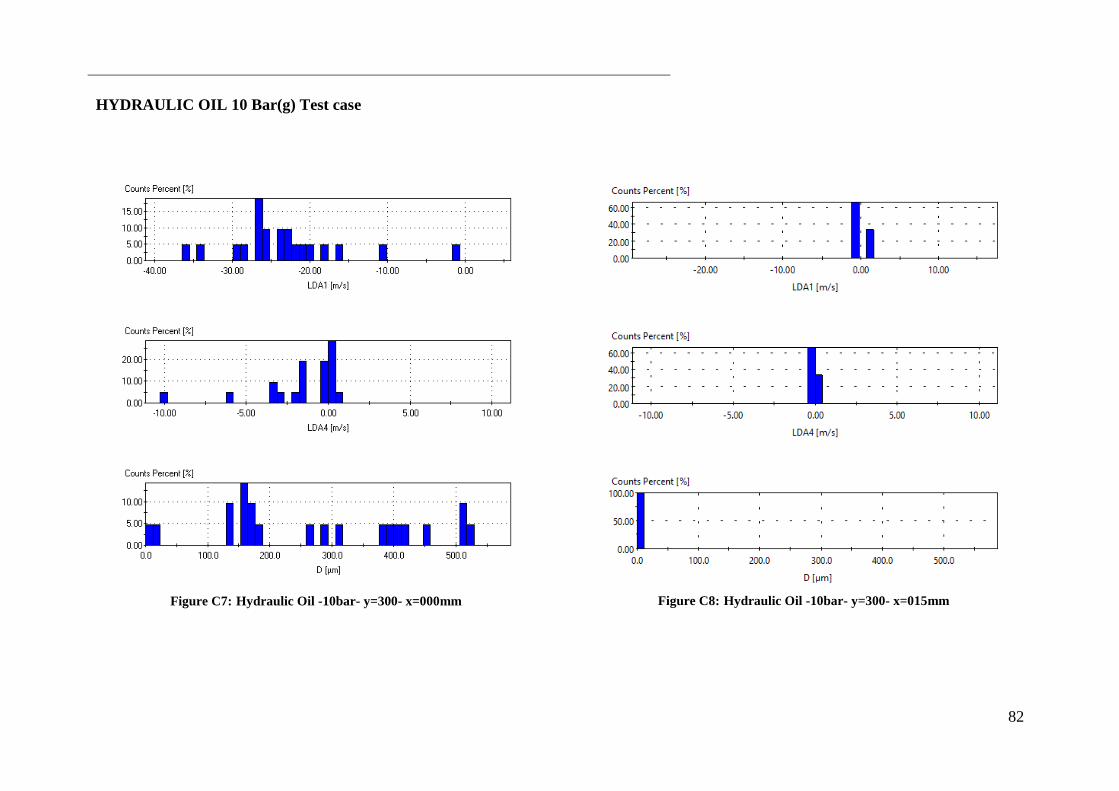
82
HYDRAULIC OIL 10 Bar(g) Test case
Figure C7: Hydraulic Oil -10bar- y=300- x=000mm Figure C8: Hydraulic Oil -10bar- y=300- x=015mm

83
Figure C9: Hydraulic Oil -10bar- y=600- x=000mm Figure C10: Hydraulic Oil -10bar- y=600- x=020mm

84
Figure C11: Hydraulic Oil 10bar- y=900- x=000mm Figure C12: Hydraulic Oil -10bar- y=900- x=025mm

85
HYDRAULIC OIL 15 Bar(g) Test case
Figure C13: Hydraulic Oil -15bar- y=300- x=000mm Figure C14: Hydraulic Oil -15bar- y=300- x=017mm

86
Figure C15: Hydraulic Oil -15bar- y=600- x=000mm
Figure C16: Hydraulic Oil -15bar- y=600- x=020mm

87
Figure C17: Hydraulic Oil -15bar- y=900- x=000mm Figure C18: Hydraulic Oil -15bar- y=900- x=030mm

88
HYDRAULIC OIL 20 Bar(g) Test case
Figure C19: Hydraulic Oil -20bar- y=300- x=000mm Figure C20: Hydraulic Oil -20bar- y=300- x=020mm

89
Figure C21: Hydraulic Oil -20bar- y=600- x=000mm Figure C22: Hydraulic Oil -20bar- y=600- x=025mm

90
Figure C23: Hydraulic Oil -20bar- y=900- x=000mm Figure C24: Hydraulic Oil -20bar- y=900- x=035mm

91
APPENDIX D: RAW PDA DATA FOR LFO AT AMBIENT CONDITIONS
LFO AMBIENT 5 Bar(g) Test case
Figure D1: LFO Ambient-5bar- y=300- x=000mm Figure D2: LFO Ambient - y=300- x=010mm

92
Figure D3: LFO Ambient -5bar- y=600- x=000mm Figure D4: LFO Ambient -5bar- y=600- x=012mm

93
Figure D5: LFO Ambient -5bar- y=900- x=000mm Figure D6: LFO Ambient- 5bar- y=900- x=015mm

94
LFO AMBIENT 10 Bar(g) Test case
Figure D7 LFO Ambient -10bar- y=300- x=000mm Figure D8: LFO Ambient -10bar- y=300- x=010mm

95
Figure D9: LFO Ambient -10bar- y=600- x=000mm Figure D10: LFO Ambient -10bar- y=600- x=012mm

96
Figure D11: LFO Ambient- 10bar- y=900- x=000mm Figure D12: LFO Ambient -10bar- y=900- x=022mm

97
LFO AMBIENT 15 Bar(g) Test case
Figure D13: LFO Ambient -15bar- y=300- x=000mm Figure D14: LFO Ambient -15bar- y=300- x=015mm

98
Figure D15: LFO Ambient -15bar- y=600- x=000mm Figure D16: LFO Ambient -15bar- y=600- x=017mm

99
Figure D17: LFO Ambient -15bar- y=900- x=000mm Figure D18: LFO Ambient -15bar- y=900- x=027mm

100
LFO AMBIENT 20 Bar(g) Test case
Figure D19: LFO Ambient -20bar- y=300- x=000mm Figure D20: LFO Ambient -20bar- y=300- x=017mm

101
Figure D21: LFO Ambient -20bar- y=600- x=000mm Figure D22: LFO Ambient -20bar- y=600- x=020mm

102
Figure D23: LFO Ambient -20bar- y=900- x=000mm Figure D24: LFO Ambient -20bar- y=900- x=030mm

103
APPENDIX E: RAW PDA DATA FOR LFO HEATED 70 O
C
LFO HEATED 70 O
C 5 Bar(g) Test case
Figure E1: LFO Heated 70 oC-5bar- y=300- x=000mm Figure E2: LFO Heated 70
oC - y=300- x=010mm

104
Figure E3: LFO Heated 70 oC -5bar- y=600- x=000mm Figure E4: LFO Heated 70
oC -5bar- y=600- x=015mm

105
Figure E5: LFO Heated 70 oC -5bar- y=900- x=000mm Figure E6: LFO Heated 70
oC - 5bar- y=900- x=025mm

106
LFO HEATED 70 O
C 10 Bar(g) Test case
Figure E7: LFO Heated 70 oC -10bar- y=300- x=000mm Figure E8: LFO Heated 70
oC -10bar- y=300- x=010mm

107
Figure E9: LFO Heated 70 oC -10bar- y=600- x=000mm Figure E10: LFO Heated 70
oC -10bar- y=600- x=015mm

108
Figure E11: LFO Heated 70 oC - 10bar- y=900- x=000mm Figure E12: LFO Heated 70
oC -10bar- y=900- x=035mm

109
Figure E13: LFO Heated 70 oC -10bar- y=900- x=045mm

110
LFO HEATED 70 O
C 15 Bar(g) Test case
Figure E14: LFO Ambient -15bar- y=300- x=000mm Figure E15: LFO Heated 70 oC -15bar- y=300- x=010mm

111
Figure E16: LFO Heated 70 oC -15bar- y=600- x=000mm Figure E17: LFO Heated 70
oC -15bar- y=600- x=015mm

112
Figure E18: LFO Heated 70 oC -15bar- y=600- x=020mm Figure E19: LFO Heated 70
oC -15bar- y=900- x=000mm

113
Figure E20: LFO Heated 70 oC -15bar- y=900- x=025mm Figure E21: LFO Heated 70
oC -15bar- y=900- x=035mm

114
LFO HEATED 70 O
C 20 Bar(g) Test case
Figure E22: LFO Heated 70 oC -20bar- y=300- x=000mm Figure E23: LFO Heated 70
oC -20bar- y=300- x=015mm

115
Figure E24: LFO Heated 70 oC -20bar- y=300- x=020mm Figure E25: LFO Heated 70
oC -20bar- y=600- x=000mm

116
Figure E26: LFO Heated 70 oC -20bar- y=600- x=020mm Figure E27: LFO Heated 70
oC -20bar- y=900- x=000mm
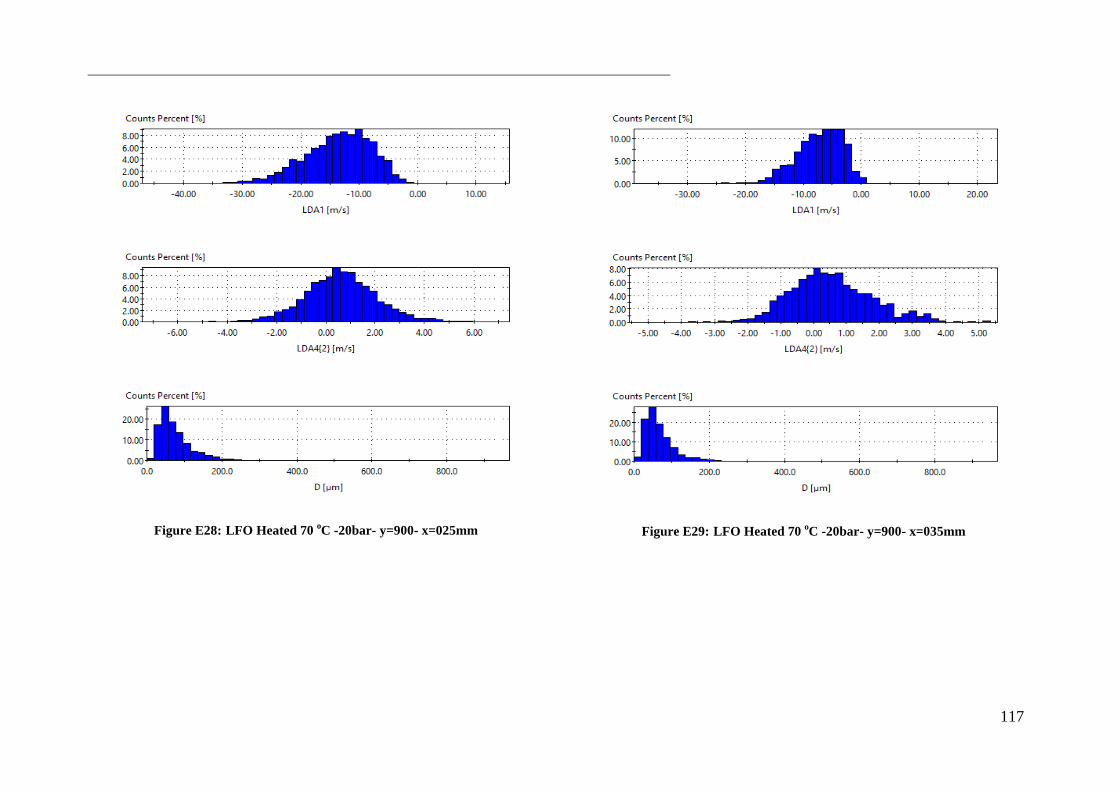
117
Figure E28: LFO Heated 70 oC -20bar- y=900- x=025mm Figure E29: LFO Heated 70
oC -20bar- y=900- x=035mm

118
APPENDIX F: RAW PDA DATA FOR HIGH PRESSURE HYDRAULIC OIL
HYDRAULIC OIL 30 Bar(g) Test case
Figure F1: Hydraulic Oil-30bar- y=600- x=000mm Figure F2: Hydraulic Oil -30bar- y=600- x=010mm

119
HYDRAULIC OIL 70 Bar(g) Test case
Figure F3: Hydraulic Oil -70bar- y=600- x=000mm Figure F4: Hydraulic Oil -70bar- y=600- x=015mm

120
HYDRAULIC OIL 110 Bar(g) Test case
Figure F5: Hydraulic Oil -110bar- y=600- x=000mm Figure F6: Hydraulic Oil -110bar- y=600- x=017mm

121
HYDRAULIC OIL 150 Bar(g) Test case
Figure F7: Hydraulic Oil -150bar- y=600- x=000mm Figure F8: Hydraulic Oil -150bar- y=600- x=020mm

122
Figure F9: Hydraulic Oil -150bar- y=900- x=000mm Figure F10: Hydraulic Oil -150bar- y=900- x=015mm

123
Figure F11: Hydraulic Oil -150bar- y=900- x=035mm

Published by the Health & Safety Executive 12/17

Experimental investigation of oil mist explosion hazards (Phase 2)
RR1110
www.hse.gov.uk
Many types of industrial equipment can potentially produce an explosive oil mist if a fault develops. However, information on the conditions in which a mist can be ignited and continue to burn is limited. To help address this, HSE and 14 industry sponsors co-funded a Joint Industry Project (JIP) on oil mist formation and ignition.
This report, produced for the JIP, describes the second phase of experimental tests to examine the ignition of mists produced by small leaks of pressurised, combustible fluids.
The size, concentration and movement of droplets were examined. The results differed significantly from those predicted by simple mist formation theories. This appeared to be the result of fundamental fluid behaviour. For all the test conditions, the droplets in the core of the spray were larger and had higher velocities than those closer to the edge. With viscous fluids the core included long ligaments, though these were difficult to measure.
These results show that simple spray models are not always appropriate for assessing the ignitability of oil mists from pressurised leaks.
This report and the work it describes were funded through a Joint Industry Project. Its contents, including any opinions and/or conclusions expressed, are those of the authors alone and do not necessarily reflect HSE policy or the views of the Joint Industry Project sponsors.


