21
+ Related Initiatives METHODOLOGY ANNEX 2012 ANNUAL PERFORMANCE REPORT
+ Related Initiatives
METHODOLOGYANNEX
2012 ANNUALPERFORMANCE REPORT
BACKGROUND TO THE IHP+RESULTS APPROACH
The IHP+Results mandate is taken from the IHP+ global compact, which calls for an independent assessment of progress.1 The reporting framework used in producing this report was developed and agreed by IHP+ signatories during the first part of 2010. In July 2011, the IHP+ Working Group on Mutual Accountability 2 reviewed the experience of implementing this agreed methodology during 2010 and agreed some minor modifications in order to strengthen the approach.
The Working Group agreed that all of the original 10 measures for IHP+ country governments and 12 for Development Partners should be maintained in 2012 monitoring, with the exception of the measure of civil society engagement. 3 This maintained the connection with the Paris Declaration Aid Effectiveness indicators 4, as a means to minimise the transaction costs associated with the reporting framework. It also enabled some analysis across time of comparable datasets generated through IHP+Results 2010 and 2012 monitoring. The measures continue to track progress against the results expected from implementing the IHP+ Global Compact, but did not include health outcomes and impacts as these are tracked elsewhere (although a limited number of these sorts of complementary measures are reported in the Country Scorecard to contextualise the findings of IHP+Results).
The targets for each measure were also largely unchanged – with the exception that a new civil society target was needed to reflect the different data being collected in 2012, and on measure 4DP which was modified to reflect OECD reporting 5 (see below for more details).
1 http://www.internationalhealthpartnership.net/fileadmin/uploads/ihp/Documents/Key_Issues/IHP_Global%20Compact_May%202012.pdfaccessed 2 October 20112.2 Chaired by UNAIDS, and including the following members: Governments of Burundi and Ethiopia, the Global Fund to fight AIDS TB and Malaria, the GAVI Alliance,
UNICEF, World Health Organisation (WHO), World Bank, the German Development Cooperation, the Netherlands Ministry of Foreign Affairs, UK Department for International Development (DFID), Oxfam GB, the London School of Hygiene and Tropical Medicine, Re-Action!
3 The indicator of civil society engagement was adapted to track ‘meaningful’ engagement rather than ‘active’ engagement.4 http://www.oecd.org/dataoecd/57/60/36080258.pdf accessed 2 October 2012.5 Aid Effectiveness 2005-10: Progress in Implementing the Paris Declaration, pp74. OECD. Available at http://www.oecd.org/dac/aideffectiveness/48742718.pdf,
accessed 2 October 2012.
2
SPECIFIC ISSUES DISCUSSED BY THE IHP+
The IHP+ Executive Team agreed:
• To continue with voluntary participation and active lobbying for more participants (in addition to same group as before) with the aim of increasing the sample size.
• To continue to only collect DP data for participating countries where the DP is “active” - to minimise transaction costs for DPs.
• To continue without target dates, accepting that limits analysis on whether speed of change is sufficient (on/off target).
• To maintain the indicator set without changes, but tighten definitions for specific key terms.
• To locate data collection at country level where there is demand.
The Mutual Accountability Working Group agreed:
• That data collection should be as per preferences of participating signatories (HQ or country-level), but with review of draft results at country level (using for example scheduled health sector coordination meetings or Joint Annual Health Sector Reviews) before results are finalised/made public.
• To aim for 2011 data but accept 2010 where this is the most recent available.
• To change the policy on use of ‘not applicable’ so that DPs cannot choose to report NA against any of the Standard Performance Measures.
• That a limited number of supplementary voluntary questions could, as in 2010 monitoring, be included in the questionnaire.
• To make minor changes to the Standard Performance Measures on civil society engagement but amplify the question in the survey tool, both for Governments and Development Partners, by using tick box options.
• A new definition for when an agency is ‘active’ in a country and should therefore reprt to IHP+Results for that country: DPs should report in any country where they are providing health sector aid (directly or indirectly).
• The set of assumptions about the use of General Budget Support relative to all of the IHP+Results indicators.
As in 2010, the IHP+ SuRG and Working Group were keen to ensure that the survey should be conducted with minimal possible transaction costs for country and development partner officials. This has impacted on the data available because, from the outset, flexibility was allowed to survey participants to provide existing (near enough) data rather than generate new (perfect) data. However, this does not weaken the survey findings if these results are used in an appropriate way. The findings can be used to inform conversations about whether partners are accurately reflecting their progress to IHP+Results, to improve the rigour of their reporting, and to ask what has changed since the period that the data come from.
3
6 For a full list of IHP+ signatories, see http://www.internationalhealthpartnership.net/en/ihp-partners/ accessed 2 October 2012.
HOW THE 2012 REVIEW WAS CONDUCTED
The IHP+ Executive Team agreed in May 2011 the timeframes for data collection and reporting. IHP+ signatories were asked to opt into the IHP+Results’ 2012 review process. 36 signatories agreed to participate, including 19 country governments (up from 10 in 2010 - all of the 10 countries that participated in IHP+Results 2010 confirmed their participation in the 2012 monitoring round); and 17 development partners (up from 15 in 2010, also including the same 15 as participated in 2010). The remainder of the 56 IHP+ signatories 6 did not volunteer to participate.
Participants in IHP+Results 2012 monitoring
As with OECD/DAC – IHP+Results process in 2012 was voluntary. The following country governments and development partners opted to participate:
19 IHP+ country governments: Benin, Burkina Faso, Burundi, Djibouti, DRC, El Salvador, Ethiopia, Mali, Mauritania, Mozambique, Nepal, Niger, Nigeria, Rwanda, Senegal, Sierra Leone, Sudan, Togo and Uganda.
17 Development Partners: AfDB, AusAID, Belgium, EC, Germany, The GAVI Alliance, GFATM, Netherlands, Norway, Spain, Sweden, UK, UNAIDS, UNFPA, UNICEF, WHO and World Bank
4
IHP+Results used the agreed measures to formulate a question-based survey tool 7 and guidance documentation, drawing as far as possible on the OECD/DAC guidance for the 2011 Paris Survey process to ensure consistency with the Paris Survey methodology.
Those participants in the 2012 monitoring that had not reported in the 2010 round were asked to provide baseline data (2005, 2006 or 2007) and latest year data (2011 or 2010 if unavailable). Those signatories that participated in 2010 monitoring were only asked to report latest year data.
Survey tools and guidance documentation 8 were available in English, French and Spanish. For each SPM, denominator and numerator data were requested, rather than percentage data. Participants had 6 weeks to provide their data (starting on 20 February 2012). Responses were collected from the participating IHP+ country governments through liaison with the IHP+ focal point in the Ministry of Health (MoH). In 2 out of 19 countries (Burkina Faso and Mozambique), on request of the MoH, a country-based consultant was identified. These consultants worked with MoH officials, under close supervision by the IHP+Results team 9, to collect the data and ensure that the MoH IHP+ focal point had signed off the completed survey tool and Country Scorecard. It was intended that the process would include consultation with Country Health Sector Teams based on guidance from the MoH, with the objective that the outputs of IHP+Results process could be used as legitimate, credible inputs to ongoing country-level discussions on health sector aid effectiveness, and to strengthen mutual accountability. In practice, this happened only in a limited number of cases (Mozambique) largely due to constraints on timing. This has limited the visibility and ownership of this exercise at country level, in particular for civil society stakeholders.
Data from Development Partners were collected through each agency’s headquarters 10. In two cases (Global Fund and UNFPA) data was primarily drawn by IHP+Results from the 2011 Paris Survey data – with some subsequent engagement by officials in both agencies to fill gaps where they existed. Data were collected for the countries in which the agency considered themselves to be active (but in 2012 this was based on the agreed definition above – a change from 2010 where no such definition had been agreed) within the 19 countries participating in the survey.
IHP+Results reviewed the completed survey tools and cleaned the data to ensure, as far as possible, consistent application of guidance on key terms and definitions 11. Draft scorecards were shared with all participating signatories to ensure that the interpretation and presentation of data were accurate. Qualifying/explanatory text was agreed between IHP+Results and each Development Partner to be presented on the reverse of their Scorecard. The Annual Performance Report provides an independent synthesis of the findings, with conclusions and recommendations based on this evidence. An Independent Advisory Group of academic and civil society leaders intensively reviewed this methodology, the findings and report, to provide their view of the integrity of the process and to produce their assessment that is included as a foreword to the report.
DATA COLLECTION AND ANALYSIS
7 A sample survey tool is available at www.ihpresults.net/how/methodology/8 Available at www.ihpresults.net/how/methodology/9 This included regular phone calls to clarify process and ensure a common understanding of key terms and definitions as set out in the Overview and Detailed
Guidance documentation produced by IHP+Results (available at www.ihpresults.net/how/methodology/10 IHP+Results established direct contact with AusAID’s office in Nepal; and with the Netherlands offices in Burkina Faso, Ethiopia, Mali, Mozambique; and with
UNICEF offices across the 19 countries – in all countries this contact was on instruction from the AusAID, Netherlands and UNICEF HQs respectively.11 In line with the Detailed Guidance documentation that was circulated at the start of the data collection process – available at www.ihpresults.net/how/methodology/
5
Analysing and interpreting the dataThe reporting framework includes both qualitative and quantitative Standard Performance Measures (SPMs) (see below, for full list). We have completed our analysis by processing and aggregating data in various ways, described below and at the end of this Annex:
Quantitative data
• To provide an overall indication of whether progress has been made, and whether targets have been met. At the highest level, we have aggregated all Development Partner data, to show one value for baseline, one value for 2009, and one two values for 2011 12, for each quantitative Standard Performance Measure (Measures 2DPa, 2DPb, 2DPc, 3DP, 4DP, 5DPa, 5DPb and 5DPc).
• To provide a per agency/country perspective on progress for each Standard Performance Measure, using the Partner and Country Scorecards, we have provided an objective rating ( , , ), based on qualitative or quantitative data and targets (depending on the measure). These ratings have been aggregated across the countries in which the agency is active. For the Country Scorecards, there is no aggregation – only government data have been used as the basis for rating progress. Ratings are derived from published criteria (see tables below). Data from Development Partners were aggregated using the formula below. Where data were not provided, or where a rating could not be calculated because of missing trend data 13, a question mark ( ) is used. A grey bar ( ) has been used where no denominator data was provided – indicating that no action was taken by the agency in a given area; this symbol was also used in a number of cases where action was not possible by Development Partners (DP). For example, DP use of a national performance assessment framework is only possible where one exists. In those countries where governments reported that they did not have a national performance assessment framework in place, all DPs that provided data for any country where this applied were rated with a . This applies to SPMs 1DP, 6DP and 7DP; and to 5DPa and 5DPb (see below). This created the potential for confusion where Development Partners and Country Governments’ interpretation of key terminology differed (see below). For Standard Performance Measure 5Ga and 5Gb, data were used from World Bank and OECD sources 14.
• We have also provided disaggregated data by development partner and by country as online annexes. These can be found at www.ihpresults.net. These development partner annexes present the calculated figures for each of the indicators and are presented by development partner (to show how each development partner performance compares across all the countries they are supporting), by country (to show the ratings of all development partners providing support to each country) and by indicator (to show how development partner performance compares across indicators), with graphs for quantitative indicators. Some concerns have been raised about comparisons that can be drawn using these tables, as development partner performance will vary from country to country according to the country context. It is also possible that the Development Partners within each of these different settings might have interpreted some of the technical terms and definitions differently. These variations will affect the comparability of results by country.
SCOPE AND LIMITATIONS
Formula for aggregating data presented in Partner Scorecard ratings
(same as the approach used to calculate the indicator value (weighted average) in the Paris Survey 2008)
Aggregate Numerator ÷ Aggregate Denominator = Result
Example:Numerator (country1) + Numerator (country 2) + Numerator (country 3)
--------------------------------------------------------------------------------------------------------- = Result
Denominator (country1) + Denominator (country 2) + Denominator (country 3)
6
12 These can be seen in graphs presented in the 2012 Annual Performance Report and online at www.ihpresults.net. One value shows comparable data – ie where a corresponding data point existed for baseline and 2009 (those Signatories that participated in 2010 monitoring); and one value shows all data – ie including those Signatories that did not participate in 2010 monitoring.
13 When a target has been met, a tick rating is recorded irrespective of trend or the existence of baseline data. But where the target has not been met, the rating is largely based on comparing baseline and latest year data. See the tables below for more on how each Standard Performance Measure rating is calculated.
14 For more information, see detailed guidance document (www.ihpresults.net). More information on 5DPb (Public Financial Management, is included below)
15 Available at www.ihpresults.net
Mutual accountability is an under-used tool to drive improvements in Health Aid effectiveness.
The IHP+ missed an opportunity to pioneer mutual accountability by not having a structured discussion on the findings of the IHP+Results 2010 report. With a few exceptions, country-level Mutual Accountability processes did not make use of IHP+Results findings to inform discussions about improving aid effectiveness. Development Partners have not systematically and routinely used IHP+Results 2010 findings to drive internal reviews to improve aid effectiveness. Civil society has been insufficiently engaged in accountability processes, and has not been provided with sufficient information to fulfil its anticipated role.
The IHP+Results performance monitoring and reporting process suggests that monitoring is useful but there are still gaps that need to be better understood.
Each round of monitoring provides stronger evidence and explanatory power. The current indicators drawn from the Paris Declaration have been useful, but do not cover all elements of aid effectiveness and new indicators need to be agreed – particularly for measuring how well Development Partners use country Procurement Systems. Partner Countries and Development Partners still report high transaction costs of monitoring, which points to insufficient ownership of the process. It is difficult to draw general conclusions from the small number of Partner Countries and Development Partners involved in the surveys, the high number of caveats, and the limitations of the existing indicator framework. More contextual information is required in future monitoring to make better sense of the findings.
IHP+ signatories and the IHP+ Core Team have devoted most of their resources to improving leadership and country frameworks for managing Health Aid so this has been where most progress has been made. In many Partner Countries the challenge is shifting to improving aid delivery by Development Partners. That too will require significant effort and resources.
The 2012/13 IHP+ workplan6 is beginning to address some of these issues that focus on the delivery of Health Aid although this is not yet adequate. IHP+Results 2012 findings suggest that the greatest need is for countries to strengthen Public Financial Management and Procurement systems and Development Partners to channel aid through these systems, to deliver more predictable Health Aid that is recorded on national budgets.
Recommendations are provided to IHP+ signatories (Partner Countries and Development Partners), as well as to the IHP+ Executive and Core Teams, to speed up their progress on implementing the IHP+ commitments. This calls for much more concerted efforts to drive aid effectiveness through mutual accountability, using stronger country-led reporting and performance monitoring processes. A summary of these recommendations follows.
The Paris Survey in 2008 used an alternative approach to aggregation (unweighted average). This calculates the result (numerator / denominator) for each country to sum these results and then divide the totals by the number of countries to derive an unweighted average. We did not have time to conduct an alternative analysis using unweighted aggregation.
Qualitative data
Qualitative data are analysed and presented in two ways: 1. Through partner scorecards. 2. Through disaggregated annexes online.
It is important to note that there is limited qualitative information to fully analyse these indicators. Questions in the survey tool for these measures focused on, for instance, the existence of a plan or the use of a national performance assessment framework and were interpreted as quantitative data. Supplementary questions were asked about quality or obstacles to use etc (see sample survey tool at www.ihpresults.net). But answers were not mandatory for supplementary questions and consequently the quality and comprehensiveness of data limit our ability to provide a qualitative assessment of the quantitative and qualitative measures. This is particularly relevant for the consistent understanding and quality of compacts, national plans, performance frameworks and mutual accountability processes.
A number of stakeholders have stressed the importance of qualitative data in order to make sense of the Standard Performance Measures and, in particular, to contextualise how these results are interpreted in the Development Partner and Country Scorecards. These Scorecards have been designed to provide a clear, easily accessible presentation of complex information mainly for a high-level political audience. For this reason, they might be of limited use to those interested in what is happening at the individual country level. Scorecards should be interpreted with care and take into consideration the limitations presented below. However, we have also taken steps to address these concerns through providing space on the reverse side of the Partner Scorecard, where DPs can qualify the results reported in the scorecard ratings; and through providing online disaggregated data for each Development Partner and Country 15.
7
Assumptions and potential limitations The reporting framework requires making a number of assumptions in how the Standard Performance Measures are reported on and interpreted.
A number of the performance targets are stated as point–in-time targets (e.g. achieve 66% of something), whilst others require demonstration of progress over time from a baseline (e.g. achieve a reduction of 66% of something to at least 85%). The target statements therefore need to be read carefully to understand how performance is being presented and rated.
Primary biases and limitations
• Self-selection and sample size. The sample of IHP+ signatories that volunteered to participate in 2010 monitoring is limited and there are key Development Partners who are not signatories to the IHP+. This means that only a partial picture of Development Partner progress in each country can be presented.
• Consistency of interpretation is likely to vary, due to complexity of terminology. In some instances, key terms are likely to have been interpreted differently by different participants in the survey, including as a result of language (for instance understanding what mutual accountability processes or performance assessment frameworks are, which can be perceived quite differently by different actors). There was some anecdotal evidence that some participants demonstrated a fuller understanding of the terminology and concepts following their previous participation in the monitoring process during 2010 – and it is likely that the quality of responses provided was higher as a result. IHP+Results did produce detailed guidance for respondents 16, but we do not know to what extent this was consistently applied, used, or sufficiently clear. Different interpretations could have been introduced due to language translations, different understanding of concepts, who was filling in the forms and what criteria were used by respondents to make judgements on their levels of contribution or progress.
• The use of country consultants to support the governments of Burkina Faso and Mozambique complete the survey tool might have resulted in additional interpretation bias or differences between how data were reported in these countries compared to others where this technical assistance was not used.
• Interpreting measure 4DP on the percent of health sector aid disbursements released according to agreed schedules in annual or multi-year frameworks – there are two ways in which 4DP measure can be interpreted. The first is as the proportion of planned funding that was actually disbursed in a given year by the development partner. The second is the proportion of actual disbursement in a year, which was planned for that year. Both tell us something valid, albeit slightly different, on the predictability of health aid that a government receives. During 2010, the IHP+Results survey was unintentionally ambiguous on this, and provided analysis on the second interpretation and provided a clear provisional indicator statement to reflect this. However, we believe that the working group had in mind the first interpretation and consequently during 2012 we have calculated and reported on this. As a result, as data on 4DP is not comparable between latest year and baseline or 2009 data, only latest year data is presented here.
16 Available at www.ihpresults.net/how/methodology/
8

• Use of data on the strength of country systems for Public Financial Management (PFM) for 5DPb. The Paris target on PFM (our Standard Performance Measure 5DPb) includes a two-tiered target: 66% reduction in aid not using PFM systems in countries with a CPIA/PFM score 17 of 5+, and 33% in countries with 3.5 of more. None of the 19 survey countries have a CPIA/PFM score of 5+; and 10 countries 18 were scored with 3.5 or above. IHP+Results therefore used 33% as the target for ratings. IHP+Results guidance also stated that agencies should only provide data for those countries with a score of 3.5 or more 19. Whilst DPs have provided a significant amount of data for those countries with a CPIA/PFM score of less than 3.5, we decided to not count these data as it is not possible to know to what extent data was missing as a result of our guidance. Instead the disaggregated ratings for all agencies operating in these countries were marked as N/A ( ) 20; and IHP+Results reporting on 5DPb is based on the 10 countries with strong PFM systems. This means that overall findings, ratings and graphs are biased towards good performance.
o A similar approach to that used for analyzing Development Partner use of PFM systems was used for DP use of country procurement systems. Drawing on OECD data, only 5 countries had some for of assessment of the strength of their country procurement system (using the agreed OECD methodology) 21. Development Partner data was only counted in these 5 countries. This means that our findings are likely to reflect an underestimate of Development Partner use of these systems. This is compounded by difficulties in counting DP budget support figures – where we know that funds for procurement use the national system, but not the volume of those funds. Furthermore, there are definitional issues around what constitutes the use of country systems which mean that this indicator is in need of close attention before further use in future monitoring (see box 1 on p24 of IHP+Results 2012 Annual Performance Report). It is important to note that the approach described here differed from the one used in 2010 monitoring – because more countries had a procurement assessment available (only 1 of the participating countries in 2010 monitoring had conducted such an assessment – which made the approach used in 2012 unfeasible).
• Limited data on a number of indicators from a number of development partners – which could skew the overall rating of certain DPs and for specific indicators. The high number of N/A responses for 5DPa and 5DPb are linked to assessments of the strength of country PFM and procurement systems (described in the point above): where information on the strength of a country system was not available, all DPs reporting in that country were rated with N/A (even if they provided data).
N/A ? Response Total
1DP 64 13 98 175
2DPa 9 67 99 175
2DPb 46 31 98 175
2DPc 6 35 134 175
3DP 9 50 116 175
4DP 10 40 125 175
5DPa 137 19 19 175
5DPb 78 36 61 175
5DPc 3 20 146 175
6DP 43 26 112 175
7DP 60 28 89 175
8DP 0 0 147 175
17 Standard Performance Measure 5Ga18 See p14 of IHP+Results 2012 Annual Performance Report.19 We included this in order to simplify and reduce transaction costs for DPs. 20 For more details, see the 5DPb disaggregated ratings at www.ihpresults.net/data-and-analysis/21 Niger, Rwanda, Senegal, Sierra Leone and Uganda
9
22 Available at www.ihpresults.net/how/methodology/ – see definition of disbursement
• We cannot exclude the possibility that there is a reluctance to report data that show poor performance, but many DPs have already knowingly reported such data anyway.
• Triangulation – The exercise has been largely self-reported, and it has been difficult to find opportunities to triangulate data without imposing significant transaction costs on Ministry of Health officials. This means that we have not been able to verify for example, whether a DP participates in a mutual accountability process in a country, and if it is the same mutual accountability process that the government has reported exists. Nonetheless there is great value in the data that has been reported in the 2010 IHP+ survey because it provides a statement of what governments and DPs consider they have done, and the survey results are an invaluable tool and starting point for discussions of mutual accountability.
• Risk of double-counting – IHP+Results guidance documentation 22 clearly set out that funds should be reported by the agency that completes the final disbursement. We are confident that this has been broadly followed, but the possibility of double-counting cannot be discounted. For example Development Partner X provides $200,000 to Development Partner Y to do capacity building in country Z. It is possible that in some instances both development partners X and Y have reported this funding.
• Baseline – DPs and countries could select baseline in keeping with IHP+ light touch principle, with suggestion to be 2007 or 2005. This table provides a summary of the chosen baselines for the key indicators requiring a measurement of change over time (2DPa, 2DPb, 2DPc, 5DPa and 5DPb). We chose not to nominate a particular baseline year because of the approximately equal split between development partner using either 2005 or 2007 in their reports. There were also a few respondents that reported 2006 and 2008 baseline data points. In the aggregate calculations for all DP performance, we have grouped 2005-2007 data as baseline and put 2008-2009 data as midpoint, and 2010-11 as latest year. We have referred to “baseline” throughout the document. The major implication of this is that readers cannot draw a conclusion that X has been achieved in Y years. But one can draw a conclusion that X has been achieved by 2011 in recent years. We are not able to calculate how far on or off track the indicators are because we do not have a target date for attainment, so the lack of a precise baseline does not cause an issue in this regard.
• Imputing values from General Budget Support – capturing information on these and incorporating them in the survey represents a number of challenges if the survey is to remain light touch. We have calculated the proportion of GBS for health based on the % of country budget allocated to health. We have assumed that this is reported on budget, that it is 100% through country financial management systems, and that it is 100% programme based approach. We have not included it for capacity building calculations or country procurement. It should be noted that this can lead to a decrease in health sector aid, which is due to factors outside the control of DP decision makers (i.e. declines in imputed GBS to health are not due to DP decisions). It should also be noted that the data provided by governments on their allocation of country budget to health differed (see above) which affects the comparability of the findings.
• Capacity building –Franco phone respondents may, in some instances due to differences in meaning in the translated terminology, have understood ‘capacity building’ to include all development assistance, and this might have unintentionally inflated their responses. Our initial analysis on this suggests that it has not proved a significant dis distortion, but steps should be taken for 2011 monitoring to limit this possibility
10
Reflections and issues for refinement for 2011 survey
• Weakness in specific indicators Performance Measures that would benefit from a closer look include: 2DPb – where many partners report 0 or 100% for this indicator, suggesting that the metric and assumptions behind it are too crude to accurately measure; 1DP/1G – definitions of “equivalent agreement” and “documented support for a compact” need to be tightened and better communicated; 6DP/6G – need to promote greater understanding that single national performance assessment frameworks should be used to assess DP programmes; 7DP/7G – a clearer understanding of mutual assessments. The value of collecting information on specific health indicators should also be reconsidered where WHS or other data already exists.
• Tighten criteria for rating – in general it is important for future monitoring to be clear about whether ratings are based on absolute or trend data. In most cases, for quantitative Standard Performance Measures, an absolute target has been established (either through the Working Group or using the Paris Framework as a precedent). But the rating criteria include a measure of progress, which requires baseline data – which has not always been available, making ratings impossible in some cases. We need to decide whether we are rating progress over time OR performance at a given point in time.
• Risk that measuring skews priorities – As with the OECD/DAC Paris survey, there is a concern that the Standard Performance Measures agreed by the SuRG to monitor IHP+ progress “assume importance in their own right, becoming a barrier to rigorous thinking and innovative practice that aims to meet the broader objective of aid effectiveness” 23
• Data verification – Future monitoring should seek additional information from respondents to enable verification of the self-reported answers provided.
• Where and when a DP should report. Whilst the IHP+ Working Group on Mutual Accountability agreed a tighter definition for when agencies are ‘active’ in a country and should include that country in their reporting, it became clear during the 2012 monitoring process that this definition needs further consideration. The definition used in 2012 monitoring was based on whether a Development Partner provided any ODA for health. Whilst this is globally consistent, it became clear that some Development Partners should report for countries where they had no intention or capacity to engage in health sector coordination – largely because they were providing health aid to NGOs or through general budget support. In these cases there was no prospect for responding positively to certain indicators, which in turn could skew the aggregate ratings for any Development Partner affected to which this applied.
• Evaluation The reported data throws up many interesting questions about why progress has or has not happened. But the agreed 2012 reporting framework did not provide opportunity to systematically evaluate the findings against the OECD/DAC Evaluation Criteria. The critical evaluation questions will be to ask whether the results seen in this survey really have been obtained, and to ask ‘why?’ to try understand the factors or actions that might have contributed to any changes, or lack of changes.
23 P27 – 2008 Survey on Monitoring the Paris Declaration: Making aid more effective by 2010
11
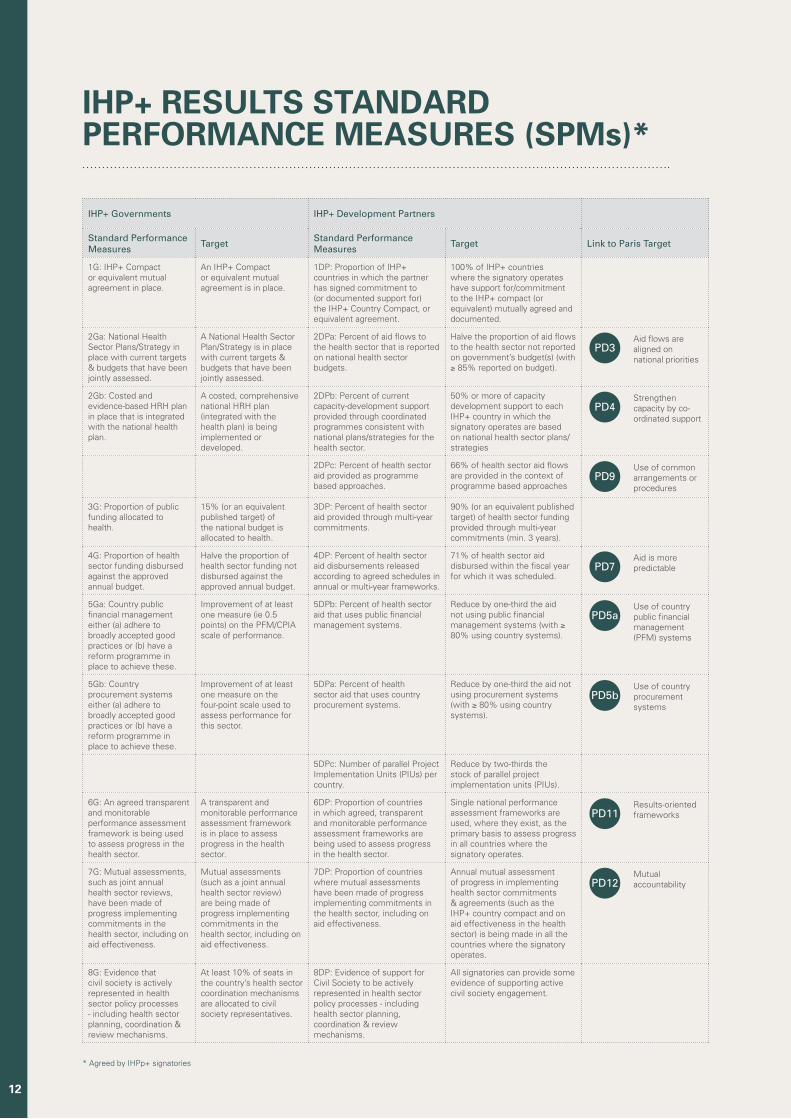
IHP+ Governments IHP+ Development Partners
Standard Performance Measures Target Standard Performance
Measures Target Link to Paris Target
1G: IHP+ Compact or equivalent mutual agreement in place.
An IHP+ Compact or equivalent mutual agreement is in place.
1DP: Proportion of IHP+ countries in which the partner has signed commitment to (or documented support for) the IHP+ Country Compact, or equivalent agreement.
100% of IHP+ countries where the signatory operates have support for/commitment to the IHP+ compact (or equivalent) mutually agreed and documented.
2Ga: National Health Sector Plans/Strategy in place with current targets & budgets that have been jointly assessed.
A National Health Sector Plan/Strategy is in place with current targets & budgets that have been jointly assessed.
2DPa: Percent of aid flows to the health sector that is reported on national health sector budgets.
Halve the proportion of aid flows to the health sector not reported on government’s budget(s) (with ≥ 85% reported on budget).
PD3Aid flows are aligned on national priorities
2Gb: Costed and evidence-based HRH plan in place that is integrated with the national health plan.
A costed, comprehensive national HRH plan (integrated with the health plan) is being implemented or developed.
2DPb: Percent of current capacity-development support provided through coordinated programmes consistent with national plans/strategies for the health sector.
50% or more of capacity development support to each IHP+ country in which the signatory operates are based on national health sector plans/strategies
PD4Strengthen capacity by co-ordinated support
2DPc: Percent of health sector aid provided as programme based approaches.
66% of health sector aid flows are provided in the context of programme based approaches
PD9Use of common arrangements or procedures
3G: Proportion of public funding allocated to health.
15% (or an equivalent published target) of the national budget is allocated to health.
3DP: Percent of health sector aid provided through multi-year commitments.
90% (or an equivalent published target) of health sector funding provided through multi-year commitments (min. 3 years).
4G: Proportion of health sector funding disbursed against the approved annual budget.
Halve the proportion of health sector funding not disbursed against the approved annual budget.
4DP: Percent of health sector aid disbursements released according to agreed schedules in annual or multi-year frameworks.
71% of health sector aid disbursed within the fiscal year for which it was scheduled.
PD7Aid is more predictable
5Ga: Country public financial management either (a) adhere to broadly accepted good practices or (b) have a reform programme in place to achieve these.
Improvement of at least one measure (ie 0.5 points) on the PFM/CPIA scale of performance.
5DPb: Percent of health sector aid that uses public financial management systems.
Reduce by one-third the aid not using public financial management systems (with ≥ 80% using country systems).
PD5aUse of country public financial management (PFM) systems
5Gb: Country procurement systems either (a) adhere to broadly accepted good practices or (b) have a reform programme in place to achieve these.
Improvement of at least one measure on the four-point scale used to assess performance for this sector.
5DPa: Percent of health sector aid that uses country procurement systems.
Reduce by one-third the aid not using procurement systems (with ≥ 80% using country systems).
PD5bUse of country procurement systems
5DPc: Number of parallel Project Implementation Units (PIUs) per country.
Reduce by two-thirds the stock of parallel project implementation units (PIUs).
6G: An agreed transparent and monitorable performance assessment framework is being used to assess progress in the health sector.
A transparent and monitorable performance assessment framework is in place to assess progress in the health sector.
6DP: Proportion of countries in which agreed, transparent and monitorable performance assessment frameworks are being used to assess progress in the health sector.
Single national performance assessment frameworks are used, where they exist, as the primary basis to assess progress in all countries where the signatory operates.
PD11Results-oriented frameworks
7G: Mutual assessments, such as joint annual health sector reviews, have been made of progress implementing commitments in the health sector, including on aid effectiveness.
Mutual assessments (such as a joint annual health sector review) are being made of progress implementing commitments in the health sector, including on aid effectiveness.
7DP: Proportion of countries where mutual assessments have been made of progress implementing commitments in the health sector, including on aid effectiveness.
Annual mutual assessment of progress in implementing health sector commitments & agreements (such as the IHP+ country compact and on aid effectiveness in the health sector) is being made in all the countries where the signatory operates.
PD12Mutual accountability
8G: Evidence that civil society is actively represented in health sector policy processes - including health sector planning, coordination & review mechanisms.
At least 10% of seats in the country’s health sector coordination mechanisms are allocated to civil society representatives.
8DP: Evidence of support for Civil Society to be actively represented in health sector policy processes - including health sector planning, coordination & review mechanisms.
All signatories can provide some evidence of supporting active civil society engagement.
IHP+ RESULTS STANDARD PERFORMANCE MEASURES (SPMs)*
* Agreed by IHPp+ signatories
12

13
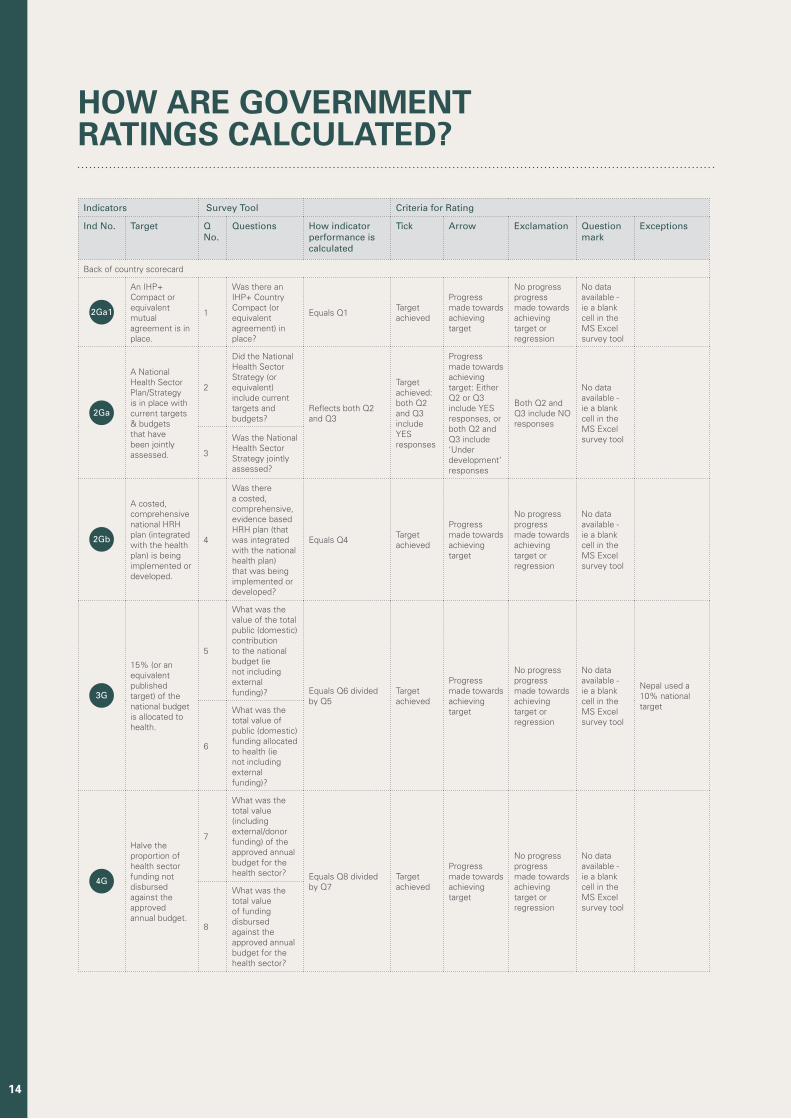
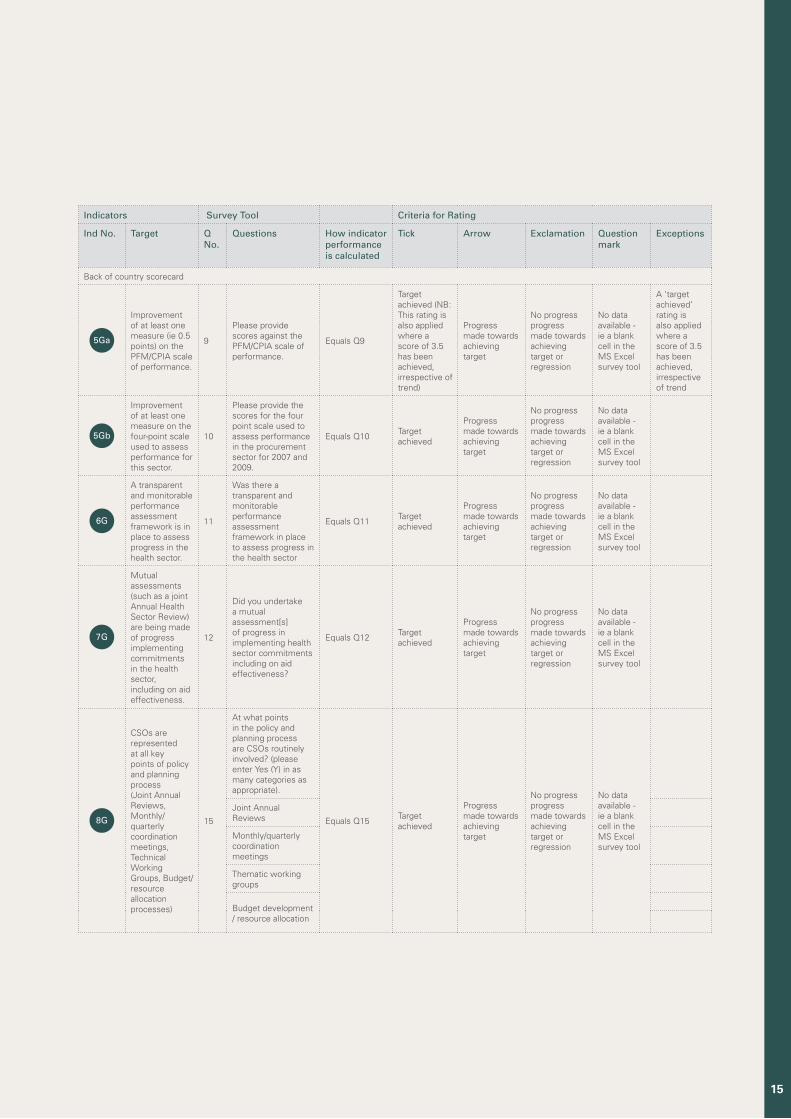
HOW ARE GOVERNMENTRATINGS CALCULATED?
Indicators Survey Tool Criteria for Rating
Ind No. Target Q No.
Questions How indicator performance is calculated
Tick Arrow Exclamation Question mark
Exceptions
Back of country scorecard
2Ga1
An IHP+ Compact or equivalent mutual agreement is in place.
1
Was there an IHP+ Country Compact (or equivalent agreement) in place?
Equals Q1Target achieved
Progress made towards achieving target
No progress progress made towards achieving target or regression
No data available - ie a blank cell in the MS Excel survey tool
2Ga
A National Health Sector Plan/Strategy is in place with current targets & budgets that have been jointly assessed.
2
Did the National Health Sector Strategy (or equivalent) include current targets and budgets?
Reflects both Q2 and Q3
Target achieved: both Q2 and Q3 include YES responses
Progress made towards achieving target: Either Q2 or Q3 include YES responses, or both Q2 and Q3 include ‘Under development’ responses
Both Q2 and Q3 include NO responses
No data available - ie a blank cell in the MS Excel survey tool
3
Was the National Health Sector Strategy jointly assessed?
2Gb
A costed, comprehensive national HRH plan (integrated with the health plan) is being implemented or developed.
4
Was there a costed, comprehensive, evidence based HRH plan (that was integrated with the national health plan) that was being implemented or developed?
Equals Q4Target achieved
Progress made towards achieving target
No progress progress made towards achieving target or regression
No data available - ie a blank cell in the MS Excel survey tool
3G
15% (or an equivalent published target) of the national budget is allocated to health.
5
What was the value of the total public (domestic) contribution to the national budget (ie not including external funding)? Equals Q6 divided
by Q5Target achieved
Progress made towards achieving target
No progress progress made towards achieving target or regression
No data available - ie a blank cell in the MS Excel survey tool
Nepal used a 10% national target
6
What was the total value of public (domestic) funding allocated to health (ie not including external funding)?
4G
Halve the proportion of health sector funding not disbursed against the approved annual budget.
7
What was the total value (including external/donor funding) of the approved annual budget for the health sector? Equals Q8 divided
by Q7Target achieved
Progress made towards achieving target
No progress progress made towards achieving target or regression
No data available - ie a blank cell in the MS Excel survey tool
8
What was the total value of funding disbursed against the approved annual budget for the health sector?
14
Indicators Survey Tool Criteria for Rating
Ind No. Target Q No.
Questions How indicator performance is calculated
Tick Arrow Exclamation Question mark
Exceptions
Back of country scorecard
5Ga
Improvement of at least one measure (ie 0.5 points) on the PFM/CPIA scale of performance.
9
Please provide scores against the PFM/CPIA scale of performance.
Equals Q9
Target achieved (NB: This rating is also applied where a score of 3.5 has been achieved, irrespective of trend)
Progress made towards achieving target
No progress progress made towards achieving target or regression
No data available - ie a blank cell in the MS Excel survey tool
A ‘target achieved’ rating is also applied where a score of 3.5 has been achieved, irrespective of trend
5Gb
Improvement of at least one measure on the four-point scale used to assess performance for this sector.
10
Please provide the scores for the four point scale used to assess performance in the procurement sector for 2007 and 2009.
Equals Q10Target achieved
Progress made towards achieving target
No progress progress made towards achieving target or regression
No data available - ie a blank cell in the MS Excel survey tool
6G
A transparent and monitorable performance assessment framework is in place to assess progress in the health sector.
11
Was there a transparent and monitorable performance assessment framework in place to assess progress in the health sector
Equals Q11Target achieved
Progress made towards achieving target
No progress progress made towards achieving target or regression
No data available - ie a blank cell in the MS Excel survey tool
7G
Mutual assessments (such as a joint Annual Health Sector Review) are being made of progress implementing commitments in the health sector, including on aid effectiveness.
12
Did you undertake a mutual assessment[s] of progress in implementing health sector commitments including on aid effectiveness?
Equals Q12Target achieved
Progress made towards achieving target
No progress progress made towards achieving target or regression
No data available - ie a blank cell in the MS Excel survey tool
8G
CSOs are represented at all key points of policy and planning process (Joint Annual Reviews, Monthly/quarterly coordination meetings, Technical Working Groups, Budget/resource allocation processes)
15
At what points in the policy and planning process are CSOs routinely involved? (please enter Yes (Y) in as many categories as appropriate).
Equals Q15Target achieved
Progress made towards achieving target
No progress progress made towards achieving target or regression
No data available - ie a blank cell in the MS Excel survey tool
Joint Annual Reviews
Monthly/quarterly coordination meetings
Thematic working groups
Budget development / resource allocation
15
Indicators Survey Tool Criteria for Rating
Ind No. Target Q No. Questions How indicator performance is calculated
Tick Arrow Exclamation Question mark
Exceptions
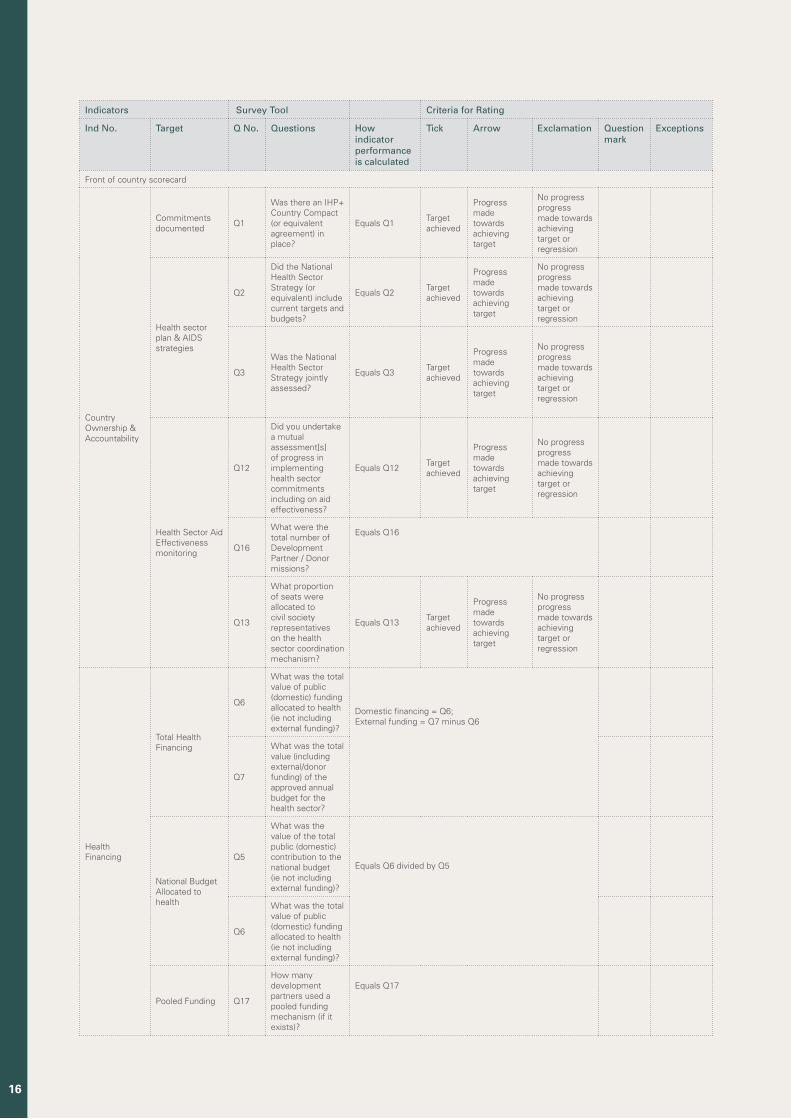
Front of country scorecard
Country Ownership & Accountability
Commitments documented
Q1
Was there an IHP+ Country Compact (or equivalent agreement) in place?
Equals Q1Target achieved
Progress made towards achieving target
No progress progress made towards achieving target or regression
Health sector plan & AIDS strategies
Q2
Did the National Health Sector Strategy (or equivalent) include current targets and budgets?
Equals Q2Target achieved
Progress made towards achieving target
No progress progress made towards achieving target or regression
Q3
Was the National Health Sector Strategy jointly assessed?
Equals Q3Target achieved
Progress made towards achieving target
No progress progress made towards achieving target or regression
Health Sector Aid Effectiveness monitoring
Q12
Did you undertake a mutual assessment[s] of progress in implementing health sector commitments including on aid effectiveness?
Equals Q12Target achieved
Progress made towards achieving target
No progress progress made towards achieving target or regression
Q16
What were the total number of Development Partner / Donor missions?
Equals Q16
Q13
What proportion of seats were allocated to civil society representatives on the health sector coordination mechanism?
Equals Q13Target achieved
Progress made towards achieving target
No progress progress made towards achieving target or regression
Health Financing
Total Health Financing
Q6
What was the total value of public (domestic) funding allocated to health (ie not including external funding)?
Domestic financing = Q6; External funding = Q7 minus Q6 Q7
What was the total value (including external/donor funding) of the approved annual budget for the health sector?
National Budget Allocated to health
Q5
What was the value of the total public (domestic) contribution to the national budget (ie not including external funding)?
Equals Q6 divided by Q5
Q6
What was the total value of public (domestic) funding allocated to health (ie not including external funding)?
Pooled Funding Q17
How many development partners used a pooled funding mechanism (if it exists)?
Equals Q17
16
Indicators Survey Tool Criteria for Rating
Ind No. Target Q No. Questions How indicator performance is calculated
Tick Arrow Exclamation Question mark
Exceptions
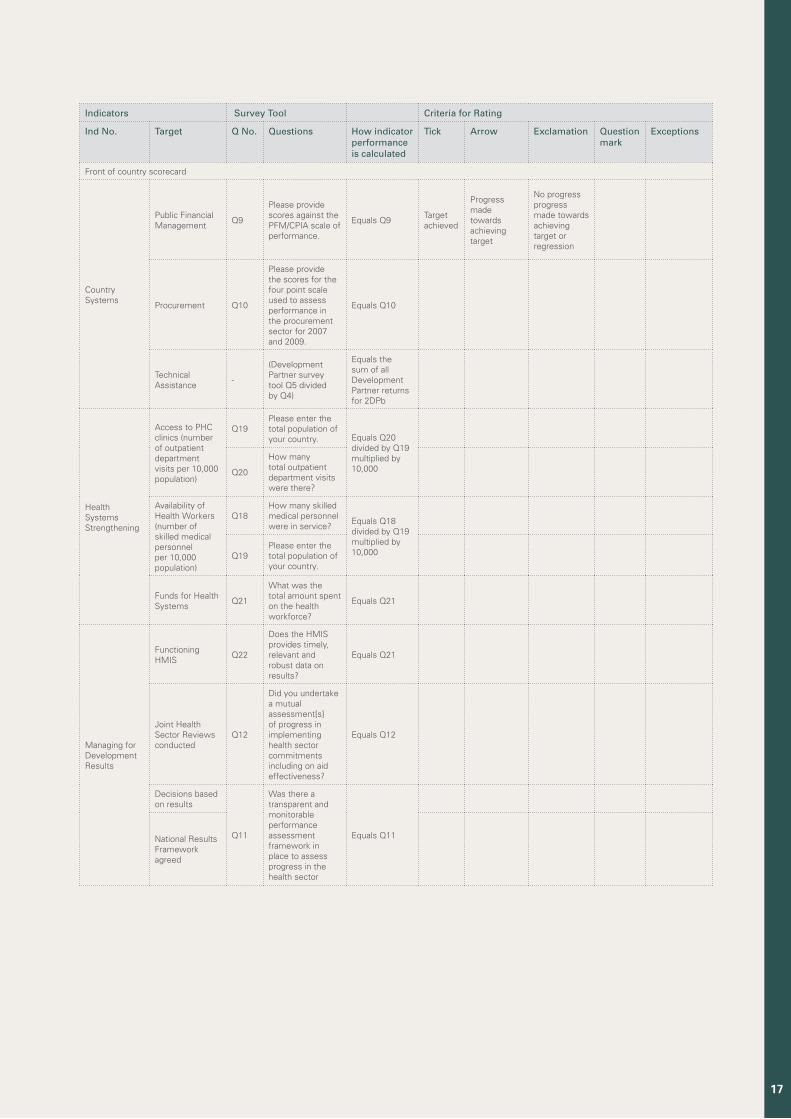
Front of country scorecard
Country Systems
Public Financial Management
Q9
Please provide scores against the PFM/CPIA scale of performance.
Equals Q9Target achieved
Progress made towards achieving target
No progress progress made towards achieving target or regression
Procurement Q10
Please provide the scores for the four point scale used to assess performance in the procurement sector for 2007 and 2009.
Equals Q10
Technical Assistance
-
(Development Partner survey tool Q5 divided by Q4)
Equals the sum of all Development Partner returns for 2DPb
Health Systems Strengthening
Access to PHC clinics (number of outpatient department visits per 10,000 population)
Q19Please enter the total population of your country. Equals Q20
divided by Q19 multiplied by 10,000
Q20
How many total outpatient department visits were there?
Availability of Health Workers (number of skilled medical personnel per 10,000 population)
Q18How many skilled medical personnel were in service?
Equals Q18 divided by Q19 multiplied by 10,000
Q19Please enter the total population of your country.
Funds for Health Systems
Q21
What was the total amount spent on the health workforce?
Equals Q21
Managing for Development Results
Functioning HMIS
Q22
Does the HMIS provides timely, relevant and robust data on results?
Equals Q21
Joint Health Sector Reviews conducted
Q12
Did you undertake a mutual assessment[s] of progress in implementing health sector commitments including on aid effectiveness?
Equals Q12
Decisions based on results
Q11
Was there a transparent and monitorable performance assessment framework in place to assess progress in the health sector
Equals Q11
National Results Framework agreed
17
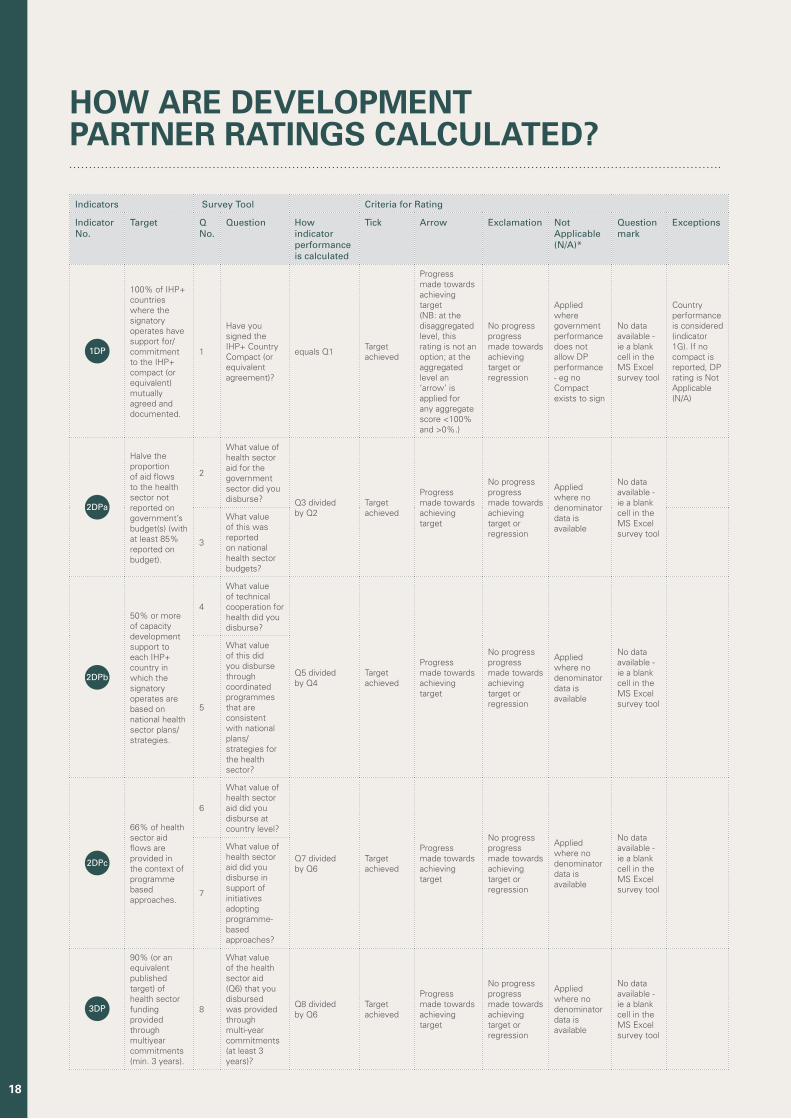
Indicators Survey Tool Criteria for Rating
Indicator No.
Target Q No.
Question How indicator performance is calculated
Tick Arrow Exclamation Not Applicable (N/A)*
Question mark
Exceptions
1DP
100% of IHP+ countries where the signatory operates have support for/commitment to the IHP+ compact (or equivalent) mutually agreed and documented.
1
Have you signed the IHP+ Country Compact (or equivalent agreement)?
equals Q1Target achieved
Progress made towards achieving target (NB: at the disaggregated level, this rating is not an option; at the aggregated level an ‘arrow’ is applied for any aggregate score <100% and >0%.)
No progress progress made towards achieving target or regression
Applied where government performance does not allow DP performance - eg no Compact exists to sign
No data available - ie a blank cell in the MS Excel survey tool
Country performance is considered (indicator 1G). If no compact is reported, DP rating is Not Applicable (N/A)
2DPa
Halve the proportion of aid flows to the health sector not reported on government’s budget(s) (with at least 85% reported on budget).
2
What value of health sector aid for the government sector did you disburse? Q3 divided
by Q2Target achieved
Progress made towards achieving target
No progress progress made towards achieving target or regression
Applied where no denominator data is available
No data available - ie a blank cell in the MS Excel survey tool
3
What value of this was reported on national health sector budgets?
2DPb
50% or more of capacity development support to each IHP+ country in which the signatory operates are based on national health sector plans/strategies.
4
What value of technical cooperation for health did you disburse?
Q5 divided by Q4
Target achieved
Progress made towards achieving target
No progress progress made towards achieving target or regression
Applied where no denominator data is available
No data available - ie a blank cell in the MS Excel survey tool
5
What value of this did you disburse through coordinated programmes that are consistent with national plans/strategies for the health sector?
2DPc
66% of health sector aid flows are provided in the context of programme based approaches.
6
What value of health sector aid did you disburse at country level?
Q7 divided by Q6
Target achieved
Progress made towards achieving target
No progress progress made towards achieving target or regression
Applied where no denominator data is available
No data available - ie a blank cell in the MS Excel survey tool
7
What value of health sector aid did you disburse in support of initiatives adopting programme-based approaches?
3DP
90% (or an equivalent published target) of health sector funding provided through multiyear commitments (min. 3 years).
8
What value of the health sector aid (Q6) that you disbursed was provided through multi-year commitments (at least 3 years)?
Q8 divided by Q6
Target achieved
Progress made towards achieving target
No progress progress made towards achieving target or regression
Applied where no denominator data is available
No data available - ie a blank cell in the MS Excel survey tool
HOW ARE DEVELOPMENTPARTNER RATINGS CALCULATED?
18
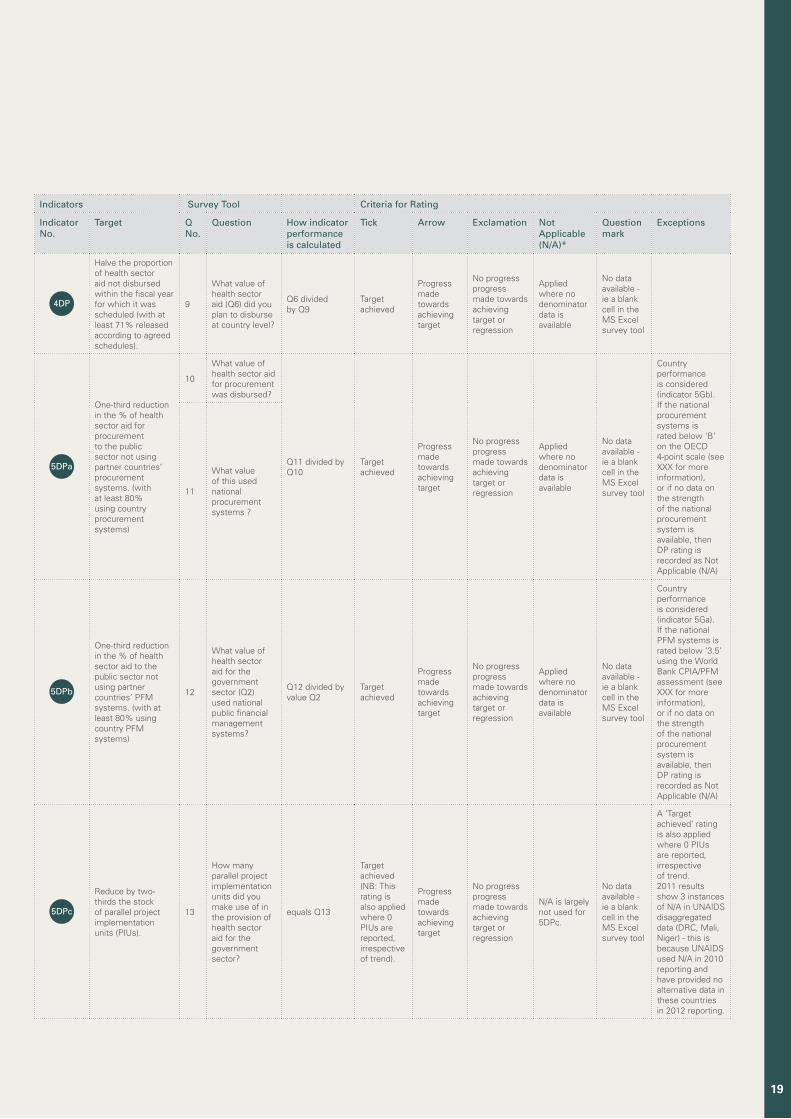
Indicators Survey Tool Criteria for Rating
Indicator No.
Target Q No.
Question How indicator performance is calculated
Tick Arrow Exclamation Not Applicable (N/A)*
Question mark
Exceptions
4DP
Halve the proportion of health sector aid not disbursed within the fiscal year for which it was scheduled (with at least 71% released according to agreed schedules).
9
What value of health sector aid (Q6) did you plan to disburse at country level?
Q6 divided by Q9
Target achieved
Progress made towards achieving target
No progress progress made towards achieving target or regression
Applied where no denominator data is available
No data available - ie a blank cell in the MS Excel survey tool
5DPa
One-third reduction in the % of health sector aid for procurement to the public sector not using partner countries’ procurement systems. (with at least 80% using country procurement systems)
10
What value of health sector aid for procurement was disbursed?
Q11 divided by Q10
Target achieved
Progress made towards achieving target
No progress progress made towards achieving target or regression
Applied where no denominator data is available
No data available - ie a blank cell in the MS Excel survey tool
Country performance is considered (indicator 5Gb). If the national procurement systems is rated below ‘B’ on the OECD 4-point scale (see XXX for more information), or if no data on the strength of the national procurement system is available, then DP rating is recorded as Not Applicable (N/A)
11
What value of this used national procurement systems ?
5DPb
One-third reduction in the % of health sector aid to the public sector not using partner countries’ PFM systems. (with at least 80% using country PFM systems)
12
What value of health sector aid for the government sector (Q2) used national public financial management systems?
Q12 divided by value Q2
Target achieved
Progress made towards achieving target
No progress progress made towards achieving target or regression
Applied where no denominator data is available
No data available - ie a blank cell in the MS Excel survey tool
Country performance is considered (indicator 5Ga). If the national PFM systems is rated below ‘3.5’ using the World Bank CPIA/PFM assessment (see XXX for more information), or if no data on the strength of the national procurement system is available, then DP rating is recorded as Not Applicable (N/A)
5DPc
Reduce by two-thirds the stock of parallel project implementation units (PIUs).
13
How many parallel project implementation units did you make use of in the provision of health sector aid for the government sector?
equals Q13
Target achieved (NB: This rating is also applied where 0 PIUs are reported, irrespective of trend).
Progress made towards achieving target
No progress progress made towards achieving target or regression
N/A is largely not used for 5DPc.
No data available - ie a blank cell in the MS Excel survey tool
A ‘Target achieved’ rating is also applied where 0 PIUs are reported, irrespective of trend. 2011 results show 3 instances of N/A in UNAIDS disaggregated data (DRC, Mali, Niger) - this is because UNAIDS used N/A in 2010 reporting and have provided no alternative data in these countries in 2012 reporting.
19
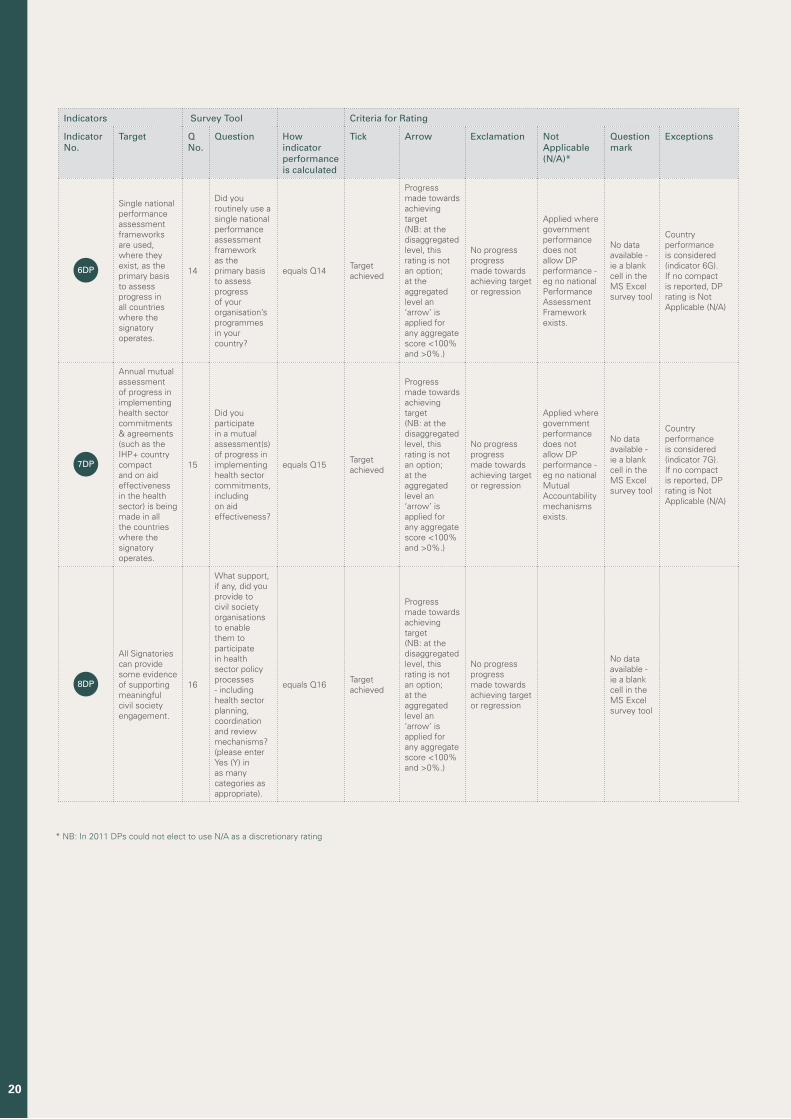
Indicators Survey Tool Criteria for Rating
Indicator No.
Target Q No.
Question How indicator performance is calculated
Tick Arrow Exclamation Not Applicable (N/A)*
Question mark
Exceptions
6DP
Single national performance assessment frameworks are used, where they exist, as the primary basis to assess progress in all countries where the signatory operates.
14
Did you routinely use a single national performance assessment framework as the primary basis to assess progress of your organisation’s programmes in your country?
equals Q14Target achieved
Progress made towards achieving target (NB: at the disaggregated level, this rating is not an option; at the aggregated level an ‘arrow’ is applied for any aggregate score <100% and >0%.)
No progress progress made towards achieving target or regression
Applied where government performance does not allow DP performance - eg no national Performance Assessment Framework exists.
No data available - ie a blank cell in the MS Excel survey tool
Country performance is considered (indicator 6G). If no compact is reported, DP rating is Not Applicable (N/A)
7DP
Annual mutual assessment of progress in implementing health sector commitments & agreements (such as the IHP+ country compact and on aid effectiveness in the health sector) is being made in all the countries where the signatory operates.
15
Did you participate in a mutual assessment(s) of progress in implementing health sector commitments, including on aid effectiveness?
equals Q15Target achieved
Progress made towards achieving target (NB: at the disaggregated level, this rating is not an option; at the aggregated level an ‘arrow’ is applied for any aggregate score <100% and >0%.)
No progress progress made towards achieving target or regression
Applied where government performance does not allow DP performance - eg no national Mutual Accountability mechanisms exists.
No data available - ie a blank cell in the MS Excel survey tool
Country performance is considered (indicator 7G). If no compact is reported, DP rating is Not Applicable (N/A)
8DP
All Signatories can provide some evidence of supporting meaningful civil society engagement.
16
What support, if any, did you provide to civil society organisations to enable them to participate in health sector policy processes - including health sector planning, coordination and review mechanisms? (please enter Yes (Y) in as many categories as appropriate).
equals Q16Target achieved
Progress made towards achieving target (NB: at the disaggregated level, this rating is not an option; at the aggregated level an ‘arrow’ is applied for any aggregate score <100% and >0%.)
No progress progress made towards achieving target or regression
No data available - ie a blank cell in the MS Excel survey tool
* NB: In 2011 DPs could not elect to use N/A as a discretionary rating
20

PRODUCED BY:Responsible Action UK
Shoreditch Stables, 138 Kingsland Road, E2 8DY, London, UK
Re-Action! (Pty) Ltd 24 Bolton Road, Parkwood, Johannesburg, South Africa | Tel: +27 11 880 6993
www.ihpresults.net


