29
IHS Petrochemical Outlook Presentation to Indian Petrochem 2014 Tony Potter Vice President Asia Pacific IHS Chemical October 30, 2014

IHS Petrochemical
Outlook
Presentation to Indian Petrochem 2014
Tony Potter
Vice President Asia Pacific
IHS Chemical
October 30, 2014

Best-in-Class Brands
Brought together to form the most comprehensive
source for chemical market research and
expertise in the world – IHS Chemical.
© 2014 IHS
IHS CHEMICAL
IHS Chemical

Agenda: Petrochemical Outlook
• Key Drivers In Base
Chemicals
• Energy at the Extremes
Impacts Cracker Build
• Coproducts: Producers
Adapt to Meet Supply Gap
• Costs and Profitability

Energy &
Feedstocks …make up 60-70% of the costs of chemical
production. Investments seek a
competitive advantage in energy and feedstock costs.
Demand Growth Proximity to
demand growth essential without
distinct cost or technology
advantage. Trade access is also key.
Technology Technology to
enable competitive production costs,
economies of scale, high performance products. First to
market is important.
Chemical Investments Seek A
Sustainable Advantage

© 2014 IHS, Inc. No portion of this presentation may be reproduced,
reused, or otherwise distributed in any form without prior written consent.
Percentage
5
Asia’s Large Increase in Manufacturing Supports
Base Chemical and Polymer Demand Growth
0
20
40
60
80
100
PE PP PVC Polyester Butadiene Bz PX
China Rest of Asia
Share of World Demand Growth 2008-2018, Percent

China, 1,221
Indonesia, 150
S. Korea, 184
Singapore, 73
Thailand, 120
Malaysia, 65
Japan, 1,047
Taiwan, 149
-2%
-1%
0%
1%
2%
3%
-2% 0% 2% 4% 6% 8% 10% 12%
Bubble Size: Total Consumption for Durable, Non-Durable and Semi-Durable Goods in 2018, Billion of
Population Growth Rate for 2013-2018 (15 to 65 years)
Middle/ Upper Class Growth Rate for 2013-2018 (Household Income >
USD5,000)
Middle Class Growth and Urbanisation
Agenda: Petrochemical Outlook
• Key Drivers In Base
Chemicals
• Energy at the Extremes
Impacts Cracker Build
• Coproducts: Producers
Adapt to Meet Supply Gap
• Costs and Profitability

Feedstock Price Differentials vs. Crude Oil Create opportunities in coal, gas, ethane
-4.0
0.0
4.0
8.0
12.0
16.0
20.0
2000 2002 2004 2006 2008 2010 2012 2014 2016 2018 2020
Brent - Nat Gas Brent - Coal Brent-ethane
Price Difference, $MMBtu

Chemical Projects Leveraging Local
Natural Resources Gas/Coal/Oil
Requires
Infrastructure
and policy
definition
Needs
infrastructure
and
government
support Focus is
primarily
LNG
LPG/MTO
investigations early
but promising
Active Projects Reserve potential
Numerous shale
and LPG based
projects.
Potential for MTO
Continued
gas, liquid &
LPG based
investing
Numerous
CTO / MTO
projects
underway

© 2014 IHS, Inc. No portion of this presentation may be reproduced,
reused, or otherwise distributed in any form without prior written consent.
-2 0 2 4 6 8 10 12 14
Americas
Europe
MDE/Afr
China
Rest of Asia
Naphtha & Heavier LPG Ethane Coal/ Methanol Others
Incremental Ethylene Capacity 2014-19, Million Metric Tons
A Time of Coal and Ethane
10

© 2014 IHS, Inc. No portion of this presentation may be reproduced,
reused, or otherwise distributed in any form without prior written consent.
Cracker Feed Stocks Are Getting Lighter, But
the World Still Needs Naphtha
35%
9% 5%
46%
3% 1% 1%
2014: 137.3 MT
39%
7% 4%
40%
3% 1% 3% 3%
2019: 167.1 MT
Ethane Propane Butane Naphtha Gas Oil Methanol to Olefins Coal to Olefins Others
32%
8%
5%
50%
4% 1%
2009: 110.7 MT

© 2014 IHS, Inc. No portion of this presentation may be reproduced,
reused, or otherwise distributed in any form without prior written consent.
North America: The Natural Gas Shift
0%
20%
40%
60%
80%
100%
120%
0
2
4
6
8
10
12
14
16
18
00 01 02 03 04 05 06 07 08 09 10 11 12 13 14 15 16 17 18
Crude (WTI) Natural Gas Gas as % of Crude
Gas as % of Crude Dollars per MMBtu
Forecast

-6
-4
-2
0
2
4
6
8
10
12
14
Benzene Chlroine Methanol Propylene Ethylene
00 to 10 10 to 20
Million Metric Tons
Chlorine
United States Basic Chemicals Growth 2000/2010 versus 2010/2020
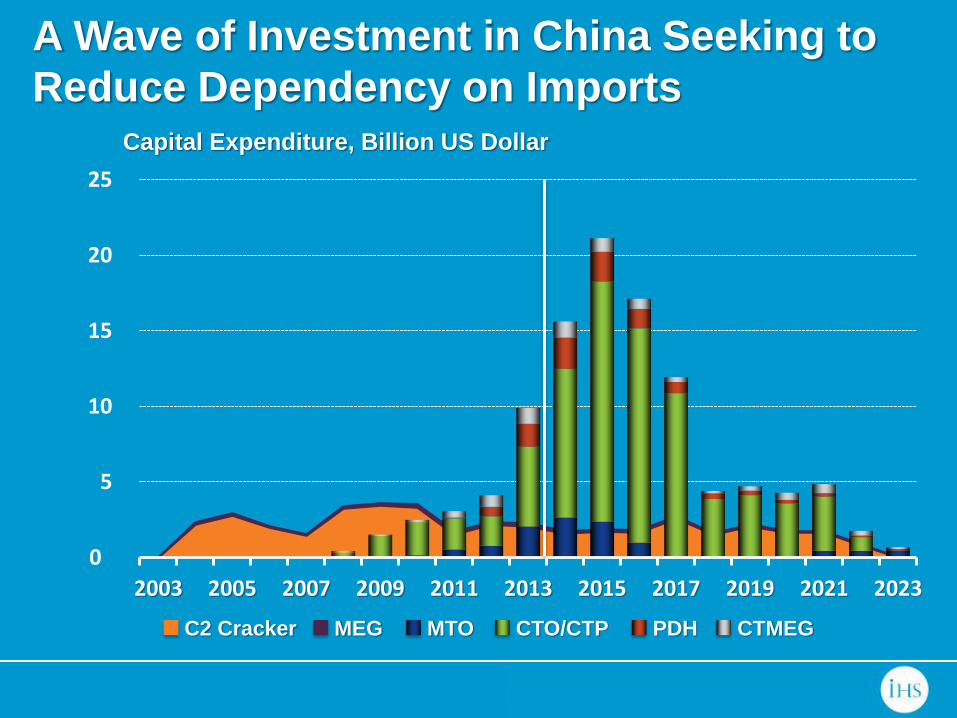
A Wave of Investment in China Seeking to
Reduce Dependency on Imports Capital Expenditure, Billion US Dollar
0
5
10
15
20
25
2003 2005 2007 2009 2011 2013 2015 2017 2019 2021 2023
CTMEG CTO/CTP MTO PDH C2 Cracker MEG

© 2014 IHS, Inc. No portion of this presentation may be reproduced,
reused, or otherwise distributed in any form without prior written consent.
Coal-to-Olefin/ Methanol-to-Olefin Projects (2010 to 2018)
Baotou Shenhua
600 KTA CTO
Inner Mongolia, 2010
Shenhua Ningmei
500 KTA CTP
Ningxia, 2010
Zhongyuan PC
200 KTA CTO
Henan, 2011
Datang International
500 KTA CTP
Inner Mongolia, 2012
Wison (Nanjing)
300 KTA MTO
Nanjing, 2013
Fund Energy
(Ningbo)
600 KTA MTO
Zhejiang, 2013
15
CTO/CTP: 20
MTO/ MTP: 9
CTO/CTP: 4
MTO/ MTP: 2
Completed Projects
Upcoming Projects

China Is Reducing Ethylene Derivative Import
Dependency (But Still Needs Imports)
16
20
30
40
50
60
70
80
0
10
20
30
40
50
60
2009 2010 2011 2012 2013 2014 2015 2016 2017 2018 2019Net Equivalent Import (Export) Domestic Derivative Equivalent Demand
Self-sufficiency
Million Metric Tons Equivalent Ethylene Percent, %
16

© 2014 IHS, Inc. No portion of this presentation may be reproduced,
reused, or otherwise distributed in any form without prior written consent.
-5.0
-4.0
-3.0
-2.0
-1.0
0.0
1.0
08 09 10 11 12 13 14 15 16 17 18Ethylene Vinyls Styrenics Polyethylene
Glycol Others Net Trade
Net Exports
Net Imports
Million Metric Tons, Equivalent Ethylene
India Import Requirement Grows Despite New
Capacity Build

Agenda: Petrochemical Outlook
• Key Drivers In Base
Chemicals
• Energy at the Extremes
Impacts Cracker Build
• Coproducts: Producers
Adapt to Meet Supply Gap
• Costs and Profitability

© 2014 IHS, Inc. No portion of this presentation may be reproduced,
reused, or otherwise distributed in any form without prior written consent.
Cracker Production of Propylene and
Butadiene Falls Relative to Ethylene
70%
80%
90%
100%
110%
00 01 02 03 04 05 06 07 08 09 10 11 12 13 14 15 16 17 18 19 20 21 22 23
P/E B/E
2000 = 100%

© 2014 IHS, Inc. No portion of this presentation may be reproduced,
reused, or otherwise distributed in any form without prior written consent.
Propylene Producers Adapt, Some More
Aggressively
0%
10%
20%
30%
40%
50%
60%
70%
80%
90%
100%
00 02 04 06 08 10 12 14 16 18 20 22
US Propylene Supply
Stm. Crackers FCC Splitters DehydroMetathesis Olefin Cracking Methanol to OlefinsMethanol to Propylene Coal to Olefins Coal to PropyleneHS FCC Others On-Purpose
0%
10%
20%
30%
40%
50%
60%
70%
80%
90%
100%
00 02 04 06 08 10 12 14 16 18 20 22
China Propylene Supply

© 2014 IHS, Inc. No portion of this presentation may be reproduced,
reused, or otherwise distributed in any form without prior written consent.
-2 0 2 4 6 8 10 12 14 16 18 20
Americas
Europe
MDE/Afr
China
Rest of Asia
Steam Cracker FCC Coal/ Methanol PDH Others
Incremental Propylene Capacity 2013-18, Million Metric Tons
Coal and Propane Drive Propylene

© 2014 IHS, Inc. No portion of this presentation may be reproduced,
reused, or otherwise distributed in any form without prior written consent.
Upcoming PDH Projects in Northeast Asia
(to 2018)
Bohai Chemical 600 KTA C3
Tianjin
22
1 (China)
2 (South Korea)
12 (China)
2 (South Korea)
Completed Projects
Upcoming Projects
Hyosung 165 KTA C3
Ulsan
Tae Kwang 250 KTA C3
Ulsan

Agenda: Petrochemical Outlook
• Key Drivers In Base
Chemicals
• Energy at the Extremes
Impacts Cracker Build
• Coproducts: Producers
Adapt to Meet Supply Gap
• Costs and Profitability

© 2014 IHS, Inc. No portion of this presentation may be reproduced,
reused, or otherwise distributed in any form without prior written consent.
Global Ethylene Balance Is Tightening
75
80
85
90
95
0
50
100
150
200
2009 2010 2011 2012 2013 2014 2015 2016 2017 2018 2019
Demand Total Capacity Operating Rates
Million Metric Tons Operating Rates, %

© 2014 IHS, Inc. No portion of this presentation may be reproduced,
reused, or otherwise distributed in any form without prior written consent.
But Substantial Over-Build of Propylene Capacity
-4
0
4
8
12
00 01 02 03 04 05 06 07 08 09 10 11 12 13 14 15 16 17 18 23
North America Middle EastChina West EuropeOthers Annual Demand Increase
Million Metric Tons, Propylene

© 2014 IHS, Inc. No portion of this presentation may be reproduced,
reused, or otherwise distributed in any form without prior written consent.
Ethylene Cash Cost Snapshot Regional Comparison: 2013 vs 2023
0
225
450
675
900
1125
1350
1575
WesternCanada
U.S.Ethane
U.S.WeightedAverage
China CTO WestEuropeNaphtha
NortheastAsia
Naphtha
SoutheastAsia
Naphtha
China MTO
U.S. Dollars Per Metric Ton
2013 2023

-$100
-$50
$0
$50
$100
$150
$200
$250
$300
-$100
-$50
$0
$50
$100
$150
$200
$250
$300
85 88 91 94 97 00 03 06 09 12 15 18
$ per ton $ per Ton
Basic Chemicals & Plastics EBIT Comparison
Global Average West Europe Asia North America
Global Profit on the Upswing; Down-Cycle Will
Be Muted for Advantaged Regions

Conclusions
• The petrochemical world has
split between advantaged cost
feedstock “haves” and “have
nots”
• But….the world still needs
investment in naphtha
crackers
• Shale (and Coal) create supply
imbalances in other value
chains
• Profits are on the upswing; but
large regional variations

IHS Petrochemical Outlook
THANK YOU
Tony Potter
Vice President, Asia Pacific
IHS Chemical


