59
1 WORKING PAPER Intangible Capital in the Netherlands and its Implications for Future Growth

1
WORKING PAPER
Intangible Capital in the Netherlands and its
Implications for Future Growth

2
Authors
Bart van Ark is senior vice president and chief economist of The Conference Board and professor
of economics at The University of Groningen.
Kirsten Jäger is as an economist at The Conference Board Europe.
About This Report
This report, which was commissioned by the Dutch Innovation Platform as part of their
Knowledge Investment Agenda (KIA), was developed by The Conference Board. The aims of the
report are to measure the overall size and impact of intangible investments and capital in the
Dutch economy since 1995, to analyze their impact on economic growth, and to sketch a number
of growth scenarios aimed at identifying how an increase in public expenditure on intangibles
would affect future growth. The approach and conclusions from this report do not necessarily
reflect the views of the Innovation Platform.
About The Conference Board
The Conference Board creates and disseminates knowledge about management and the
marketplace to help businesses strengthen their performance and better serve society.
Working as a global, independent membership organization in the public interest, we conduct
research, convene conferences, make forecasts, assess trends, publish information and analysis,
and bring executives together to learn from one another.
The Conference Board is a not-for-profit organization and holds 501 (c) (3) tax-exempt status in
the United States.
The Conference Board, Inc. 845 Third Avenue, New York, NY 10022-6600, United States
212 759 0900 / www.conference-board.org
The Conference Board Asia-Pacific 22/F Shun Ho Tower, 24-30 Ice House Street, Central,
Hong Kong, SAR
+ 852 2804 1000
The Conference Board China Beijing Representative Office, 7-2-72 Qijiayuan, 9 Jianwai Street,
Beijing 100600 P.R. China
86 10 8532 4688
The Conference Board Europe Chaussée de La Hulpe 130, box 11, B-1000 Brussels, Belgium
+ 32 2 675 54 05 /
Conference Board India 701 Mahalaxmi Heights, A Wing, Keshav Rao Khadye Marg,
Mahalaxmi, Mumbai 400 011 India
91 9987548045
The Conference Board of Canada 255 Smyth Road, Ottawa, ON K1H 8M7, Canada
613 526 3280
About the Dutch Innovation Platform
The Dutch Innovation Platform is a national body designed to unite companies, knowledge
institutes and government to promote innovation and encourage initiative. The platform includes
the participation of 17 key figures from the world of government, business, science and academia,
and education. It also includes members from specific sectors, including healthcare and the water
industry. They take part in the platform in a personal capacity and enjoy support from their own
specific sectors. The Dutch Innovation Platform is headed by the Dutch Prime Minister, who
serves as the platform‘s chairman. The platform is supported by a project office.
3
Table of Contents
I. Introduction 6
II. Private and public investment in intangibles 8
Measuring intangible investment 10
Public R&D 10
Overlap issues concerning R&D 11
Education 12
Results and comparison with estimates from Statistics Netherlands 13
III. Growth accounting 14
Sources, assumptions and methodology 15
Results from growth accounting 20
IV. Scenarios for future growth and implications 22
V. Conclusions 25
References 28
Tables and Figures 31
Appendix 51

4
Summary
This study is concerned with the role of intangible capital in the Dutch economy. We estimate
how much the private and public sectors in the Netherlands invested in intangible assets until
2008. Using the growth accounting methodology, we compute the contributions of labour,
physical capital, and intangible capital to economic growth from 1995-2008. We also
compute scenarios aimed at quantifying the effects of different trends in intangible investment
on economic growth until 2020.
A unique feature of this report is the combined study of investment in intangibles in the
commercial and public sectors of the economy. We highlight the effects of investment in
public R&D and education. Total investment in the commercial sector amounted to 49 billion
euros in 2008 and 35 billion euros in the public sector, of which 25 billion was for education.
This is equal to 14.2 percent of GDP, of which 8.3 percent came from intangible investment
in the commercial sector and 5.9 percent came from public intangible investment.
Intangibles accounted for 1.4 percentage points or almost half of the 3 percent output growth
in the total economy from 1995 to 2008. Public intangibles, including education and public
R&D (reflecting internal and external effects), made up for about one-third of the intangibles‘
growth contribution, and commercial sector investment accounted for the remainder. Our base
scenario from 2010 to 2020 posts a GDP of 1.9 percent, relative to 2.2 percent from 2000 to
2008. The slower growth is mainly the result of a decline in the contribution of labour input,
but the intensity of intangible per unit of labor is assumed to remain stable in the base
scenario. According to the most optimistic growth scenario, which assumes an increase in the
share of public intangible investment in GDP by 1 percentage point (equal to about 7 billion
euro) by 2020, and a corresponding increase in private intangible investment, GDP growth
will improve by 0.2 percentage points relative to the base scenario, increasing the level of
GDP in 2020 by 15.5 billion euro, which equals 2.2 percent of total GDP. In contrast, keeping
public intangible investments in real terms constant at the current level could have devastating
effects on GDP growth from 2010-2020, slowing it to between 1.5 percent in a lower
pessimistic scenario and 1.7 percent according to an upper pessimistic scenario. It should be
noted that the effect of higher investment in education will only pay off beyond 2020. With a
slowing labor force, these investments will be even more important after 2020 to keep the
growth rate of the economy at sustainable levels.
5
In conclusion, the study shows that continued investment in intangibles is a key part of
keeping the growth of the Dutch economy on track. A destruction or slowdown in creation of
intangible capital would hamper the ability to keep economic growth at sustainable rates. An
accelerated investment in public intangibles equal to 1 percent of GDP will raise GDP growth
permanently. The caveat is that the commercial sector needs to be able and willing to step up
their investments to the same degree. While investment in public intangibles is an important
factor in raising the potential for faster growth, the overall business environment will
determine if the commercial sector is able to strengthen and exploit their own capabilities in
this field to realize this potential.
Acknowledgments
We are grateful to Bert Colijn for his help with the data collection and translations of Dutch
documents. We especially thank Murat Tanriseven, Dirk van den Bergen and Myriam van
Rooijen-Horsten from Statistics Netherlands for providing us with the necessary data for this
project, their cooperation, and many useful comments. Finally, we benefitted from comments
at various occasions from Rens van Tilburg, Edo Haveman and Jan Peter van den Toren
(Innovatieplatform); Piet Donselaar and Theo Roelandt (Ministry of Economic Affairs) and
Bert Minne, Henry van der Wiel and Debby Lanser (CPB). The authors remain solely
responsible for the results and analysis presented in this paper.
6
I. Introduction
Innovation is not free. While in the past, innovation and technological progress was
sometimes treated as ―manna from heaven,‖ such as in the traditional neoclassical model of
economic growth, economists and other scholars have come to realize that innovation requires
a long-term investment strategy that involves both the private (or commercial) and the public
(or government) sectors of the economy. This study looks at the role of innovation, as
measured by the contribution of intangible capital, to economic growth in the Netherlands
from 1980 to 2020. The contribution of innovation and knowledge to growth and the
implication for the Dutch public budget is of great interest, as a new prioritizing in
government finances is currently underway. Even though information on public investment in
knowledge and intangibles and their implications for economic growth is needed to make
adequate policy decisions, detailed studies on how such investments impact the growth
performance at the macro level are scarce. In addition, while studies often look at components
of the innovation spectrum (for example public innovation programs or private expenditure),
the combined effects of such inputs on the output of the economy are rarely studied
comprehensively.
There is a long history of attempts to measure intangible investment, including Howitt (1996),
Croes (2000), Lev (2001), and Khan (2001). Minne (1995) took a first step in measuring the
effect of intangible expenditure and investment in the Netherlands, using research and
development data from private, public and research organizations; education data and
investments in software, marketing, licenses and patents; and technical service-providing and
organizational advice. Since the late 1990s, Statistics Netherlands (CBS) has published these
numbers on a regular basis in the Kennis en Economie series. Van Ark and de Haan (2000),
while updating the work from Minne (1995), adopt a growth accounting approach to measure
the impact of intangible capital in growth in the Netherlands from 1975 to 1997.
A significant step in measuring investments in intangible capital in the business sector was
made more recently by Corrado, Hulten and Sichel (CHS 2005, 2009). CHS have argued that
an input should be treated as an investment as long as it reduces current consumption with the
aim to generate revenues in the long term. This has also been recognized in national
accounting practice, since software is already included as an asset in aggregate accounts, and

7
there has recently been a move to capitalize R&D (Hulten, 2008; van Rooijen-Horsten et al.,
2008b).
There is, of course, more to intangibles than software and R&D. CHS advocate broadening
the list of capitalized intangibles and classified expenditures on intangible assets in three
categories (computerized information, innovative property and economic competencies). The
authors have developed a methodology to measure and ―capitalize‖ them, so that they appear
as investment rather than expenditure in the national accounts. They have also formalized
how intangible capital may be incorporated into the conventional GDP/GDI national
accounting identity. The key to this extension is that the flow of new intangibles must be
included both on the product side of the accounts and on the input/income side via the flow of
services from the intangible stock.
Corrado, Hulten and Sichel (2005, 2009) and Marrano, Haskel and Wallis (2007, 2009) have
also extended the growth accounting methodology to estimate how much investments in
intangible assets contributed to the growth of the private sector in the United States and the
United Kingdom, respectively. The methodology was extended to the Netherlands by van
Rooijen-Horsten et al. (2008a and 2008b) and CBS (2009). Recent studies by The Conference
Board have extended the existing estimates and provided an international comparison for
eleven countries, including Austria, Denmark, Germany, Greece, France, Italy, Slovakia and
Spain (Hao et al. 2009; van Ark et al. 2009). These studies show significant differences in the
share of intangibles in total GDP. For example, in the United States, the private non-farm
business sector invested 11.5 percent of conventionally measured GDP in intangible assets in
2006. In that year, the United Kingdom, the private sector invested 10.5 percent of GDP in
intangibles, while Germany (7.2 percent), France (7.9 percent), Italy (5.0 percent) and Spain
(5.5 percent) invested less. At 9.1 percent of GDP, according to CBS (2009), the Netherlands
seems to occupy the middle ground. Indeed, there seems to be a positive relationship between
intangible investment and the level of economic development of a country, although the
research into how this relationship exactly comes about, and what the direction of causality is,
is still in its early days (van Ark et al., 2009). The results of the studies mentioned above are
summarized in Table 1.
8
A limitation of all of the studies cited above is that they focused entirely on intangibles in the
commercial sector of the economy only. In this study, we include measurements of intangible
assets in the public sector of the economy, including public R&D and general education. In
Section 2, we present our measures of intangible investment in the commercial sector, as well
as in the aggregate total economy in the Netherlands up to 2008. In Section 3, we use growth
accounting methodology to compute the contributions of labour, physical capital and
intangible capital to economic growth in the Dutch commercial sector and total economy. In
addition to the aggregate contributions of intangibles and knowledge to growth, we also look
at the growth contributions of the individual components of intangible capital. In Section 4,
we offer three scenarios for future growth based on plausible assumptions about the growth
pattern of intangible investments and their potential contribution to economic growth until
2020. We differentiate between a business-as-usual base scenario, an optimistic scenario (or
―accelerated investment in intangibles‖) and a pessimistic scenario (or ―stagnating
investment‖). The latter scenario offers some clues about the impact of different intangible
investment scenarios on the growth performance of the Dutch economy.
II. Private and public investment in intangibles
Before we turn to intangible capital in the Netherlands, an explanation of the difference
between investment and expenditure is required. The System of National Accounts (SNA,
1993) recommends that an expenditure that has long-lasting effects should be treated as an
investment where the acquisition or own account production of an asset is concerned. The
convention is that if the spending benefits the spender for more than one year, the spending is
an investment (CHS, 2005). Treating expenditures on intangibles as investments also makes
economic sense from a business strategy point of view. Outlays on software, R&D,
advertising, training, organizational capital, etc., are critical investments that sustain a firm‘s
market presence in future years, by reducing costs and raising profits beyond the current
accounting period. Similarly, such investments are carried out with the expectation that they
will increase the future profit of a firm, an expectation that has been validated in the studies
that examine the positive correlation between R&D and patents and stock prices (Hall, 1999).
Moreover, marketing intangibles (brand equity, customer satisfaction) determine whether or
not a firm is competitive in the long run.

9
In a series of reports (van Rooijen-Horsten et al., 2008a; van Rooijen-Horsten et al., 2008b;
and CBS, 2009), Statistics Netherlands has focused on the measurement and analysis of
intangible investment in the Netherlands. Van Rooijen-Horsten et al. (2008a) discussed in
detail conceptual and measurement issues and present time series of investment in intangibles
(including by industry) until 2004. Van Rooijen-Horsten et al. (2008b) updated the estimates
through 2005. The latest publication from Statistics Netherlands (CBS, 2009) publishes
preliminary investments in intangibles up to 2008. The CBS study concludes that the Dutch
commercial sector invested 9.1 percent of GDP (48.9 billion euros) in intangible assets in
2006. Table 1 summarizes the results from van Ark et al. (2009) and CBS (2009).
In order to estimate how much the Dutch economy invested in intangible assets in 2008, we
extended the numbers for the commercial sector used by van Rooijen-Horsten et al. (2008a)
and CBS (2009) to include intangible investment by the Dutch public sector. For the
commercial sector, we largely follow the methodology laid out by Corrado, Hulten and Sichel
(2005, 2006, 2009) and van Rooijen-Horsten et al. (2008a). The primary difference from the
latter study is that we use a different definition of the commercial sector than that used by
CBS. While CBS excludes ―other industries,‖ such as real estate activities, renting of
movables and private households with employed persons, from the commercial sector, we
have included this category in our analysis.1 We distinguish between the commercial sector
and the aggregate economy as follows:
Industry classification:
1. Agriculture, forestry and fishing Commercial sector
2. Mining and quarrying Commercial sector
3. Manufacturing Commercial sector
4. Electricity, gas and water supply Commercial sector
5. Construction Commercial sector
6. Trade, hotels, restaurants and repair Commercial sector
7. Transport, storage and communication Commercial sector
8. Financial and business activities Commercial sector
9. General government Public sector
10. Care and other service activities Commercial sector
11. Other industries Commercial sector
1 CBS justifies the exclusion of other industries with the argument that output and inputs are not measured
independently in these industries. For the same reason, they exclude the public sector from their analysis.
10
We first estimated how much the Dutch public sector invested in the traditional CHS
categories of intangibles (computerized information, innovative property, and economic
competencies). (Our estimates for intangible investment in 2007 and 2008 are preliminary, as
the commercial and the aggregate economy were approximated according to their shares of
the total economy GDP in 2006.) We then added public investment in intangibles to the
traditional CHS categories and education to arrive at investment in intangibles for the whole
economy. To our knowledge, no recent study has combined public spending in knowledge
and intangibles with measures for the commercial sector for the Netherlands.
Measuring intangible investment
As no formal statistical framework for the comprehensive measurement of intangibles exists,
we had to resolve a number of problems to obtain these estimates. They should therefore be
considered preliminary findings rather than definitive measurements.
Public R&D
De Haan and van Rooijen-Horsten (2004) and Tanriseven et al. (2008) emphasize that the
capitalization process (i.e., transforming expenditure into investments) aims at identifying the
part of R&D output that leads to the creation of a knowledge asset in the sense of the System
of National Accounts. But is a broader capital concept that includes knowledge capital
without any form of enforceable ownership rights desirable? For example, the government is
not necessarily the owner of the knowledge that it creates in the public domain, even when it
is financed and performed by the government. Thus, no ownership rights can be enforced
when the knowledge is made freely available. Tanriseven et al. (2008) discussed the
conflicting views in the literature about how R&D without enforceable ownership should be
treated. According to their 2008 report, proponents of the inclusion of R&D output without
enforceable ownership rights in the capital concept argue that the fact that the ownership
rights cannot be enforced does not change the asset nature of R&D. They draw a parallel to
roads and other public assets, which are also considered as an asset owned by the government
on behalf of the community even though the services are provided at no charge. Dissenters to
this idea point out that roads could be sold and still be still owned by the public sector. This
would not be possible for knowledge once it has been made freely accessible to the public.
11
There has been a great deal of debate whether or not public R&D should be regarded as
investment. Statistics Netherlands and others have argued that at least the pieces of public
R&D that are not used in the production process of the owner (e.g., agriculture-technology
research by universities that is not used in the production process of the government) should
not be capitalized.2 From this point of view, public R&D violates the definition of a fixed
asset—an asset that is used in the production process for more than one year and generates
benefits to its owner—used by the System of National Accounts. According to the EU R&D
Taskforce, however, all R&D should be capitalized except for market R&D used in the R&D
industry (that is, ISIC 73 in the 1993 classification). The latter is in all cases ―subcontracting‖
and is therefore intermediate consumption in the production of R&D. The relevant OECD
Manual (Handbook on Deriving Capital Measures of Intellectual Property Products) has also
adopted this view. This position has also been adopted by the ISWGNA (Intersecretariat
Working Group on National Accounts) and will therefore be included in the European System
of Accounts. In the near future, all EU countries (including the Netherlands) will capitalize all
R&D except for market-R&D used in the R&D industry.
We therefore deviate from CBS‘s definition and follow the new international guidelines
described above. We treat ―use of other R&D by general government‖ and ―government
consumption of non-market R&D‖ as public R&D and ―investment in R&D on own account
in all industries excluding public‖ and ―investment in other R&D in all industries excluding
public‖ as commercial sector R&D. We exclude R&D in the R&D industry (outsourced R&D
that is incorporated in other R&D – meant for sale to other industries than the R&D industry)
from our estimates.3
Overlap issues concerning R&D
1. Software with R&D Besides being a tool included in the total R&D expenditure, software
may also be the subject of R&D (software R&D). This overlap only arises when internally
produced software is taken into account. Expenditures for the development of internal
software may be substantial and have to be subtracted when investments in software are
2 For a detailed discussion, see CBS (2009).
3 R&D outsourced by the R&D industry to other industries is also included in our measure. Our output is not
only based on expenditure alone, as sales and purchases by industry are taken directly from the R&D survey.
R&D output in the R&D industry (including the outsourced R&D) is partly consumed by the general
government industry and partly used by other industries. Because both parts are capitalized, all R&D
investments are taken into account in the calculations.
12
estimated. Van Rooijen-Horsten et al. (2008a) emphasize that empirical evidence for the
Netherlands indicates a substantial overlap between R&D and computer software
development, and a double count in the gross fixed capital formation figures of the national
accounts may be caused through the capitalization of R&D output. Both the Dutch R&D
survey for enterprises and the survey for research institutes therefore included a question on
the percentage of total R&D labour input that is devoted to ICT (in full-time equivalents).4
This percentage is used to subtract software R&D from own-account R&D investment to
avoid double counting.
2. R&D with education There are two overlap issues between R&D and education according
to Croes (2000). First, training can be a spin-off or result of investment in R&D. R&D
employees are likely to experience training by finding solutions. As training is related to
many other activities in the creation of knowledge, it is linked to almost every intangible and
is hard to capture. The second and more important overlap arises because many R&D
expenditures are already included in public educational expenditure. In general, a correction
(subtracting R&D expenditures in higher education from total public expenditure) may lead to
an underestimation of total public educational expenditures. Nevertheless, Croes (2000) chose
to subtract higher education R&D for all countries (including the Netherlands), despite the
fact that this could lead to underestimation for investments in education.
For the purposes of this report, when we calculated educational expenditures for tertiary
education, we deducted the overlapping R&D expenditures by higher education institutions
from public expenditures on tertiary education.
Education
Economists assume that individuals choose the level of education resulting in the highest level
of lifetime wealth (e.g., leisure activities or earnings). Thus, education can be regarded as an
investment made early in life in order to maximize students‘ later standards of living and
quality of life. Students attending institutions of higher education derive a wide range of
monetary and nonmonetary benefits.5
4 This question was only included for a few years, the last time being 2001.
5 See, for example, Chen and Chevalier (2008), Fang (2006) and Harmon et al. (2003).
13
Our measure for investment in education only distinguishes between expenditure on primary,
secondary and tertiary education. In general, expenditure on education comprises all expenses
on labour (teachers and other personnel) and all intermediate consumption. For capital such as
buildings, only the consumption of fixed capital is taken into account. This is in accordance
with the SNA, which states that nonmarket production should be valued as the sum of labour
cost, intermediate consumption and consumption of fixed capital.6 Primary education includes
kindergartens and primary schools (i.e., everything until you are 12). Tertiary education
includes research universities and universities of professional education (HBOs). The
remainder of subsidized education (high schools and middle-level applied education (MBOs),
which represent intermediate vocational education) is classified as secondary education.
Results and comparison with estimates from Statistics Netherlands
In Table 2 , we present investment in intangible investment in the Dutch commercial sector,
public sector, and the total economy in 2000, 2004, 2006, and 2008 in million euros (current
prices). In Table 3 , we present the same estimates as a percentage of current-price GDP.
Appendix Table A.1 contains investment in intangibles in constant 2006 prices. These tables
show that public spending in intangibles is considerably lower than spending in the
commercial sector. In 2008, total intangible spending in the commercial sector amounted to
49,394 million euros and 34,763 million euros, which includes education in the public sector
(9,798 million euros excluding education). This is equal to 8.3 percent of GDP for
commercial intangibles in 2008 and 5.9 percent of GDP (1.7 percent excluding education) for
public intangible spending. With education taken into account, the Dutch economy invested a
total of 14.2 percent of GDP in intangibles in 2008 (without education, it is 10 percent). Due
to the different definition of the commercial sector and public R&D our results for spending
in the traditional CHS categories in the total economy are 0.7% higher compared to those of
Statistics Netherlands in 2008 (CBS, 2009).
Our estimates of R&D for the total economy (consisting of the commercial sector and the
public sector) are considerably higher compared to those created by CBS because of the
different treatment of public R&D. Statistics Netherlands regards only the ―use of other R&D
by the general government‖ as an investment in intangibles and so far has excluded
government consumption of non-market R&D that is produced by the R&D industry (general
6 From a growth accounting perspective, this means effectively that the discount rate is set to 0 percent.
14
government including universities).7 We deviate from the definition used by CBS and follow
the new international guidelines as described above. Thus, we treat 'use of other R&D by
general government' and government consumption as public R&D and 'investment in R&D on
own account in all industries excluding public' and 'investment in other R&D in all industries
excluding public' as commercial sector R&D. We also exclude market R&D in the R&D
industry (outsourced R&D that is incorporated in other R&D meant for sale to other industries
than the R&D industry) from our estimates.
The composition of intangible assets for the commercial sector, public sector and total
economy is also shown in Table 4 and Figures 1 and 2 .8 In both sectors, computerized
information is the smallest part of intangible investment. Its share of total investment has
continuously grown in the commercial sector since the mid-1990s, whereas computerized
information in the public sector has remained constant over the same period. The Dutch
private sector invested only 1.4 percent of GDP in computerized information in 2008.
Economic competency, at about 60 percent of total intangible investment and about 5 percent
of GDP, is the largest part of intangible investment in the commercial sector. As expected,
educational investment is dominant in the government sector, accounting for 72 percent of
total intangible investment in 2008 (4.2 percent of GDP) and followed by innovative property.
III. Growth accounting
In addition to providing an adequate measure of public and private intangible investment in
the Netherlands, another goal of this study is to measure the contribution of intangible
investment as a source of economic growth. Thus, we integrated the measures discussed
above into a growth accounting framework that provides a picture of how much factors of
production (such as labour and capital) contribute to economic growth, but hardly considers
intangible assets.9 As intangibles create output and increase in importance over time, they add
7 As discussed above, after a revision of their system, CBS will only exclude R&D purchases in the R&D
industry in the future. Thus, all R&D use in the general government industry, R&D use by universities and the
use of nonmarket R&D by the general government (now regarded as government consumption) will be
capitalized henceforth. 8 The development of computerized information, innovative property, economic competencies and education in
the total economy in constant 2006 prices between 1987 and 2008 is shown in Figure 3. 9 When using GDP as an output concept, the contribution of intermediates (such as energy, materials and service
inputs) are not accounted for. In many growth accounting studies, measures of labour input such as hours worked
or total employment are often adjusted for changes in average labour composition. The labour composition index

15
to GDP growth. In contrast, when ignoring intangible assets we usually overstate multifactor
productivity (MFP) growth and the contribution of tangible capital and labour composition to
GDP growth. Adding intangible assets usually decreases the contribution of MFP growth
because the contribution of intangible assets is no longer hidden in the MFP residual. Adding
intangible assets decreases the contribution of tangible capital and labour growth because
their compensation shares decrease.
Whereas an increasing number of studies focus on investment in intangible assets in the
private sector and its contribution to economic growth, the analysis of the impact of public
investment in innovation and knowledge on growth is still underdeveloped, including in the
Netherlands. In this study, we have made some adjustments to the standard growth accounting
model for the private sector to compute growth accounts for the total economy that comprise
the public sector.
There are several issues that have to be dealt with when growth accounts include the public
sector. For example, there are spillover effects from public investments on private economy
growth that are not internalized by private agents and, therefore, provide a growth bonus
beyond what is actually measured. On the other hand, the risk that public investment in
intangibles crowds out the possible effect of private investment (i.e., overstating the impact on
growth) should not be understated.
Sources, assumptions and methodology
To obtain measures for output and non-ICT inputs and separate the commercial sector from
the total economy, we used the EU KLEMS database (November 2009 release), which
provides value added, total hours worked and total labour compensation by industry from
1995 to 2007. To compute growth accounts up to 2008, we extrapolated the available time
series with information from the latest national accounts. As labour input series—in terms of
hours worked by high-, medium- and low-skilled labour and their compensation—were only
available until 2005 in the EU KLEMS March 2008 release. The missing observations for
2006–2008 were extrapolated accordingly.
in this study is constructed on the basis of weighted measures of different skill-level groupings in the labor force.
It is the weighted summation of the percentage of labor force in low, medium and high skill levels with relative
wages being weights for the three skill levels respectively (low-, medium- or high-skilled labor compensation as
a share in total labor compensation).
16
The data sources for investment and the stock of tangible assets is EU KLEMS from 1995 to
2007 and extrapolated figures for 2008. We measure two groups of tangible assets. ICT
tangible assets include computing equipment and communications equipment (software is
included with intangible assets). Non-ICT tangible assets include nonresidential buildings and
other tangible assets. We exclude residential structures because they are not used in
production. EU KLEMS also provides data on the investment and stock of software. The data
source of education for the total economy estimates is Statistics Netherlands (CBS).
A number of computational steps are needed to transform the data on intangible investments
into the capital stocks and capital service prices. We used a perpetual inventory method to
measure the stocks of intangible capital. This step involved adding each year‘s investment in
each type of intangible to the depreciated amount of the preceding year‘s capital stock. We
use a geometric depreciation pattern for all tangible and intangible assets, which is also the
common depreciation technique for the perpetual inventory method in the literature.
Table 5 shows the values of all of the depreciation rates applied. Relatively little is known
about depreciation for intangibles, so we followed the assumptions by CHS (2006, 2009) and
van Ark et al. (2009), which use an annual rate of 31.5 percent for computerized information,
60 percent for advertising and 40 percent for firm specific resources. Depreciation rates for
R&D capital are extensively discussed in the literature, where reported depreciation rates
range from 5 percent to 25 percent.10
A 15 percent depreciation rate for R&D is widely used
in the literature (Griliches, 2000; Mead, 2007). We deviated from CHS and van Ark et al.
(2009) by using a depreciation rate of 15 percent, instead of 20 percent, for R&D.
For each asset type, we create initial capital stocks in the beginning year, which, in our case,
is 1995, by cumulating investments over previous years. Given the relatively high
depreciation rates for intangibles, most of each investment is depreciated away within five
years, so it is sufficient to extrapolate the investment series back to 1990. Education is
depreciated over 40 years, so investment in primary, secondary and tertiary education had to
10 Estimates by Coe and Helpman (1995) and Coe et al. (2009) are at the lower end of 5 percent depreciation rate
for R&D, Nadiri and Prucha (1996) offer a figure of 12 percent, Bernstein and Mamuneas (2004) find a
depreciation rate for the United States of 18 percent and Pakes and Schankerman (1986) obtain a depreciation
rate for R&D of 25 percent.

17
be reconstructed back the 1950s to construct the educational capital stocks.11
In contrast to
other assets, we did not immediately depreciate the educational stock but considered the
average time between the investment and the time it pays off through providing capital
services. We assumed that primary education will pay off after 9 years and investment in a
12-year-old pupil will provide output to the labour market after approximately 5–12 years.
The gestation for secondary schooling is six years because a 16-18 year old will see
investment paid off after between 2 and 9 years. Investment in a 20-year-old student at the
tertiary level will pay off after about three years.
Primary, secondary and tertiary educational levels are weighted differently within the share
for human capital defined by van Ark and de Haan (2000). Primary, secondary and tertiary
educational levels are weighted at 1.0, 1.4 and 2.0, respectively, in line with evidence on
relative earning differentials. All factor shares for the total economy that include intangibles
add up to 1.33 and 1.12 for the commercial sector. Table 6 shows the factor shares for the
total economy and the average factor shares from 1988 to 2008 for the commercial sector.
The next step in our calculations was to compute the user cost of each asset type, including
intangibles. The user cost is made up of the rate of return, the depreciation rate and a capital
gains term. For the rate of return, we assumed the same rate for intangible capital as for
tangible capital, assuming that businesses arbitrage their investments across all types of
capital and invest in each type until the rate of return for all assets is equal (CHS 2009,
footnote 23, p. 677).12
The income accruing to each type of capital in each year was then
found by multiplying the quantity of stock by the corresponding user cost. Following this
step, the cost shares could then be calculated.
The resulting cost shares were used as weights for the commercial sector, for which we
assumed constant returns to scale. We applied weights based on the Mankiw, Romer and Weil
(MRW, 1992) approach, which includes the effect of education. However, in contrast to
11 A vintage depreciation pattern (slower in the beginning and faster later on) of education seems to be plausible
for education as old knowledge becomes less relevant and is compensated for by worker training. However, a
vintage depreciation pattern for education is technically difficult to combine with a geometric depreciation
profile. As we choose not to use two different depreciation models for one asset, we depreciated primary,
secondary and tertiary education geometrically (as for all other assets) over 40 years. 12
Of course the rates of returns can vary, depending on the risk. Since investment in R&D is riskier than
investment in tangible capital, the expected rate of return on R&D capital is higher than on tangible capital. We
have abstained from that additional complexity in the computations here.
18
MRW, who assigned a 1/3 share to human capital (excluding primary and secondary
education), the weight for human capital here is 4/9, which is supported by most of the
literature on human capital (Donselaar and Segers, 2006). We used 3/9 for physical capital
and 2/9 for raw labour. The weights for human capital and raw labour in our analysis summed
up to a total weight for labour composition per unit of labour quantity of 2/3 (4/9 + 2/9). The
subcategories of physical capital are proportionally adjusted according to the commercial
sector cost shares from 1988 to 2008, which added up to 1/3. The weights for the total
economy, including intangible capital, are derived by using the proportional shares between
labour composition, physical capital and intangible capital from the commercial sector.13
The
subcategories of physical capital and intangible capital were again proportionally adjusted
according to their cost shares from 1988 to 2008 so that they added up to the aggregate
weight.
The calculation of the impact of public investment (after adjustment for double counting) on
growth is more complicated. As we assumed that public investments will somehow create
spillovers for the economy as a whole (otherwise the government should not make these
investments), we had to move beyond the constant returns framework. Thus, we deviated
from constant returns to scale by adding additional growth effects derived from external
effects. These effects, also referred to as spillovers, reflect the societal value of investments
that are not directly captured by the investors, who are individuals investing in education or
businesses investing in intangible assets. The fraction that was used for R&D in the
commercial sector including intangibles was augmented by 0.12 as in the total economy to
allow for external effects. All of the literature shows a strong effect of domestic and foreign
R&D capital on productivity MFP growth. For example, the elasticities for domestic R&D
found in Coe and Helpman (1995) and Coe et al. (2009) are 0.08 and 0.10 (with 5 percent
depreciation), respectively. In the 1995 study, the effect was 0.11 (with 15 percent
depreciation). Guellec and Van Pottelsberghe (2001, 2004) found an elasticity for public
R&D (0.17) that is even higher than that for private R&D (0.13). In contrast, Donselaar and
Segers (2006) found private R&D elasticity higher (0.12) than public R&D elasticity (0.05)
because the latter is smaller in size.
13 The weights for the commercial sector including intangibles are shown in the last column of Table 6 .

19
The relationship between public and private R&D investment has also been discussed in the
economic growth and innovation literature. The primary concern is whether public R&D
spending is complementary and thus additional to private R&D spending or whether it is a
substitute that tends to crowd out private R&D. Among others, David et al. (2000) and David
and Hall (2000) argue that public funding of R&D can contribute indirectly by
complementing and thus stimulating private R&D expenditures, even if it has been
undertaken with other purposes in view. Public R&D expenditure may generate social
benefits in the form of knowledge and training spillovers that cause positive external effects
on the knowledge accumulation of the private sector. They enhance private sector productive
capabilities and promote R&D investments by firms that lead to technological innovations.
On the other hand, some authors have argued that public expenditure might have an adverse
effect on growth by ―crowding out‖ efficient and potentially profitable private investment.
Even though public investment is mostly assumed to have positive external effects, they
might also cause market failures (Almus and Czarnitzki, 2002). R&D projects that do not
cover the private cost might not be carried out even though they would have positive effects
to the society. The quantity of innovations may therefore remain below the socially desirable
level. When such projects are carried out, public funding is provided to reduce the price for
private investors. Even if a private investor could carry out an R&D project using his or her
own funds, he or she has an incentive to apply for public R&D support and, thereby, save
money. If public support is granted, then a firm might simply substitute public for private
investment.
For education, we assumed an external growth effect of 16 percent, which represents
spillovers that go beyond the internalized effects of higher wages that result from
improvements in labour composition and worker training effects that raise returns to investing
firms. The measure of 16 percent was derived from Bassanini and Scarpetta (2001, 2002) and
Arnold et al. (2007), which estimated standard growth regression using Pooled Mean Group
(PMG) estimators on OECD countries.14
14 Bassanini and Scarpetta (2001, 2002) estimate an elasticity of between 0.4–0.5 percent (consensus is 4/9 =
0.44) and Arnold et al. (2007) arrive higher elasticities of between 0.74 and 0.95 for the impact of human capital
(proxied by the average number of years of schooling) on economic growth in the long run. If we assume these
to be the externalities, the effect would be between 0.24 (0.74 − 0.5) and 0.45 (0.95 − 0.5). The average of the
latter is exactly 0.33. If we then deduct the effects from R&D mentioned above, which are 0.17 (0.05+0.12), we
end up with 0.16.
20
Results from growth accounting
We constructed growth accounts excluding and including intangibles for the commercial
sector and the total economy for the sub-periods 1995–2000, 2000–2005 and 2005–2008, as
well as for the longer time frames 1995–2005, 1995–2008 and 2000–2008. We also
demonstrated how the inclusion of intangibles affects the growth rate of GDP in the same
periods.15
Table 7 shows the contributions of labour, MFP and tangible and intangible capital to GDP
growth in the total economy, and Table 8 shows the contributions of these categories to the
commercial sector.16
The contribution of intangible capital was broken down in the
subcategories of software, innovative property, economic competencies and, for the total
economy, education. The contribution of R&D to GDP growth was differentiated into internal
effects and external effects.
The first observation from both tables is that the inclusion of intangibles in general has a
positive effect on GDP growth. From 1995 to 2008, the inclusion of intangible assets
increased the GDP growth rate for the total economy by 0.23 percentage points (from 2.75
percent to 2.9 percent in Table 7) and by 0.18 percentage points for the commercial sector
(from 3.07 percent to 3.25 percent in Table 8).17
Intangibles contributed 1.4 percentage points
to GDP growth in the total economy between 1995 and 2008, compared to 1.1 percentage
points in the commercial sector. The contribution to output growth was highest from 1995 to
2000, due to the large contribution of software capital, but diminished afterwards. The
contribution of intangibles was lower from 2000 to 2005. At the same time, multifactor
productivity growth slowed and, after accounting for intangibles, even turned slightly
negative for the total economy. During the 2005–2008 period, multifactor productivity (MFP)
15 Results for contributions to labour productivity growth are shown in Tables A3 and A4.
16 The following industries are included in our estimates for the commercial sector: Agriculture, hunting, forestry
and fishing; mining and quarrying; total manufacturing; electricity, gas and water supply; construction;
wholesale and retail trade; hotels and restaurants; transport and storage and communication; financial
intermediation; renting of M&EQ and other business activities; other community, social and personal services;
private households with employed persons; and extra-territorial organizations and bodies (industries AtB, C, D,
E, F, G, H, I, J, 71t74, O, P, Q). To be consistent with our estimates on intangible investment, the commercial
sector also comprises Health and Social Work (industry N). The Total Economy includes public administration
and defense, compulsory social security, education, health and social work (industries L, M, N) in addition to the
commercial sector. 17
The exception periods are 2000–2005 (for both the total economy and the commercial sector) and 2000–2008
(for the commercial sector only), during which growth of output was slower with intangibles than without. This
implies that intangible investment has contributed less to the level of output over the course of these sub-periods.

21
accelerated while the contribution of intangible investment stabilized. Although the
acceleration in MFP growth after 2005 may in part be related to a cyclical peak, as can be
observed from the strong acceleration in GDP growth, there may also have been positive
effects from intangible investment on MFP growth, even though such effects are not tested for
in this study (see Brynjolfsson and Saunders, 2009).
Figures 4 through 7 graphically present the results from Tables 7 and 8. In Figures 4 and 6,
we show the contribution of all contributors to GDP growth, whereas Figures 5 and 7 depict
the subdivision between the contribution from computerized information, innovative property,
economic competencies and education (for the total economy). The latter figures reveal that
private R&D has the highest impact on output growth within intangible capital.
Statistics Netherlands has made reference to the important contribution of intangibles to
output growth in all its publications, but generally found somewhat lower contributions from
intangibles (van Rooijen-Horsten et al., 2008; CBS, 2009). For example, according to CBS
studies, intangibles contributed 0.5 percentage points to consolidated output growth from
1996 to 2000 (1.8 percentage points in the present study, of which 0.7 percentage points refer
to external effects on R&D, which are by definition excluded from the CBS study) and only
0.15 percent for 2001–2005 (0.6 percentage points in the present study, of which 0.4
percentage points refer to external effects on R&D). However, just as in the current study, the
CBS studies exhibited a slowdown in the contribution of intangibles after 2000. The
intangible contributions are higher in our report because we include a spillover (external)
effect for private R&D, but we show a similar slowdown for the commercial sector after
2000. This slowdown in the contribution of intangibles, however, is not observed for the total
economy because the contribution of education has stabilized since 2005.
Van Rooijen-Horsten et al. (2008) found the largest contribution to consolidated output
growth stemmed from economic competencies and, more precisely, brand equity in 1996–
2000 and organizational structure in 2001–2005. However, if we include the external effects
from private R&D, as in this study, the contribution of intangibles to growth is dominated by
innovative property rather than economic competencies. It should be stressed that the
measurement of external effects is one of the more uncertain estimates in this study.

22
IV. Scenarios for future growth and implications
We have developed three different growth trajectories for the Netherlands (base, optimistic
and pessimistic), which are based on plausible assumptions on a range of indicators, including
the effect of demographic developments on labour markets and the number of students, the
growth rate in tangible and intangible investment and multifactor productivity growth. For our
scenario development, we left the growth rates for tangible investment and multifactor
productivity constant relative to those for the 2000–2008 period. The scenarios differ only in
the assumed growth rate of the intangible investments and their contributions to growth. The
base scenario examines ―unchanged policies towards intangible investments,‖ the two
optimistic scenarios analyze the effects of an ―accelerated investment in intangibles‖ case and
both pessimistic scenarios explore the impact of a ―constant investment level as in 2008.‖ All
five scenarios measure the effects on labour productivity growth and GDP growth for the
periods 2010–2015 and 2015–2020, as well as the average for 2010-2020.
The base scenario (Table 9 ) for the total economy essentially depicts ―business as usual.‖ It
is constructed based on the same growth accounting approach as above, using the 2000–2008
growth developments as the benchmark. For intangible capital, we assume that the growth
rate in real investment in intangibles per hour worked for 2000–2008 applies to the 2010–
2020 period.
We also assumed that total hours worked grow at the same rate as the labour force aged 15–65
until 2020 and that investments in tangible capital and labour composition and multifactor
productivity until 2020 will grow at the average annual growth rate of 2000–2008. The
projections for the labour force are derived from Statistics Netherlands (StatLine database).
We adjusted the rise in total expenditure on education for the slowdown in 15–24 year olds
relative to the decline in total population. To obtain our estimates of capital, we applied the
same depreciation rates and factor weights as for the growth accounts on a historical basis
(see Table 5 and columns 2 and 3 of Table 6 ).
In this scenario, public and private intangible investments will grow on average 2.8 percent
(11.6 billion euros, including education) and 1.8 percent (10.3 billion euros), respectively,
between 2010 and 2020, and the share of intangibles in total economy GDP will grow from

23
just below 15 percent in 2010 to 16.2 percent in 2020. Despite the slight increase in
intangibles, GDP growth in Table 9 slows somewhat for 2010–2020 (1.9 percent), compared
to 2.2 percent for 2000–2008. This is primarily the result of a decline in the growth of the
labour force and total working hours from 2010 to 2020. The growth contribution of
intangibles remains fairly stable—0.9 percentage points from 2010 to 2020 versus 1
percentage point from 2000 to 2008.
The upper and lower optimistic scenario (Tables 10 and 11 ) consider accelerated investment
in intangibles. Assumptions about tangible capital, labour composition and MFP remain the
same as in the base scenario, but are different for intangible capital. Both optimistic scenarios
raise the projected share of public intangible investments in GDP from the base scenario by 1
percent in 2020 (from 6.9 percent in the 2020 base scenario in to 7.9 percent). The two
scenarios differ with regard to their assumptions about how private investments will react to
the acceleration of public investment. The upper scenario assumes that intangible investment
in the commercial sector will grow at the same rate as the public sector until 2020, which will
lead to an output growth of approximately 2.1 percent from 2010 to 2020. The lower
optimistic scenario assumes only a 30 percent complementary effect from public investment
on all private intangible expenditures, which means that labour productivity growth will be
somewhat lower in the same period (1.9 percent). In the optimistic scenarios, intangibles
contribute around 50 percent of the growth of labour productivity.
The pessimistic scenarios assume that intangible expenditures (in constant prices) are kept
constant, which would result in a lower level of public intangible investments (13.9 billion
euros) or 1.8 percent lower public intangible investments as a percentage of GDP relative to
the base scenario in 2020. The upper pessimistic scenario in Table 12 assumes that only
public expenditures are held constant and that it will work through the private expenditures by
reducing them 30 percent. For the lower pessimistic scenario in Table 13 , we assume that all
expenditures (public and private) are being held constant. Just as for the optimistic scenarios,
the contributions of tangible capital, labour composition and multifactor productivity remain
unchanged. In the upper negative scenario, the growth rate of GDP is 0.2 percentage points
lower than the base scenario, and the contribution of intangibles declines from 0.9 percentage
points in the base scenario to 0.7 percentage points. However, the effect of the lower
pessimistic scenario on labour productivity growth is quite large, leading GDP growth to slow
24
down from 2.2 percent from 2000 to 2008 to 1.5 percent from 2010 to 2020. The contribution
of intangible capital to labour productivity growth also falls to an average of 0.5 percentage
points between 2010 and 2020.
Figure 8 illustrates the contribution of labour, MFP and physical and intangible capital for all
scenarios in the 2010-2020 period. The scenarios differ only in the contribution of education
and intangibles; the contributions of tangible capital, labour composition and multifactor
productivity remain unchanged for the positive and negative scenarios compared to the base
scenario. Figure 8 shows how the contribution of intangibles gradually decreases from the
upper optimistic scenario (1.1 percentage points) to the lower pessimistic scenario (0.5
percentage points).
Figure 9 projects future GDP in constant 2006 prices until 2020 based on the growth rates of
GDP from 2010 to 2020 in the five scenarios. Depending on the choice of the future growth
trajectory, GDP in 2020 could amount to 688 billion euros in the base scenario, 693 or 703
billion euros in the positive cases, and 664 or 675 billion euros in the worst case scenarios,
compared to 572 billion euros in 2008 (all in 2006 constant prices). Table 14 illustrates the
implications of the base, optimistic and pessimistic scenarios for output gains and losses in
constant 2006 prices. Comparing the optimistic scenarios with the base scenario, the output
gains amount to 15.5 billion euros for the upper optimistic scenario and 5.5 billion euros for
the lower optimistic scenario in 2020. This compares with a loss of 13 billion euros for the
upper pessimistic scenario and 23.6 billion euros for the lower.
We also calculated a very tentative scenario for the 2010–2050 period in order to take account
of the long-run effects of the higher investments in education. A rise in education expenditure
would both generate an increase in labor composition in the long term and increase the
external effects from education. Keeping other investments and other factors constant in the
same way we did for the medium-term scenarios for 2010–2020, we find an increase in the
annual average growth of GDP of 1.6 percent, with a contribution of education of 0.37
percentage points and of labor composition of 0.38 percentage points (Table 15). GDP growth
from 2010 to 2050 slows to 1.6 percent, as labor growth (hours worked) declines faster after
2020, but the contribution of intangibles stays about the same, so the intensity of intangibles
25
actually increases. Of course, this long-term scenario is very uncertain and dependent on
many more factors than the growth rate of the labour force and the rise in intangibles.
V. Conclusions
This study is concerned with the contribution of innovation and knowledge to past, current
and future growth. We measured how much the commercial sector and the total economy in
the Netherlands invested in intangible assets up to 2008. Total spending in intangibles
amounted to 84.2 billion euro in 2008, which equals 14.2 percent of GDP. For the same
period, the commercial sector amounted to 49 billion euros (8.3 percent of GDP) and the
public sector amounted to 35 billion euros (5.9 percent of GDP), including education (which
accounts for 25 billion euros).
Economic competency, at about 60 percent of total intangible investment, is the largest part of
intangible investment in the commercial sector and about 5 percent of GDP. Computerized
information is the smallest part of intangible investment (1.4 percent of GDP), and innovative
property accounts for slightly more (1.7 percent of GDP). In the public sector, innovative
property (0.8 percent of GDP) was relatively more important than two other categories
(computerized information and economic competencies), but educational investment is
obviously the dominant source of intangible investment. The latter accounted for 72 percent
of total intangible investment in the governmental sector in 2008 (4.2 percent of GDP).
Using the growth accounting methodology, we computed the contributions of labour, physical
capital and intangible capital to economic growth in the Dutch commercial sector and total
economy. The inclusion of intangibles in general has a positive effect on GDP growth.
Intangibles contributed 1.4 percentage points to GDP growth for the total economy between
1995 and 2008, compared to 1.1 percentage points in the commercial sector. The growth
contribution of intangibles was highest from 1995 to 2000, which was followed by a decline
and then a slight increase again in 2005.
In addition to the aggregate contributions of intangibles and knowledge to growth, we have
also demonstrated the growth contributions of the individual components of intangible capital
and different segments of the economy. With regard to public intangibles, education and

26
public R&D (including internal and external effects) account for approximately one-third of
the contribution of all intangible investment to growth, whereas commercial sector intangibles
account for the rest. Within the commercial sector, the largest contributions come from
investment in economic competencies, including workforce training, organizational
innovation and marketing and branding.
Finally, we developed three scenarios for future growth based on plausible assumptions about
the growth pattern of the latter contributors and its implications for government expenditures
until 2020. We differentiate between a ―business-as-usual‖ base scenario, two optimistic
scenarios (―accelerated investment in intangibles‖) and two pessimistic scenarios (―stagnating
investment in intangibles‖). According to the base scenario, GDP growth slows somewhat
from 2010 to 2020 (just below 1.9 percent) compared to 2000-2008 (2.2 percent), as the
contribution of labour input to growth declines. The intensity of intangibles and other capital
per unit of labour, however, slightly increases. A 1 percent higher investment in public
intangibles as a percentage of GDP compared to the base scenario until 2020 leads to a GDP
growth rate of approximately 2.1 percent from 2010 to 2020 in the upper optimistic scenario
and a 1.9 percent growth rate in the lower optimistic scenario ( i.e., a positive effect of about
0.1 to 0.2 percent growth in GDP per year). On the other side of the spectrum, the effect of the
pessimistic scenarios on GDP growth is quite large. A stalling in the growth of intangibles
below the current growth rate could lower GDP growth by almost 0.4 percent from 2010 to
2020, relative to the base scenario. In order to take account of the long-run effects of the
higher investments in education, we also calculated a long-run base scenario for the 2010–
2050 period. While the results of such long term scenarios should be interpreted as very
tentative, it suggest that GDP growth is likely to slow as labor growth (hours worked) will
continue to decline after 2020. Meanwhile, the contribution of intangibles to growth will only
strengthen further to 0.9 percentage point ouf of the projected 1.6 annual average growth in
GDP from 2010-2050.
These results imply that an accelerated investment in public intangibles (of up to 7 billion
euros extra annually by 2020) can generate significant additional GDP—up to an additional
benefit of 15.5 billion euros or 2.2 percent of the GDP level—by 2020. In other words, an
extra euro invested in public intangible capital, can add three times as many euros in GDP.
However, much will depend on the willingness and the ability of the commercial sector to
27
match public intangible euros. If the private sector only raises its intangibles investment by 30
percent of the government‘s increase, the effect would be much smaller and each additional
euro of intangible in 2020 would only raise GDP by about the same amount. Keeping public
intangible investment constant in real terms could have a devastating impact on GDP, creating
a loss of between 13 billion to more than 24 billion euros by 2020, and take off as much as 3.6
percent of the GDP level.
Investment in intangibles, therefore, is a key part of keeping the growth of the Dutch economy
on track, and a slowdown in or ceasing of the creation of intangible capital would seriously
affect economic stability. An accelerated investment in public intangibles, notably education
and public R&D, by 7 billion euro per year by 2020 could raise GDP growth permanently,
provided the commercial sector is able and willing to step up their investments to the same
degree. While investment in public intangibles is an important factor in raising the potential
for faster growth, the overall business environment will determine if the commercial sector is
able to strengthen and exploit their own capabilities in this field to realize this potential.

28
References
Almus, Matthias, and Dirk Czarnitzki (2002): The Effects of Public R&D Subsidies on Firms‘
Innovation Activities: The Case of Eastern Germany, ZEW Discussion Paper No. 01-10.
Arnold, Jens, Andrea, Bassanini, and Stefano Scarpetta (2007), Solow or Lucas? Testing
growth models using panel data from OECD countries, OECD, Economics Department
Working Papers, no. 592.
Bassanini, Andrea and Stefano Scarpetta (2001): Does human capital matter for growth in
OECD countries? Evidence from pooled mean-group estimates, OECD, Economics
Department Working Papers, no. 282.
Bassanini, Andrea and Stefano Scarpetta (2002): Does human capital matter for growth in
OECD countries? A pooled mean-group approach, Economics Letters, 74(3), 399-405.
Bernstein, Jeffrey, I. and Theofanis P. Mamuneas (2004), ―R&D Depreciation, Stocks, User
Costs and Productivity Growth for U.S. Knowledge Intensive Industries,‖ mimeo,
Carleton University.
Brynjolfsson, Erik and Adam Saunders (2009): Wired for Innovation: How Information
Technology is Reshaping the Economy, MIT Press, Mass.
CBS (2009): De Nederlandse groeirekeningen 2008. Centraal Bureau voor de Statistiek.
Chen, M. Keith, and Judith A. Chevalier (2008): The taste for leisure, career choice, and the
returns to education, Economics Letters 99 (2008), 353–356.
Coe, David Theodore and Elhanan Helpman (1995): International R&D spillovers, European
Economic Review, 39(5), 859-887.
Coe, David Theodore, Elhanan Helpman and Alexander W. Hoffmaister (2009): International
R&D spillovers and institutions, European Economic Review, 53(7), 723-741.
Corrado, Carol, Charles Hulten, and Daniel Sichel (2005): Measuring Capital and
Technology: An Expanded Framework. In Measuring Capital in the New Economy, C.
Corrado, J. Haltiwanger, and D. Sichel, eds., Studies in Income and Wealth, Vol. 65.
Chicago: The University of Chicago Press, 2005, 11-41.
Corrado, Carol, Charles Hulten, and Daniel Sichel (2006): Intangible Capital and Economic
Growth, National Bureau of Economic Research Working Paper 11948, January 2006.
Corrado, Carol, Charles Hulten and Daniel Sichel (2009): Intangible Capital and US
Economic Growth. The Review of Income and Wealth, vol. 55 (3), 661-685.
Croes, M. M. (2000): Data for intangibles in selected OECD countries, Report for project
commissioned by OECD and the Dutch Ministry of Economic Affairs by Statistics
Netherlands, December 2000.
David, Paul A., and Bronwyn H. Hall (2000): Heart of Darkness: Modeling Public-Private
Funding Interactions Inside the R&D Black Box, Research Policy 29, 1165–83.
David, Paul A., Bronwyn H. Hall, and Andrew A. Toole (2000): Is Public R&D a
Complement or Substitute for Private R&D? A Review of the Econometric Evidence,
Research Policy, 29, 497- 529.
De Haan, Mark, and Myriam van Rooijen-Horsten (2004): Measuring R&D output and
knowledge capital formation in open economies. Paper prepared for the 28th general
29
conference of the International Association for Research on Income and Wealth, Cork,
Ireland, August 22-28, 2004 (discussion paper, CBS internet, nr. 04009).
Donselaar, Piet and Jeroen Segers (2006): Determinanten van R&D, innovatiekracht en
arbeidsproductiviteit. Een panelanalyse voor 20 OECD-landen over de periode 1971-
2001, Ministerie van Economische Zaken, Onderzoeksreeks (publicatienummer 06OI19),
Den Haag.
Fang, Hanming (2006): Disentangling the college wage premium: estimating a model with
endogenous education choices, International Economic Review 47 (4), 1151–1185.
Griliches, Zvi (2000): R&D, Education, and Productivity. A Retrospective, Harvard
University Press, Cambridge (MA)/London.
Guellec, Dominique and Bruno van Pottelsberghe de la Potterie (2001): R&D and
productivity growth: Panel data analysis of 16 OECD countries, OECD Science,
Technology and Industry Working Paper 2001/3.
Guellec, Dominique and Bruno van Pottelsberghe de la Potterie (2004): From R&D to
productivity growth: Do the institutional settings and the source of funds of R&D matter?,
Oxford Bulletin of Economics and Statistics, vol. 66, no. 3, 353–376
Hall, Bronwyn (1999): Innovation and Market Value, NBER Working paper No. 6984.
National Bureau of Economic Research.
Hao, Janet X., Vlad Manole, and Bart van Ark (2009): Intangible Capital and Economic
Growth – an International Comparison, August.
Harmon, Colm P., Hessel Oosterbeek, and Ian Walker (2003): The Returns to Education:
Microeconomics, Journal of Economic Surveys, Vol. 17, 115-156.
Howitt, Peter (1996): ―On Some Problems in Measuring Knowledge-Based Growth.‖ In The
Implications of Knowledge-Based Growth for Micro-Economic Policies, ed. P. Howitt.
Calgary: University of Calgary Press.
Hulten, Charles R. (2008): Accounting for the Knowledge Economy. The Conference Board
Economics Program Working Paper No. 08-13.
Khan, M. (2001): Investment in Knowledge. STI Review #27. Paris: OECD.
Lev, Baruch (2001): Intangibles: Management, Measurement and Reporting. Washington:
Brookings Institution.
Mankiw, N. Gregory, David Romer, and David N. Weil (1992): A Contribution to the
Empirics of Economic Growth, Quarterly Journal of Economics, 152, 407–437.
Marrano, Mauor Giorgio, Jonathan Haskel, and Gavin Wallis (2007): What Happened to the
Knowledge Economy? ICT, Intangible Investment and Britain‘s Productivity Record
Revisited. Working paper no. 603. Queen Mary University of London, June.
Marrano, Mauro Giorgo, Jonathan Haskel and Gavin Wallis (2009): What happened to the
knowledge economy? ICT, intangible investment and Britain‘s productivity record
revisited. The Review of Income and Wealth, vol. 55 (3), 686-716.
Mead, Charles Ian (2007): R&D depreciation rates in the 2007 R&D Satellite Account,
Bureau of Economic Analysis/National Science Foundation 2007 R&D Satellite Account
Background Paper, Bureau of Economic Analysis, Washington;
http://www.bea.gov/papers/pdf/Mead_RD_Paper_wp.pdf.

30
Minne, Bert (1995): Onderzoek, ontwikkeling en andere immateriële investeringen in
Nederland, CPB Research Memorandum, No. 116, The Hague.
Nadiri, M. Ishaq, and I. R. Prucha (1996): Estimation of the Depreciation Rate of Physical
and R&D Capital in the U.S. Total Manufacturing Sector. Economic Inquiry 34, 43-56.
OECD (2010): Handbook on deriving capital measures of intellectual property products,
OECD Publishing: Paris.
Pakes, Ariel, and Mark A. Shankerman (1986): Estimates of the Value of Patent Rights in
European Countries During the Post-1950 Period, The Economic Journal 96, 1052-1076.
Tanriseven, Murat, Dirk van den Bergen, Myriam van Rooijen-Horsten, and Mark de Haan
(2008): Research and development statistics. R&D capitalisation in the knowledge
module, Working paper, Statistics Netherlands, Voorburg/Heerlen, 2008.
Van Ark, Bart and Jakob de Haan (2000): Productivity, Income and Technological Change in
the Netherlands: Causes and Explanations of Divergent Trends, in B. van Ark, S.K.
Kuipers and G. Kuper, eds. (2000), Productivity, Technology and Economic Growth,
Kluwer Academic Press, 159-186.
Van Ark, Bart, Janet X. Hao, Carol Corrado and Charles Hulten (2009): Measuring Intangible
Capital and Its Contribution to Economic Growth in Europe, paper presented at the
Conference on "R&D and the financing of innovation in Europe" European Investment
Bank, Luxembourg 22 October 2009.
Van Rooijen-Horsten, Myriam, Dirk van den Bergen, and Murat Tanriseven (2008a):
Intangible Capital in the Netherlands: A Benchmark. Discussion paper 08001, Statistics
Netherlands, Voorburg/Heerlen.
Van Rooijen-Horsten, Myriam, Dirk van den Bergen, Mark de Haan, Angelique Klinkers, and
Murat Tanriseven (2008b): Intangible Capital in the Netherlands: Measurement and
contribution to Economic Growth, Discussion paper 08016, Statistics Netherlands,
Voorburg/Heerlen.

31
Tables and Figures
Table 1: Intangible Investment in the Market Sector in 2006 (as Percentage of GDP)
Type of Investment
DE FR IT ES UK US AT CZ DK GR SK NL
2006 2006 2006 2006 2006 2006 2006 2006 2006 2006 2006 2006
1. Computerized information 0.73 1.42 0.64 0.79 1.55 1.61 0.89 0.71 1.87 0.34 0.37 1.4
a) Software 0.71 1.37 0.63 0.76 0.00 0.85 0.71 1.85 0.33 0.37
b) Databases 0.02 0.05 0.01 0.03 0.00 0.04 0.01 0.03 0.01 0
2. Innovative property 3.59 3.18 2.21 2.78 3.16 4.37 3.14 2.8 3.06 0.62 1.76 1.9
a) R&D* 1.72 1.3 0.58 0.63 1.07
1.74 1.03 1.68 0.18 0.21 1.0
b) Mineral expl. and evaluation 0.01 0.04 0.09 0.04 0.04 2.25 - - - - - 0.0
c) Copyright and license costs 0.21 0.31 0.1 0.18 0.22
0.1 0.04 0.16 0.02 0.04
d) Dev. costs in financial ind. 0.75 0.6 0.58 0.52 0.07 2.12 0.63 0.55 0.54 0.16 0.37 0.9
e) New arch. and engin. designs 0.9 0.93 0.86 1.41 1.74 0.66 1.18 0.69 0.27 1.15
3. Economic competencies 2.84 3.3 2.19 1.9 5.84 5.50 2.42 2.93 2.93 0.63 2.39 5.7
a) Brand equity 0.56 0.99 0.71 0.42 1.15 1.47 0.25 1.37 0.63 0.15 1.04 2.2
Advertising expenditure 0.41 0.73 0.47 0.19 0.91 0.15 0.94 0.36 0.08 0.46
Market research 0.15 0.26 0.24 0.23 0.24 0.11 0.43 0.27 0.06 0.59
b) Firm-specific HC 1.29 1.51 1.02 0.81 2.54
0.79 0.63 1.49 0.19 0.51 1.1
Continuing voc. training 0.65 1.25 0.71 0.71 0.46 0.63 1.07 0.17 0.51
Apprentice training 0.64 0.26 0.32 0.1 4.03 0.33 0 0.42 0.02 0
c) Organizational structure 1 0.81 0.45 0.68 2.14 1.38 0.93 0.81 0.29 0.83 2.4
Purchased 0.54 0.32 0.15 0.27 0.51 0.93 0.26 0.45 0.06 0.25
Own account 0.46 0.49 0.3 0.41 1.63 0.44 0.67 0.36 0.23 0.58
Total Investment 7.16 7.9 5.04 5.47 10.54 11.48 6.46 6.45 7.86 1.59 4.53 9.1
pro memoria
Total Spending 7.55 8.51 5.43 5.70 11.56 6.67 7.24 8.19 1.70 4.98
Sources: van Ark et al. (2009) and CBS (2009). Note: *R&D includes social sciences and the humanities.

32
Table 2: Intangible Investment - Million euros (Current Prices)
Commercial Sector Public Sector Total Economy
2000 2004 2006 2008* 2000 2004 2006 2008* 2000 2004 2006 2008*
Computerized information 5,526 5,730 6,724 8,319 600 714 986 1,220 6,126 6,444 7,710 9,539
Software and Databases 5,526 5,730 6,724 8,319 600 714 986 1,220 6,126 6,444 7,710 9,539
Innovative property 7,519 8,237 9,503 10,144 3,426 4,093 4,620 4,932 10,945 12,330 14,123 15,076
a) R&D including social science and humanities 4,239 5,021 5,203 5,571 2,804 3,369 3,823 4,094 7,043 8,390 9,026 9,664
R&D in the financial industry 361 326 407 436
361 326 407 436
b) Mineral exploration and evaluation 208 195 250 210
208 195 250 210
c) Other innovative property 3,072 3,021 4,050 4,347 622 724 797 855 3,694 3,745 4,846 5,202
Copyright and license costs 847 731 1,373 1,219
847 731 1,373 1,219
New architectural and engineering designs 2,225 2,290 2,677 3,070 622 724 797 914 2,847 3,014 3,473 3,983
Economic competencies 24,350 26,637 27,659 30,931 2,634 2,771 3,261 3,646 26,984 29,408 30,920 34,577
a) Brand equity 10,694 11,473 11,993 13,116 110 140 154 168 10,804 11,614 12,147 13,284
Advertising expenditure 9,666 10,334 10,858 11,825 60 75 88 96 9,726 10,410 10,946 11,920
Market research 1,028 1,139 1,136 1,289 50 65 66 74 1,078 1,204 1,201 1,363
b) Firm-specific human capital 3,454 4,043 3,882 4,397 1,712 1,672 2,141 2,425 5,166 5,715 6,024 6,823
Direct firm expenses 1,679 1,897 1,797 2,035 631 619 781 884 2,310 2,516 2,577 2,919
Wage and salary costs of employee time 1,775 2,146 2,086 2,362 1,081 1,053 1,361 1,541 2,856 3,199 3,447 3,904
c) Organizational structure 10,201 11,121 11,783 13,375 812 959 966 1,096 11,014 12,080 12,749 14,471
Purchased 5,237 6,041 7,041 7,992 255 344 407 462 5,492 6,385 7,448 8,454
Own account 4,964 5,080 4,742 5,383 557 615 559 634 5,521 5,695 5,301 6,017
Total - CHS categories 37,395 40,604 43,886 49,394 6,660 7,578 8,867 9,798 44,055 48,182 52,752 59,192
Education
16,238 20,929 22,418 24,965 16,238 20,929 22,418 24,965
Primary / Secondary
13,631 17,723 18,984 21,046 13,631 17,723 18,984 21,046
Tertiary
2,607 3,206 3,434 3,919 2,607 3,206 3,434 3,919
Total 37,395 40,604 43,886 49,394 22,898 28,507 31,285 34,763 60,293 69,111 75,170 84,157
Notes: * Preliminary results for 2007 and 2008, which include an approximation of the commercial and public sectors according to shares of total economy in 2006. Commercial sector also includes other industries and health care Data source: Statistics Netherlands.
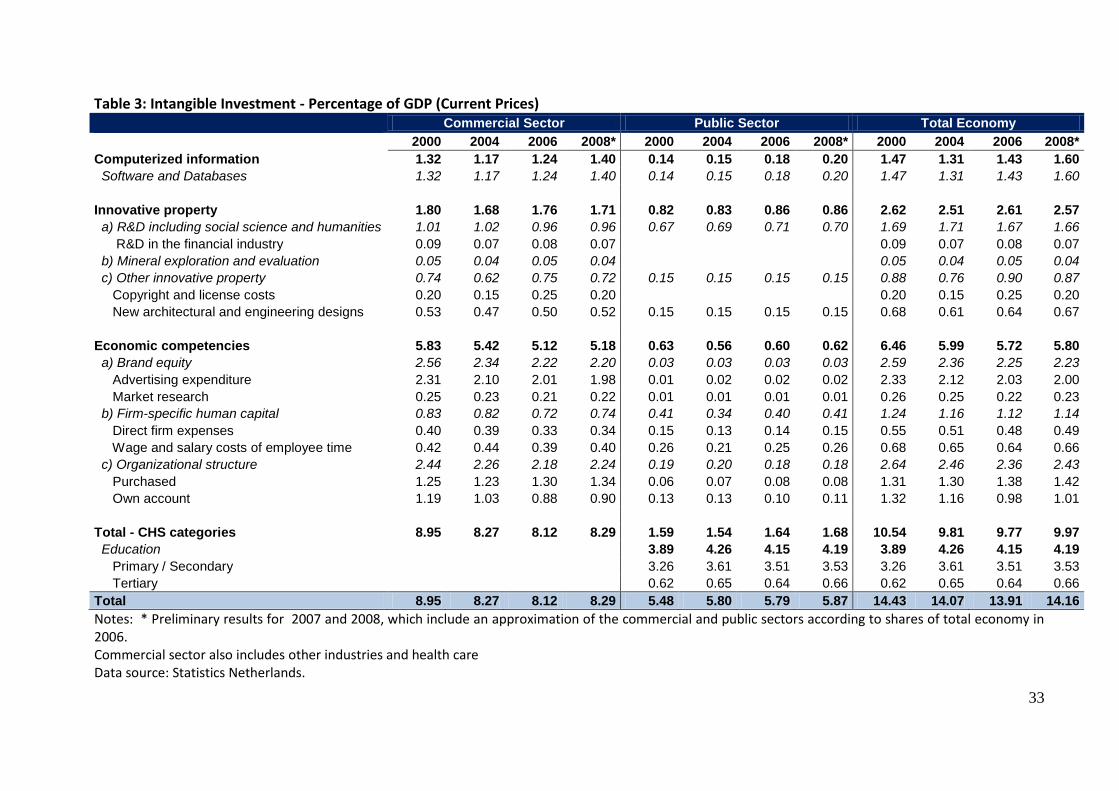
33
Table 3: Intangible Investment - Percentage of GDP (Current Prices)
Commercial Sector Public Sector Total Economy
2000 2004 2006 2008* 2000 2004 2006 2008* 2000 2004 2006 2008*
Computerized information 1.32 1.17 1.24 1.40 0.14 0.15 0.18 0.20 1.47 1.31 1.43 1.60
Software and Databases 1.32 1.17 1.24 1.40 0.14 0.15 0.18 0.20 1.47 1.31 1.43 1.60
Innovative property 1.80 1.68 1.76 1.71 0.82 0.83 0.86 0.86 2.62 2.51 2.61 2.57
a) R&D including social science and humanities 1.01 1.02 0.96 0.96 0.67 0.69 0.71 0.70 1.69 1.71 1.67 1.66
R&D in the financial industry 0.09 0.07 0.08 0.07
0.09 0.07 0.08 0.07
b) Mineral exploration and evaluation 0.05 0.04 0.05 0.04
0.05 0.04 0.05 0.04
c) Other innovative property 0.74 0.62 0.75 0.72 0.15 0.15 0.15 0.15 0.88 0.76 0.90 0.87
Copyright and license costs 0.20 0.15 0.25 0.20
0.20 0.15 0.25 0.20
New architectural and engineering designs 0.53 0.47 0.50 0.52 0.15 0.15 0.15 0.15 0.68 0.61 0.64 0.67
Economic competencies 5.83 5.42 5.12 5.18 0.63 0.56 0.60 0.62 6.46 5.99 5.72 5.80
a) Brand equity 2.56 2.34 2.22 2.20 0.03 0.03 0.03 0.03 2.59 2.36 2.25 2.23
Advertising expenditure 2.31 2.10 2.01 1.98 0.01 0.02 0.02 0.02 2.33 2.12 2.03 2.00
Market research 0.25 0.23 0.21 0.22 0.01 0.01 0.01 0.01 0.26 0.25 0.22 0.23
b) Firm-specific human capital 0.83 0.82 0.72 0.74 0.41 0.34 0.40 0.41 1.24 1.16 1.12 1.14
Direct firm expenses 0.40 0.39 0.33 0.34 0.15 0.13 0.14 0.15 0.55 0.51 0.48 0.49
Wage and salary costs of employee time 0.42 0.44 0.39 0.40 0.26 0.21 0.25 0.26 0.68 0.65 0.64 0.66
c) Organizational structure 2.44 2.26 2.18 2.24 0.19 0.20 0.18 0.18 2.64 2.46 2.36 2.43
Purchased 1.25 1.23 1.30 1.34 0.06 0.07 0.08 0.08 1.31 1.30 1.38 1.42
Own account 1.19 1.03 0.88 0.90 0.13 0.13 0.10 0.11 1.32 1.16 0.98 1.01
Total - CHS categories 8.95 8.27 8.12 8.29 1.59 1.54 1.64 1.68 10.54 9.81 9.77 9.97
Education
3.89 4.26 4.15 4.19 3.89 4.26 4.15 4.19
Primary / Secondary
3.26 3.61 3.51 3.53 3.26 3.61 3.51 3.53
Tertiary
0.62 0.65 0.64 0.66 0.62 0.65 0.64 0.66
Total 8.95 8.27 8.12 8.29 5.48 5.80 5.79 5.87 14.43 14.07 13.91 14.16
Notes: * Preliminary results for 2007 and 2008, which include an approximation of the commercial and public sectors according to shares of total economy in 2006. Commercial sector also includes other industries and health care Data source: Statistics Netherlands.
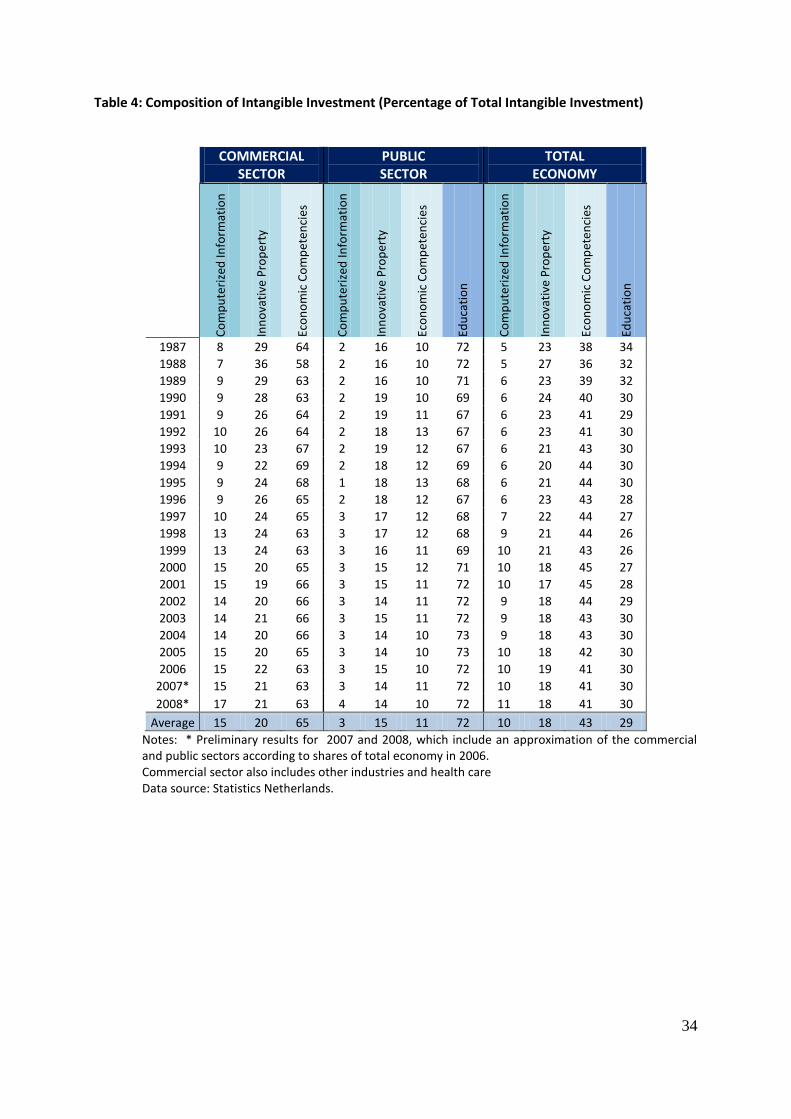
34
Table 4: Composition of Intangible Investment (Percentage of Total Intangible Investment)
COMMERCIAL SECTOR
PUBLIC SECTOR
TOTAL ECONOMY
Co
mp
ute
rize
d In
form
atio
n
Inn
ova
tive
Pro
per
ty
Eco
no
mic
Co
mp
eten
cies
Co
mp
ute
rize
d In
form
atio
n
Inn
ova
tive
Pro
per
ty
Eco
no
mic
Co
mp
eten
cies
Edu
cati
on
Co
mp
ute
rize
d In
form
atio
n
Inn
ova
tive
Pro
per
ty
Eco
no
mic
Co
mp
eten
cies
Edu
cati
on
1987 8 29 64 2 16 10 72 5 23 38 34
1988 7 36 58 2 16 10 72 5 27 36 32
1989 9 29 63 2 16 10 71 6 23 39 32
1990 9 28 63 2 19 10 69 6 24 40 30
1991 9 26 64 2 19 11 67 6 23 41 29
1992 10 26 64 2 18 13 67 6 23 41 30
1993 10 23 67 2 19 12 67 6 21 43 30
1994 9 22 69 2 18 12 69 6 20 44 30
1995 9 24 68 1 18 13 68 6 21 44 30
1996 9 26 65 2 18 12 67 6 23 43 28
1997 10 24 65 3 17 12 68 7 22 44 27
1998 13 24 63 3 17 12 68 9 21 44 26
1999 13 24 63 3 16 11 69 10 21 43 26
2000 15 20 65 3 15 12 71 10 18 45 27
2001 15 19 66 3 15 11 72 10 17 45 28
2002 14 20 66 3 14 11 72 9 18 44 29
2003 14 21 66 3 15 11 72 9 18 43 30
2004 14 20 66 3 14 10 73 9 18 43 30
2005 15 20 65 3 14 10 73 10 18 42 30
2006 15 22 63 3 15 10 72 10 19 41 30
2007* 15 21 63 3 14 11 72 10 18 41 30
2008* 17 21 63 4 14 10 72 11 18 41 30
Average 15 20 65 3 15 11 72 10 18 43 29
Notes: * Preliminary results for 2007 and 2008, which include an approximation of the commercial and public sectors according to shares of total economy in 2006. Commercial sector also includes other industries and health care Data source: Statistics Netherlands.

35
Table 5: Depreciation Rates for Growth Accounting
Asset Depreciation Rate
Intangible Assets Software and databases 0.315 R&D 0.15 Copyright and license costs Development costs in financial industry New architectural and engineering designs
0.2 0.2 0.2
Advertising expenditure Market research Firm-specific human capital Organizational structure
0.6 0.6 0.4 0.4
Primary education Secondary education
0.025 0.025
Tertiary education 0.025
Tangible Assets Computing equipment (IT) Communications equipment (CT) Transport equipment (TraEq) Other machinery and equipment (OMach) Non-resident structures (OCon) Other assets. (Other)
0.315 0.115 0.185 0.123 0.032 0.123
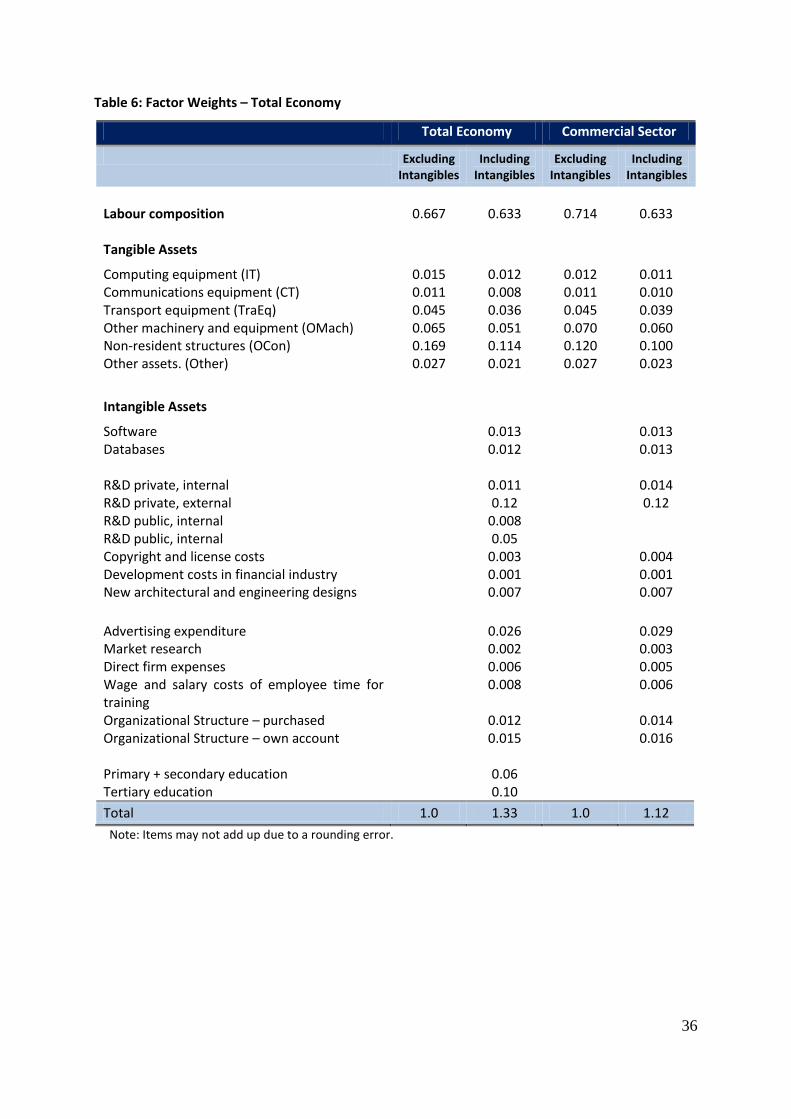
36
Table 6: Factor Weights – Total Economy
Total Economy Commercial Sector
Excluding Intangibles
Including Intangibles
Excluding Intangibles
Including Intangibles
Labour composition
0.667
0.633
0.714
0.633
Tangible Assets
Computing equipment (IT) Communications equipment (CT) Transport equipment (TraEq) Other machinery and equipment (OMach) Non-resident structures (OCon) Other assets. (Other)
0.015 0.011 0.045 0.065 0.169 0.027
0.012 0.008 0.036 0.051 0.114 0.021
0.012 0.011 0.045 0.070 0.120 0.027
0.011 0.010 0.039 0.060 0.100 0.023
Intangible Assets
Software Databases
0.013 0.012
0.013 0.013
R&D private, internal R&D private, external R&D public, internal R&D public, internal
0.011 0.12
0.008 0.05
0.014 0.12
Copyright and license costs Development costs in financial industry New architectural and engineering designs
0.003 0.001 0.007
0.004 0.001 0.007
Advertising expenditure Market research Direct firm expenses Wage and salary costs of employee time for training Organizational Structure – purchased Organizational Structure – own account
0.026 0.002 0.006 0.008
0.012 0.015
0.029 0.003 0.005 0.006
0.014 0.016
Primary + secondary education Tertiary education
0.06 0.10
Total 1.0 1.33 1.0 1.12
Note: Items may not add up due to a rounding error.

37
Table 7: Growth Accounting – Total Economy
1995-2000 2000-2005 2005-2008 1995-2005 1995-2008 2000-2008
Excluding Intangible Capital
GDP growth (excl. software and education) 3.79 1.39 3.31 2.59 2.75 2.11
Hours growth 2.35 -0.31 1.74 1.01 1.18 0.45
Labour Productivity growth 1.49 1.67 1.62 1.58 1.59 1.65
Contributions to GDP growth
ICT Capital (excl. software) 0.54 0.27 0.25 0.41 0.37 0.26
Non-ICT Capital 0.75 0.21 0.29 0.48 0.43 0.24
Labor Composition 0.12 0.38 0.32 0.25 0.07 0.12
Hours Worked 1.52 -0.18 1.12 0.66 0.77 0.30
Multifactor Productivity (excl. effects of software and education)
0.85 0.72 1.32 0.79 1.10 1.18
Including Intangible Capital
GDP growth (incl. Intangibles) 4.28 1.35 3.59 2.80 2.98 2.18
Hours growth 2.27 -0.27 1.66 0.99 1.14 0.45
Labour Productivity growth 1.97 1.63 1.89 1.80 1.82 1.73
Contributions to GDP growth
ICT Capital (excl. software) 0.44 0.22 0.20 0.33 0.30 0.22
Non-ICT Capital 0.56 0.15 0.21 0.35 0.32 0.17
Intangible Capital 2.13 0.94 1.14 1.53 1.44 1.01
Software 0.37 0.10 0.14 0.23 0.21 0.11
Innovative Property 1.01 0.47 0.49 0.74 0.68 0.48
Private R&D 0.70 0.40 0.29 0.55 0.49 0.36
Internal effect 0.06 0.03 0.02 0.05 0.04 0.03
External effect 0.64 0.37 0.27 0.50 0.45 0.33
Public R&D 0.22 0.07 0.15 0.15 0.15 0.10
Internal effect 0.03 0.01 0.02 0.02 0.02 0.01
External effect 0.19 0.06 0.13 0.13 0.13 0.09
Economic Competencies 0.42 0.03 0.16 0.22 0.21 0.08
Educational Capital 0.32 0.34 0.35 0.33 0.34 0.34
Labor Composition 0.12 0.36 0.31 0.24 0.07 0.11
Hours Worked 0.70 -0.08 0.52 0.30 0.35 0.14
Multifactor Productivity (final residual) 0.33 -0.24 1.21 0.05 0.50 0.53
Data sources: Statistics Netherlands and EU KLEMS database, November 2009, at http://www.euklems. Note: Items may not add up due to a rounding error. Public and private R&D do not add up to innovative property because innovative property also comprises other categories such as copyright and license costs.
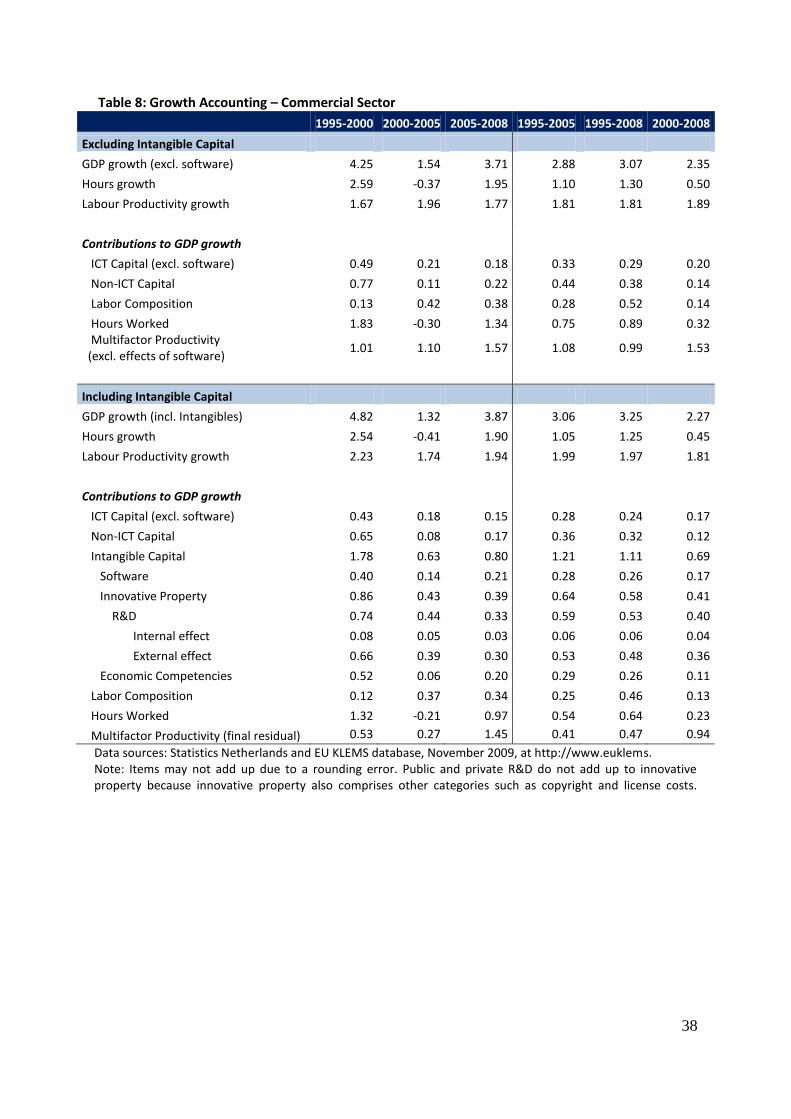
38
Table 8: Growth Accounting – Commercial Sector
1995-2000 2000-2005 2005-2008 1995-2005 1995-2008 2000-2008
Excluding Intangible Capital
GDP growth (excl. software) 4.25 1.54 3.71 2.88 3.07 2.35
Hours growth 2.59 -0.37 1.95 1.10 1.30 0.50
Labour Productivity growth 1.67 1.96 1.77 1.81 1.81 1.89
Contributions to GDP growth
ICT Capital (excl. software) 0.49 0.21 0.18 0.33 0.29 0.20
Non-ICT Capital 0.77 0.11 0.22 0.44 0.38 0.14
Labor Composition 0.13 0.42 0.38 0.28 0.52 0.14
Hours Worked 1.83 -0.30 1.34 0.75 0.89 0.32 Multifactor Productivity (excl. effects of software)
1.01 1.10 1.57 1.08 0.99 1.53
Including Intangible Capital
GDP growth (incl. Intangibles) 4.82 1.32 3.87 3.06 3.25 2.27
Hours growth 2.54 -0.41 1.90 1.05 1.25 0.45
Labour Productivity growth 2.23 1.74 1.94 1.99 1.97 1.81
Contributions to GDP growth
ICT Capital (excl. software) 0.43 0.18 0.15 0.28 0.24 0.17
Non-ICT Capital 0.65 0.08 0.17 0.36 0.32 0.12
Intangible Capital 1.78 0.63 0.80 1.21 1.11 0.69
Software 0.40 0.14 0.21 0.28 0.26 0.17
Innovative Property 0.86 0.43 0.39 0.64 0.58 0.41
R&D 0.74 0.44 0.33 0.59 0.53 0.40
Internal effect 0.08 0.05 0.03 0.06 0.06 0.04
External effect 0.66 0.39 0.30 0.53 0.48 0.36
Economic Competencies 0.52 0.06 0.20 0.29 0.26 0.11
Labor Composition 0.12 0.37 0.34 0.25 0.46 0.13
Hours Worked 1.32 -0.21 0.97 0.54 0.64 0.23
Multifactor Productivity (final residual) 0.53 0.27 1.45 0.41 0.47 0.94
Data sources: Statistics Netherlands and EU KLEMS database, November 2009, at http://www.euklems. Note: Items may not add up due to a rounding error. Public and private R&D do not add up to innovative property because innovative property also comprises other categories such as copyright and license costs.
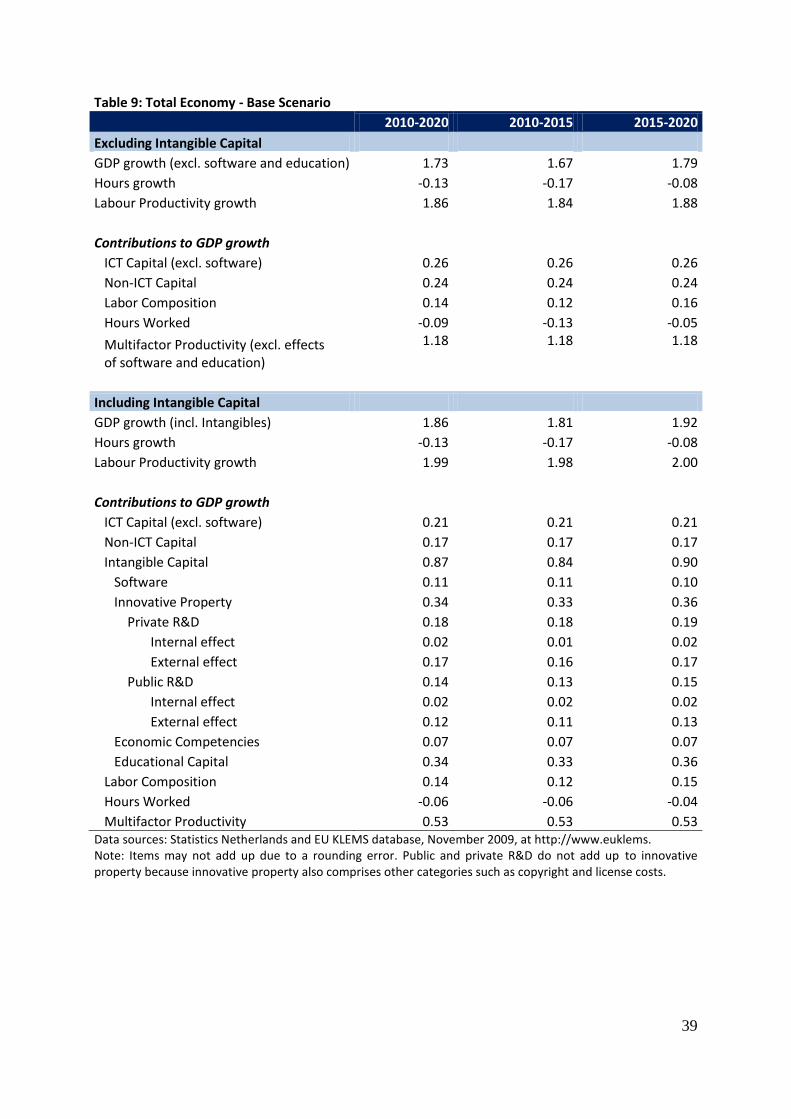
39
Table 9: Total Economy - Base Scenario
2010-2020 2010-2015 2015-2020
Excluding Intangible Capital
GDP growth (excl. software and education) 1.73 1.67 1.79
Hours growth -0.13 -0.17 -0.08
Labour Productivity growth 1.86 1.84 1.88
Contributions to GDP growth ICT Capital (excl. software) 0.26 0.26 0.26
Non-ICT Capital 0.24 0.24 0.24
Labor Composition 0.14 0.12 0.16
Hours Worked -0.09 -0.13 -0.05
Multifactor Productivity (excl. effects of software and education)
1.18 1.18 1.18
Including Intangible Capital
GDP growth (incl. Intangibles) 1.86 1.81 1.92
Hours growth -0.13 -0.17 -0.08
Labour Productivity growth 1.99 1.98 2.00
Contributions to GDP growth ICT Capital (excl. software) 0.21 0.21 0.21
Non-ICT Capital 0.17 0.17 0.17
Intangible Capital 0.87 0.84 0.90
Software 0.11 0.11 0.10
Innovative Property 0.34 0.33 0.36
Private R&D 0.18 0.18 0.19
Internal effect 0.02 0.01 0.02
External effect 0.17 0.16 0.17
Public R&D 0.14 0.13 0.15
Internal effect 0.02 0.02 0.02
External effect 0.12 0.11 0.13
Economic Competencies 0.07 0.07 0.07
Educational Capital 0.34 0.33 0.36
Labor Composition 0.14 0.12 0.15
Hours Worked -0.06 -0.06 -0.04
Multifactor Productivity 0.53 0.53 0.53 Data sources: Statistics Netherlands and EU KLEMS database, November 2009, at http://www.euklems. Note: Items may not add up due to a rounding error. Public and private R&D do not add up to innovative property because innovative property also comprises other categories such as copyright and license costs.

40
Table 10: Total Economy – Upper Optimistic Scenario
2010-2020 2010-2015 2015-2020
Excluding Intangible Capital
GDP growth (excl. software and education) 1.73 1.67 1.79
Hours growth -0.13 -0.17 -0.08
Labour Productivity growth 1.86 1.84 1.88
Contributions to GDP growth ICT Capital (excl. software) 0.26 0.26 0.26
Non-ICT Capital 0.24 0.24 0.24
Labor Composition 0.14 0.12 0.16
Hours Worked -0.09 -0.13 -0.05
Multifactor Productivity (excl. effects of software and education)
1.18 1.18 1.18
Including Intangible Capital
GDP growth (incl. Intangibles) 2.09 2.08 2.12
Hours growth -0.13 -0.17 -0.08
Labour Productivity growth 2.21 2.25 2.20
Contributions to GDP growth ICT Capital (excl. software) 0.21 0.21 0.21
Non-ICT Capital 0.17 0.17 0.17
Intangible Capital 1.09 1.00 1.19
Software 0.12 0.12 0.12
Innovative Property 0.48 0.42 0.55
Private R&D 0.28 0.24 0.32
Internal effect 0.02 0.02 0.03
External effect 0.25 0.22 0.29
Public R&D 0.18 0.15 0.21
Internal effect 0.02 0.02 0.03
External effect 0.15 0.13 0.18
Economic Competencies 0.14 0.13 0.15
Educational Capital 0.35 0.33 0.37
Labor Composition 0.14 0.12 0.15
Hours Worked -0.06 0.04 -0.14
Multifactor Productivity 0.53 0.53 0.53 Data sources: Statistics Netherlands and EU KLEMS database, November 2009, at http://www.euklems. Note: Items may not add up due to a rounding error. Public and private R&D do not add up to innovative property because innovative property also comprises other categories such as copyright and license costs.
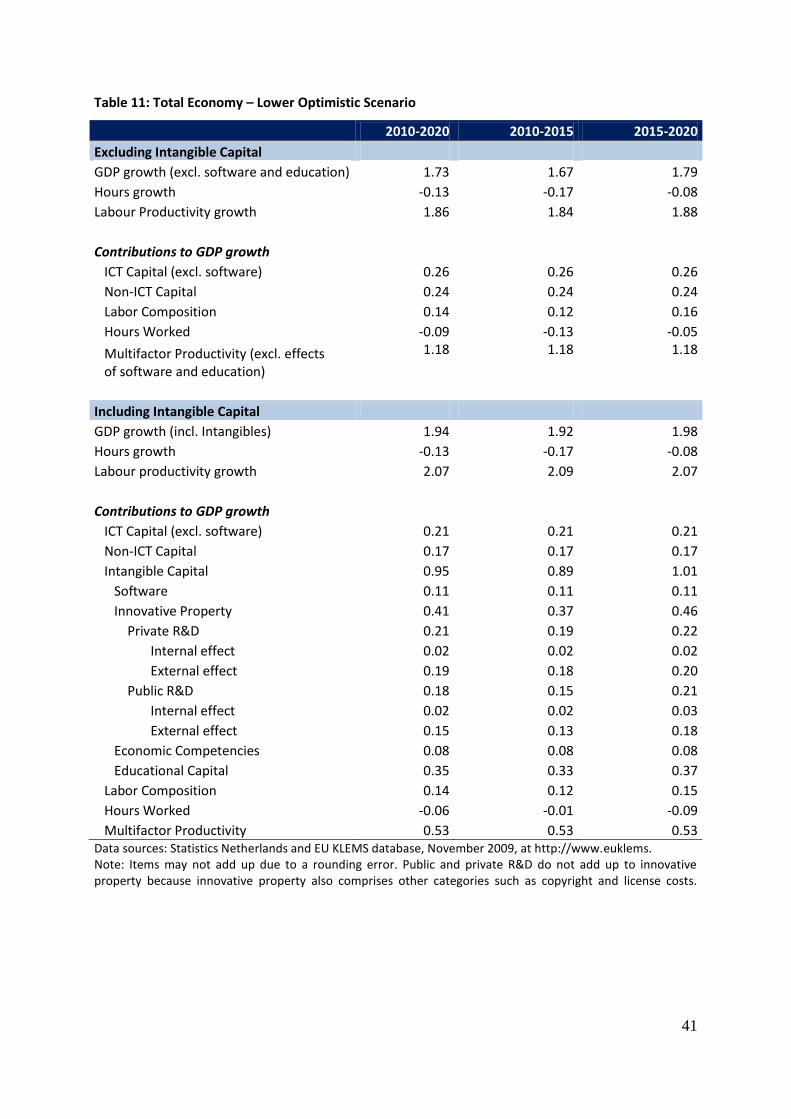
41
Table 11: Total Economy – Lower Optimistic Scenario
2010-2020 2010-2015 2015-2020
Excluding Intangible Capital
GDP growth (excl. software and education) 1.73 1.67 1.79
Hours growth -0.13 -0.17 -0.08
Labour Productivity growth 1.86 1.84 1.88
Contributions to GDP growth ICT Capital (excl. software) 0.26 0.26 0.26
Non-ICT Capital 0.24 0.24 0.24
Labor Composition 0.14 0.12 0.16
Hours Worked -0.09 -0.13 -0.05
Multifactor Productivity (excl. effects of software and education)
1.18 1.18 1.18
Including Intangible Capital
GDP growth (incl. Intangibles) 1.94 1.92 1.98
Hours growth -0.13 -0.17 -0.08
Labour productivity growth 2.07 2.09 2.07
Contributions to GDP growth ICT Capital (excl. software) 0.21 0.21 0.21
Non-ICT Capital 0.17 0.17 0.17
Intangible Capital 0.95 0.89 1.01
Software 0.11 0.11 0.11
Innovative Property 0.41 0.37 0.46
Private R&D 0.21 0.19 0.22
Internal effect 0.02 0.02 0.02
External effect 0.19 0.18 0.20
Public R&D 0.18 0.15 0.21
Internal effect 0.02 0.02 0.03
External effect 0.15 0.13 0.18
Economic Competencies 0.08 0.08 0.08
Educational Capital 0.35 0.33 0.37
Labor Composition 0.14 0.12 0.15
Hours Worked -0.06 -0.01 -0.09
Multifactor Productivity 0.53 0.53 0.53 Data sources: Statistics Netherlands and EU KLEMS database, November 2009, at http://www.euklems. Note: Items may not add up due to a rounding error. Public and private R&D do not add up to innovative property because innovative property also comprises other categories such as copyright and license costs.
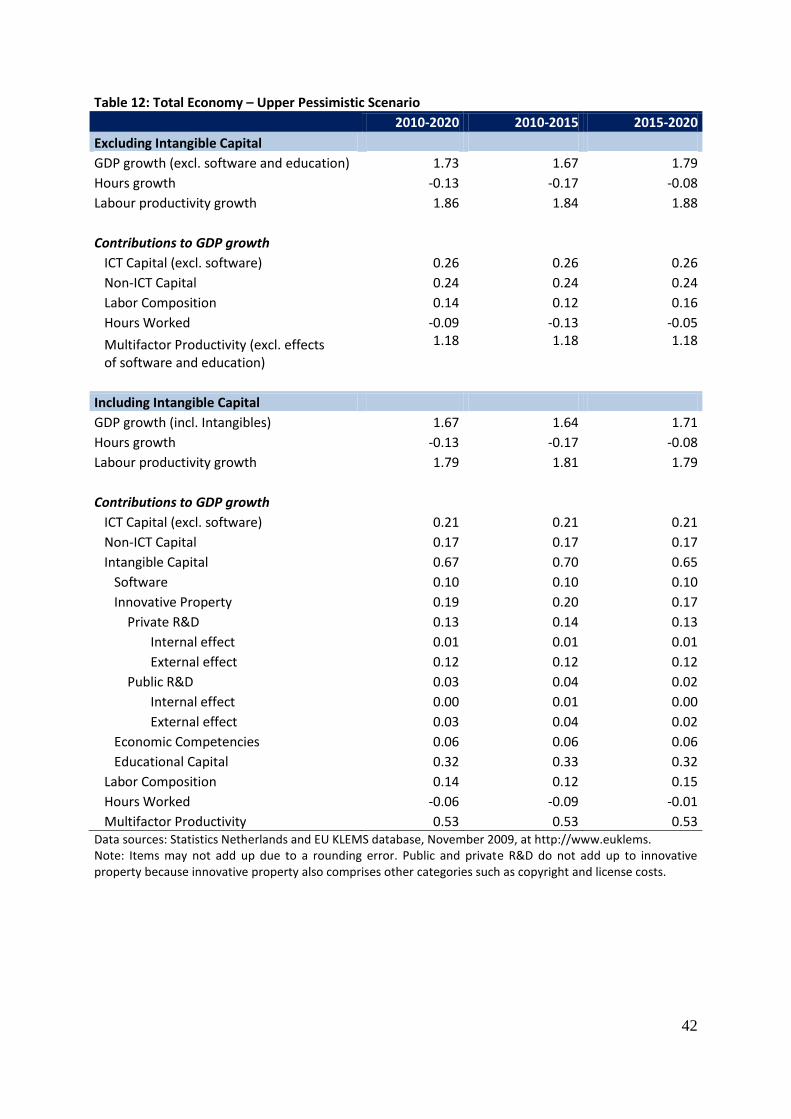
42
Table 12: Total Economy – Upper Pessimistic Scenario
2010-2020 2010-2015 2015-2020
Excluding Intangible Capital
GDP growth (excl. software and education) 1.73 1.67 1.79
Hours growth -0.13 -0.17 -0.08
Labour productivity growth 1.86 1.84 1.88
Contributions to GDP growth ICT Capital (excl. software) 0.26 0.26 0.26
Non-ICT Capital 0.24 0.24 0.24
Labor Composition 0.14 0.12 0.16
Hours Worked -0.09 -0.13 -0.05
Multifactor Productivity (excl. effects of software and education)
1.18 1.18 1.18
Including Intangible Capital
GDP growth (incl. Intangibles) 1.67 1.64 1.71
Hours growth -0.13 -0.17 -0.08
Labour productivity growth 1.79 1.81 1.79
Contributions to GDP growth ICT Capital (excl. software) 0.21 0.21 0.21
Non-ICT Capital 0.17 0.17 0.17
Intangible Capital 0.67 0.70 0.65
Software 0.10 0.10 0.10
Innovative Property 0.19 0.20 0.17
Private R&D 0.13 0.14 0.13
Internal effect 0.01 0.01 0.01
External effect 0.12 0.12 0.12
Public R&D 0.03 0.04 0.02
Internal effect 0.00 0.01 0.00
External effect 0.03 0.04 0.02
Economic Competencies 0.06 0.06 0.06
Educational Capital 0.32 0.33 0.32
Labor Composition 0.14 0.12 0.15
Hours Worked -0.06 -0.09 -0.01
Multifactor Productivity 0.53 0.53 0.53 Data sources: Statistics Netherlands and EU KLEMS database, November 2009, at http://www.euklems. Note: Items may not add up due to a rounding error. Public and private R&D do not add up to innovative property because innovative property also comprises other categories such as copyright and license costs.

43
Table 13: Total Economy – Lower Pessimistic Scenario
2010-2020 2010-2015 2015-2020
Excluding Intangible Capital
GDP growth (excl. software and education) 1.73 1.67 1.79
Hours growth -0.13 -0.17 -0.08
Labour productivity growth 1.86 1.84 1.88
Contributions to GDP growth ICT Capital (excl. software) 0.26 0.26 0.26
Non-ICT Capital 0.24 0.24 0.24
Labor Composition 0.14 0.12 0.16
Hours Worked -0.09 -0.13 -0.05
Multifactor Productivity (excl. effects of software and education)
1.18 1.18 1.18
Including Intangible Capital
GDP growth (incl. Intangibles) 1.51 1.50 1.52
Hours growth -0.13 -0.17 -0.08
Labour productivity growth 1.63 1.67 1.60
Contributions to GDP growth ICT Capital (excl. software) 0.21 0.21 0.21
Non-ICT Capital 0.17 0.17 0.17
Intangible Capital 0.51 0.56 0.47
Software 0.07 0.08 0.06
Innovative Property 0.11 0.14 0.07
Private R&D 0.07 0.08 0.05
Internal effect 0.01 0.01 0.00
External effect 0.06 0.08 0.04
Public R&D 0.03 0.04 0.02
Internal effect 0.00 0.01 0.00
External effect 0.03 0.04 0.02
Economic Competencies 0.01 0.02 0.01
Educational Capital 0.32 0.33 0.32
Labor Composition 0.14 0.12 0.15
Hours Worked -0.06 -0.09 -0.01
Multifactor Productivity 0.53 0.53 0.53 Data sources: Statistics Netherlands and EU KLEMS database, November 2009, at http://www.euklems. Note: Items may not add up due to a rounding error. Public and private R&D do not add up to innovative property because innovative property also comprises other categories such as copyright and license costs.

44
Table 14: Implications of Base, Optimistic, and Pessimistic Scenarios for Output Gains and Losses, Million €, Constant 2006 Prices
GDP gained GDP gained GDP lost GDP lost
Upper optimistic
compared to base
Lower optimistic
compared to base
Upper pessimistic
compared to base
Lower pessimistic
compared to base
2010 - - - -
2011 1298 463 -1111 -2029
2012 2648 943 -2262 -4126
2013 4050 1442 -3452 -6293
2014 5507 1959 -4684 -8532
2015 7020 2496 -5958 -10845
2016 8590 3052 -7276 -13233
2017 10220 3628 -8639 -15698
2018 11910 4226 -10047 -18243
2019 13664 4844 -11503 -20869
2020 15482 5485 -13006 -23579
Data sources: Statistics Netherlands and EU KLEMS database, November 2009, at http://www.euklems.
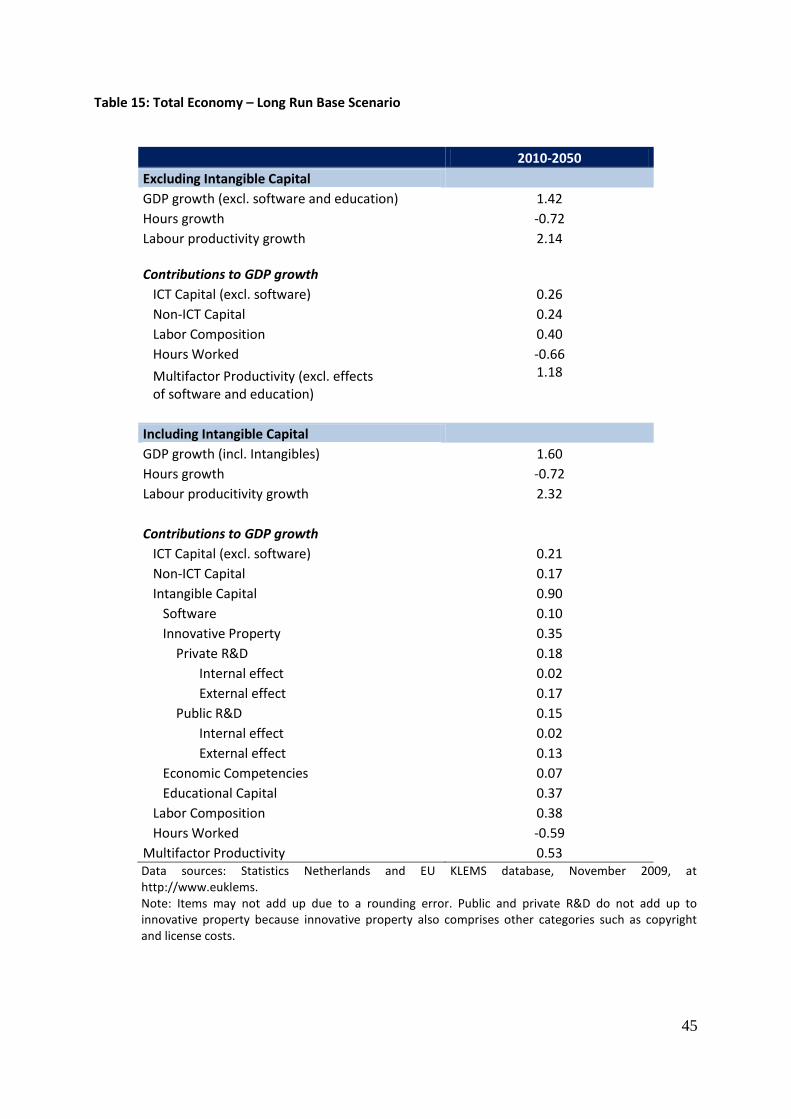
45
Table 15: Total Economy – Long Run Base Scenario
2010-2050
Excluding Intangible Capital GDP growth (excl. software and education) 1.42
Hours growth -0.72
Labour productivity growth 2.14 Contributions to GDP growth
ICT Capital (excl. software) 0.26
Non-ICT Capital 0.24
Labor Composition 0.40
Hours Worked -0.66
Multifactor Productivity (excl. effects of software and education)
1.18
Including Intangible Capital GDP growth (incl. Intangibles) 1.60
Hours growth -0.72
Labour producitivity growth 2.32
Contributions to GDP growth ICT Capital (excl. software) 0.21
Non-ICT Capital 0.17
Intangible Capital 0.90
Software 0.10
Innovative Property 0.35
Private R&D 0.18
Internal effect 0.02
External effect 0.17
Public R&D 0.15
Internal effect 0.02
External effect 0.13
Economic Competencies 0.07
Educational Capital 0.37
Labor Composition 0.38
Hours Worked -0.59
Multifactor Productivity 0.53 Data sources: Statistics Netherlands and EU KLEMS database, November 2009, at http://www.euklems. Note: Items may not add up due to a rounding error. Public and private R&D do not add up to innovative property because innovative property also comprises other categories such as copyright and license costs.

46
Figure 1
0,00
2,00
4,00
6,00
8,00
10,00
12,00
14,00
Commercial Sector Public Sector Total Economy
Intangible Investment in the Commercial Sector, Public Sector, and Total Economy 2008 (% GDP)
Computerized Information Innovative Property Economic Competencies Education
Data source: Statistics Netherlands Note: GDP is conventionally measured GDP (as published from Statistics Netherlands)
Figure 2
0
2
4
6
8
10
12
14
16
19
87
19
88
19
89
19
90
19
91
19
92
19
93
19
94
19
95
19
96
19
97
19
98
19
99
20
00
20
01
20
02
20
03
20
04
20
05
20
06
20
07
*
20
08
*%
of
GD
P
Intangible Investment as a % of GDP in the Commercial Sector and Public Sector 1987-2008
Computerized information CS Innovative property CS Economic competencies CSComputerized information PS Innovative property PS Economic competencies PSEducation PS
Data source: Statistics Netherlands Note: GDP is conventionally measured GDP (as published from Statistics Netherlands)

47
Figure 3
0
10000
20000
30000
40000
50000
60000
70000
80000
19
88
19
89
19
90
19
91
19
92
19
93
19
94
19
95
19
96
19
97
19
98
19
99
20
00
20
01
20
02
20
03
20
04
20
05
20
06
20
07
*
20
08
*
Computerized informtion, innovative property, economic competencies, and education in the total economy 1987-2008, million EUR, constant 2006 prices
Computerized information Innovative property Economic competencies Education
Data source: Statistics Netherlands Note: GDP is conventionally measured GDP (as published from Statistics Netherlands)
Figure 4
-0,5
0,0
0,5
1,0
1,5
2,0
2,5
3,0
3,5
4,0
4,5
1995-2000 2000-2005 2005-2008 1995-2005 1995-2008 2000-2008
Contributions of Inputs to GDP Growth - Total Economy
ICT Capital (excl. Software) Non-ICT Capital Intangible Capital (excluding education)Education Labor Composition Hours WorkedMultifactor Productivity
Data sources: Statistics Netherlands and EU KLEMS database, November 2009, at http://www.euklems.
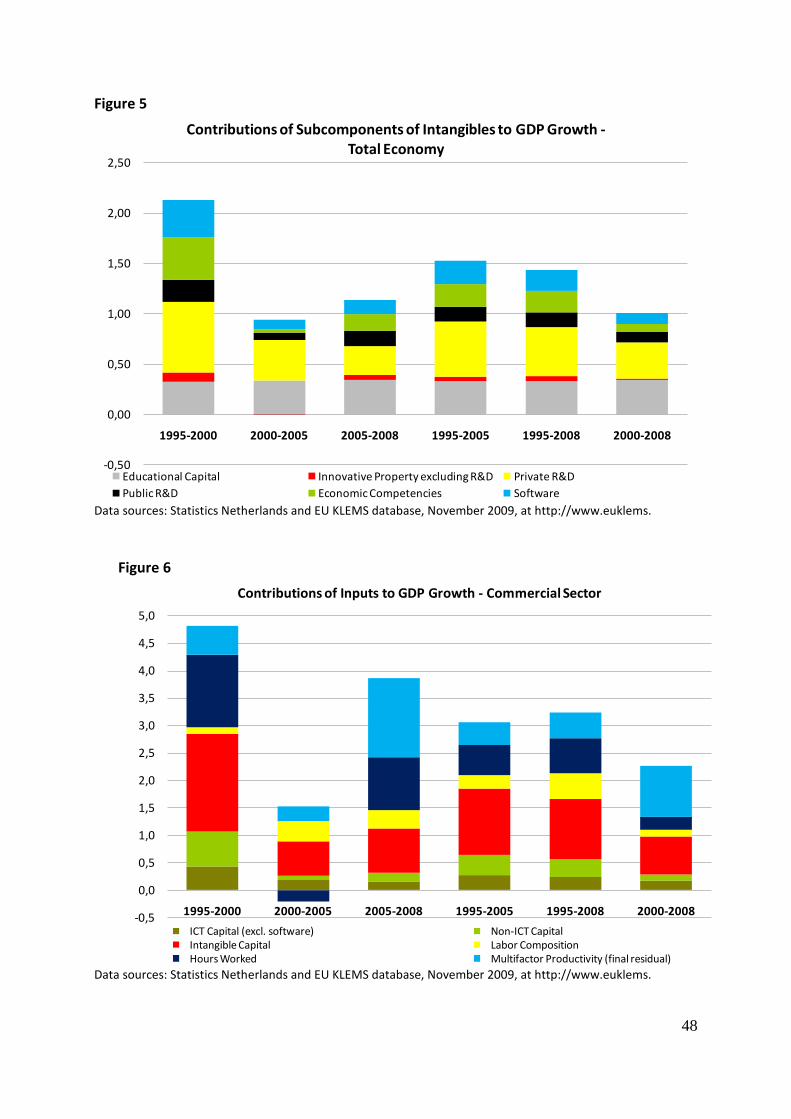
48
Figure 5
-0,50
0,00
0,50
1,00
1,50
2,00
2,50
1995-2000 2000-2005 2005-2008 1995-2005 1995-2008 2000-2008
Contributions of Subcomponents of Intangibles to GDP Growth -Total Economy
Educational Capital Innovative Property excluding R&D Private R&D
Public R&D Economic Competencies Software Data sources: Statistics Netherlands and EU KLEMS database, November 2009, at http://www.euklems.
Figure 6
-0,5
0,0
0,5
1,0
1,5
2,0
2,5
3,0
3,5
4,0
4,5
5,0
1995-2000 2000-2005 2005-2008 1995-2005 1995-2008 2000-2008
Contributions of Inputs to GDP Growth - Commercial Sector
ICT Capital (excl. software) Non-ICT CapitalIntangible Capital Labor CompositionHours Worked Multifactor Productivity (final residual)
Data sources: Statistics Netherlands and EU KLEMS database, November 2009, at http://www.euklems.

49
Figure 7
-0,20
0,00
0,20
0,40
0,60
0,80
1,00
1,20
1,40
1,60
1,80
2,00
1995-2000 2000-2005 2005-2008 1995-2005 1995-2008 2000-2008
Contributions of Subcomponents of Intangibles to GDP Growth -Commercial Sector
Software Innovative Property (excl. R&D) R&D Economic Competencies
Data sources: Statistics Netherlands and EU KLEMS database, November 2009, at http://www.euklems.
Figure 8
-0,5
0,0
0,5
1,0
1,5
2,0
2,5
Base scenario Upper optimistic scenario
Lower optimistic scenario
Upper pessimistic scenario
Lower pessimistic scenario
Contributions of Inputs to GDP Growth - Total Economy Base, optimistic, and pessimistic scenarios 2010-2020
ICT Capital (excl. software) Non-ICT Capital Intangibles (excluding education)Education Labor Composition Hours WorkedMFP
Data sources: Statistics Netherlands and EU KLEMS database, November 2009, at http://www.euklems.
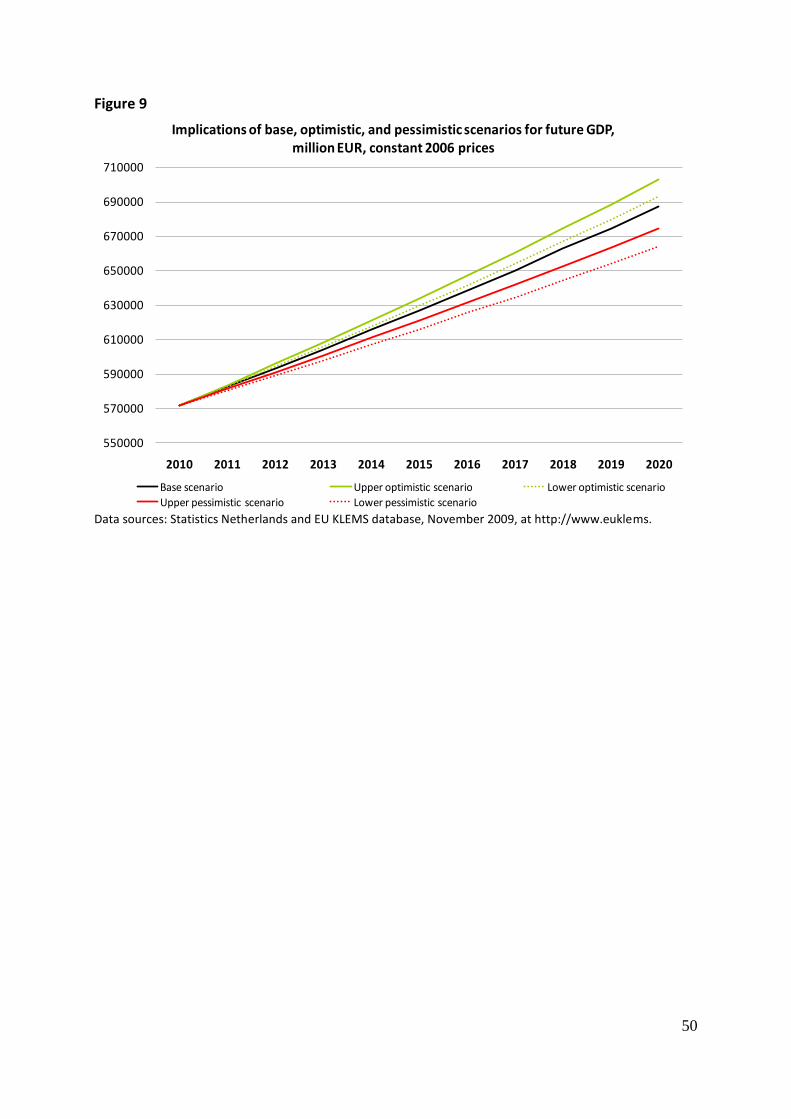
50
Figure 9
550000
570000
590000
610000
630000
650000
670000
690000
710000
2010 2011 2012 2013 2014 2015 2016 2017 2018 2019 2020
Implications of base, optimistic, and pessimistic scenarios for future GDP, million EUR, constant 2006 prices
Base scenario Upper optimistic scenario Lower optimistic scenario
Upper pessimistic scenario Lower pessimistic scenario Data sources: Statistics Netherlands and EU KLEMS database, November 2009, at http://www.euklems.
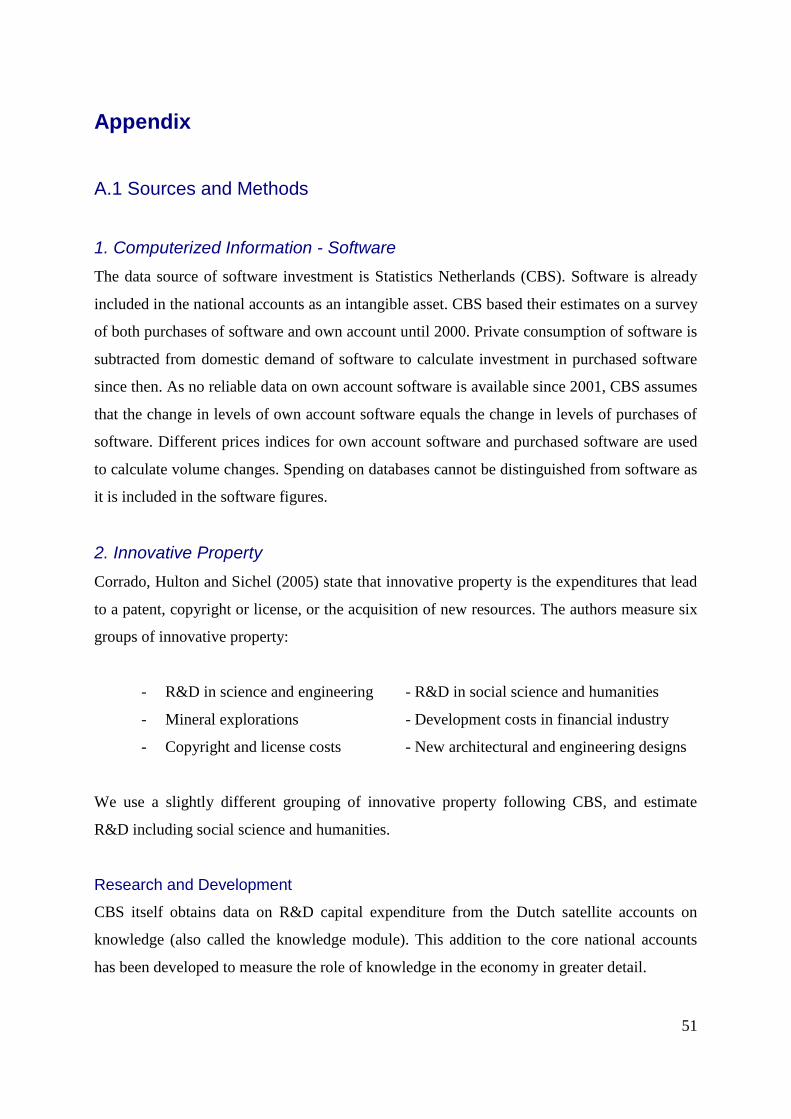
51
Appendix
A.1 Sources and Methods
1. Computerized Information - Software
The data source of software investment is Statistics Netherlands (CBS). Software is already
included in the national accounts as an intangible asset. CBS based their estimates on a survey
of both purchases of software and own account until 2000. Private consumption of software is
subtracted from domestic demand of software to calculate investment in purchased software
since then. As no reliable data on own account software is available since 2001, CBS assumes
that the change in levels of own account software equals the change in levels of purchases of
software. Different prices indices for own account software and purchased software are used
to calculate volume changes. Spending on databases cannot be distinguished from software as
it is included in the software figures.
2. Innovative Property
Corrado, Hulton and Sichel (2005) state that innovative property is the expenditures that lead
to a patent, copyright or license, or the acquisition of new resources. The authors measure six
groups of innovative property:
- R&D in science and engineering - R&D in social science and humanities
- Mineral explorations - Development costs in financial industry
- Copyright and license costs - New architectural and engineering designs
We use a slightly different grouping of innovative property following CBS, and estimate
R&D including social science and humanities.
Research and Development
CBS itself obtains data on R&D capital expenditure from the Dutch satellite accounts on
knowledge (also called the knowledge module). This addition to the core national accounts
has been developed to measure the role of knowledge in the economy in greater detail.

52
Mineral Exploration and Evaluation
The estimates from CBS are based on data series regarding the amount of exploratory drilling
(by type of drilling and location) and on data series on the average costs of exploratory
drilling (by type of drilling and location for a benchmark year).
Copyright and license costs
To estimate development costs in the motion picture industry and in the radio and television,
sound recording and book publishing industries in the Netherlands, CBS uses data series from
the Dutch national accounts with regard to investment in entertainment, literary or artistic
originals. These estimates are calculated using revenues from royalties and licenses.
Therefore, assumptions on the age efficiency of royalties and licenses are necessary to
estimate the value of new originals from the revenues mentioned above.
New architectural and engineering designs
A large part of expenditures in this category are registered as investment in the national
accounts. They are included in the estimates of tangible capital investment and, more
precisely, in investments in dwellings, nonresidential buildings and machinery and equipment.
CBS has distinguished the intangibles parts from their tangible counterparts for their analysis
and made this data available for us.
3. Economic Competencies
Brand Equity
Economic competencies are the largest category and include three subgroups: brand equity,
firm-specific human capital and organizational structure.
The Dutch national accounts are used by CBS to construct advertising expenditures. The
business survey data are combined with other data sources to arrive at industry expenditure by
commodity. The national accounts make a distinction between eight different expenditure
categories of marketing and advertisement, which feature seven types of advertisement
expenditure and one type of market research:
53
- Advertisements in newspapers - Free local papers
- Advertisements in specialist journals - Other spending on marketing and advertisement
- Advertisements in other journals - Market research services
- Advertising pamphlets / brochures - Public relation services
As advertising is only a fraction of the total sales and marketing effort of companies, it is
necessary to decide what part of advertising is related to strengthening the brand relative to
advertising to capture market share. CBS defines investment in brand equity as the part of the
expenditure on marketing and advertisement that has as the primary aim to increase the value
of a brand name or to increase output over a period of more than one year.
CBS excludes spending by advertising agencies, as it is done on behalf of their customers and
is therefore considered intermediate input of the advertising agencies. Excluded is spending
on free local papers, because they do not aimed at increasing output for more than one year.
Included in the advertising numbers are 50 percent of the spending on advertising pamphlets
and brochures. Furthermore, 13 percent of spending on advertisement in newspapers is
excluded from the investment estimates and 5 percent of the spending on advertisement in
specialist journals.
CBS calculates purchases of market research and public relation services with the same
method as the estimation of investment in organizational structure. As the results for these
services deviate less than 10 percent from output of the market research industry and the
public relation industry, the output estimate of the corresponding industry seems to be a good
approximation of total investment.
Firm-specific human capital
Investment in firm-specific capital and human resources includes direct firm expenses such as
tuition reimbursement or outlays on trainers and wage and salary costs of employee time. A
company would not pay for firm-specific training unless it expects a return on investment -
even though it mainly improves the human capital of employees. Expenditures on firm
specific training also meet the criterion of an asset because the expected returns on company
training will last usually for more than one year. As with the R&D data, CBS obtained the
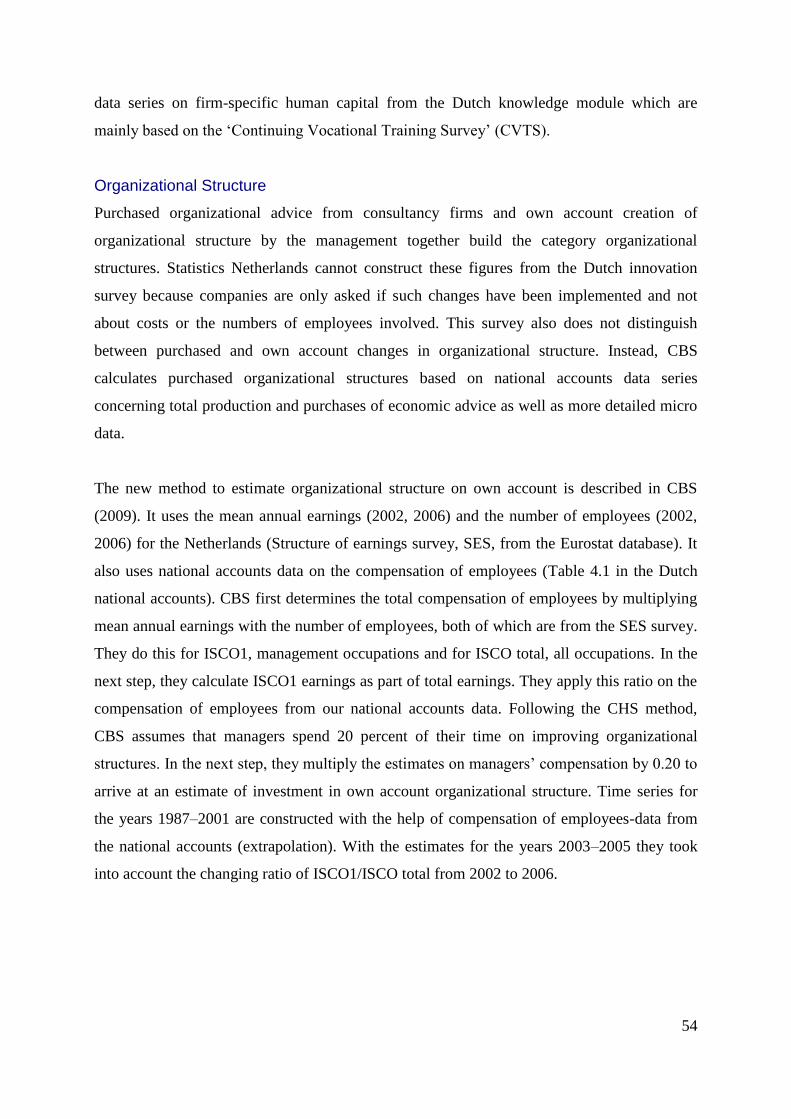
54
data series on firm-specific human capital from the Dutch knowledge module which are
mainly based on the ‗Continuing Vocational Training Survey‘ (CVTS).
Organizational Structure
Purchased organizational advice from consultancy firms and own account creation of
organizational structure by the management together build the category organizational
structures. Statistics Netherlands cannot construct these figures from the Dutch innovation
survey because companies are only asked if such changes have been implemented and not
about costs or the numbers of employees involved. This survey also does not distinguish
between purchased and own account changes in organizational structure. Instead, CBS
calculates purchased organizational structures based on national accounts data series
concerning total production and purchases of economic advice as well as more detailed micro
data.
The new method to estimate organizational structure on own account is described in CBS
(2009). It uses the mean annual earnings (2002, 2006) and the number of employees (2002,
2006) for the Netherlands (Structure of earnings survey, SES, from the Eurostat database). It
also uses national accounts data on the compensation of employees (Table 4.1 in the Dutch
national accounts). CBS first determines the total compensation of employees by multiplying
mean annual earnings with the number of employees, both of which are from the SES survey.
They do this for ISCO1, management occupations and for ISCO total, all occupations. In the
next step, they calculate ISCO1 earnings as part of total earnings. They apply this ratio on the
compensation of employees from our national accounts data. Following the CHS method,
CBS assumes that managers spend 20 percent of their time on improving organizational
structures. In the next step, they multiply the estimates on managers‘ compensation by 0.20 to
arrive at an estimate of investment in own account organizational structure. Time series for
the years 1987–2001 are constructed with the help of compensation of employees-data from
the national accounts (extrapolation). With the estimates for the years 2003–2005 they took
into account the changing ratio of ISCO1/ISCO total from 2002 to 2006.
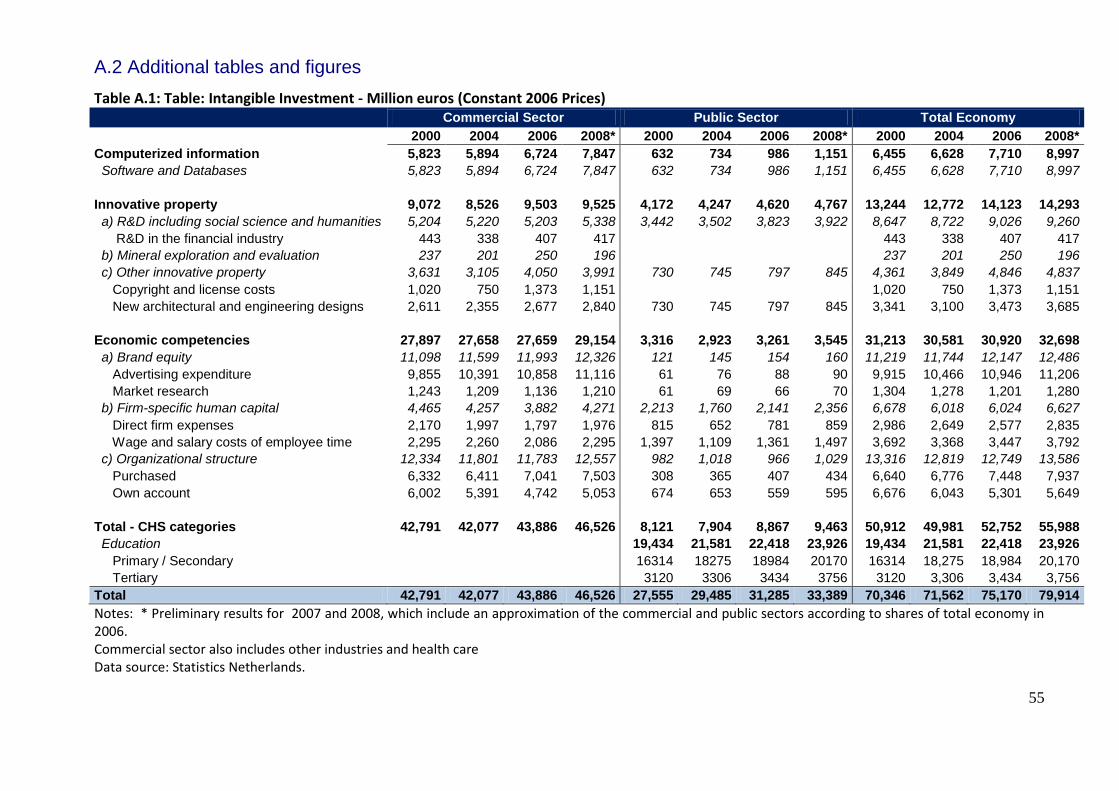
55
A.2 Additional tables and figures
Table A.1: Table: Intangible Investment - Million euros (Constant 2006 Prices)
Commercial Sector Public Sector Total Economy
2000 2004 2006 2008* 2000 2004 2006 2008* 2000 2004 2006 2008*
Computerized information 5,823 5,894 6,724 7,847 632 734 986 1,151 6,455 6,628 7,710 8,997
Software and Databases 5,823 5,894 6,724 7,847 632 734 986 1,151 6,455 6,628 7,710 8,997
Innovative property 9,072 8,526 9,503 9,525 4,172 4,247 4,620 4,767 13,244 12,772 14,123 14,293
a) R&D including social science and humanities 5,204 5,220 5,203 5,338 3,442 3,502 3,823 3,922 8,647 8,722 9,026 9,260
R&D in the financial industry 443 338 407 417
443 338 407 417
b) Mineral exploration and evaluation 237 201 250 196
237 201 250 196
c) Other innovative property 3,631 3,105 4,050 3,991 730 745 797 845 4,361 3,849 4,846 4,837
Copyright and license costs 1,020 750 1,373 1,151
1,020 750 1,373 1,151
New architectural and engineering designs 2,611 2,355 2,677 2,840 730 745 797 845 3,341 3,100 3,473 3,685
Economic competencies 27,897 27,658 27,659 29,154 3,316 2,923 3,261 3,545 31,213 30,581 30,920 32,698
a) Brand equity 11,098 11,599 11,993 12,326 121 145 154 160 11,219 11,744 12,147 12,486
Advertising expenditure 9,855 10,391 10,858 11,116 61 76 88 90 9,915 10,466 10,946 11,206
Market research 1,243 1,209 1,136 1,210 61 69 66 70 1,304 1,278 1,201 1,280
b) Firm-specific human capital 4,465 4,257 3,882 4,271 2,213 1,760 2,141 2,356 6,678 6,018 6,024 6,627
Direct firm expenses 2,170 1,997 1,797 1,976 815 652 781 859 2,986 2,649 2,577 2,835
Wage and salary costs of employee time 2,295 2,260 2,086 2,295 1,397 1,109 1,361 1,497 3,692 3,368 3,447 3,792
c) Organizational structure 12,334 11,801 11,783 12,557 982 1,018 966 1,029 13,316 12,819 12,749 13,586
Purchased 6,332 6,411 7,041 7,503 308 365 407 434 6,640 6,776 7,448 7,937
Own account 6,002 5,391 4,742 5,053 674 653 559 595 6,676 6,043 5,301 5,649
Total - CHS categories 42,791 42,077 43,886 46,526 8,121 7,904 8,867 9,463 50,912 49,981 52,752 55,988
Education
19,434 21,581 22,418 23,926 19,434 21,581 22,418 23,926
Primary / Secondary
16314 18275 18984 20170 16314 18,275 18,984 20,170
Tertiary
3120 3306 3434 3756 3120 3,306 3,434 3,756
Total 42,791 42,077 43,886 46,526 27,555 29,485 31,285 33,389 70,346 71,562 75,170 79,914
Notes: * Preliminary results for 2007 and 2008, which include an approximation of the commercial and public sectors according to shares of total economy in 2006. Commercial sector also includes other industries and health care Data source: Statistics Netherlands.
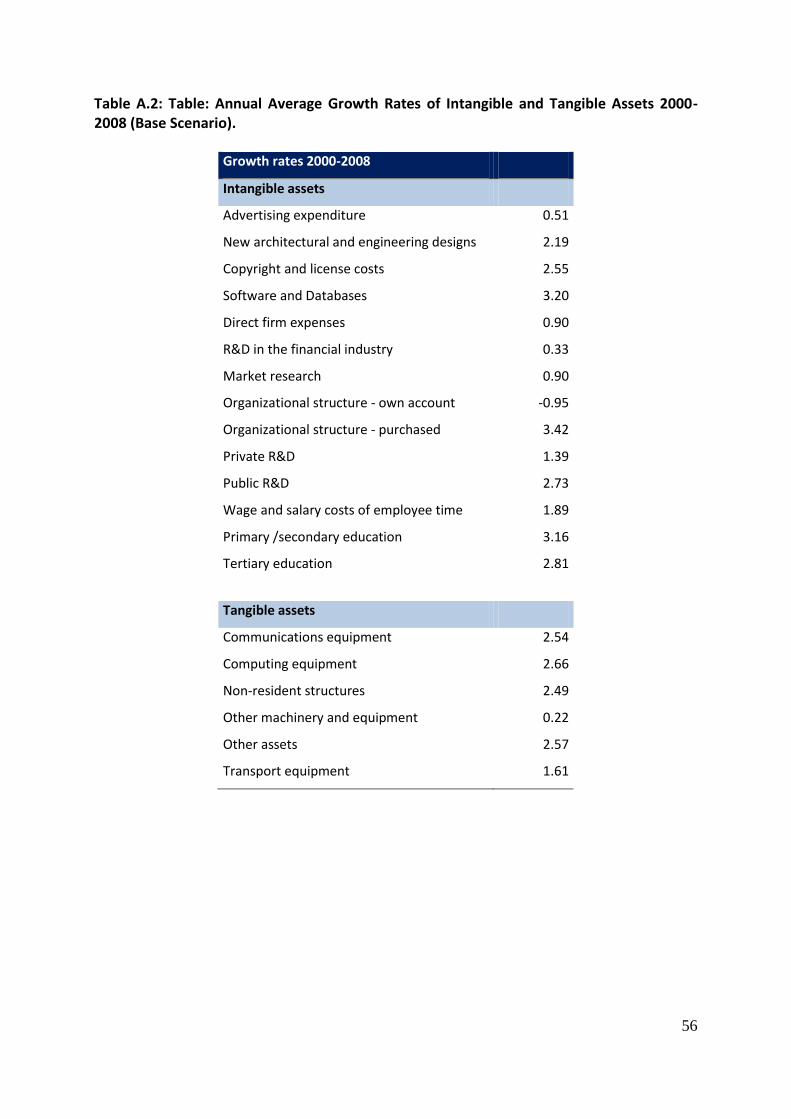
56
Table A.2: Table: Annual Average Growth Rates of Intangible and Tangible Assets 2000-2008 (Base Scenario).
Growth rates 2000-2008
Intangible assets
Advertising expenditure 0.51
New architectural and engineering designs 2.19
Copyright and license costs 2.55
Software and Databases 3.20
Direct firm expenses 0.90
R&D in the financial industry 0.33
Market research 0.90
Organizational structure - own account -0.95
Organizational structure - purchased 3.42
Private R&D 1.39
Public R&D 2.73
Wage and salary costs of employee time 1.89
Primary /secondary education 3.16
Tertiary education 2.81
Tangible assets
Communications equipment 2.54
Computing equipment 2.66
Non-resident structures 2.49
Other machinery and equipment 0.22
Other assets 2.57
Transport equipment 1.61

57
Table A.3: Growth Accounting on Contributions to Labour Productivity Growth – Total Economy
1995-2000 2000-2005 2005-2008 1995-2005 1995-2008 2000-2008
Excluding Intangible Capital
GDP growth (excl. software and education) 3.79 1.39 3.31 2.59 2.75 2.11
Hours growth 2.35 -0.31 1.74 1.01 1.18 0.45
Labour Productivity growth 1.49 1.67 1.62 1.58 1.59 1.65
Contributions to Labour Productivity growth
ICT Capital (excl. software) 0.48 0.28 0.21 0.38 0.34 0.25
Non-ICT Capital 0.05 0.29 -0.22 0.17 0.08 0.10
Labour Composition 0.12 0.38 0.32 0.25 0.07 0.12
Multifactor Productivity (excl. effects of software and education)
0.85 0.72 1.32 0.79 1.10 1.18
Including Intangible Capital
GDP growth (incl. Intangibles) 4.28 1.35 3.59 2.80 2.98 2.18
Hours growth 2.27 -0.27 1.66 0.99 1.14 0.45
Labour Productivity growth 1.97 1.63 1.89 1.80 1.82 1.73
Contributions to Labour Productivity growth
ICT Capital (excl. software) 0.39 0.23 0.17 0.31 0.28 0.21
Non-ICT Capital 0.05 0.21 -0.16 0.13 0.06 0.07
Intangible Capital 1.08 1.06 0.37 1.07 0.91 0.80
Software 0.31 0.10 0.10 0.21 0.18 0.10
Innovative Property 0.55 0.53 0.15 0.54 0.45 0.39
Private R&D 0.40 0.44 0.07 0.42 0.34 0.30
Internal effect 0.03 0.04 0.01 0.04 0.03 0.03
External effect 0.36 0.40 0.07 0.38 0.31 0.28
Public R&D 0.09 0.09 0.05 0.09 0.08 0.08
Internal effect 0.01 0.01 0.01 0.01 0.01 0.01
External effect 0.07 0.08 0.05 0.08 0.07 0.07
Economic Competencies 0.26 0.05 0.05 0.15 0.13 0.05
Educational Capital -0.04 0.38 0.08 0.17 0.15 0.27
Labour Composition 0.12 0.36 0.30 0.23 0.07 0.11
Multifactor Productivity (final residual) 0.33 -0.24 1.21 0.05 0.50 0.53
Data sources: Statistics Netherlands and EU KLEMS database, November 2009, at http://www.euklems. Note: Items may not add up due to a rounding error. Public and private R&D do not add up to innovative property because innovative property also comprises other categories such as copyright and license costs.

58
Table A.4: Growth Accounting on Contributions to Labour Productivity Growth – Commercial Sector 1995-2000 2000-2005 2005-2008 1995-2005 1995-2008 2000-2008
Excluding Intangible Capital
GDP growth (excl. software) 4.25 1.54 3.71 2.88 3.07 2.35
Hours growth 2.59 -0.37 1.95 1.10 1.30 0.50
Labour productivity growth 1.67 1.96 1.77 1.81 1.81 1.89
Contributions to Labour Productivity growth
ICT Capital (excl. software) 0.42 0.22 0.14 0.30 0.25 0.19
Non-ICT Capital 0.11 0.22 -0.31 0.15 0.05 0.03
Labour Composition 0.13 0.42 0.38 0.28 0.52 0.14
Multifactor Productivity (excl. effects of software)
1.01 1.10 1.57 1.08 0.99 1.53
Including Intangible Capital
GDP growth (incl. Intangibles) 4.82 1.32 3.87 3.06 3.25 2.27
Hours growth 2.54 -0.41 1.90 1.05 1.25 0.45
Labour productivity growth 2.23 1.74 1.94 1.99 1.97 1.81
Contributions to Labour Productivity growth
ICT Capital (excl. software) 0.37 0.19 0.11 0.26 0.22 0.16
Non-ICT Capital 0.09 0.17 -0.24 0.13 0.04 0.02
Intangible Capital 1.12 0.74 0.28 0.94 0.78 0.57
Software 0.33 0.16 0.14 0.24 0.22 0.15
Innovative Property 0.48 0.49 0.10 0.48 0.39 0.34
R&D 0.39 0.50 0.06 0.45 0.36 0.34
Internal effect 0.04 0.05 0.01 0.05 0.04 0.04
External effect 0.35 0.45 0.06 0.40 0.32 0.30
Economic Competencies 0.32 0.10 0.05 0.21 0.17 0.08
Labour Composition 0.12 0.37 0.33 0.25 0.46 0.13
Multifactor Productivity (final residual)
0.53 0.27 1.45 0.41 0.47 0.94
Data sources: Statistics Netherlands and EU KLEMS database, November 2009, at http://www.euklems. Note: Items may not add up due to a rounding error. Public and private R&D do not add up to innovative property because innovative property also comprises other categories such as copyright and license costs.
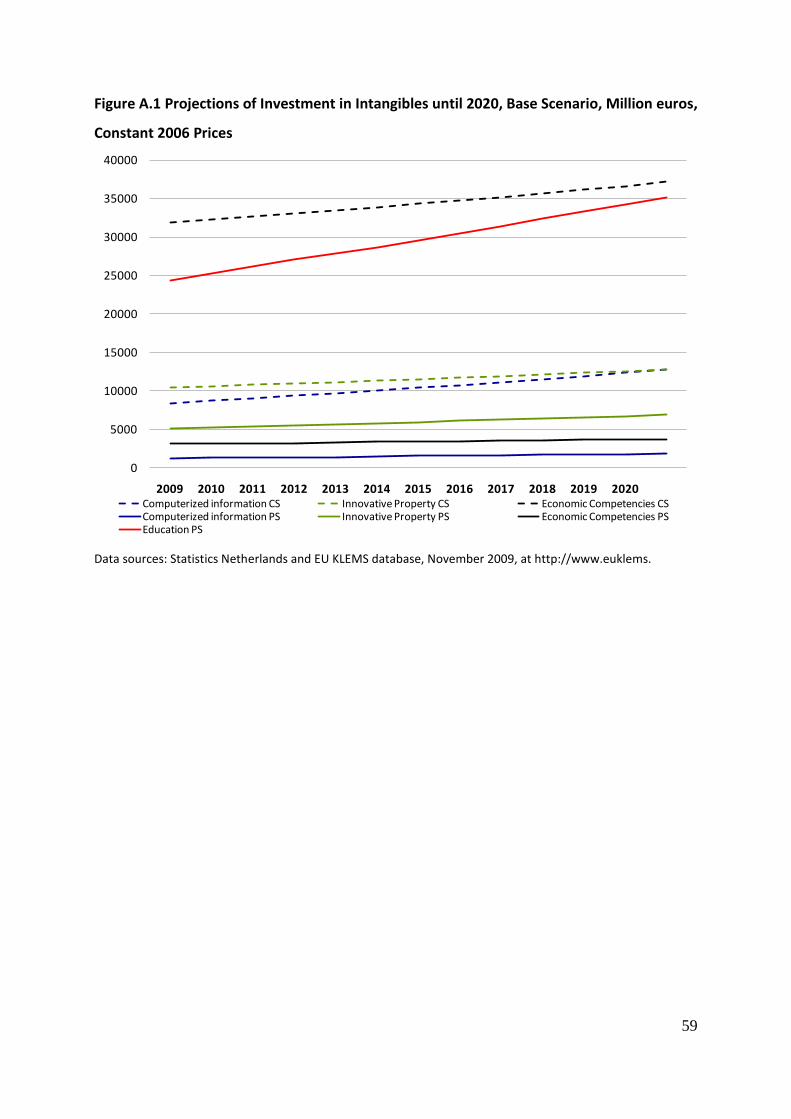
59
Figure A.1 Projections of Investment in Intangibles until 2020, Base Scenario, Million euros,
Constant 2006 Prices
0
5000
10000
15000
20000
25000
30000
35000
40000
2009 2010 2011 2012 2013 2014 2015 2016 2017 2018 2019 2020Computerized information CS Innovative Property CS Economic Competencies CSComputerized information PS Innovative Property PS Economic Competencies PSEducation PS
Data sources: Statistics Netherlands and EU KLEMS database, November 2009, at http://www.euklems.


