II - The real Economy Macroeconomic Scene Agriculture Industry Services MACROECONOMIC SCENE 2.1 India's real GDP growth is estimated at 5.2 per cent in 2000-01 as against 6.4 per cent in 1999-2000 and 6.6 per cent in 1998-99. Compared with other developing countries, excluding China, as well as industrial countries, India's growth performance, despite the deceleration, has been quite favourable (Chart II.1). The gross domestic saving rate improved moderately to 22.3 per cent in 1999-2000 from 22.0 per cent in 1998-99. The gross domestic investment rate mirrored the improvement in the saving rate. The net inflow of resources from abroad was 1.0 per cent of GDP as in the preceding year. On the supply side, real GDP growth emanating from agriculture and allied activities recorded a deceleration to 0.2 per cent in 2000-01 from 0.7 per cent during the previous year. Agricultural production, in terms of the index of agricultural production, in fact, declined by 6.5 per cent in 2000-01. Real GDP growth originating from industry slowed down to 5.3 per cent from the preceding year's level of 6.1 per cent. Industrial production, measured in terms of the index of industrial production (IIP), also decelerated to 5.1 per cent during 2000-01 from 6.7 per cent in 1999-2000 on account of pronounced slowdown in manufacturing and electricity. Although GDP growth in the services sector slackened during the year by almost 2 percentage points to 7.5 per cent, it remained close to the average of 8.5 per cent for the period 1994-2000 (Appendix Table II.1). 2.2 The deceleration in real GDP growth during the past two years has engaged policy attention. Filtering the data on real GDP growth to eliminate irregular year-to-year fluctuations indicates the presence of a growth cycle in the Indian economy and a discernible downturn in the second half of the 1990s. Although the economy is currently poised above the long-term average growth rate of 4.4 per cent covering the full period of the growth cycle, there is clearly a need to arrest the downswing and revive the momentum of growth achieved in the high growth phase of
Transcript
II - The real Economy
Macroeconomic SceneAgricultureIndustryServices
MACROECONOMIC SCENE
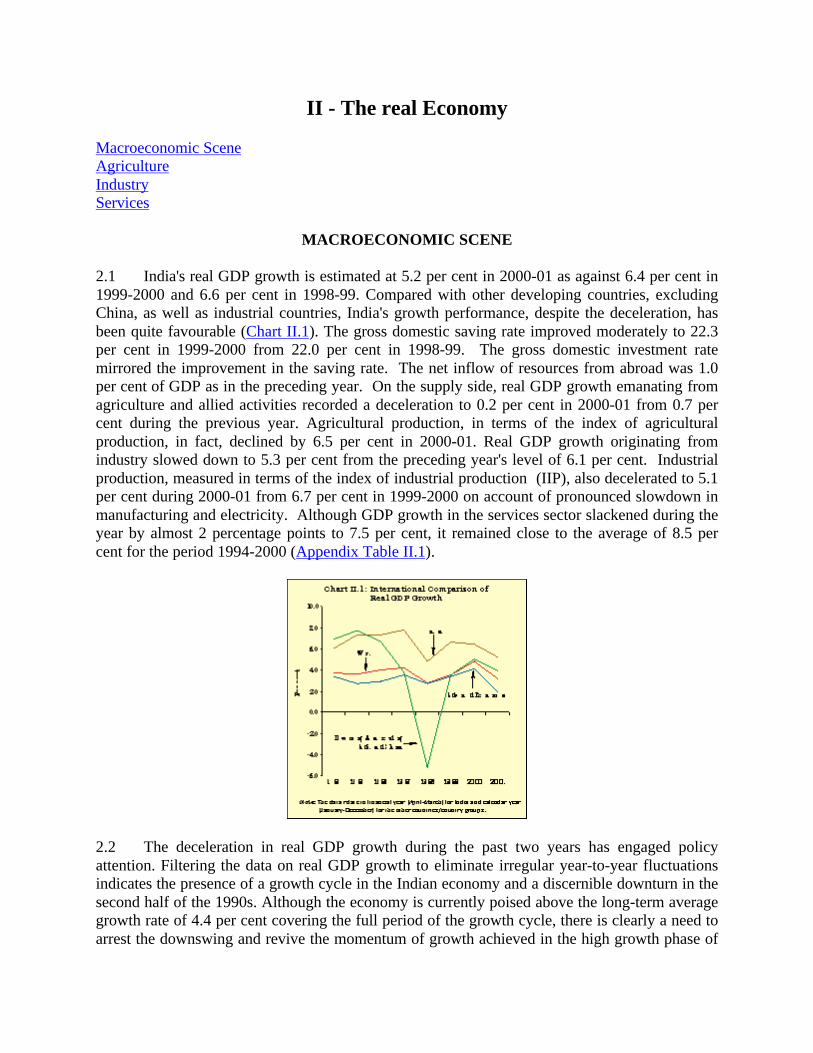
2.1 India's real GDP growth is estimated at 5.2 per cent in 2000-01 as against 6.4 per cent in1999-2000 and 6.6 per cent in 1998-99. Compared with other developing countries, excludingChina, as well as industrial countries, India's growth performance, despite the deceleration, hasbeen quite favourable (Chart II.1). The gross domestic saving rate improved moderately to 22.3per cent in 1999-2000 from 22.0 per cent in 1998-99. The gross domestic investment ratemirrored the improvement in the saving rate. The net inflow of resources from abroad was 1.0per cent of GDP as in the preceding year. On the supply side, real GDP growth emanating fromagriculture and allied activities recorded a deceleration to 0.2 per cent in 2000-01 from 0.7 percent during the previous year. Agricultural production, in terms of the index of agriculturalproduction, in fact, declined by 6.5 per cent in 2000-01. Real GDP growth originating fromindustry slowed down to 5.3 per cent from the preceding year's level of 6.1 per cent. Industrialproduction, measured in terms of the index of industrial production (IIP), also decelerated to 5.1per cent during 2000-01 from 6.7 per cent in 1999-2000 on account of pronounced slowdown inmanufacturing and electricity. Although GDP growth in the services sector slackened during theyear by almost 2 percentage points to 7.5 per cent, it remained close to the average of 8.5 percent for the period 1994-2000 (Appendix Table II.1).
2.2 The deceleration in real GDP growth during the past two years has engaged policyattention. Filtering the data on real GDP growth to eliminate irregular year-to-year fluctuationsindicates the presence of a growth cycle in the Indian economy and a discernible downturn in thesecond half of the 1990s. Although the economy is currently poised above the long-term averagegrowth rate of 4.4 per cent covering the full period of the growth cycle, there is clearly a need toarrest the downswing and revive the momentum of growth achieved in the high growth phase of
1994-97 (Chart II.2).
2.3 Quarterly real GDP growth moved up marginally to 6.1 per cent in the first quarter of2000-01 from 6.0 per cent in the fourth quarter of 1999-2000. Although the second quarterGDP growth improved moderately to 6.2 per cent, this could not be sustained in the third andfourth quarters when the growth rate slowed to 5.0 per cent and 3.8 per cent, respectively (ChartII.3). The behaviour of quarterly real GDP growth during 2000-01 mainly reflected thedownward movement in the growth rate of the services sector from 8.6 per cent in the firstquarter to 6.3 per cent in the fourth quarter. Real GDP growth from agriculture and alliedactivities at 0.6 per cent in the first quarter and at 0.5 per cent in the second quarter of 2000-01reversed the absolute declines recorded in the second half of 1999-2000. The moderateacceleration to 1.0 per cent in the third quarter could not be maintained and the real GDP fromthis sector registered an absolute decline of 1.4 per cent in the fourth quarter of 2000-01. RealGDP growth in industry improved to 6.1 per cent in the third quarter, after dipping to 5.4 percent in the second quarter from 6.6 per cent in the first quarter of 2000-01. In the fourth quarter,however, it decelerated to 3.2 per cent (Appendix Table II.2).
2.4 Over the period 1997-2001, quarterly GDP growth has been considerably affected by the
fluctuations in agricultural output. In the case of industry, the growth rate has been moderate ata quarterly average of 4.9 per cent for the same period. The growth rate of services has beenfairly robust at a quarterly average of 8.8 per cent over the four-year period including 2000-01.
Saving and Capital Formation
2.5 Quick estimates of the Central Statistical Organisation (CSO) indicate that the rate ofgross domestic saving rose marginally to 22.3 per cent in 1999-2000 from 22.0 per cent in thepreceding year (Appendix Table II.3). This was mainly on account of an improvement in the rateof household saving -- the principal component of gross domestic saving -- to 19.8 per cent in1999-2000 from 19.1 per cent in 1998-99. Household sector saving was mainly driven by theincrease in the rate of saving in physical assets in 1999-2000, which is essentially related torelatively low rates of return on financial assets in a phase of deceleration in overall economicactivity; the rate of financial saving by households dipped to 10.5 per cent in 1999-2000 from10.9 per cent in the preceding year. In the second half of the 1990s, the households' financialsaving rate has generally remained below its peak of 11.9 per cent achieved in 1994-95 (Table2.1). The rate of household financial saving (gross) in deposits decreased to 4.5 per cent of GDPduring 1999-2000 from a high of 6.5 per cent of GDP during 1994-95 while the claims onGovernment and contractual savings (i.e., provident and pension funds, and insurance funds)moved up to 1.5 per cent of GDP and 4.3 per cent of GDP, respectively, in 1999-2000 from 1.3per cent of GDP and 3.2 per cent of GDP in 1994-95. This also reflects a lower recourse ofhouseholds to the capital market (0.8 per cent of GDP from 1.7 per cent of GDP during the sameperiod), which experienced generally depressed conditions during this period. Small savings andcontractual savings continued to be the mainstay of household saving, although they were notable to offset the fall in saving rates in the other financial instruments during the second half ofthe 1990s. Stylised evidence suggests that there were switches by households from deposits toclaims on Government and provident funds (Table 2.2 and Appendix Table II.4). The privatecorporate sector saving rate remained at 3.7 per cent during 1999-2000. The stagnation in thesaving rate of the corporate sector can be attributed to low profitability conditions associatedwith the slackening of industrial activity as well as the subdued capital market. The rate of publicsaving, which turned negative in 1998-99, deteriorated further to a dissaving of 1.2 per cent in1999-2000 mainly on account of a widening of revenue deficits in the Centre and Statesprimarily to accommodate the impact of the pay revisions under the Fifth Pay CommissionAward (Apperndix Table II.3)
Table 2.1: Gross Domestic Saving and Sectoral Saving Rates(as percentage of GDP at current market prices)
2.6 Tentative estimates of the Reserve Bank, based on the latest available information, placethe rate of financial saving of households (net of financial liabilities) at 10.5 per cent of GDP in2000-01 (Table 2.3). Instrument-wise, while the rates of saving in the form of currency,investment in shares and debentures including units of Unit Trust of India (UTI) and contractualsavings declined, the rate of saving in the form of deposits is estimated to have moved up to 5.4per cent in 2000-01 from 4.9 per cent in 1999-2000.
2.7 The net inflow of external saving has remained broadly stable at around 1.4 per cent ofGDP in the 1990s with small year-to-year variations. Its contribution to aggregate investment hasalso remained stable at about 5.6 per cent. During 1999-2000, external saving stood at 1.0 percent of GDP, as in the preceding year. Accordingly, the rate of gross domestic capital formation(GDCF), i.e., gross capital formation at current prices (GCF) adjusted for errors and omissions,tracked the behaviour of the gross domestic saving rate, moving up to 23.3 per cent in 1999-2000from 23.0 per cent in 1998-99 (Appendix Table II.3). The sectoral composition of GCF indicatesan improvement in the rates of capital formation in the household sector to 9.2 per cent in 1999-2000 from 8.2 per cent in 1998-99 and in the public sector to 7.1 per cent from 6.4 per centduring the same period, mirroring the increase in investments in construction, machinery andequipment by both sectors (Table 2.4 and Appendix Table II.3). On the other hand, the rate ofprivate corporate investment declined to 6.4 per cent in 1999-2000 from 6.6 per cent a year ago.The private corporate investment rate has come down sharply from its average of 7.8 per centduring 1993-98. The slowdown in the corporate investment rate reflected pressure of excesscapacity and some erosion in the financial health of corporates during the period of decelerationin overall activity.
Table 2.3: Household Saving in Financial Assets
(Amount in Rupees crore)Item 2000-01# 1999- 1998-99P 1997-98
2000P1 2 3 4 5
A. Financial Assets (Gross) 2,64,699 2,44,143 2,09,664 1,71,740a) As per cent of GDP at current market prices 12.1 12.5 11.9 11.3
1. Currency 16,901 20,822 21,846 12,780a) As per cent of GDP at current market prices 0.8 1.1 1.2 0.8b) As per cent of Financial Assets (Gross) 6.4 8.5 10.4 7.4
2. Deposits@ 1,17,364 95,413 82,308 80,062a) As per cent of GDP at current market prices 5.4 4.9 4.7 5.3b) As per cent of Financial Assets (Gross) 44.3 39.1 39.3 46.6
3. Claims on Government 34,806 28,951 28,220 22,162a) As per cent of GDP at current market prices 1.6 1.5 1.6 1.5b) As per cent of Financial Assets (Gross) 13.1 11.9 13.5 12.9
4. Investment in Shares and Debentures+ 7,234 15,516 7,513 5,059a) As per cent of GDP at current market prices 0.3 0.8 0.4 0.3b) As per cent of Financial Assets (Gross) 2.7 6.4 3.6 2.9
5. Contractual Saving** 88,392 83,441 69,778 51,677a) As per cent of GDP at current market prices 4.0 4.3 4.0 3.4b) As per cent of Financial Assets (Gross) 33.4 34.2 33.3 30.1
B. Financial Liabilities 35,829 35,762 26,687 24,919a) As per cent of GDP at current market prices 1.6 1.8 1.5 1.6
C. Saving in Financial Assets (net) (A-B) 2,28,870 2,08,381 1,82,978 1,46,821a) As per cent of GDP at current market prices 10.5 10.6 10.4 9.6
# Preliminary. P Provisional.@ Comprise bank deposits, non-bank deposits and trade debt (net).+ Including units of Unit Trust of India and other Mutual Funds.** Comprise Life Insurance, Provident and Pension Funds.
Notes: 1. Based on the latest available information, these data were revised in July 2001 andhence may not tally with the data published in the Quick Estimates of CSO released in February2001.2. Components may not add up to the total due to rounding off.3. Data on GDP at current market prices for 2000-01 are not yet available from the CSO. In thisReport, GDP at current market prices for 2000-01 has been estimated on the basis of the revisedestimates of GDP at factor cost at current prices for 2000-01 released by the CSO in June 2001.
Table 2.4: Sector-wise Rates of Gross Capital Formation(as percentage of GDP at current market prices)
(1+2+3)* Quick Estimates.@ Provisional.Source: Central Statistical Organisation.
Macroeconomic Balances
2.8 There has been a consolidation of the overall saving-investment balance during the 1990sas compared with the 1980s. The saving-investment gap, which averaged at 1.4 per cent of GDPin the 1990s, narrowed further to 1.0 per cent in 1999-2000. The narrowing of the saving-investment gap in the 1990s has lent stability to the acceleration of growth which occurred in thedecade. On the other hand, accompanying compositional shifts in the public and private saving-investment balances are indicative of incipient fragilities. The saving-investment surplus of theprivate sector declined from 8.0 per cent of GDP in 1998-99 to 7.8 per cent in 1999-2000. At thesame time, the public sector's saving-investment gap widened from 7.2 per cent of GDP to 8.2per cent (Table 2.5).
2.9 The mainstay of the growth process continues to be capital accumulation. In recent years,attention has been drawn to the close association between the trend components of real outputgrowth, and the rates of saving and investment in India. During the 1990s, however, thedeviations of real GDP growth on the one hand, and saving and investment rates on the other,from their respective trend components, have moved in contrasting directions especially in thepost-reform period (Chart II.4). This underscores the need for detailed study on the contributionsof capital accumulation, human capital formation and productivity to the growth process (BoxII.1).
Table 2.5: Macroeconomic Balances
(as percentage of GDP at current market prices)Item 1999-2000* 1998-99@ 1997-98 1994-95 to
1996-97(Average)
1 2 3 4 51. Private Saving-Investment Balance 7.8 8.0 5.7 6.42. Public Saving-Investment Balance -8.2 -7.2 -5.1 -6.03. Net Inflow of resources from abroad 1.0 1.0 1.5 1.44. Errors and omissions 0.6 1.9 2.1 1.8
2.10 Compositional changes in nominal aggregate demand in the second half of the 1990sreveal a weakening of investment demand and a rise in consumption expenditure (Table 2.6).These shifts in demand have implications for the sustainability of growth in the medium-term.The rate of fixed capital formation, both government and private, declined from their levels inthe high growth phase of 1994-97. During the same period, inventory accumulation moved up inrelation to GDP, indicating a deficiency of planned investment demand.
Box II.1Sources of Growth in the Indian Economy
The characteristics of the uneven growth experience of the 1990s -shifts in the pace and variability of growthbetween two halves of the decade, the co-movement of real GDP growth and saving and investment rates, the abilityof the economy to sustain growth at over 5 per cent in spite of a decline in saving and investment rates in the secondhalf, visual evidence of an improvement in the efficiency of capital use gathered from a downward drift in theincremental capital-output ratio (ICOR)-have drawn attention to the need for an empirical verification of the sourcesof growth in the Indian economy. The deceleration in economic activity during 1999-2001 is often ascribed tocompletion of a cyclical catch up following the phase of high expansion in the wake of the institution of structuralreforms. It is important, therefore, to distinguish long-term processes from short-term developments dominated bytransient conditions. The accounting of growth assumes particular relevance in the context of the emergingimperatives for moving to a higher growth path in the medium-term.
Post-World War II development economics has evolved around the central role of capital accumulation in growth.The Harrod-Domar model had a profound influence on development thinking and it was with the seminalcontributions to growth theory in mid-1950s in the neoclassical framework that there was an explicit appreciation ofsupply side influences on the growth process. Since then, there has been wide acceptance of the view that physicalinputs explain only a part of growth, the residual being attributed to gains from disembodied technical progress[total factor productivity (TFP)]. Despite providing a convenient framework for growth accounting, the restrictiveand often unrealistic assumptions of constant returns to scale of production and neutral technical progress have beenmajor deterrents to the empirical application of the neo-classical approach. In part, this provoked the evolution ofendogenous growth theory towards the end of the 1980s. Attention came to be focused on continuous advances inhuman skills and technology upgradation through research and development along with factor accumulation tooffset the dampening effect of diminishing returns and sustain economic growth. The new growth theories focus on
endogenous determination of technical change, which means endogenous determination of sources of growth.
Cross-country studies relating to developing countries suggest that capital accumulation explains around 60-70 percent of per capita growth, increases in education and human capital account for another 10-20 per cent and theremaining 30-10 per cent is due to improvements in TFP. Studies conducted on Asian countries indicate that TFPcontributed a substantial share of output growth, accounting for about 50-55 per cent of growth in Hong Kong,Singapore, Korea and Taiwan. On the other hand, the assumption of constant returns in these studies has beenquestioned. The broad inference emerging from these diverse findings is that growth experience is country-specific.Each country's growth performance depends on a number of conditional factors including natural endowments,macroeconomic stability, institutional and social structures, outward orientation and state of financial development.This has supported the belief that while capital accumulation is critical to rapid growth, it is only a necessarycondition.
In India, real GDP growth accelerated from 2.9 per cent in the 1970s to 5.8 per cent in the 1980s and further to 6.4per cent in the 1990s (excluding 1990-91 and 1991-92). This remarkable improvement in growth performance wasassociated with a substantial decline in variability of output growth. The rate of growth of net fixed capitalaccumulation increased from 3.6 per cent in the 1970s to 4.2 per cent in the 1980s and further to 5.3 pecent in the1990s with a distinct decline in variability in the 1990s. The growth in employment, however, declined over theperiod with some increase in variability in the 1990s. These stylized facts suggest an increasing substitution ofcapital for labour in the growth process particularly in the recent years, a reduction in the vulnerability of the growthprocess to short-run instability and a growing contribution of productivity to growth. Recent studies havecorroborated the evidence of positive rates of growth of productivity in the manufacturing sector, comparingfavourably with those of the east-Asian economies, particularly since the second half of the 1980s. Some studieshave also highlighted the existence of increasing returns to scale of production, with gains in factor productivityattributed to infrastructure, human capital accumulation and expansion in external trade. The increasing adaptabilityof newer production technologies, expansion of market size being facilitated by the dismantling of barriers andoutward orientation of the economy are factors attributed to the existence of increasing returns to scale of productionin the Indian economy.
A growth accounting exercise for India was conducted by estimating an economy-wide production function for theperiod 1970-2000. Output was represented by GDP at factor cost at constant prices, capital accumulation by netfixed capital stock and human capital was proxied by employment in the organised sector. First stage estimations ina simple ordinary least squares procedure indicated serious biases arising from : i) non-stationarity in the variables(all the variables have unit roots; the same order of integration, however, indicates the possibility of exploring for along-run co-integrating relationship between them), ii) presence of autocorrelation, and iii) evidence of a clearstructural break in the growth process between the 1970s and the rest of the period, rendering the estimation of asingle production function for the full period 1970-2000 invalid. Accordingly, the production function was re-estimated for a truncated period, i.e., 1982-2000 (to avoid the structural break) by a modified OLS procedure whichcorrects for collinearity in a semi-parametric manner and yields unbiased estimates of a single co-integratingrelationship between the variables.
The results provide robust estimates of the coefficients of capital and labour at 0.7 and 1.2 respectively. The sum ofthe two coefficients being greater than unity indicates the existence of increasing returns to scale which is confirmedby likelihood ratio tests and corroborated by other studies in the Indian context. The contribution of labourproductivity to growth accounts for about 37 per cent. The near unit elasticity of output with respect to laboursuggests that in the absence of capital accumulation, the growth of the economy would converge to the rate ofgrowth of the labour force, an approximation of the natural rate of growth of the Indian economy.
Capital accumulation is the principal source of growth, contributing about 59 per cent to the growth process.Consequently, strategies for stepping up the growth trajectory in the medium-term would hinge around substantialincreases in capital accumulation along with strategies to enhance factor productivity. This, in turn, would dependupon efforts to mobilise considerably higher saving rates than achieved so far.
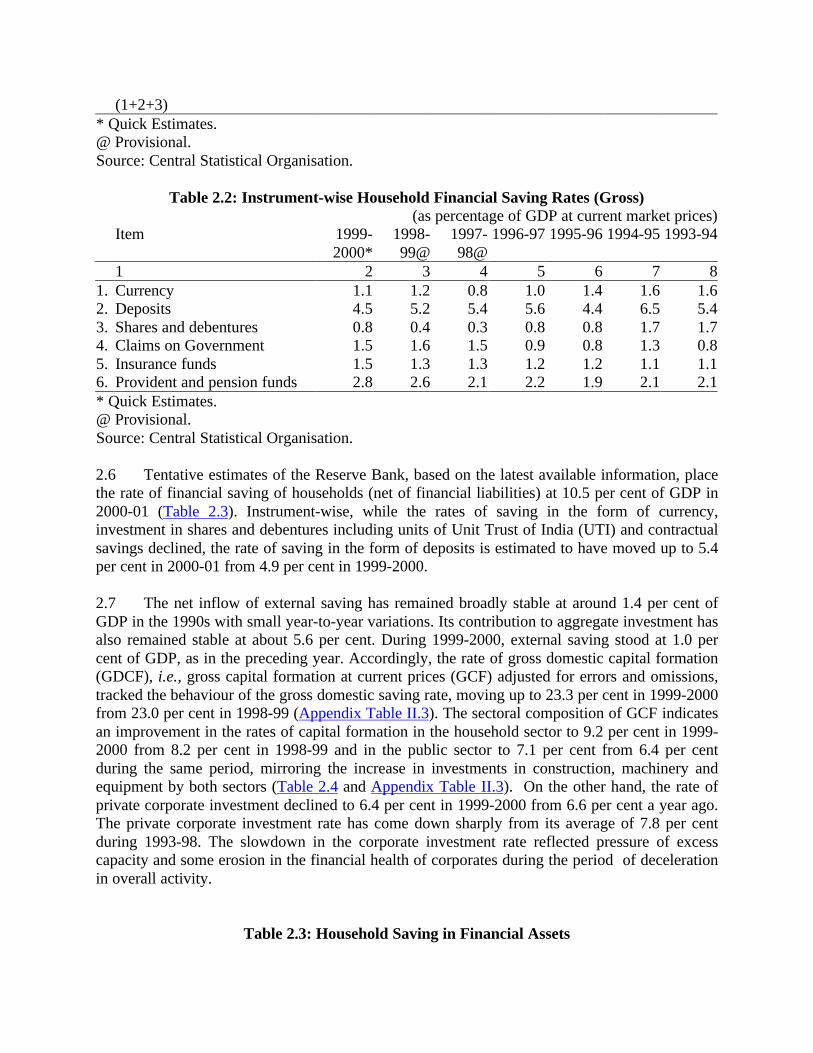
The contribution of productivity to growth has been about 4 per cent, varying significantly from negativecontributions in the 1980s to positive contributions in the 1990s. Importantly, declines in productivity havesubstantially dragged down overall growth and improvements in the contribution of productivity to growth haveplayed a critical role in driving real growth above its long-term trend. The results, therefore, emphasise therelatively small but key role of productivity in accelerating growth.
The process of growth in India depends upon a number of underlying conditions. It is necessary, therefore, to carrygrowth accounting exercises further to identify the factors which enable growth by promoting investment in physicaland human capital, by improving the efficiency of production and by encouraging technological progress. Inaddition, it is necessary to recognize the specific obstacles to growth in India - delays and inadequacies in fiscaladjustments, the tightening infrastructural constraint, continuing high levels of poverty, rigidities in the labourmarket, capital and technology gaps in the agricultural sector. In all these areas, an appropriate mix ofmacroeconomic polices could have a catalytic role to play.
References
1. Ahluwalia, I. Judge (1991), Productivity and Growth in Indian Manufacturing, Oxford University Press.
2. Dhal, S.C. (1999), "Potential Economic Growth in India: Viable Alternatives to Time Series Approaches",Reserve Bank of India Occasional Papers, 20(3).
3. International Monetary Fund (2000): World Economic Outlook, May.
4. Romer, P (1986),"Increasing Returns and Long Run Growth", Journal of Political Economy, 98, No.5.
5. Sahoo, S. and K.K. Saxena (1999), "Infrastructure and Economic Development: Some Empirical Evidence",Indian Economic Journal, Vol. 47(2), October-December.
6. Solow, R.M. (1956), "A Contribution to the Theory of Economic Growth," Quarterly Journal of Economics70(1), 65-94.
7. Trivedi, Pushpa, Anand Prakash and David Senate (2000), “Productivity of the Indian Manufacturing Sector:1973-74 to 1994-95”, Development Research Group Study, No.20, Reserve Bank of India.
8. Vasudevan, A., B. K. Bhoi and S. C. Dhal (1999), “Inflation and Optimal Growth: Is there a Gateway toNirvana?”, in Fifty Years of Development Economics, (eds.) A. Vasudevan, D. M. Nachane and A. V. Karnik,Himalaya Publishing House, New Delhi.
Table 2.6: Demand Distribution of Nominal Gross Domestic Product(as percentage of GDP at current market prices)
Item 1999-2000* 1998-99@ 1997-98 Average1994-95 to
1996-971 2 3 4 5
1. Private Final Consumption 64.5 64.6 63.7 64.92. Government Final Consumption 12.9 12.0 11.3 10.73. Private Fixed Capital Formation 14.9 15.0 15.4 15.34. Government Fixed Capital Formation 6.4 6.3 6.4 7.85. Change in Stocks 1.4 -0.1 1.2 1.06. Exports net of Imports -1.3 -1.7 -1.2 -0.9
* Quick Estimates.@ Provisional.Source: Central Statistical Organisation.
2.11 Consumption expenditure was the principal factor contributing to nominal aggregatedemand. The rate of private final consumption expenditure declined marginally in 1999-2000 inrelation to the period 1994-97. On the other hand, the rate of government final consumptionincreased by more than 2.0 percentage points over the level in the high growth phase. Thus, theimprovement in the rate of final consumption was mainly due to a rise in government finalconsumption.
2.12 In terms of growth in real effective demand, the components exhibited contrastingbehaviour. The growth rate of final consumption expenditure which averaged at 6.0 per centduring 1994-97 moved down to an average of 5.6 per cent during 1997-2000. Private finalconsumption decelerated from an average growth of 6.3 per cent during1994-97 to an averagegrowth of 4.3 per cent during 1997-2000. The growth rate of government final consumptionexpenditure, on the other hand, moved up sharply from an average of 4.6 per cent during 1994-97 to an average growth of 12.6 per cent during 1997-2000. Annual growth rates of real grossdomestic capital formation fluctuated widely during 1995-96 and 1998-99. In 1999-2000,although there was a significant improvement, the growth in real GDCF was lower than theaverage rate of 11.0 per cent for 1994-97. The growth rate of public sector capital formationaccelerated from 5.1 per cent in 1998-99 to 19.0 per cent in 1999-2000 and that of private sectorGDCF accelerated from 1.6 per cent to 15.2 per cent resulting in the acceleration of the overallGDCF growth rate from 2.3 per cent to 9.4 per cent over the same period (Table 2.7).
Table 2.7: Growth in Select Sources in Real Effective Demand #(Per cent)
* Quick Estimates. @ Provisional.# Based on select disposition of real GDP at market prices.+ Adjusted for errors and omissions.++ Unadjusted for errors and omissions.Source: Central Statistical Organisation.
AGRICULTURE
2.13 The performance of agriculture remained subdued in 2000-01, with real GDP growthfrom agriculture and allied activities at 0.2 per cent during 2000-01 lower than that of 0.7 percent during 1999-2000. This was substantially lower than the growth of 7.1 per cent achievedduring 1998-99 (Appendix Table II.1). The share of agriculture and allied activities in GDPdecreased to 24.0 per cent in 2000-01 and 25.2 per cent in 1999-2000 from 26.6 per cent in1998-99. Its relative contribution to real GDP growth dipped sharply to 0.9 per cent during 2000-01 and 2.8 per cent during 1999-2000 from 28.5 per cent during 1998-99. The inter-quartermovements in these growth rates in agriculture and allied activities have been somewhat volatilewith a downward drift (Chart II.5 and Appendix Table II.2).
2.14 Agricultural production declined sharply during 2000-01. The index of agriculturalproduction registered a steep fall of 6.5 per cent in 2000-01 on top of a decline of 0.7 per cent inthe previous year (Appendix Table II.5). The fall in crop production in 2000-01 was the result ofthe sharp decline in foodgrains (6.3 per cent) as well as non-foodgrain crops - mainly oilseedsand cotton. The country received 92 per cent of the Long Period Average (LPA) rainfall duringSouth-West monsoon 2000, with highly skewed spatio-temporal distribution of rainfall coupled
with inadequate precipitation resulting in drought conditions in the States of Chattisgarh,Gujarat, Madhya Pradesh, Rajasthan and Western Orissa. The drought conditions also had anadverse impact on the production of non-foodgrains and rabi agricultural production -mainlywheat - as it resulted in shrinking of productive area and consequent production losses. Indianagriculture continues to suffer from natural shocks, technology-gaps, low investment, andinadequate availability of quality inputs. During the second half of 1990s the volatility in thegrowth of agricultural production has increased (Chart II.6). The combination of these factorshas led to a deceleration in the average growth of all crop index to 2.3 per cent during the 1990sfrom 5.2 per cent during the 1980s.
2.15 The production of total foodgrains declined to 196.1 million tonnes in 2000-01 from thepeak of 208.9 million tonnes attained in 1999-2000. The fall was on account of rice (3.2 milliontonnes), wheat (7.1 million tonnes), coarse cereals (0.3 million tonnes) and pulses (2.3 milliontonnes). Production of rice and wheat declined to 86.3 million tonnes and 68.5 million tonnes in2000-01 from their respective peak levels of 89.5 million tonnes and 75.6 million tonnesachieved in the previous year. The decline in rice production was mainly due to a decline in thearea coverage in West Bengal, which had experienced severe moisture stress at the time ofsowing. The decline in wheat output may be attributed to a reduction in area under the crop inMadhya Pradesh, Maharashtra and Rajasthan. Lower production of pulses was due to a decline inproduction in the major pulses producing States of Madhya Pradesh and Rajasthan. These Statesalso reported substantial fall in their output of coarse cereals.
2.16 The index of non-foodgrains (base: triennium ending 1981-82=100) registered a fall of6.6 per cent in 2000-01 as compared with a fall of 4.8 per cent in the previous year. The declinein non-foodgrains output was mainly due to fall in the production of oilseeds, cotton and jute andmesta. Oilseeds output declined in the past two years and the level of 18.2 million tonnesrecorded in 2000-01 was the lowest in the past eleven years. The production of soyabean,rapeseed and mustard recorded substantial declines because of widespread drought in theoilseeds growing States of Chhattisgarh, Madhya Pradesh and Rajasthan.
The production of groundnut at 6.4 million tonnes, however, recovered to some extent from the14-year low of 5.3 million tonnes recorded in the previous year - despite the drought conditions
experienced in Gujarat. Cotton registered a sharp decline over its output level in the previousyear, while sugarcane, tea and coffee recorded increases in production. Sugarcane output, whichhas been increasing continuously since 1996-97, scaled yet another peak in 2000-01 at 300.3million tonnes (Table 2.8).
2.17 During 2000-01, the fall in rabi output was much sharper than that in the kharif output.The kharif foodgrains production showed a fall of 1.7 per cent to 103.1 million tonnes, whereasthe rabi foodgrains fell by 10.6 per cent to 93.0 million tonnes in 2000-01 from 104.0 milliontonnes in 1999-2000. Consequent upon the decline in rabi foodgrains production, the share ofrabi foodgrains to total foodgrains, which had been generally rising during the past two decades,declined in 2000-01 (Chart II.7).
+ Based on the Index of Agricultural Production with base: triennium ending 1981-82=100.++ For nine oilseeds out of eleven in all.@ Million bales of 170 kg. each.# Million bales of 180 kg. each.* Million kg. and data for tea on a calendar year basis.Note: Index of Agricultural Production is based on the latest production estimates (including thelatest production figures of Tea, Coffee and other crops.)
2.18 Despite the lower output of rice and wheat during 2000-01, total procurement offoodgrains reached a new peak at 36.5 million tonnes, recording an increase of 16.0 per cent overthat of 31.4 million tonnes in 1999-2000 (Appendix Table II.6). On the other hand, the total off-take of rice and wheat during 2000-01 at 18.0 million tonnes was lower by 22.1 per cent than thatof 23.1 million tonnes during the corresponding period of the previous year. This decline may beattributed to lower off-take under the Targeted Public Distribution System (TPDS) coupled withOpen Market Sales Scheme (OMS), even as there was increased off-take under Other WelfareSchemes (OWS). The sharp decline in the total off-take during 2000-01 was largely reflectedunder the TPDS category. While the off-take under OWS picked up significantly by 3.55 milliontonnes, the OMS during 2000-01 was very low at 1.25 million tonnes as compared with 4.55million tonnes in 1999-2000. Hence, even a two-and-a-half times increase in the off-take underOWS to 5.0 million tonnes in 2000-01 could not off-set the decline in total off-take under theTPDS category. The sharp rise in procurement and lower off-take resulted in a growth of 55.6per cent in the stocks of foodgrains to 45.0 million tonnes at end-March 2001 from 28.9 milliontonnes at the end-March 2000. The addition of 16.1 million tonnes of foodgrains in 2000-01 hasexpanded the buffer stock to almost treble its normative level. However, the per capita netavailability of foodgrains per day declined from a high of 505.5 grams in 1997 to 470.4 grams in1999 and further to 458.6 grams in 2000. Concerted efforts are necessary to bring down thequantum of foodgrains through encouraging off-take from the PDS, promoting open market salesincluding exports and increasing distribution through other welfare schemes.
2.19 Procurement of rice and wheat during the first quarter of 2001-02 (up to June 29) at 23.2million tonnes was higher by 28.2 per cent than 18.1 million tonnes procured during thecorresponding period of the previous year. The procurement of rice during the same period at 2.7million tonnes was higher than that of 1.9 million tonnes during the corresponding period of2000-01. The procurement of wheat at 20.5 million tonnes was higher by 26.7 per cent than 16.2million tonnes procured in the corresponding period of the previous year. The increasedprocurement of wheat during 2001-02, despite a significant fall in the production of wheat in2000-01, can be attributed to the increase in Minimum Support Price (MSP). Total off-take ofrice and wheat during the first quarter of 2001-02 aggregated 5.1 million tonnes, which washigher by 28.3 per cent as compared with 4.0 million tonnes during the corresponding period ofthe previous year. Total stocks of foodgrains at end-June 2001 stood at 62.0 million tonnes,
higher by 46.7 per cent, as compared with 42.3 million tonnes at the end of June 2000.
2.20 Direct institutional finance to agriculture has been slowing down in recent years. Theaverage growth in loans outstanding decelerated to 13.6 per cent during the years 1990-99 ascompared with 14.1 per cent growth recorded in the corresponding period of the 1980s.Advances, in terms of disbursements, also decelerated to 8.5 per cent per annum during the1990s from that of 15.8 per cent per annum recorded in the corresponding period of the 1980s.Moreover, during the 1990s, there were contrasting growth profiles in various sources of financefor agriculture. Direct finance to marginal farmers (land holdings up to one hectare) grew at theslowest pace of 12.1 per cent, followed by the credit disbursed to small farmers (land holdingsbetween one and two hectares) at 15.7 per cent per annum. Loans advanced to the large farmers(land holding of above two hectares) grew at the faster pace of 16.1 per cent between 1990-91and 1998-99.
2.21 Various studies show that with the existing irrigation potential and the current croppingintensity co-efficient with respect to irrigation, the cropping intensity could be raised up to 149.0as against the current level of 134.2.
2.22 Another area of concern is the declining level of capital formation in Indian agriculture.The ratio of public sector capital formation in agriculture to GDP has fallen to 0.4 per cent in1998-99 from 1.7 per cent in 1980-81. Moreover, the rate of gross capital formation inagriculture in relation to GDP originating in agriculture has declined to 7.4 per cent in 1999-2000from 8.9 per cent in 1980-81. The share of capital formation in agriculture and allied activities inGross Capital Formation (GCF) in the country has also declined substantially from 20.4 per centin 1951-52 to 6.2 per cent in 1995-96, before recovering to 8.0 per cent in 1999-2000 (ChartII.8).
2.23 The inadequacy of new capital formation has slowed down the pace and pattern oftechnological change in agriculture with adverse effects on productivity. In this context, thereare apprehensions that the boost in output from subsidy-stimulated use of at the expense ofdeterioration in the aquifers and soil - an environmentally unsustainable approach - which tosome extent explains the phenomena of rising costs and slowing growth and productivity in
agriculture.
INDUSTRY
2.24 In terms of the index of industrial production (IIP), the growth of industrial output sloweddown to 5.1 per cent during 2000-01 from 6.7 per cent during 1999-2000 reflecting, inter alia,low agricultural production, subdued performance of infrastructure (especially power), lowinvestment activity and the presence of excess capacity in many industries (Appendix TableII.7). The slowdown in IIP growth was persistent throughout the year, with brief upturns inOctober and November 2000. The monthly profile of the IIP during 2000-01 and 2001-02 (up toJune) exhibited the general seasonal production behaviour (Chart II.9). The sharp deceleration inproduction to 3.3 per cent during the last quarter of 2000-01 from 5.9 per cent during the thirdquarter, however, drove down the growth in IIP for the year as a whole. The sectoral profileshowed a pronounced deceleration in manufacturing to 5.4 per cent during 2000-01 from 7.1 percent during 1999-2000 as well as in electricity to 4.0 per cent from 7.3 per cent in the precedingyear. The mining and quarrying sector, on the other hand, improved its growth to 3.7 per centfrom 1.0 per cent during 1999-2000.
2.25 The deceleration in industrial activity continued during the first quarter of 2001-02 withthe growth rate of IIP at 2.1 per cent, substantially below the growth rate of 6.1 per centregistered during April-June, 2000. During the current year, the slowdown was recorded in allthe three sectors, viz., mining and quarrying, manufacturing and electricity which witnessedgrowth rates of 0.2 per cent (from 3.6 per cent), 2.3 per cent (from 6.4 per cent) and 2.0 per cent(from 5.1 per cent), respectively, as compared with the corresponding period of the previousyear.
2.26 During 2000-01, the real GDP growth originating from industry decelerated to 5.3 percent from 6.1 per cent during 1999-2000 (Appendix Table II.1). While the share of industryremained at around 21.8 per cent during 1998-99 to 2000-01, its relative contribution to the realGDP growth moved up sharply from 9.8 per cent during 1998-99 to 20.8 per cent during 1999-2000 and 22.3 per cent during 2000-01. Quarter-wise industrial GDP growth recovered to 6.1 percent in the third quarter of 2000-01 after dipping to 5.4 per cent in the second quarter from 6.6
per cent in the first quarter; it, however, dipped to 3.2 per cent in the fourth quarter (AppendixTable II.2 and Chart II.10).
Manufacturing Sector
2.27 The manufacturing sector, with a weight of 79.36 per cent in IIP contributed to more than86.1 per cent to IIP growth in 2000-01. At a disaggregated level, out of 17 two-digit industrygroups in the manufacturing sector, positive growth was recorded in 14 groups (68.33 per centcombined weightage in the IIP) as against 12 groups with a weight of 64.97 per cent in 1999-2000. In this category, seven groups (with weightage of 26.01 per cent) registered acceleratedgrowth rates (9 groups in 1999-2000). Seven industry groups (42.32 per cent weightage)recorded decelerated growth (3 groups in 1999-2000) while three other groups (weight being11.03 per cent) recorded negative growth rates (5 groups in 1999-2000). The industry groupssuch as 'wool, silk and man-made fibre textiles', 'leather and leather and fur products', 'basicchemicals and chemical products', 'machinery and equipment other than transport equipment','cotton textiles', 'basic metal and alloy industries' and 'non-metallic mineral products' which hadshown accelerated growth during 1999-2000 recorded either lower or negative growth ratesduring 2000-01 (Appendix Table II.8 and Chart II.11). The industry groups, such as 'metalproducts and parts', 'rubber, plastic, petroleum and coal products', 'other manufacturingindustries', 'wood and wood products, furniture and fixtures' and 'jute and other vegetable fibretextiles (except cotton)' improved their performance in 2000-01 from absolute declines during1999-2000. 'Beverages, tobacco and related products', 'wool, silk and man made fibre textiles','paper and paper products and printing, publishing and allied industries', 'leather and leather &fur products', 'basic chemicals and chemical products (except products of petroleum and coal)'‘non-metallic mineral products’ and ‘metal products and parts (except machinery andequipment)’ have been the high performance industries recording growth rates of above 5 percent during four years out of the five year period, 1996-97 to 2000-01 (Appendix Table II.9).
2.28 During the first quarter of 2001-02, twelve (65.20 per cent weight in IIP) out of seventeentwo-digit industry groups recorded positive growth, the same number (but with 73.42 per centweight in IIP) in the previous year. 'Other manufacturing industries' and ‘rubber, plastic,petroleum and coal products’ achieved high growth rates of 13.7 per cent and 9.6 per cent,
respectively. Five industry groups recorded negative growth rates during 2001-02 (up to June)with the decline sharp in respect of 'metal products and parts (except machinery and equipment)’and 'wood and wood products, furniture and fixtures'.
Use-based Classification
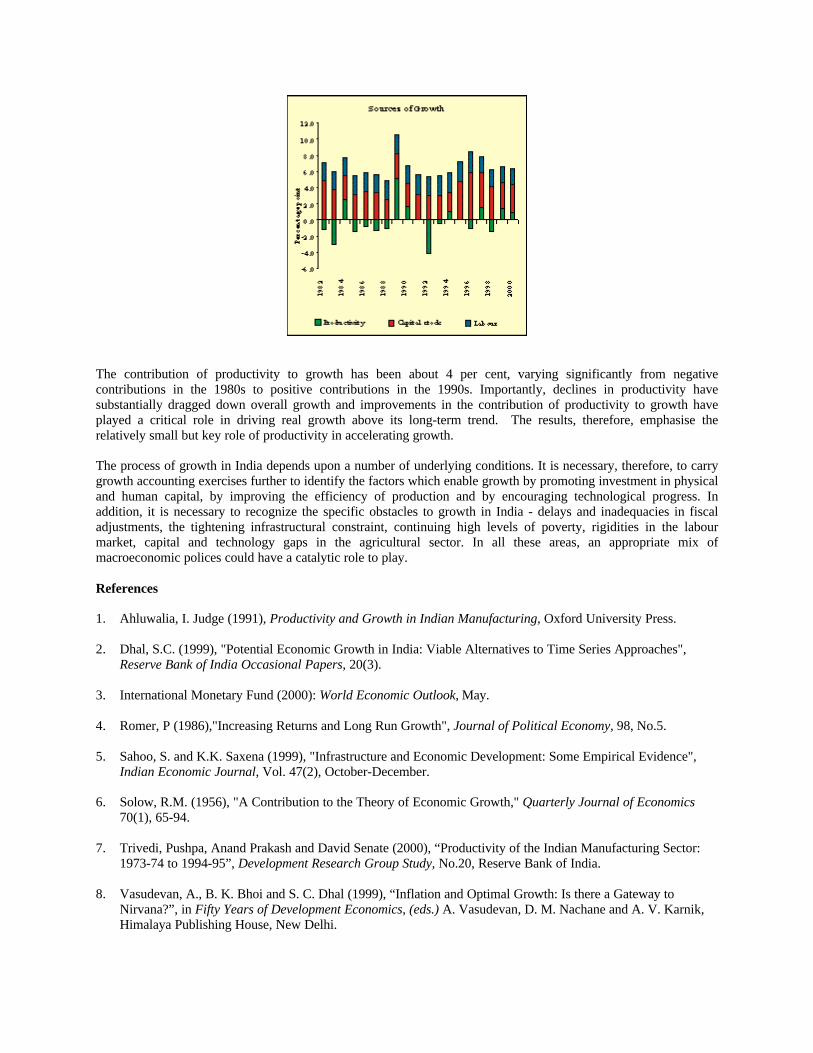
2.29 The use-based classification of the IIP indicated that the poor performance ofintermediate, basic and capital goods sectors affected overall industrial growth. The consumergoods sector recorded a higher growth of 8.0 per cent during 2000-01 as against 5.7 per centduring 1999-2000, while the growth of the consumer durables sector moved up marginally. Theconsumer non-durables sector grew sharply by 5.8 per cent during 2000-01, higher than that of3.2 per cent recorded during 1999-2000 (Appendix Table II.10 and Chart II.12).
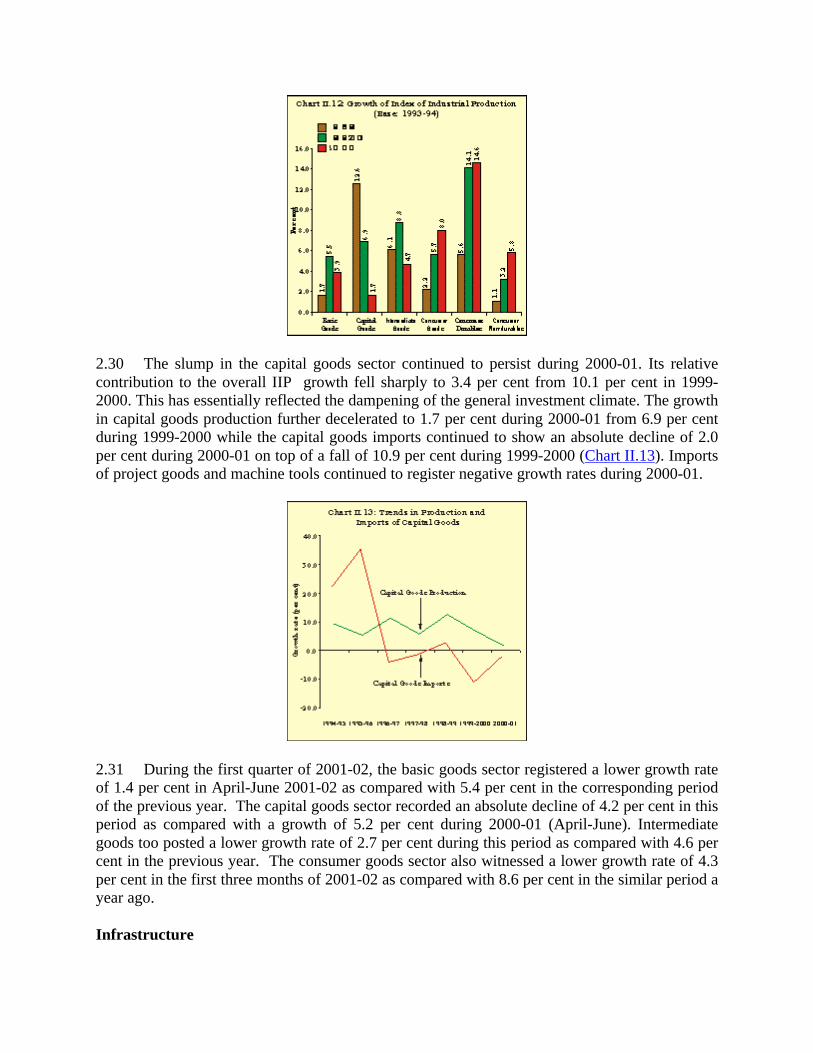
2.30 The slump in the capital goods sector continued to persist during 2000-01. Its relativecontribution to the overall IIP growth fell sharply to 3.4 per cent from 10.1 per cent in 1999-2000. This has essentially reflected the dampening of the general investment climate. The growthin capital goods production further decelerated to 1.7 per cent during 2000-01 from 6.9 per centduring 1999-2000 while the capital goods imports continued to show an absolute decline of 2.0per cent during 2000-01 on top of a fall of 10.9 per cent during 1999-2000 (Chart II.13). Importsof project goods and machine tools continued to register negative growth rates during 2000-01.
2.31 During the first quarter of 2001-02, the basic goods sector registered a lower growth rateof 1.4 per cent in April-June 2001-02 as compared with 5.4 per cent in the corresponding periodof the previous year. The capital goods sector recorded an absolute decline of 4.2 per cent in thisperiod as compared with a growth of 5.2 per cent during 2000-01 (April-June). Intermediategoods too posted a lower growth rate of 2.7 per cent during this period as compared with 4.6 percent in the previous year. The consumer goods sector also witnessed a lower growth rate of 4.3per cent in the first three months of 2001-02 as compared with 8.6 per cent in the similar period ayear ago.
Infrastructure
2.32 The performance of infrastructure industries during 2000-01 deteriorated as compared withthe previous year. The composite index of six infrastructure industries, with a combined weightof 26.68 per cent in IIP (base: 1993-94=100), recorded a much lower growth of 5.0 per cent in2000-01 as against 9.1 per cent in the previous year. During this period, electricity, steel, coal,cement and petroleum refinery products witnessed decelerated/negative growth while crudepetroleum registered marginal improvement (Appendix Table II.11). Electricity, a criticalinfrastructural input, registered a substantially lower growth of 4.0 per cent than the previousyear's growth of 7.2 per cent. Steel production exhibited similar behaviour while cementrecorded an absolute decline in output as compared with an increase of 14.3 per cent in 1999-2000. In all the infrastructure industries, with the exception of crude petroleum, output fell shortof targets (Table 2.9).
Table 2.9: Targets and Achievements of Infrastructure Industries
Sector Unit 2000-01 P 1999-2000Target Achieve- Gap Target Achieve- Gap
Source: Ministry of Statistics and Programme Implementation, Government of India.
2.33 The poor performance of infrastructure industries observed since November 2000continued in the first quarter of 2001-02 with a growth of barely 0.8 per cent as compared withthat of 8.2 per cent in the same period of the previous year. Electricity, cement and petroleumrefinery products decelerated to 2.0 per cent, 2.4 per cent and 6.4 per cent, respectively, ascompared with 4.8 per cent, 3.6 per cent and 34.6 per cent in the corresponding period of theprevious year. On the other hand, steel, coal and crude petroleum recorded negative growth ratesof 0.2 per cent, 0.8 per cent and 4.5 per cent, respectively, during the same period as comparedwith 12.2 per cent, 11.3 per cent and -2.6 per cent recorded in the same period last year.
Mergers and Acquisitions (M&As)
2.34 M&As were reported for 1,445 companies in 2000-01, marginally lower than 1,492companies in 1999-2000. The value of deals in these M&As at Rs. 38,054 crore during 2000-01was lower than Rs. 50,085 crore reported in the preceding year. In 2000-01, mergers occurred in
the sectors of transport and communication, food products, finance, computer software,chemicals & plastics and drugs and pharmaceuticals. Cross-border mergers & acquisitions havebeen reported mainly in the information technology sector. Within the ambit of the evolvingcompetition policy, both horizontal and vertical mergers among firms would be covered byCompetition Law. Mergers involving large enterprises exceeding a prescribed threshold in assetsvalue and turnover would come under the scrutiny of a Competition Commission of India. TheParliament has already passed the Companies (Amendment) Act 2000 thereby underlying thesignificance and necessity of corporate governance in the wake of M&As.
Small Scale Industries
2.35 Small scale industry (SSI) is an important segment of the economy, contributingsubstantially in the form of production, employment and exports. The total number of units in theSSI sector increased from 4.2 lakh units as at end-March 1974 to 31.2 lakh units as at end-March1999 and further to 32.3 lakh units as at end-March 2000, while the value of production (atcurrent prices) of these units increased from Rs.7,200 crore to Rs.5,27,515 crore and further toRs.5,87,000 crore during the same period. Employment in the SSI sector increased from 39.7lakh persons to 171.6 lakh persons and further to 178.5 lakh persons during the above period.Exports from the sector increased from Rs.393 crore in 1973-74 to Rs.48,979 crore in 1998-99and further to Rs.53,975 crore in 1999-2000. A major problem faced by SSIs is the large scaleprevalence of industrial sickness.
2.36 Considering the structure of the SSI sector, the Government continued its efforts toprovide further support and created an exclusive new Ministry for Small scale Industries andAgro Rural Industries (SSI and ARI) during the year 1999-2000. Furthermore, a comprehensivepolicy package on the SSI and tiny sector was announced on August 30, 2000 which included,inter alia, raising the exemption for excise duty limit from Rs.50 lakh to Rs.1 crore to improvecompetitiveness of the small scale sector, enhancing the limit of investment in industry relatedservice and business enterprise from the present level of Rs.5 lakh to Rs.10 lakh and conductingthe third census of small scale industries after a gap of 12 years. This census would also coversickness and its causes. In order to address the problem of collateral faced by the SSI units and toencourage technology upgradation, two new schemes were introduced. The Credit GuaranteeFund (Scheme) for SSI was introduced to provide guarantee for loans up to Rs.25 lakh extendedby commercial banks and others without any collateral including third party guarantee while theCredit Linked Capital Subsidy Scheme was introduced for technology upgradation. Credit flowsto the SSI sector were also enhanced by increasing the limit for composite loan from Rs.10 lakhto Rs.25 lakh. Furthermore, the Reserve Bank constituted a committee to monitor the flow ofcredit to SSIs.
2.37 The guidelines issued by the Reserve Bank in May 1999 for constitution of SettlementAdvisory Committees for compromise of chronic NPA accounts were modified in July 2000 toprovide for one-time settlement of dues mainly to benefit the sick units in SSI sector. In order toreview the existing guidelines regarding rehabilitation of sick units and making them transparentand non-discretionary, the Reserve Bank set up a Working Group in November 2000.
SERVICES
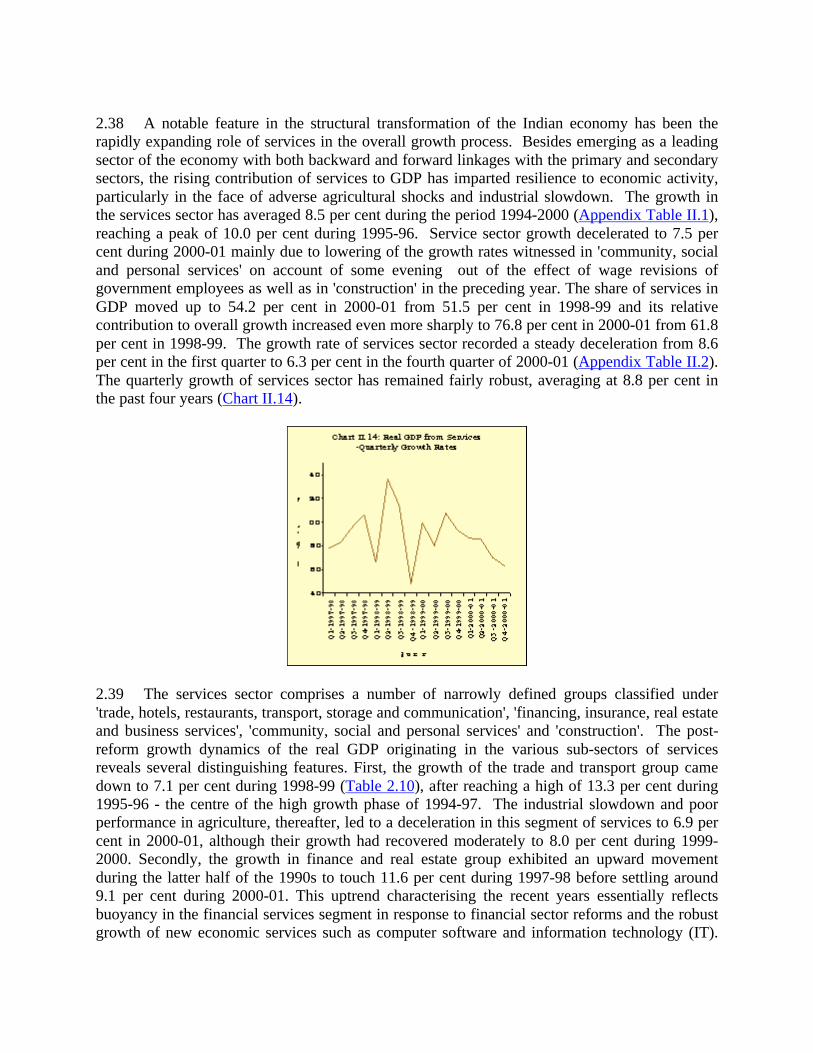
2.38 A notable feature in the structural transformation of the Indian economy has been therapidly expanding role of services in the overall growth process. Besides emerging as a leadingsector of the economy with both backward and forward linkages with the primary and secondarysectors, the rising contribution of services to GDP has imparted resilience to economic activity,particularly in the face of adverse agricultural shocks and industrial slowdown. The growth inthe services sector has averaged 8.5 per cent during the period 1994-2000 (Appendix Table II.1),reaching a peak of 10.0 per cent during 1995-96. Service sector growth decelerated to 7.5 percent during 2000-01 mainly due to lowering of the growth rates witnessed in 'community, socialand personal services' on account of some evening out of the effect of wage revisions ofgovernment employees as well as in 'construction' in the preceding year. The share of services inGDP moved up to 54.2 per cent in 2000-01 from 51.5 per cent in 1998-99 and its relativecontribution to overall growth increased even more sharply to 76.8 per cent in 2000-01 from 61.8per cent in 1998-99. The growth rate of services sector recorded a steady deceleration from 8.6per cent in the first quarter to 6.3 per cent in the fourth quarter of 2000-01 (Appendix Table II.2).The quarterly growth of services sector has remained fairly robust, averaging at 8.8 per cent inthe past four years (Chart II.14).
2.39 The services sector comprises a number of narrowly defined groups classified under'trade, hotels, restaurants, transport, storage and communication', 'financing, insurance, real estateand business services', 'community, social and personal services' and 'construction'. The post-reform growth dynamics of the real GDP originating in the various sub-sectors of servicesreveals several distinguishing features. First, the growth of the trade and transport group camedown to 7.1 per cent during 1998-99 (Table 2.10), after reaching a high of 13.3 per cent during1995-96 - the centre of the high growth phase of 1994-97. The industrial slowdown and poorperformance in agriculture, thereafter, led to a deceleration in this segment of services to 6.9 percent in 2000-01, although their growth had recovered moderately to 8.0 per cent during 1999-2000. Secondly, the growth in finance and real estate group exhibited an upward movementduring the latter half of the 1990s to touch 11.6 per cent during 1997-98 before settling around9.1 per cent during 2000-01. This uptrend characterising the recent years essentially reflectsbuoyancy in the financial services segment in response to financial sector reforms and the robustgrowth of new economic services such as computer software and information technology (IT).
While the new series of national accounts includes the value addition in the computer softwaresegment in this group, attention has recently focused on an accurate assessment of the size ofthese service industries in GDP and adequate coverage of the 'new economy' in the nationalaccounts (Box II.2). Thirdly, the spurt experienced in the growth in 'community, social andpersonal services' to 11.8 per cent during 1999-2000 from 6.3 per cent during 1996-97 was onaccount of revision in wages and salaries in public administration and defence. Growth in thissegment came down to 7.8 per cent during 2000-01. The acceleration of growth in theconstruction services segment from 2.1 per cent during 1996-97 to 10.2 per cent during 1997-98reflects the response of real activity to recent policy initiatives. The growth in this segmentevened out somewhat to 8.1 per cent during 1999-2000 but is estimated to have decelerated to5.5 per cent in 2000-01 (Chart II.15 and Table 2.10).
Box II.2New Economy and National Accounts
In the process of structural transformation of the economy, one of the challenges facing the compilation of nationalaccounts statistics is the proper assessment and measurement of services which are not associated with tangibleoutput and where the process of production and consumption often takes place at the same time. The appropriateaccounting of the recent information technology revolution (IT, i.e., computer hardware, software andcommunication equipment) has become even more challenging on account of the following issues.
First, the new economy segment is partly covered under the contribution of the industrial sector (hardware, etc.) andpartly under services sector (software services). Secondly, as the technological advancement in computers is oftenreflected in the dramatic fall in their prices with a consequent substitution of computer services for other inputs ofthese products, the appropriate measurement of impact of computer related innovations in national accounts isrendered difficult. Construction of a base for benchmarking quality and price changes for IT products, in general,and computers, in particular, is also difficult because of the inherent problems of treatment of depreciation in theseproducts. Thirdly, a proper assessment of the total contribution of IT to the overall real economic activity wouldalways be difficult as the technological progress in this sector benefits the economy not only in terms of the outputof this sector but also on account of spillover benefits externalised across a wide heterogeneous spectrum of theother economic activities.
The National Accounts Statistics (NAS) in India presently do not provide any clear segregation of the new (or IT)economy in terms of either hardware or software activities. The production of hardware forms part of manufacturingat the 2-digit level National Industrial Classification (NIC) because of the tangible nature of its production, butwithout any proper estimation of the value added from the informal sector. The Annual Survey of Industries (ASI)covers the 'manufacture of computer and computer based system' under the 3-digit NIC and these production figuresare used in the NAS for the estimation of the GDP originating in hardware production. The contribution of thesoftware sub-sector to GDP is a part of the overall business services that form a part of 'real estate, ownership ofdwelling, legal and business services' sector of the national accounts. The value-added per person and number ofpersons employed are used for estimating the contribution of the segment of business services. The estimates areprepared at constant prices and then estimates at current prices are obtained by superimposing the price effect.
References
1. Central Statistical Organisation (2001), Draft National Product Classification (Services Sector), New Delhi.
2. (2000), National Accounts Statistics, New Delhi.
3. Jorgenson, D.W. and K. Stiroh (1995), "Computers and Growth", in Economics, Innovation and NewTechnology, Vol.3.
2.40 The buoyancy in services has been facilitated by growth in skill-intensive finance and thecomputer software group as well as labour-intensive trade and transport group. The high growthin services is suggestive of productivity gains in commodity producing sectors and theconcomitant shift in employment away from commodity-producing sectors. Future accelerationin economic activity is thus contingent on the productivity dynamics in the services sector. Apartfrom efforts needed to raise productivity across the various sub-sectors of services, there is aneed to shift the structure of services in favour of the skill intensive and high value addedsegments so that potential productivity gains can be derived through assimilation of technicalprogress and innovations. This would necessitate, inter alia, a shift in the demand pattern moretowards these service sub-sectors as well as a conducive policy environment for introducinggreater competition and efficiency.
Table 2.10:Growth and Share of Services in the Gross Domestic Product(at 1993-94 prices)