101
IIA Los Angeles Chapter Data Analytics Basics January 14, 2015

IIA Los Angeles ChapterData Analytics Basics
January 14, 2015
2© 2015 KPMG LLP, a Delaware limited liability partnership and the U.S. member firm of the KPMG network of independent member firms affiliated with KPMG International Cooperative (“KPMG International”), a Swiss entity. All rights reserved NDPPS 334170
Today’s objectives
■ Gain an understanding of the data analytics tools popular with internal and external auditors
■ Learn the functions of data analytic tools that can be used to evaluate data for potential fraud or other irregularities
■ Observe demonstrations of how one data analytics package implements these functions and captures the work performed for workpaper documentation
■ Learn about data visualization.
3© 2015 KPMG LLP, a Delaware limited liability partnership and the U.S. member firm of the KPMG network of independent member firms affiliated with KPMG International Cooperative (“KPMG International”), a Swiss entity. All rights reserved NDPPS 334170
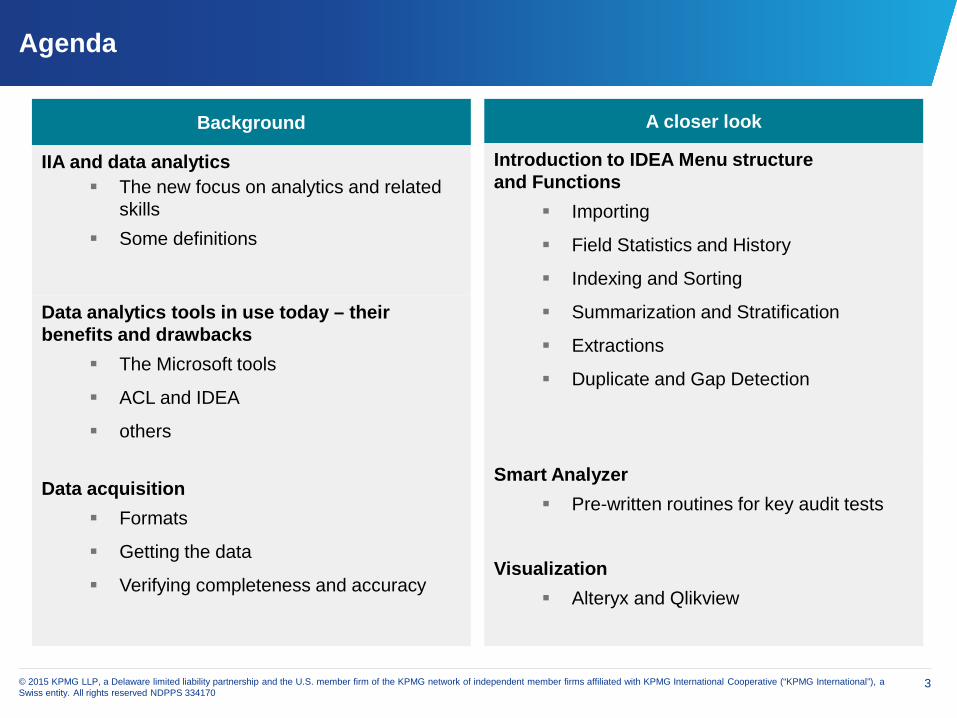
Agenda
Background
IIA and data analytics The new focus on analytics and related
skills Some definitions
Data analytics tools in use today – their benefits and drawbacks
The Microsoft tools
ACL and IDEA
others
Data acquisition Formats
Getting the data
Verifying completeness and accuracy
A closer look
Introduction to IDEA Menu structure and Functions
Importing
Field Statistics and History
Indexing and Sorting
Summarization and Stratification
Extractions
Duplicate and Gap Detection
Smart Analyzer Pre-written routines for key audit tests
Visualization Alteryx and Qlikview
IIA and data analytics
The new focus
5© 2015 KPMG LLP, a Delaware limited liability partnership and the U.S. member firm of the KPMG network of independent member firms affiliated with KPMG International Cooperative (“KPMG International”), a Swiss entity. All rights reserved NDPPS 334170
The new focus on data analytics and related skills
December 2014 Issue of “Internal Auditor” – The Year Ahead
1. “Perhaps the biggest operational change internal auditors will likely face in the next four quarters is major movement forward in the way risks are identified, as many departments are in various states of implementing data analytics and predictive modeling to mine for past clues to the future.” (See Notes)
2. “Appropriately, the emphasis has continued to be on internal audit departments’ ability to expand their data analytics capabilities. And internal auditors aren’t the only ones developing that skill set in most organizations. Analytics is being used in the first and second lines of defense as well, and I see a growing role for internal auditors in auditing the use of these tools by other functions in the organization.”
3. “We need to know how process owners are using data – assurance that the data they are using to manage the business is helpful, useful reliable and is not giving them false conclusions, we have to be thinking from a data-driven approach We have to be using analytics because the business is expecting leaders are expecting it. The old method of providing assurance based upon sampling just isn’t relevant in the current business model.”
6© 2015 KPMG LLP, a Delaware limited liability partnership and the U.S. member firm of the KPMG network of independent member firms affiliated with KPMG International Cooperative (“KPMG International”), a Swiss entity. All rights reserved NDPPS 334170
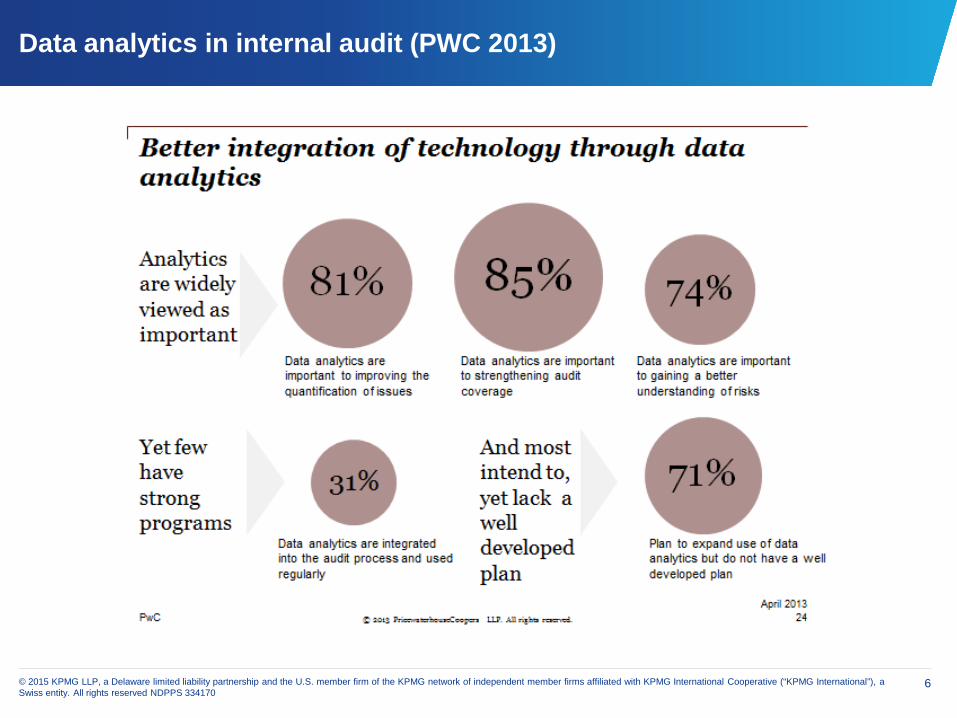
Data analytics in internal audit (PWC 2013)
7© 2015 KPMG LLP, a Delaware limited liability partnership and the U.S. member firm of the KPMG network of independent member firms affiliated with KPMG International Cooperative (“KPMG International”), a Swiss entity. All rights reserved NDPPS 334170
Benefits of data analytics in internal audit
Enhanced risk management process and audit quality
Focus on more data. Reduce manual review to key areas of interest/concern
Limit sampling; cover 100% of population
Increase in audit quality
Enable analysis of data from different sources/combined data
May provide easy-to-review audit trail
8© 2015 KPMG LLP, a Delaware limited liability partnership and the U.S. member firm of the KPMG network of independent member firms affiliated with KPMG International Cooperative (“KPMG International”), a Swiss entity. All rights reserved NDPPS 334170
Traditional approach
Tests of application controls
Analytical procedures
Tests of details of transactions and balances
Extracting data for substantive audit procedures
Re-performing calculations performed by the entity's accounting department
9© 2015 KPMG LLP, a Delaware limited liability partnership and the U.S. member firm of the KPMG network of independent member firms affiliated with KPMG International Cooperative (“KPMG International”), a Swiss entity. All rights reserved NDPPS 334170
The new world of data analytics
Finding patterns and associations among individual or groups of data elements
Validating data entry dates/times/users to identify postings or data entry times that are inappropriate or suspicious
Joining different data sources to identify new or inappropriate relationships and patterns between systems
10© 2015 KPMG LLP, a Delaware limited liability partnership and the U.S. member firm of the KPMG network of independent member firms affiliated with KPMG International Cooperative (“KPMG International”), a Swiss entity. All rights reserved NDPPS 334170
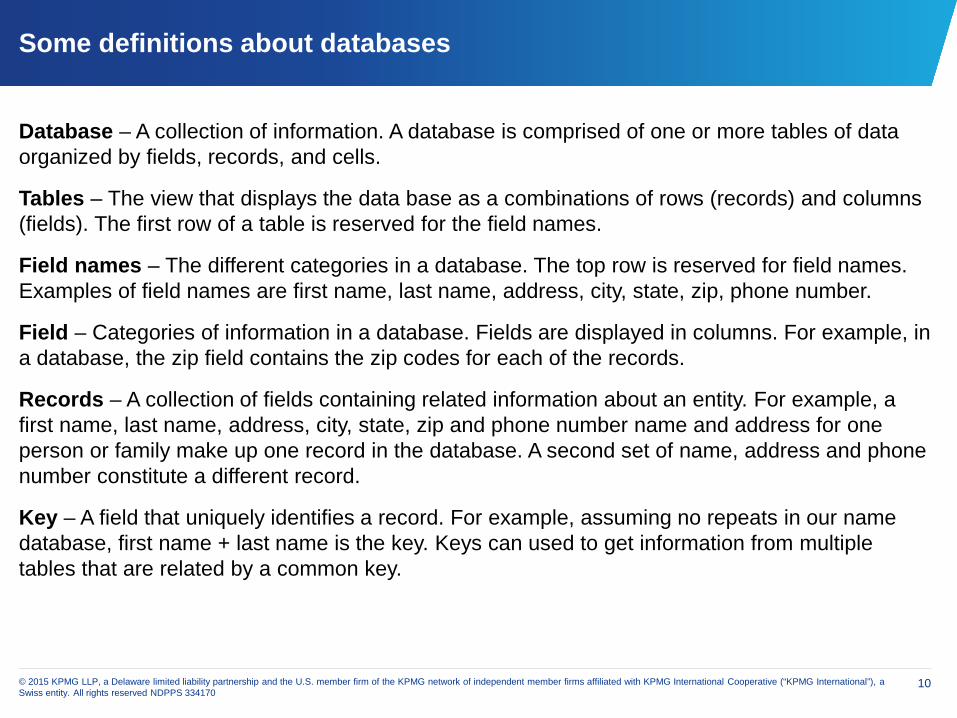
Some definitions about databases
Database – A collection of information. A database is comprised of one or more tables of data organized by fields, records, and cells.
Tables – The view that displays the data base as a combinations of rows (records) and columns (fields). The first row of a table is reserved for the field names.
Field names – The different categories in a database. The top row is reserved for field names. Examples of field names are first name, last name, address, city, state, zip, phone number.
Field – Categories of information in a database. Fields are displayed in columns. For example, in a database, the zip field contains the zip codes for each of the records.
Records – A collection of fields containing related information about an entity. For example, a first name, last name, address, city, state, zip and phone number name and address for one person or family make up one record in the database. A second set of name, address and phone number constitute a different record.
Key – A field that uniquely identifies a record. For example, assuming no repeats in our name database, first name + last name is the key. Keys can used to get information from multiple tables that are related by a common key.

11© 2015 KPMG LLP, a Delaware limited liability partnership and the U.S. member firm of the KPMG network of independent member firms affiliated with KPMG International Cooperative (“KPMG International”), a Swiss entity. All rights reserved NDPPS 334170
Data types often seen in CAATs packages
Character: numbers, letters and special characters (punctuation and formatting)
Treated as characters for sorting, i.e., ASCII value
Formatting characters are generally not visible
■ Page break, form feed, space
Numeric: numbers only
Treated as numbers for sorting, i.e., numeric value
Watch out for leading zeros; chose character if uncertain
12© 2015 KPMG LLP, a Delaware limited liability partnership and the U.S. member firm of the KPMG network of independent member firms affiliated with KPMG International Cooperative (“KPMG International”), a Swiss entity. All rights reserved NDPPS 334170
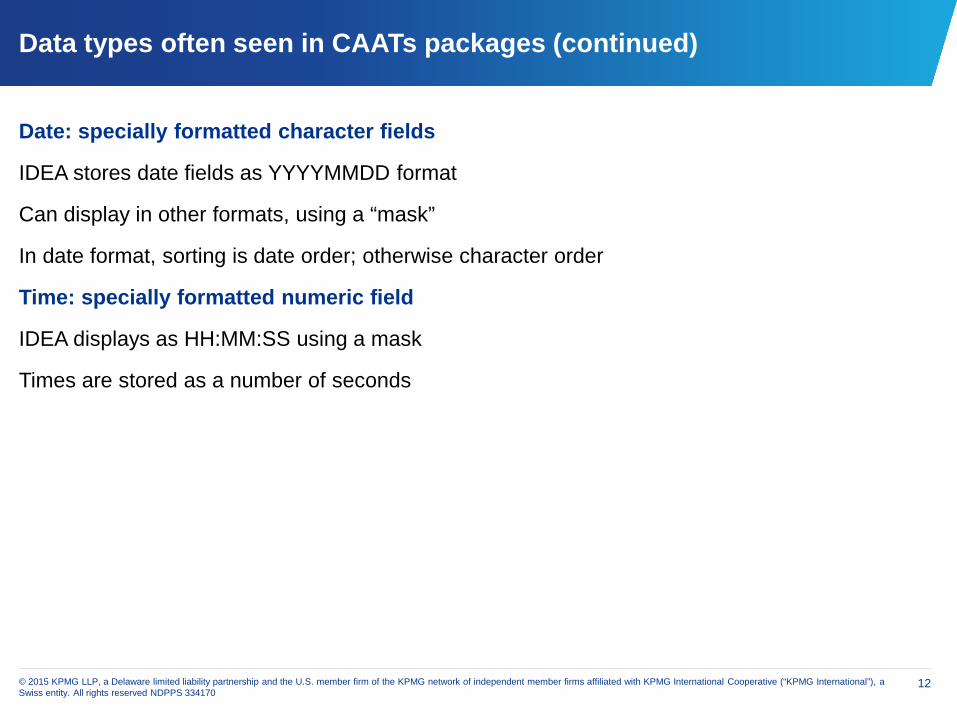
Data types often seen in CAATs packages (continued)
Date: specially formatted character fields
IDEA stores date fields as YYYYMMDD format
Can display in other formats, using a “mask”
In date format, sorting is date order; otherwise character order
Time: specially formatted numeric field
IDEA displays as HH:MM:SS using a mask
Times are stored as a number of seconds
13© 2015 KPMG LLP, a Delaware limited liability partnership and the U.S. member firm of the KPMG network of independent member firms affiliated with KPMG International Cooperative (“KPMG International”), a Swiss entity. All rights reserved NDPPS 334170
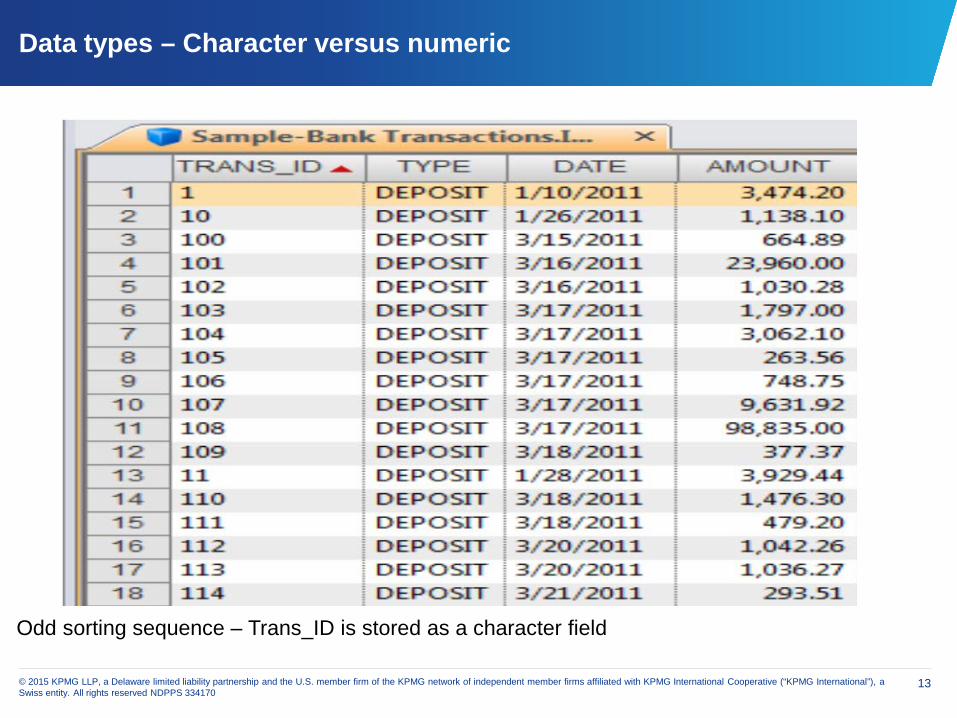
Odd sorting sequence – Trans_ID is stored as a character field
Data types – Character versus numeric
Data analytics tools in use today
Their benefits and drawbacks
15© 2015 KPMG LLP, a Delaware limited liability partnership and the U.S. member firm of the KPMG network of independent member firms affiliated with KPMG International Cooperative (“KPMG International”), a Swiss entity. All rights reserved NDPPS 334170
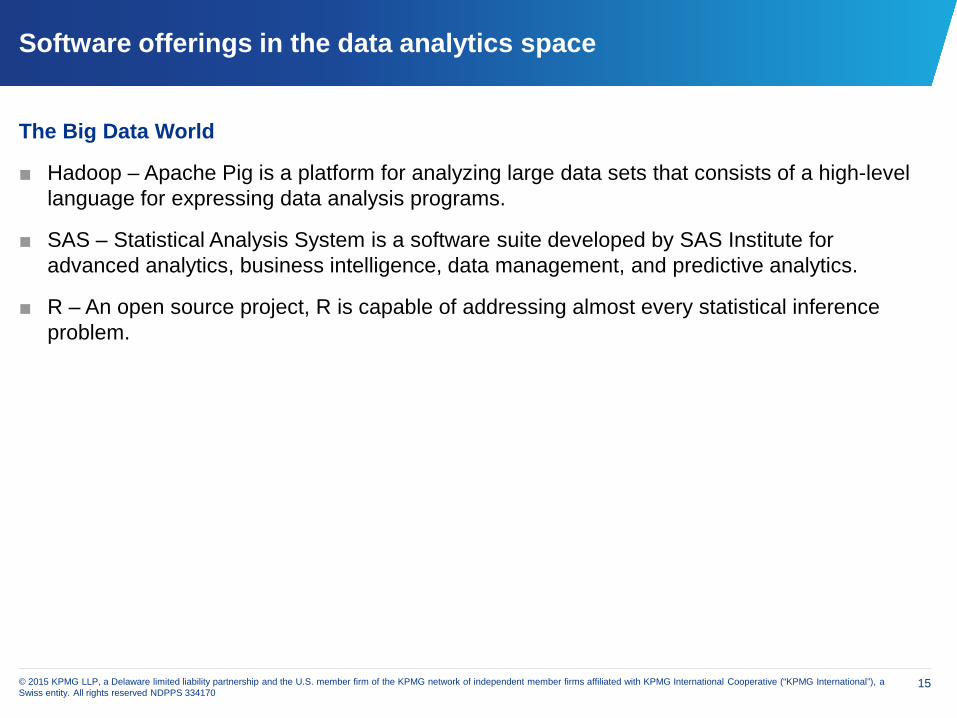
The Big Data World
■ Hadoop – Apache Pig is a platform for analyzing large data sets that consists of a high-level language for expressing data analysis programs.
■ SAS – Statistical Analysis System is a software suite developed by SAS Institute for advanced analytics, business intelligence, data management, and predictive analytics.
■ R – An open source project, R is capable of addressing almost every statistical inference problem.
Software offerings in the data analytics space
16© 2015 KPMG LLP, a Delaware limited liability partnership and the U.S. member firm of the KPMG network of independent member firms affiliated with KPMG International Cooperative (“KPMG International”), a Swiss entity. All rights reserved NDPPS 334170
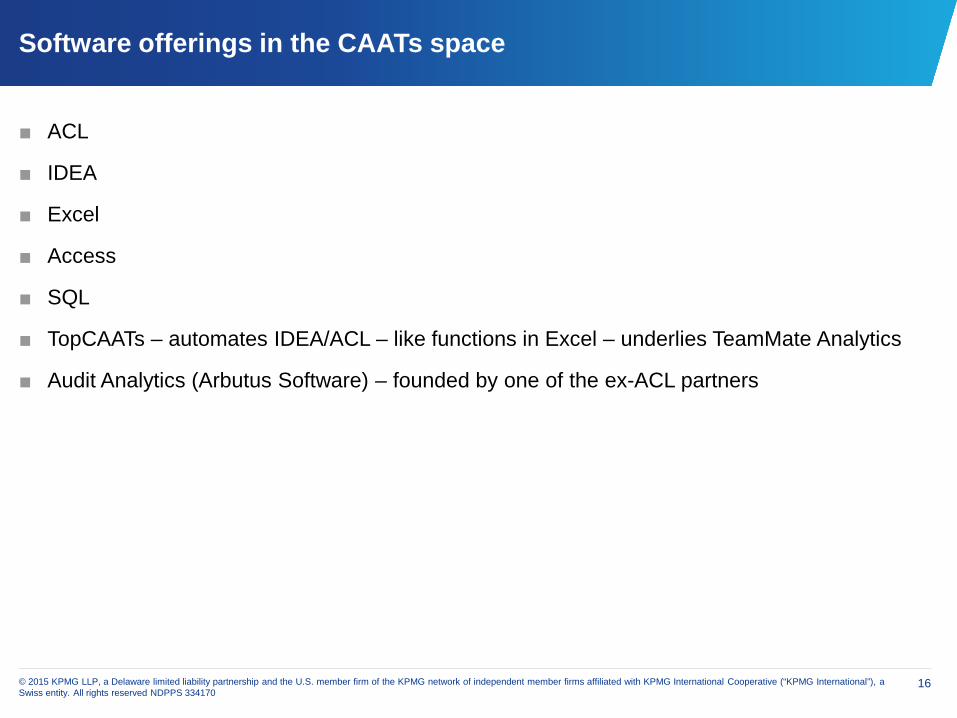
Software offerings in the CAATs space
■ ACL
■ IDEA
■ Excel
■ Access
■ SQL
■ TopCAATs – automates IDEA/ACL – like functions in Excel – underlies TeamMate Analytics
■ Audit Analytics (Arbutus Software) – founded by one of the ex-ACL partners
17© 2015 KPMG LLP, a Delaware limited liability partnership and the U.S. member firm of the KPMG network of independent member firms affiliated with KPMG International Cooperative (“KPMG International”), a Swiss entity. All rights reserved NDPPS 334170
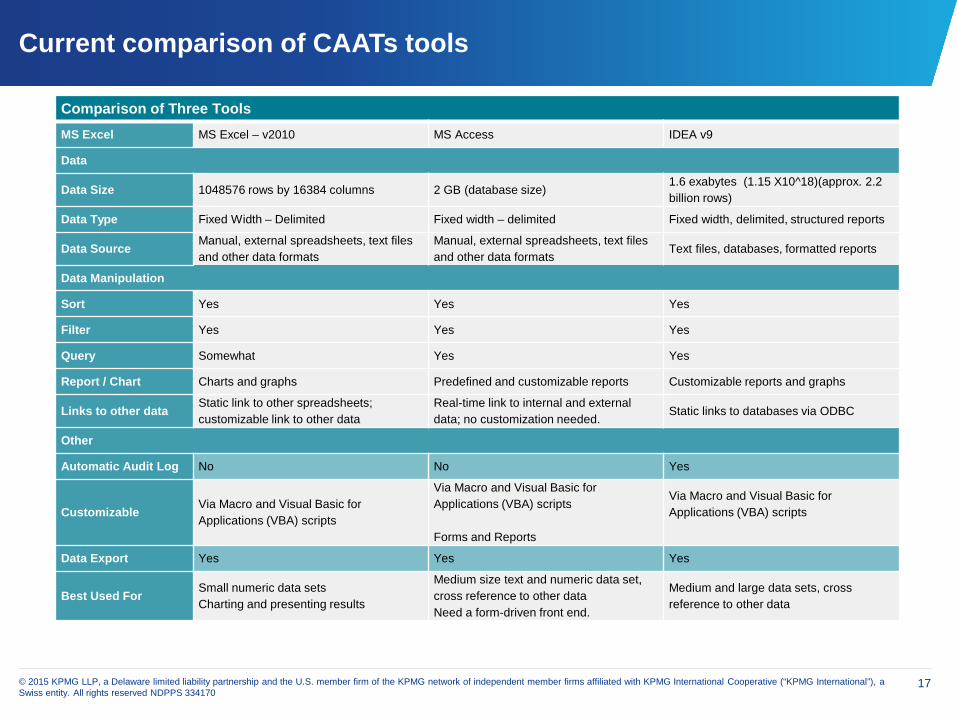
Current comparison of CAATs tools
Comparison of Three ToolsMS Excel MS Excel – v2010 MS Access IDEA v9
Data
Data Size 1048576 rows by 16384 columns 2 GB (database size)1.6 exabytes (1.15 X10^18)(approx. 2.2 billion rows)
Data Type Fixed Width – Delimited Fixed width – delimited Fixed width, delimited, structured reports
Data Source Manual, external spreadsheets, text files and other data formats
Manual, external spreadsheets, text files and other data formats
Text files, databases, formatted reports
Data Manipulation
Sort Yes Yes Yes
Filter Yes Yes Yes
Query Somewhat Yes Yes
Report / Chart Charts and graphs Predefined and customizable reports Customizable reports and graphs
Links to other data Static link to other spreadsheets; customizable link to other data
Real-time link to internal and external data; no customization needed.
Static links to databases via ODBC
Other
Automatic Audit Log No No Yes
Customizable Via Macro and Visual Basic for Applications (VBA) scripts
Via Macro and Visual Basic for Applications (VBA) scripts
Forms and Reports
Via Macro and Visual Basic for Applications (VBA) scripts
Data Export Yes Yes Yes
Best Used For Small numeric data setsCharting and presenting results
Medium size text and numeric data set, cross reference to other dataNeed a form-driven front end.
Medium and large data sets, cross reference to other data

Data acquisition
Formats
Getting the data
Verifying completeness and accuracy

19© 2015 KPMG LLP, a Delaware limited liability partnership and the U.S. member firm of the KPMG network of independent member firms affiliated with KPMG International Cooperative (“KPMG International”), a Swiss entity. All rights reserved NDPPS 334170
Before you ask IT – Ask yourself – What are you trying to test
Reports
■ Off-the-shelf
■ Custom/ad-hoc
Transaction Details
■ Reports
■ Data
Metadata
■ Reports
■ Data
Controls
■ Combinations of all of the above

20© 2015 KPMG LLP, a Delaware limited liability partnership and the U.S. member firm of the KPMG network of independent member firms affiliated with KPMG International Cooperative (“KPMG International”), a Swiss entity. All rights reserved NDPPS 334170
What you are trying to test defines the layers of IT you need to consider
Reports
■ Applications: reporting functionality
■ Custom/ad-hoc: report writers
Transaction Details
■ Reports: Applications: reporting functionality
■ Data: database
Metadata
■ Reports: report writers
■ Data: database
Controls
■ Combinations of all of the above and the O/S
21© 2015 KPMG LLP, a Delaware limited liability partnership and the U.S. member firm of the KPMG network of independent member firms affiliated with KPMG International Cooperative (“KPMG International”), a Swiss entity. All rights reserved NDPPS 334170
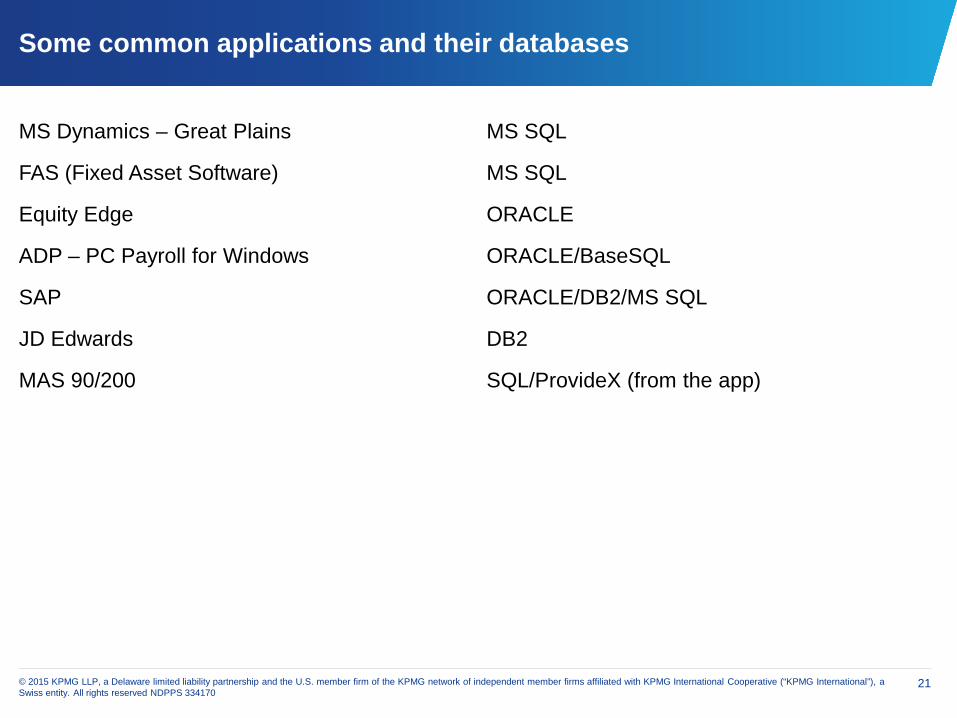
Some common applications and their databases
MS Dynamics – Great Plains
FAS (Fixed Asset Software)
Equity Edge
ADP – PC Payroll for Windows
SAP
JD Edwards
MAS 90/200
MS SQL
MS SQL
ORACLE
ORACLE/BaseSQL
ORACLE/DB2/MS SQL
DB2
SQL/ProvideX (from the app)
22© 2015 KPMG LLP, a Delaware limited liability partnership and the U.S. member firm of the KPMG network of independent member firms affiliated with KPMG International Cooperative (“KPMG International”), a Swiss entity. All rights reserved NDPPS 334170
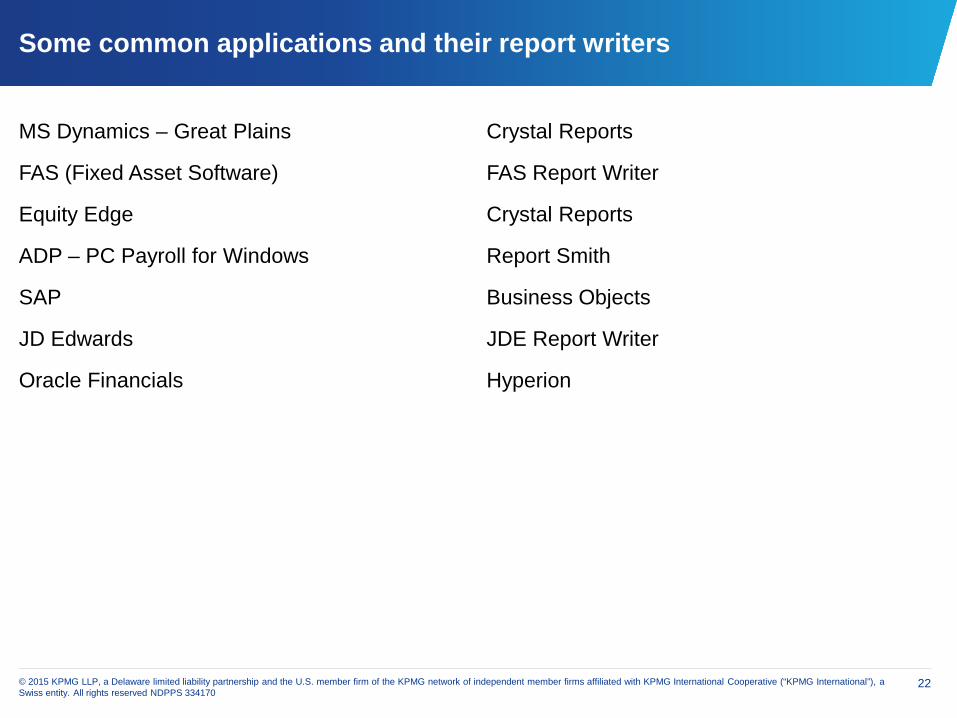
Some common applications and their report writers
MS Dynamics – Great Plains
FAS (Fixed Asset Software)
Equity Edge
ADP – PC Payroll for Windows
SAP
JD Edwards
Oracle Financials
Crystal Reports
FAS Report Writer
Crystal Reports
Report Smith
Business Objects
JDE Report Writer
Hyperion
23© 2015 KPMG LLP, a Delaware limited liability partnership and the U.S. member firm of the KPMG network of independent member firms affiliated with KPMG International Cooperative (“KPMG International”), a Swiss entity. All rights reserved NDPPS 334170
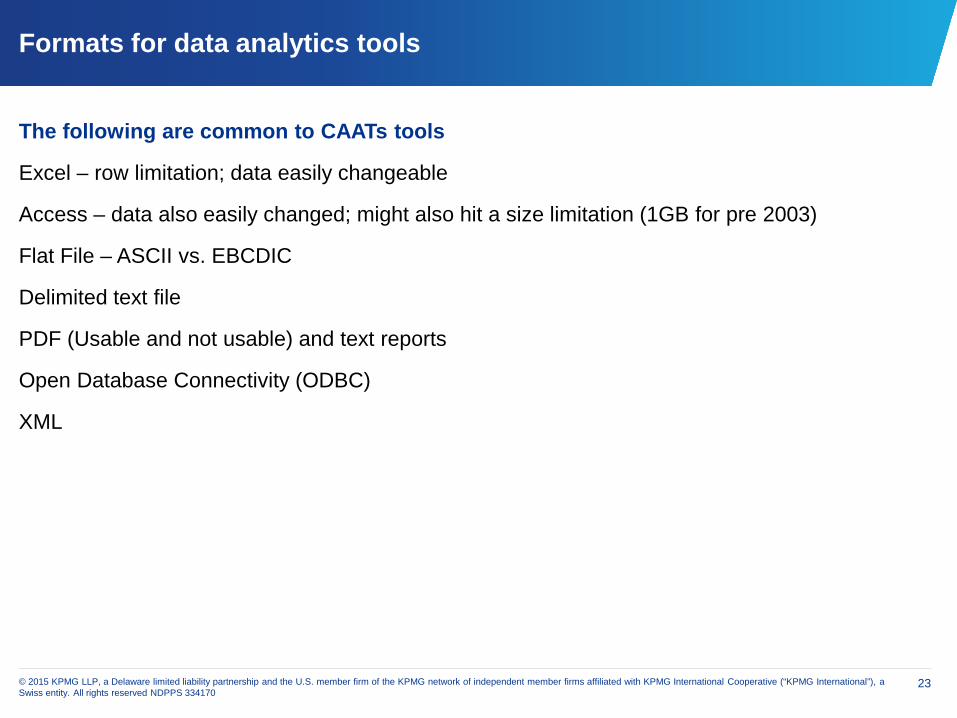
Formats for data analytics tools
The following are common to CAATs tools
Excel – row limitation; data easily changeable
Access – data also easily changed; might also hit a size limitation (1GB for pre 2003)
Flat File – ASCII vs. EBCDIC
Delimited text file
PDF (Usable and not usable) and text reports
Open Database Connectivity (ODBC)
XML
24© 2015 KPMG LLP, a Delaware limited liability partnership and the U.S. member firm of the KPMG network of independent member firms affiliated with KPMG International Cooperative (“KPMG International”), a Swiss entity. All rights reserved NDPPS 334170
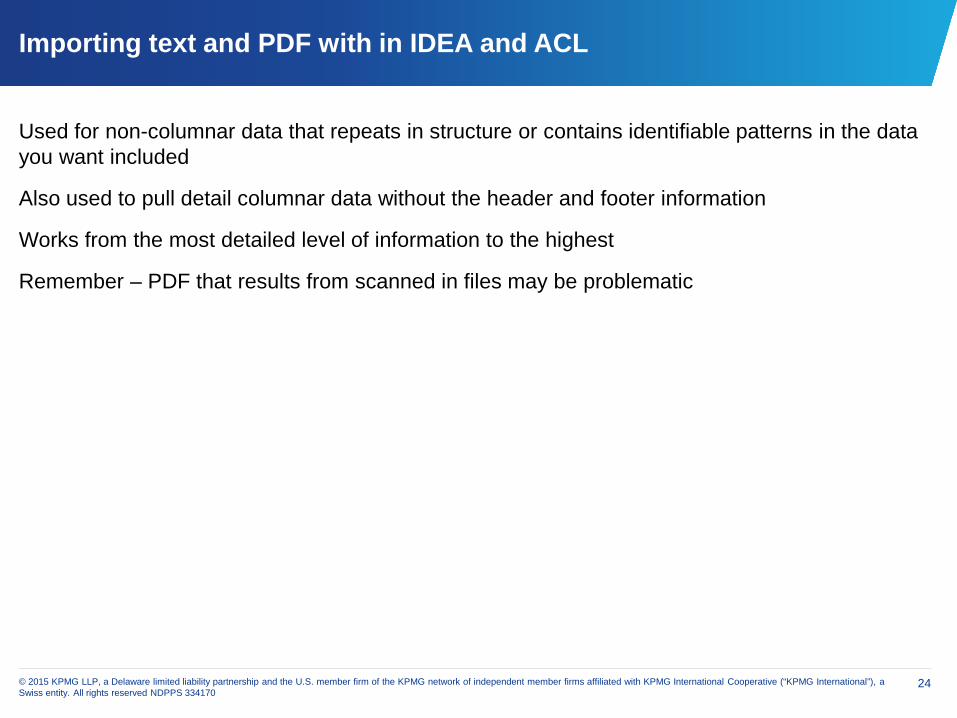
Importing text and PDF with in IDEA and ACL
Used for non-columnar data that repeats in structure or contains identifiable patterns in the data you want included
Also used to pull detail columnar data without the header and footer information
Works from the most detailed level of information to the highest
Remember – PDF that results from scanned in files may be problematic

25© 2015 KPMG LLP, a Delaware limited liability partnership and the U.S. member firm of the KPMG network of independent member firms affiliated with KPMG International Cooperative (“KPMG International”), a Swiss entity. All rights reserved NDPPS 334170
Text/PDF – Report Reader – A formatted text report

26© 2015 KPMG LLP, a Delaware limited liability partnership and the U.S. member firm of the KPMG network of independent member firms affiliated with KPMG International Cooperative (“KPMG International”), a Swiss entity. All rights reserved NDPPS 334170
Completeness and accuracy of the file import
This step, at the beginning of your work, can make or break all of your analysis and conclusions
There are several features which will give you insight into completeness and accuracy
■ Control Totals
■ Field Statistics
■ Record Counts
Depending on the kind of data you acquire for your analysis, you may need to get creative to demonstrate these two attributes of your import

27© 2015 KPMG LLP, a Delaware limited liability partnership and the U.S. member firm of the KPMG network of independent member firms affiliated with KPMG International Cooperative (“KPMG International”), a Swiss entity. All rights reserved NDPPS 334170
Completeness and accuracy – Control totals
Control Total shows the net total of one key numeric field. Compare this to the total imported from your source document.
28© 2015 KPMG LLP, a Delaware limited liability partnership and the U.S. member firm of the KPMG network of independent member firms affiliated with KPMG International Cooperative (“KPMG International”), a Swiss entity. All rights reserved NDPPS 334170
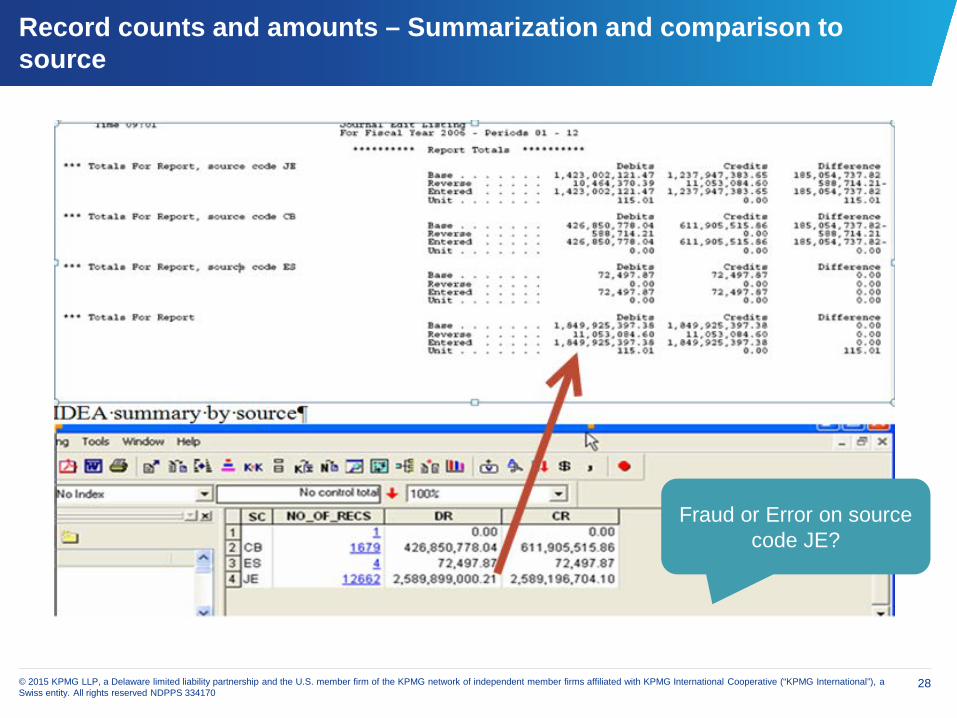
Record counts and amounts – Summarization and comparison to source
Fraud or Error on source code JE?
29© 2015 KPMG LLP, a Delaware limited liability partnership and the U.S. member firm of the KPMG network of independent member firms affiliated with KPMG International Cooperative (“KPMG International”), a Swiss entity. All rights reserved NDPPS 334170
When numeric data isn’t….
Completeness and Accuracy
How can we validate completeness without control totals?
■ Line editor that shows line counts and cursor position (ex. Vedit)
■ Programming tool – not SQL – that allows querying against non-columnar data (e.g., PERL)
30© 2015 KPMG LLP, a Delaware limited liability partnership and the U.S. member firm of the KPMG network of independent member firms affiliated with KPMG International Cooperative (“KPMG International”), a Swiss entity. All rights reserved NDPPS 334170
Completeness and accuracy – Non-numeric data
You still need to demonstrate completeness and accuracy
Accuracy can generally be shown on a sample basis, pulling certain records and comparing against the source
Completeness is another issue…
31© 2015 KPMG LLP, a Delaware limited liability partnership and the U.S. member firm of the KPMG network of independent member firms affiliated with KPMG International Cooperative (“KPMG International”), a Swiss entity. All rights reserved NDPPS 334170
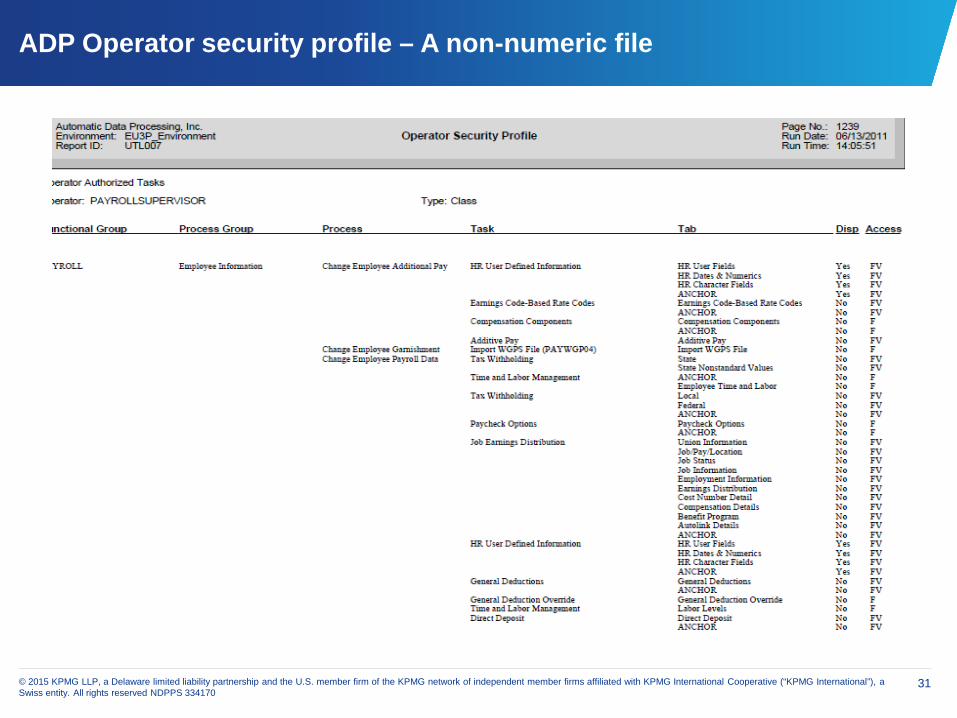
ADP Operator security profile – A non-numeric file
32© 2015 KPMG LLP, a Delaware limited liability partnership and the U.S. member firm of the KPMG network of independent member firms affiliated with KPMG International Cooperative (“KPMG International”), a Swiss entity. All rights reserved NDPPS 334170
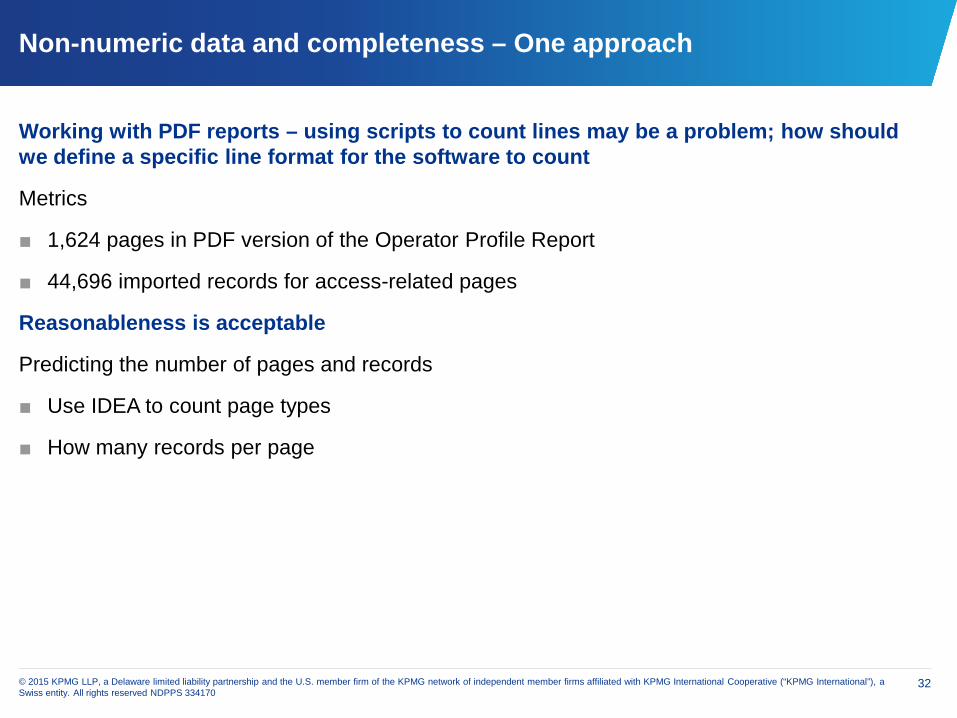
Non-numeric data and completeness – One approach
Working with PDF reports – using scripts to count lines may be a problem; how should we define a specific line format for the software to count
Metrics
■ 1,624 pages in PDF version of the Operator Profile Report
■ 44,696 imported records for access-related pages
Reasonableness is acceptable
Predicting the number of pages and records
■ Use IDEA to count page types
■ How many records per page
33© 2015 KPMG LLP, a Delaware limited liability partnership and the U.S. member firm of the KPMG network of independent member firms affiliated with KPMG International Cooperative (“KPMG International”), a Swiss entity. All rights reserved NDPPS 334170
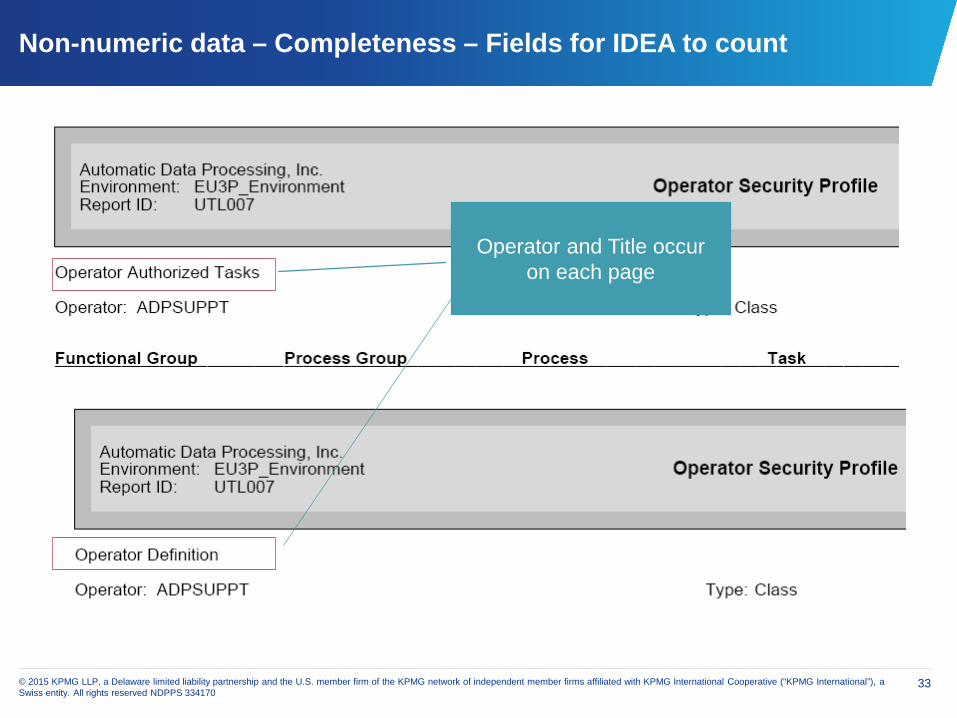
Non-numeric data – Completeness – Fields for IDEA to count
Operator and Title occuron each page
34© 2015 KPMG LLP, a Delaware limited liability partnership and the U.S. member firm of the KPMG network of independent member firms affiliated with KPMG International Cooperative (“KPMG International”), a Swiss entity. All rights reserved NDPPS 334170
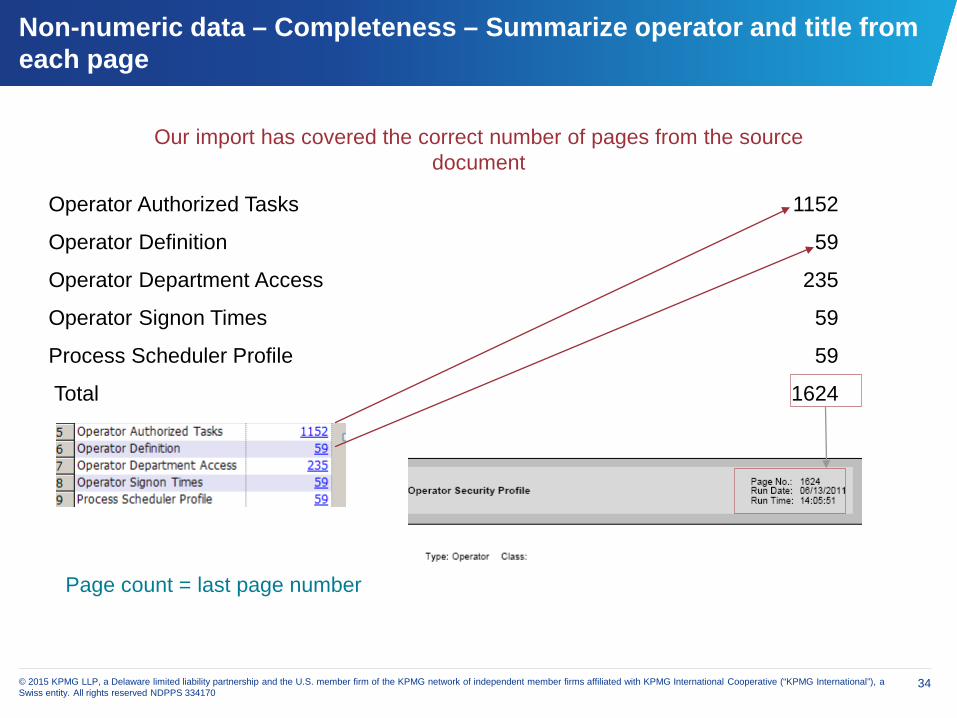
Non-numeric data – Completeness – Summarize operator and title from each page
Operator Authorized Tasks 1152
Operator Definition 59
Operator Department Access 235
Operator Signon Times 59
Process Scheduler Profile 59
Total 1624
Page count = last page number
Our import has covered the correct number of pages from the source document
35© 2015 KPMG LLP, a Delaware limited liability partnership and the U.S. member firm of the KPMG network of independent member firms affiliated with KPMG International Cooperative (“KPMG International”), a Swiss entity. All rights reserved NDPPS 334170
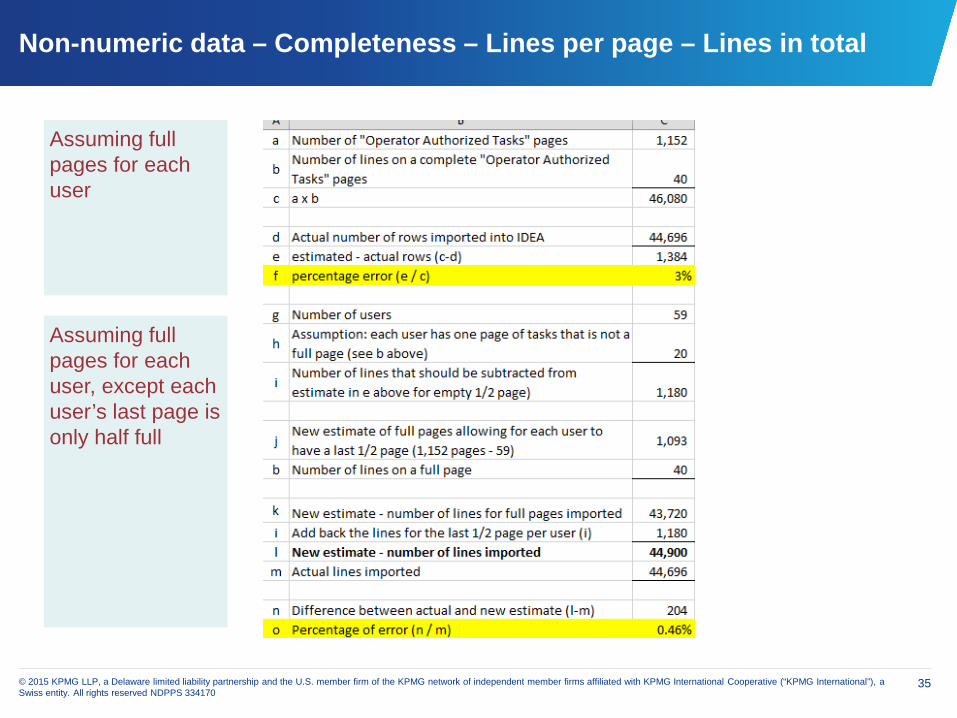
Non-numeric data – Completeness – Lines per page – Lines in total
Assuming full pages for each user
Assuming full pages for each user, except each user’s last page is only half full

IDEA Menu structure and functions
Menu
Importing
Field statistics and history

37© 2015 KPMG LLP, a Delaware limited liability partnership and the U.S. member firm of the KPMG network of independent member firms affiliated with KPMG International Cooperative (“KPMG International”), a Swiss entity. All rights reserved NDPPS 334170
What’s on the menu?
38© 2015 KPMG LLP, a Delaware limited liability partnership and the U.S. member firm of the KPMG network of independent member firms affiliated with KPMG International Cooperative (“KPMG International”), a Swiss entity. All rights reserved NDPPS 334170
Common tasks in data analytics – Not in any particular order
■ Importing/verifying data
■ Profiling data/gaining a high-level perspective
■ Indexing and Sorting
■ Summarization and Stratification
■ Extractions
■ Sampling/Benford’s Law (not covered in this session)
■ Duplicate and Gap Detection
■ Joins and Appends
■ Visualization
■ Reporting (not covered in this session)
39© 2015 KPMG LLP, a Delaware limited liability partnership and the U.S. member firm of the KPMG network of independent member firms affiliated with KPMG International Cooperative (“KPMG International”), a Swiss entity. All rights reserved NDPPS 334170
When should data not be imported as its original type?
Fields with numerics that are not used in calculations – risk of dropping one or more leading zeroes
Fields with dates where there may be a blank or malformed data
■ Avoid errors on import
■ Can convert after import

40© 2015 KPMG LLP, a Delaware limited liability partnership and the U.S. member firm of the KPMG network of independent member firms affiliated with KPMG International Cooperative (“KPMG International”), a Swiss entity. All rights reserved NDPPS 334170
When to use ODBC
Yes
Don’t need to test data relationshipsindependently
You only want certain fields
Clear, simple table layouts
Clear-text data storage
No
× Client does not allow connection into their system
× Tested report available
× Complex tables / relationships
× Database does not support ODBC
× Embedded objects in the data
× Very large datasets

41© 2015 KPMG LLP, a Delaware limited liability partnership and the U.S. member firm of the KPMG network of independent member firms affiliated with KPMG International Cooperative (“KPMG International”), a Swiss entity. All rights reserved NDPPS 334170
File types by ease of import
dBase III/IV
Print report files
MS Excel
Text (Delimited / Fixed length)
ODBC
EBCDIC
* Record definitions needed
*
*
Increaseddifficulty
MS Access
42© 2015 KPMG LLP, a Delaware limited liability partnership and the U.S. member firm of the KPMG network of independent member firms affiliated with KPMG International Cooperative (“KPMG International”), a Swiss entity. All rights reserved NDPPS 334170
Importing text and PDF with report reader
Used for non-columnar data that repeats in structure or contains identifiable patterns in the data you want included
Also used to pull detail columnar data without the header and footer information
Works from the most detailed level of information to the highest

Demonstration
Importing
Excel and PDF/Text report
44© 2015 KPMG LLP, a Delaware limited liability partnership and the U.S. member firm of the KPMG network of independent member firms affiliated with KPMG International Cooperative (“KPMG International”), a Swiss entity. All rights reserved NDPPS 334170
Field statistics and profiling data
Field Statistics with its multiple views into the data is often provides the key on how to proceed
Combining field statistics with stratification, summarization and extraction (coming up) allows you to profile the data
You need the 10,000 foot view and the detail view, often interchangeably
CAATs tools allow this profiling without having to worry too much about the mechanics

45© 2015 KPMG LLP, a Delaware limited liability partnership and the U.S. member firm of the KPMG network of independent member firms affiliated with KPMG International Cooperative (“KPMG International”), a Swiss entity. All rights reserved NDPPS 334170
Field statistics – What else they can tell you
Field Statistics are another method to check totals and ranges on numeric, date, and character fields
You can print worksheets with field statistics information and include in your workpapers.

Demonstration
Field statistics
47© 2015 KPMG LLP, a Delaware limited liability partnership and the U.S. member firm of the KPMG network of independent member firms affiliated with KPMG International Cooperative (“KPMG International”), a Swiss entity. All rights reserved NDPPS 334170
History – What it is
History is an audit trail or log of all tasks carried out on a database, including its import and each audit test.
Produces a linear log so that the process of how the database was created can be traced.
History is contained within the database, the IDEA Merged Document (filename.imd) and can be saved, exported, printed, and filtered.
History carries forward to child databases
48© 2015 KPMG LLP, a Delaware limited liability partnership and the U.S. member firm of the KPMG network of independent member firms affiliated with KPMG International Cooperative (“KPMG International”), a Swiss entity. All rights reserved NDPPS 334170
History – What it tells you
1. File name
2. Number of records
3. Action Taken
4. Control Totals (if applicable)
5. IDEA script code
Basically – everything done to the file since it was imported.
49© 2015 KPMG LLP, a Delaware limited liability partnership and the U.S. member firm of the KPMG network of independent member firms affiliated with KPMG International Cooperative (“KPMG International”), a Swiss entity. All rights reserved NDPPS 334170
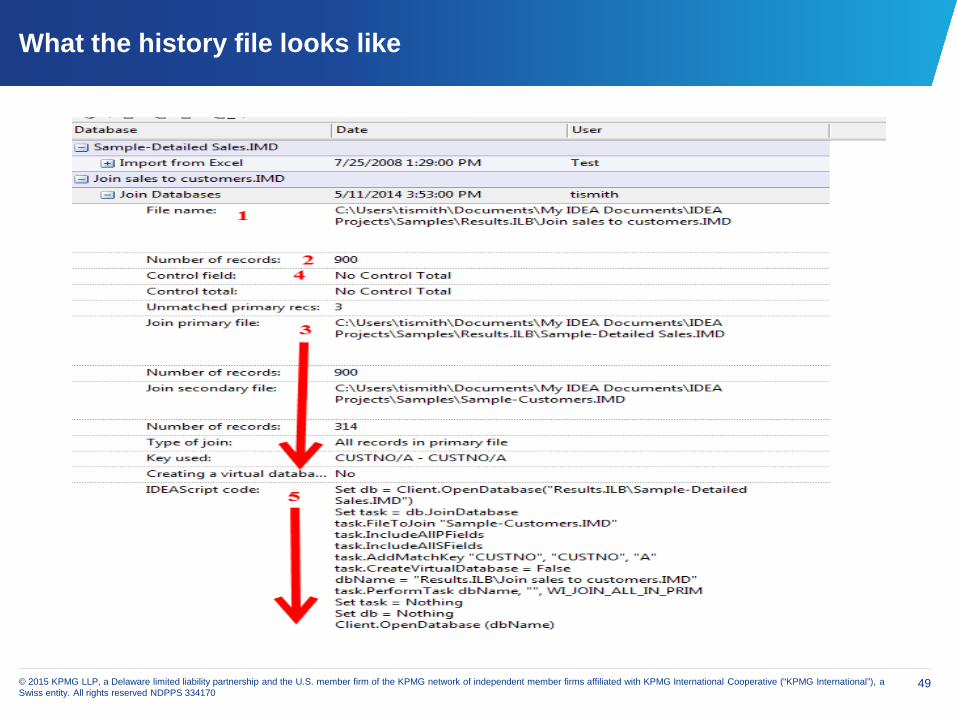
What the history file looks like

50© 2015 KPMG LLP, a Delaware limited liability partnership and the U.S. member firm of the KPMG network of independent member firms affiliated with KPMG International Cooperative (“KPMG International”), a Swiss entity. All rights reserved NDPPS 334170
Indexing and sorting
Sorting and Indexing allow you to change the order in which the records are displayed. These make specific changes to the data:
Sorting changes the physical order of the records in the database.
■ A sort is generally performed in order to speed up the processing of certain functions that change the order of the data
■ Sorting generally creates a new database. Creating multiple views through sorting will take up disk space.
■ It may be advantageous to use sorting with very large datasets for functions that rely on one or more key fields to operate: duplicate key detection, gap detection, database join and others.
Indexing does not change the physical order of the records.
■ It modifies the logical order in which records are displayed
■ Indexing does not create a new file, no matter how many times you index
■ Speeds up character searches
51© 2015 KPMG LLP, a Delaware limited liability partnership and the U.S. member firm of the KPMG network of independent member firms affiliated with KPMG International Cooperative (“KPMG International”), a Swiss entity. All rights reserved NDPPS 334170
Why do an index?
Perform a separate analysis on a dataset without disturbing the order of the original dataset
Scan the highest/lowest values of a dataset
Identify items that are outside of pre-determined parameters
Evaluate record order in relation to process order

Demonstration
Indexing
IDEA Menu structure and functions
Indexing and sorting
Summarization and stratification
Extractions
Duplicate and gap detection
Appends and joins
54© 2015 KPMG LLP, a Delaware limited liability partnership and the U.S. member firm of the KPMG network of independent member firms affiliated with KPMG International Cooperative (“KPMG International”), a Swiss entity. All rights reserved NDPPS 334170
Summarization
Summarization involves accumulating the value of the entity’s data for a unique key, for example, loans by customer type, losses by geographic location, sales by product type, etc.
A key can be more than one field or just part of a field
■ you can create a key field by combining values from two or more fields or pulling out part of a field
There are often instances when totals do not factor in
■ information is provided by record counts – grouping data on a particular field such as customer number, transaction type, vendor name, etc.
In IDEA, summarization menu includes statistics for numeric fields other than SUM, including MAX, MIN, Average, and Standard Deviation
Often useful as a diagnostic for determining next step in analysis
55© 2015 KPMG LLP, a Delaware limited liability partnership and the U.S. member firm of the KPMG network of independent member firms affiliated with KPMG International Cooperative (“KPMG International”), a Swiss entity. All rights reserved NDPPS 334170
Summarization example
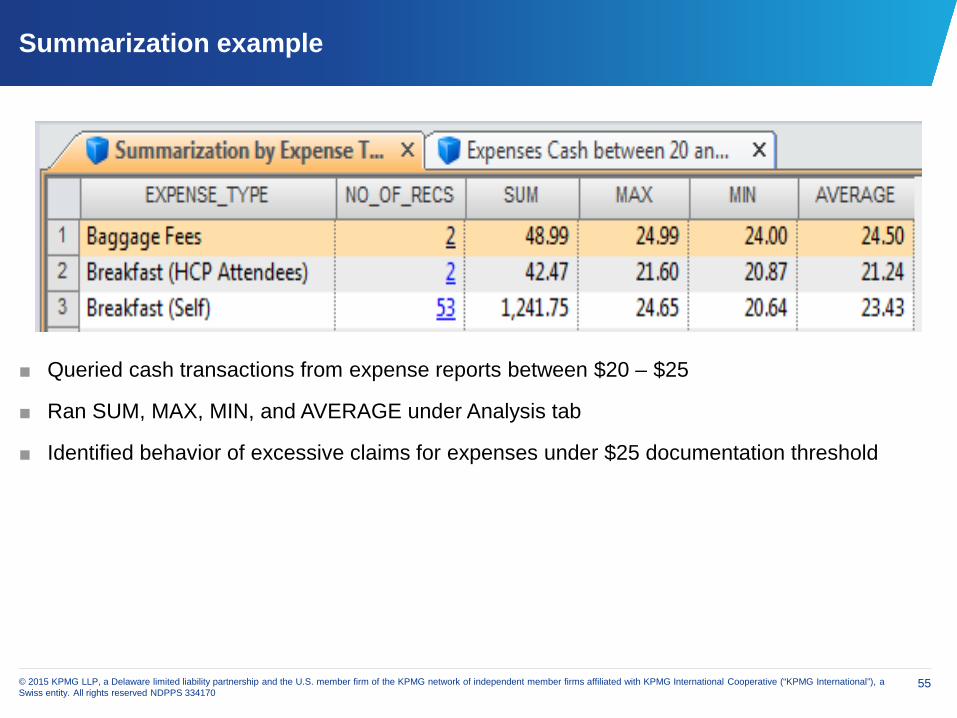
■ Queried cash transactions from expense reports between $20 – $25
■ Ran SUM, MAX, MIN, and AVERAGE under Analysis tab
■ Identified behavior of excessive claims for expenses under $25 documentation threshold

Demonstration
Summarization
57© 2015 KPMG LLP, a Delaware limited liability partnership and the U.S. member firm of the KPMG network of independent member firms affiliated with KPMG International Cooperative (“KPMG International”), a Swiss entity. All rights reserved NDPPS 334170
Stratification
Stratification is the process of dividing a population into subgroups for further analysis
Creates bands based on ranges of values (normally from the minimum to the maximum values of one or more fields) and accumulating the records from the database into the appropriate bands
Stratification bands are normally based on numeric fields but in IDEA, one can also stratify on character and date fields
Conclusions or analysis may be easier to apply to population subgroups
Useful for determining comparison ranges in:
■ Vendor invoices
■ Isolate split purchase orders
Look for outliers – especially items outside the stratification bands
58© 2015 KPMG LLP, a Delaware limited liability partnership and the U.S. member firm of the KPMG network of independent member firms affiliated with KPMG International Cooperative (“KPMG International”), a Swiss entity. All rights reserved NDPPS 334170
Stratification example
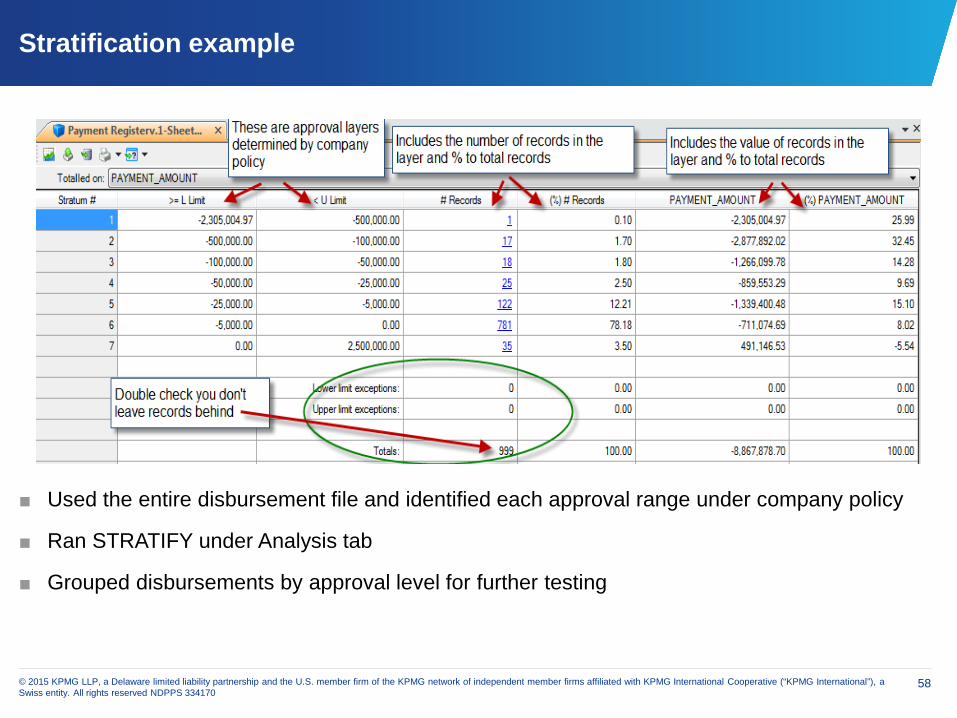
■ Used the entire disbursement file and identified each approval range under company policy
■ Ran STRATIFY under Analysis tab
■ Grouped disbursements by approval level for further testing

Demonstration
Stratification
60© 2015 KPMG LLP, a Delaware limited liability partnership and the U.S. member firm of the KPMG network of independent member firms affiliated with KPMG International Cooperative (“KPMG International”), a Swiss entity. All rights reserved NDPPS 334170
Extraction
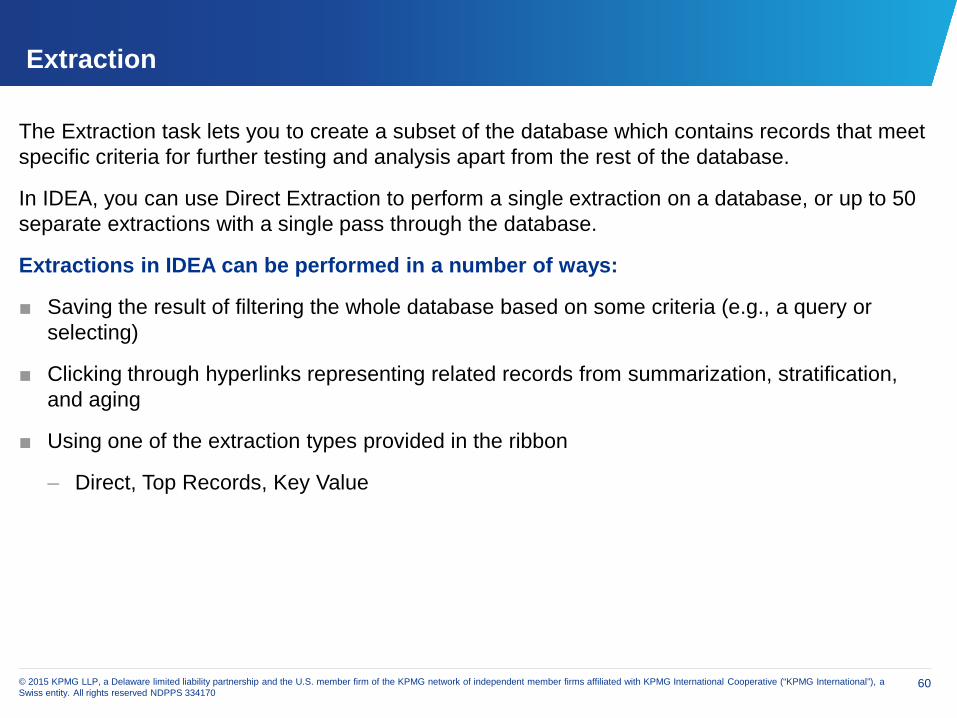
The Extraction task lets you to create a subset of the database which contains records that meet specific criteria for further testing and analysis apart from the rest of the database.
In IDEA, you can use Direct Extraction to perform a single extraction on a database, or up to 50 separate extractions with a single pass through the database.
Extractions in IDEA can be performed in a number of ways:
■ Saving the result of filtering the whole database based on some criteria (e.g., a query or selecting)
■ Clicking through hyperlinks representing related records from summarization, stratification, and aging
■ Using one of the extraction types provided in the ribbon
– Direct, Top Records, Key Value
Demonstration
Extraction
Direct, top records, key value
62© 2015 KPMG LLP, a Delaware limited liability partnership and the U.S. member firm of the KPMG network of independent member firms affiliated with KPMG International Cooperative (“KPMG International”), a Swiss entity. All rights reserved NDPPS 334170
Duplicate detection
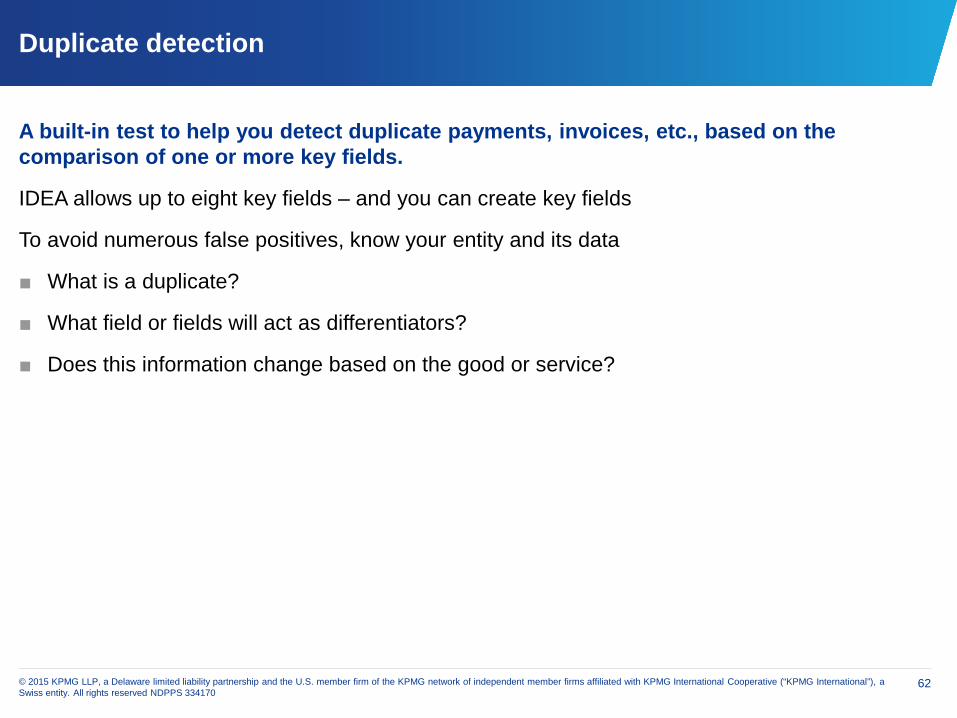
A built-in test to help you detect duplicate payments, invoices, etc., based on the comparison of one or more key fields.
IDEA allows up to eight key fields – and you can create key fields
To avoid numerous false positives, know your entity and its data
■ What is a duplicate?
■ What field or fields will act as differentiators?
■ Does this information change based on the good or service?

63© 2015 KPMG LLP, a Delaware limited liability partnership and the U.S. member firm of the KPMG network of independent member firms affiliated with KPMG International Cooperative (“KPMG International”), a Swiss entity. All rights reserved NDPPS 334170
Duplicate detection (continued)
Can be used to find items where there should be duplicate, such as testing for matching debits and credits
The Duplicate Key Detection test runs faster on a sorted (rather than indexed) database.

64© 2015 KPMG LLP, a Delaware limited liability partnership and the U.S. member firm of the KPMG network of independent member firms affiliated with KPMG International Cooperative (“KPMG International”), a Swiss entity. All rights reserved NDPPS 334170
Gap detection
The Gap Detection task is commonly used to test for completeness
Use it to identify missing items in a numerical sequence in Numeric or Character fields or a range of dates in Date fields in a database.
■ In character fields, it searches for gaps in numeric sequences, not letter sequences (e.g., A123…B456…etc.)
A gap indicates missing items and could include one or more missing items
Gap detection can be used to find such things as:
■ Missing check numbers or purchase orders
■ Missing invoice numbers in a sales order file

Demonstration
Duplicate detection
Gap detection
66© 2015 KPMG LLP, a Delaware limited liability partnership and the U.S. member firm of the KPMG network of independent member firms affiliated with KPMG International Cooperative (“KPMG International”), a Swiss entity. All rights reserved NDPPS 334170
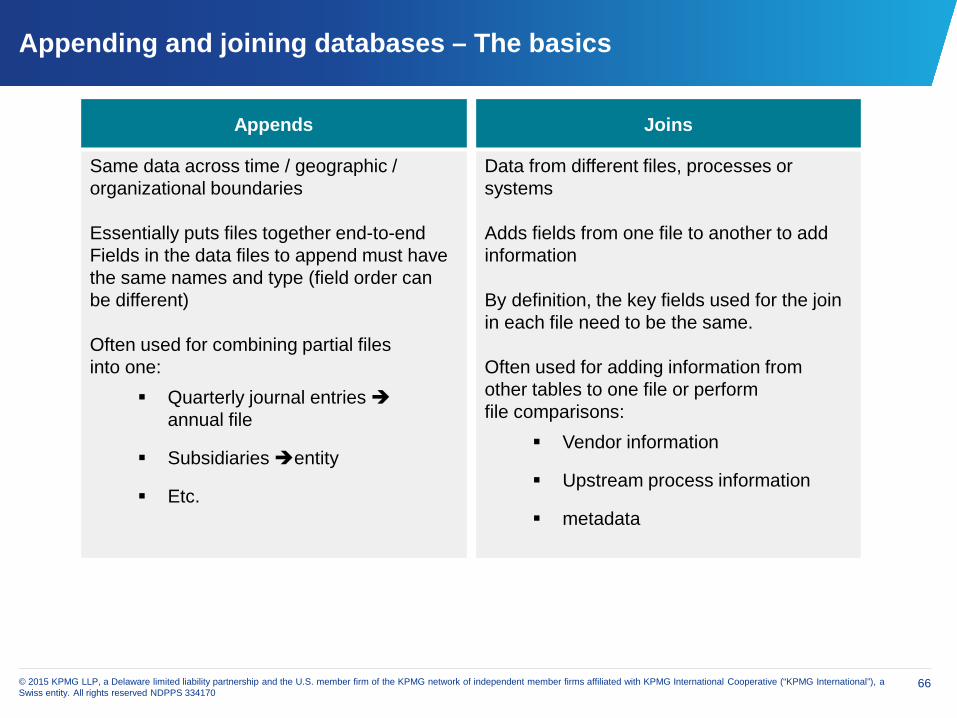
Appending and joining databases – The basics
Appends
Same data across time / geographic / organizational boundaries
Essentially puts files together end-to-endFields in the data files to append must have the same names and type (field order can be different)
Often used for combining partial files into one:
Quarterly journal entries annual file
Subsidiaries entity
Etc.
Joins
Data from different files, processes or systems
Adds fields from one file to another to add information
By definition, the key fields used for the join in each file need to be the same.
Often used for adding information from other tables to one file or perform file comparisons:
Vendor information
Upstream process information
metadata
67© 2015 KPMG LLP, a Delaware limited liability partnership and the U.S. member firm of the KPMG network of independent member firms affiliated with KPMG International Cooperative (“KPMG International”), a Swiss entity. All rights reserved NDPPS 334170
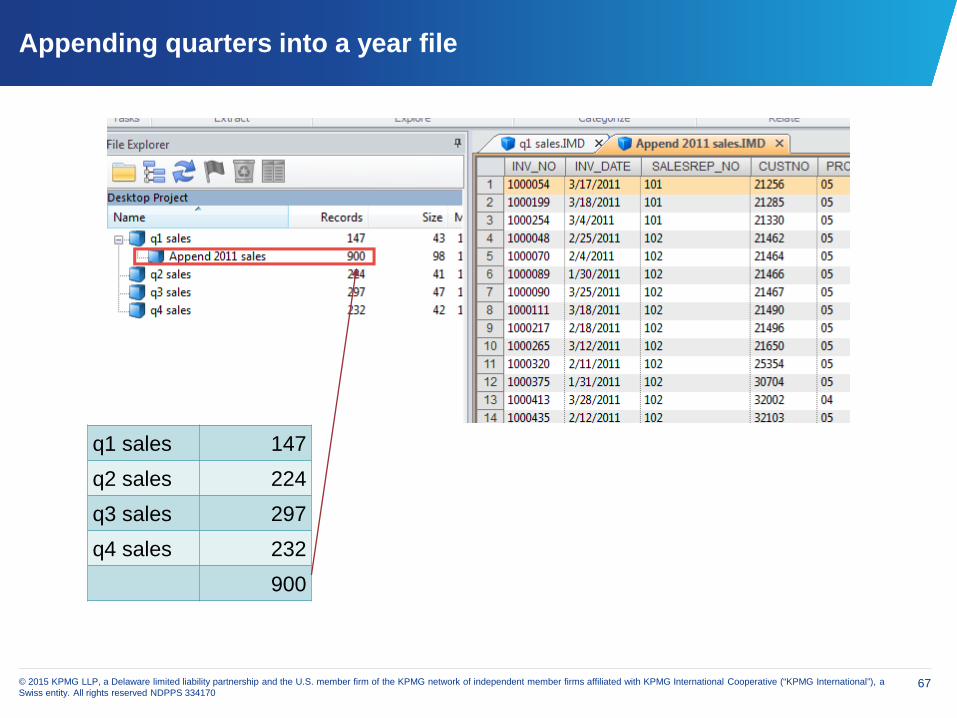
Appending quarters into a year file
q1 sales 147q2 sales 224q3 sales 297q4 sales 232
900

68© 2015 KPMG LLP, a Delaware limited liability partnership and the U.S. member firm of the KPMG network of independent member firms affiliated with KPMG International Cooperative (“KPMG International”), a Swiss entity. All rights reserved NDPPS 334170
Appending – Watch out for…
Fields from appended databases must have the same name and data type in all members of the append; otherwise new fields will be created in the append.
■ Invoice_nr – (character 18) and Invoice_nr (numeric) are not going to line up.
■ Invoice_num and Invoice_nr – (both character 18) are not going to line up.
69© 2015 KPMG LLP, a Delaware limited liability partnership and the U.S. member firm of the KPMG network of independent member firms affiliated with KPMG International Cooperative (“KPMG International”), a Swiss entity. All rights reserved NDPPS 334170
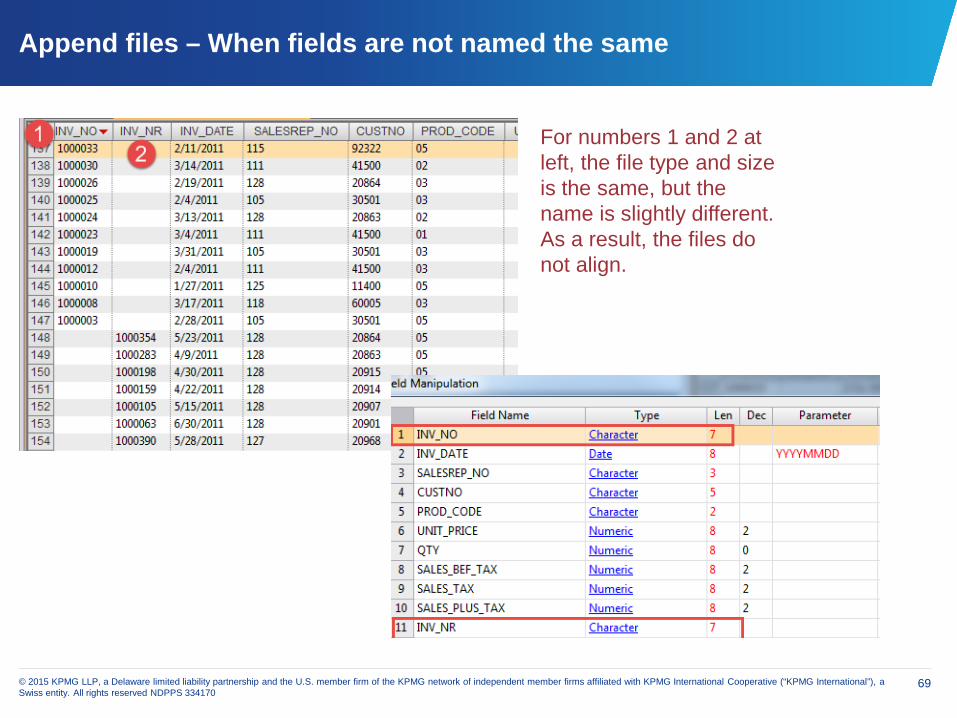
Append files – When fields are not named the same
For numbers 1 and 2 at left, the file type and size is the same, but the name is slightly different. As a result, the files do not align.
70© 2015 KPMG LLP, a Delaware limited liability partnership and the U.S. member firm of the KPMG network of independent member firms affiliated with KPMG International Cooperative (“KPMG International”), a Swiss entity. All rights reserved NDPPS 334170
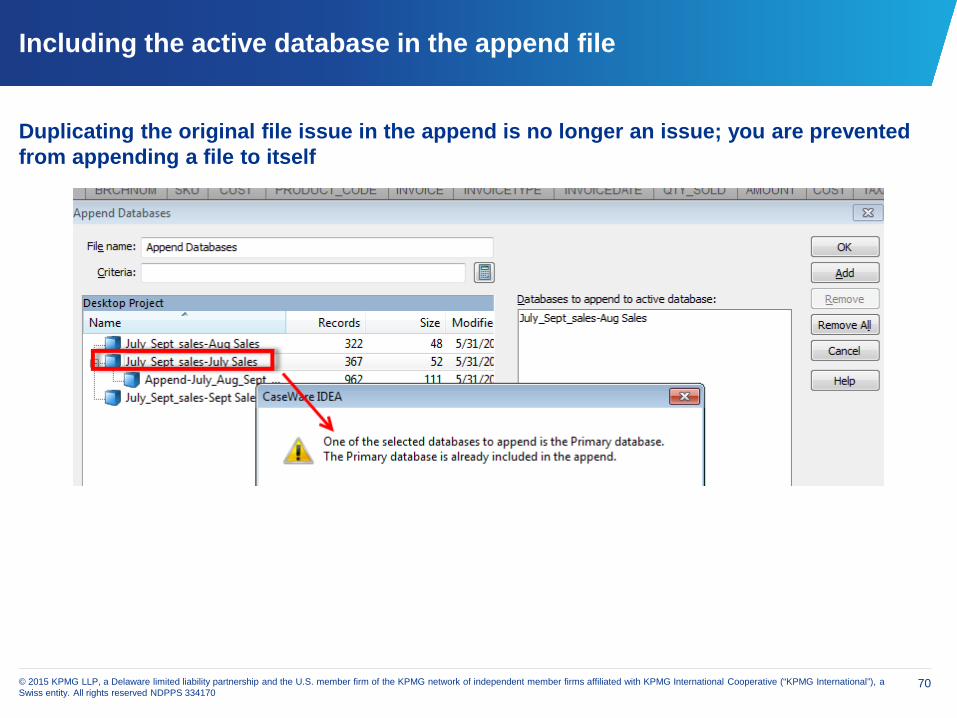
Including the active database in the append file
Duplicating the original file issue in the append is no longer an issue; you are prevented from appending a file to itself
71© 2015 KPMG LLP, a Delaware limited liability partnership and the U.S. member firm of the KPMG network of independent member firms affiliated with KPMG International Cooperative (“KPMG International”), a Swiss entity. All rights reserved NDPPS 334170
Joining databases – Why
Combine information from multiple files for better understanding
■ Vendor codes and vendor names
See relationships between datasets
■ Compare account balances across periods
Trace data through different systems
■ Is the data being modified from systems A – C?
Why not Excel’s Vlookup?
■ Factors that cause Vlookup in Excel to not return all records http://officeimg.vo.msecnd.net/en-us/files/397/327/AF102038056.pdf
72© 2015 KPMG LLP, a Delaware limited liability partnership and the U.S. member firm of the KPMG network of independent member firms affiliated with KPMG International Cooperative (“KPMG International”), a Swiss entity. All rights reserved NDPPS 334170
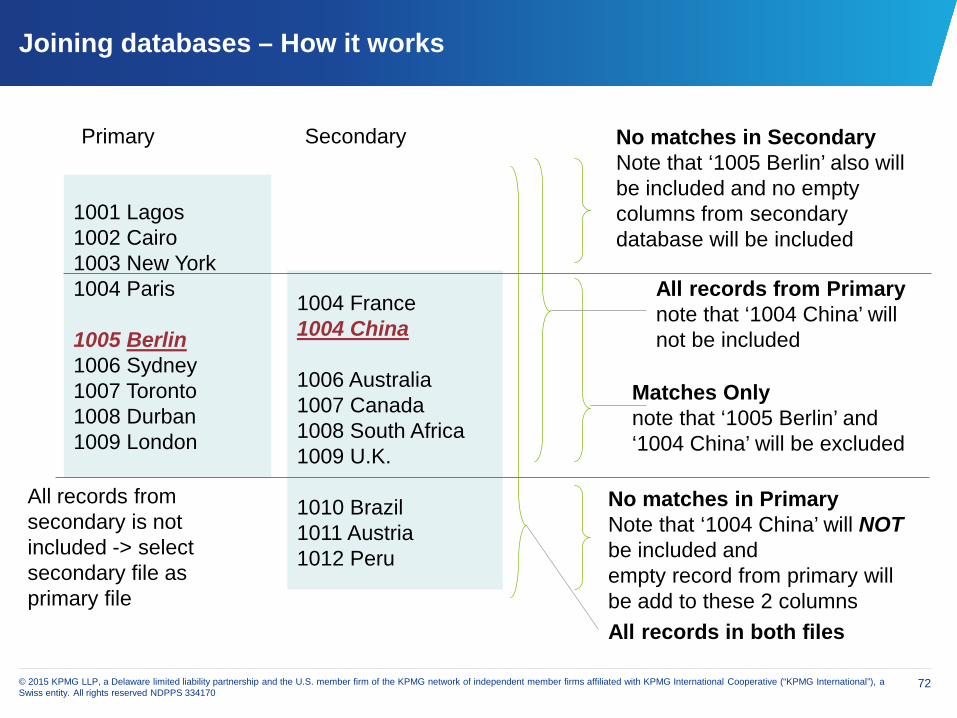
Joining databases – How it works
1001 Lagos 1002 Cairo1003 New York1004 Paris
1005 Berlin1006 Sydney 1007 Toronto 1008 Durban1009 London
1004 France1004 China
1006 Australia1007 Canada 1008 South Africa1009 U.K.
1010 Brazil1011 Austria1012 Peru
Primary Secondary
All records from Primarynote that ‘1004 China’ will not be included
No matches in SecondaryNote that ‘1005 Berlin’ also will be included and no empty columns from secondary database will be included
Matches Onlynote that ‘1005 Berlin’ and ‘1004 China’ will be excluded
No matches in PrimaryNote that ‘1004 China’ will NOTbe included andempty record from primary will be add to these 2 columnsAll records in both files
All records from secondary is not included -> select secondary file as primary file
73© 2015 KPMG LLP, a Delaware limited liability partnership and the U.S. member firm of the KPMG network of independent member firms affiliated with KPMG International Cooperative (“KPMG International”), a Swiss entity. All rights reserved NDPPS 334170
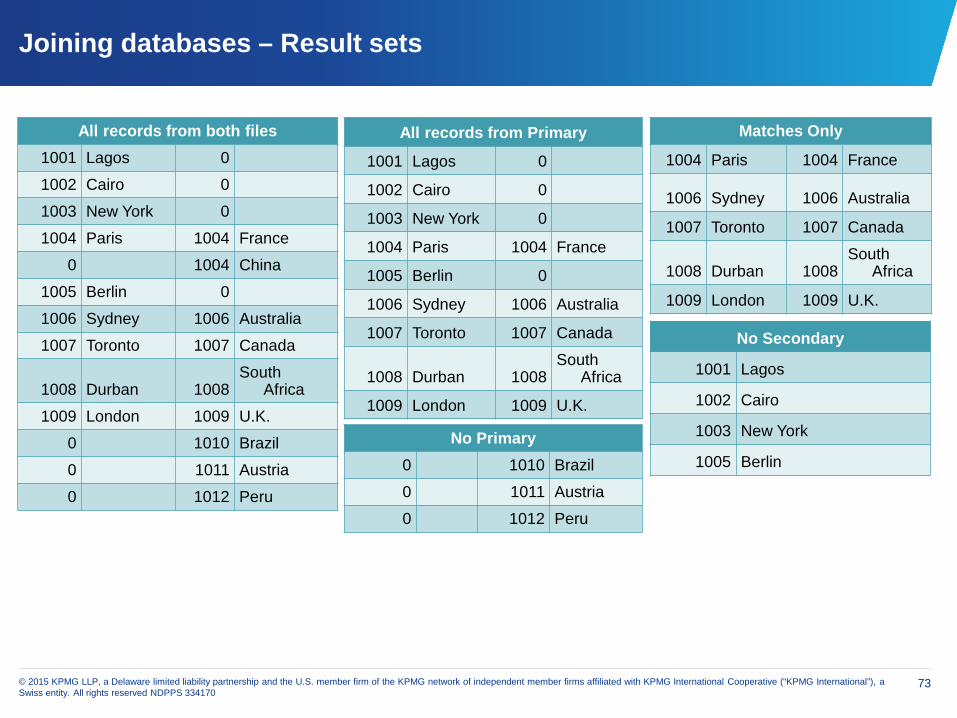
Joining databases – Result sets
All records from both files1001 Lagos 0
1002 Cairo 0
1003 New York 0
1004 Paris 1004 France
0 1004 China
1005 Berlin 0
1006 Sydney 1006 Australia
1007 Toronto 1007 Canada
1008 Durban 1008South
Africa
1009 London 1009 U.K.
0 1010 Brazil
0 1011 Austria
0 1012 Peru
All records from Primary
1001 Lagos 0
1002 Cairo 0
1003 New York 0
1004 Paris 1004 France
1005 Berlin 0
1006 Sydney 1006 Australia
1007 Toronto 1007 Canada
1008 Durban 1008South
Africa
1009 London 1009 U.K.
Matches Only
1004 Paris 1004 France
1006 Sydney 1006 Australia
1007 Toronto 1007 Canada
1008 Durban 1008South
Africa
1009 London 1009 U.K.
No Secondary
1001 Lagos
1002 Cairo
1003 New York
1005 BerlinNo Primary
0 1010 Brazil
0 1011 Austria
0 1012 Peru
74© 2015 KPMG LLP, a Delaware limited liability partnership and the U.S. member firm of the KPMG network of independent member firms affiliated with KPMG International Cooperative (“KPMG International”), a Swiss entity. All rights reserved NDPPS 334170
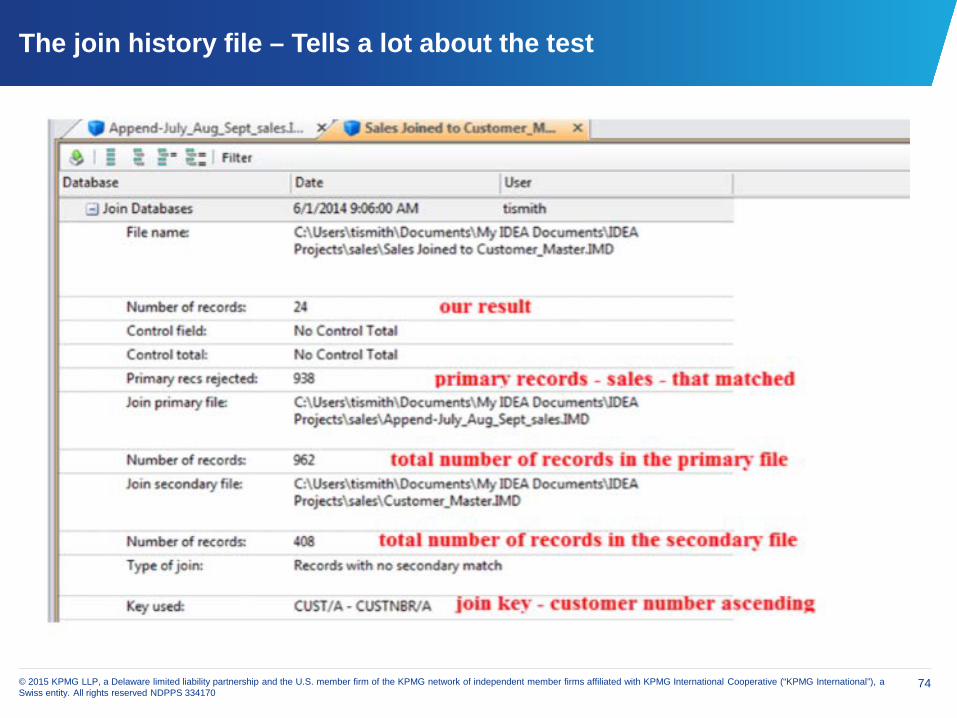
The join history file – Tells a lot about the test

Smart analyzer
Pre-written routines for key audit tests
76© 2015 KPMG LLP, a Delaware limited liability partnership and the U.S. member firm of the KPMG network of independent member firms affiliated with KPMG International Cooperative (“KPMG International”), a Swiss entity. All rights reserved NDPPS 334170
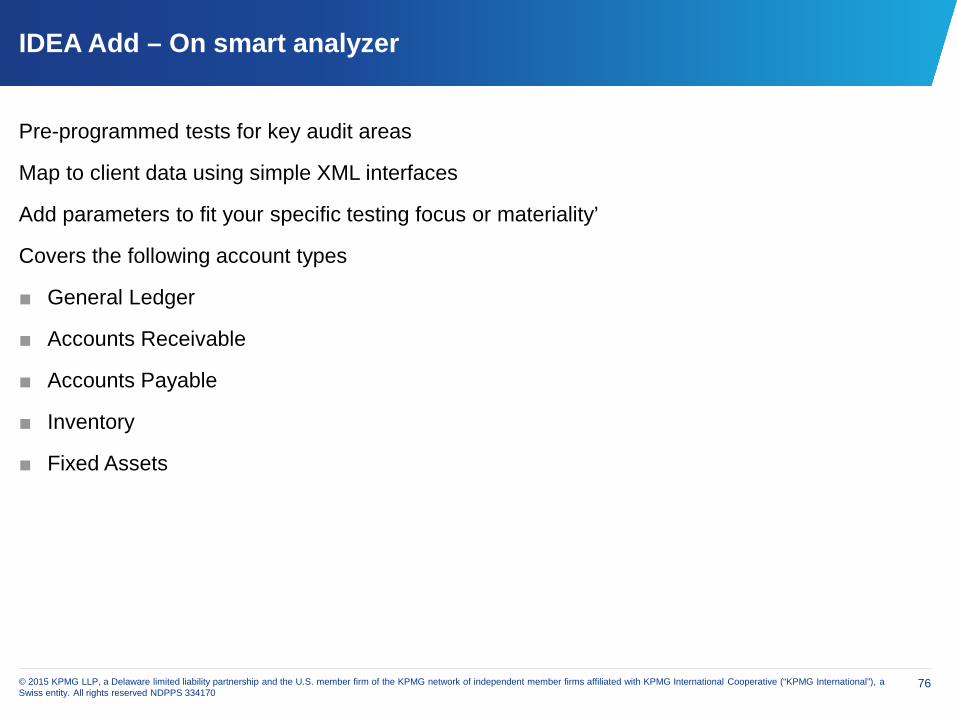
IDEA Add – On smart analyzer
Pre-programmed tests for key audit areas
Map to client data using simple XML interfaces
Add parameters to fit your specific testing focus or materiality’
Covers the following account types
■ General Ledger
■ Accounts Receivable
■ Accounts Payable
■ Inventory
■ Fixed Assets

77© 2015 KPMG LLP, a Delaware limited liability partnership and the U.S. member firm of the KPMG network of independent member firms affiliated with KPMG International Cooperative (“KPMG International”), a Swiss entity. All rights reserved NDPPS 334170
Smart analyzer – Representative tests – General ledger
Out of Balance Journal Entries
Journal Entries with Specific Comments
Duplicate Journal Entries
Journal Entries with Rounded Amounts
Summary by Account Combination
Journal Entries Posted
■ On Weekends
■ On specific dates
■ At specific Times
■ By User
78© 2015 KPMG LLP, a Delaware limited liability partnership and the U.S. member firm of the KPMG network of independent member firms affiliated with KPMG International Cooperative (“KPMG International”), a Swiss entity. All rights reserved NDPPS 334170
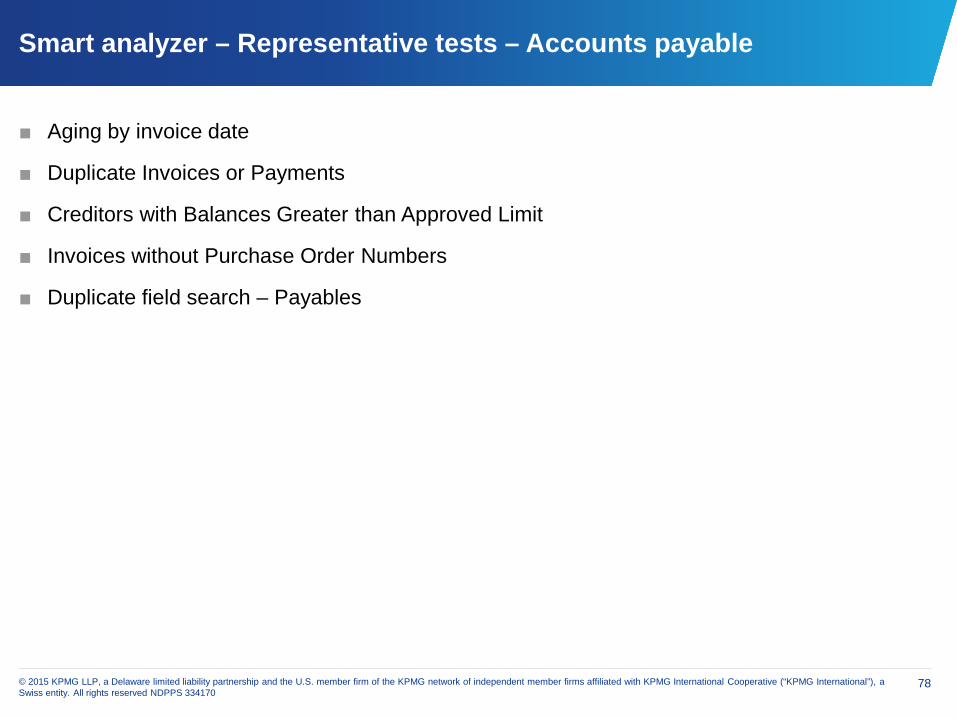
Smart analyzer – Representative tests – Accounts payable
■ Aging by invoice date
■ Duplicate Invoices or Payments
■ Creditors with Balances Greater than Approved Limit
■ Invoices without Purchase Order Numbers
■ Duplicate field search – Payables
79© 2015 KPMG LLP, a Delaware limited liability partnership and the U.S. member firm of the KPMG network of independent member firms affiliated with KPMG International Cooperative (“KPMG International”), a Swiss entity. All rights reserved NDPPS 334170
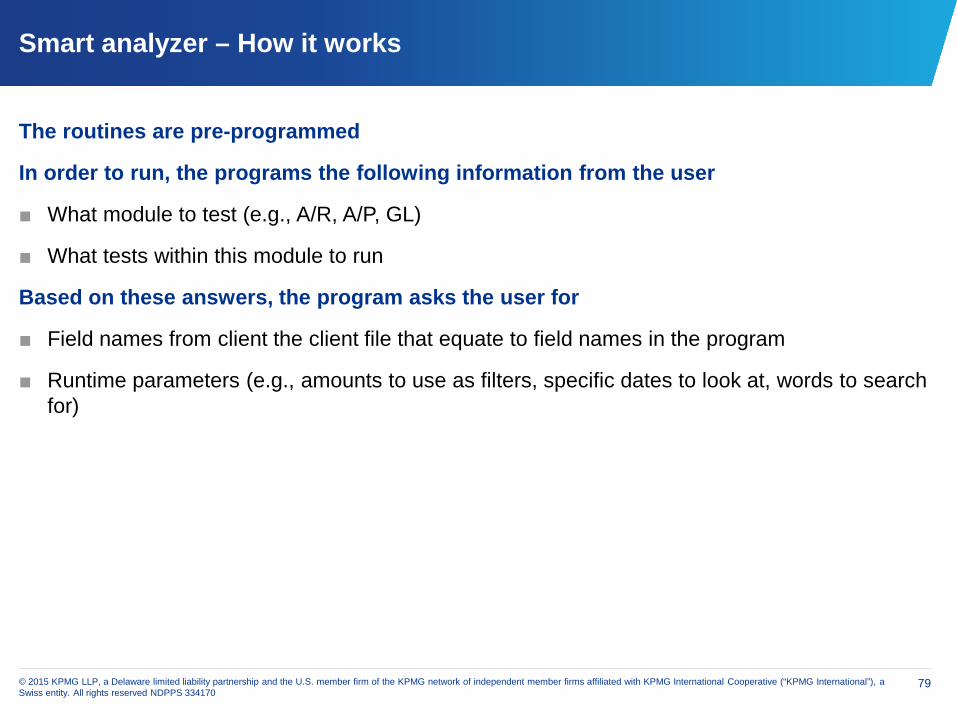
Smart analyzer – How it works
The routines are pre-programmed
In order to run, the programs the following information from the user
■ What module to test (e.g., A/R, A/P, GL)
■ What tests within this module to run
Based on these answers, the program asks the user for
■ Field names from client the client file that equate to field names in the program
■ Runtime parameters (e.g., amounts to use as filters, specific dates to look at, words to search for)
80© 2015 KPMG LLP, a Delaware limited liability partnership and the U.S. member firm of the KPMG network of independent member firms affiliated with KPMG International Cooperative (“KPMG International”), a Swiss entity. All rights reserved NDPPS 334170
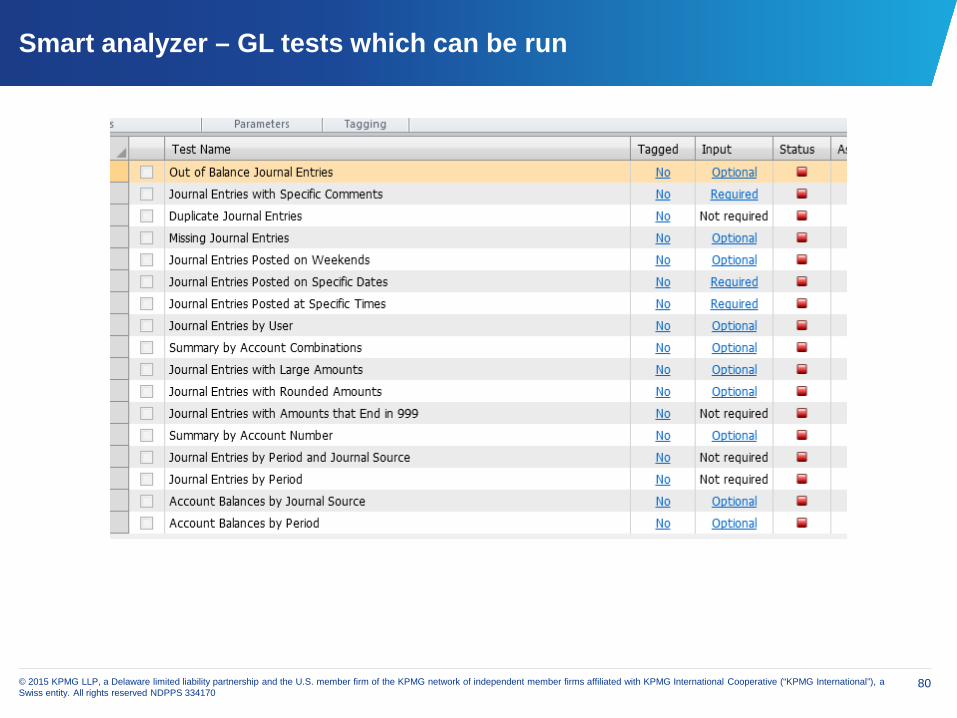
Smart analyzer – GL tests which can be run

81© 2015 KPMG LLP, a Delaware limited liability partnership and the U.S. member firm of the KPMG network of independent member firms affiliated with KPMG International Cooperative (“KPMG International”), a Swiss entity. All rights reserved NDPPS 334170
Smart analyzer – GL tests – Tagging fields

82© 2015 KPMG LLP, a Delaware limited liability partnership and the U.S. member firm of the KPMG network of independent member firms affiliated with KPMG International Cooperative (“KPMG International”), a Swiss entity. All rights reserved NDPPS 334170
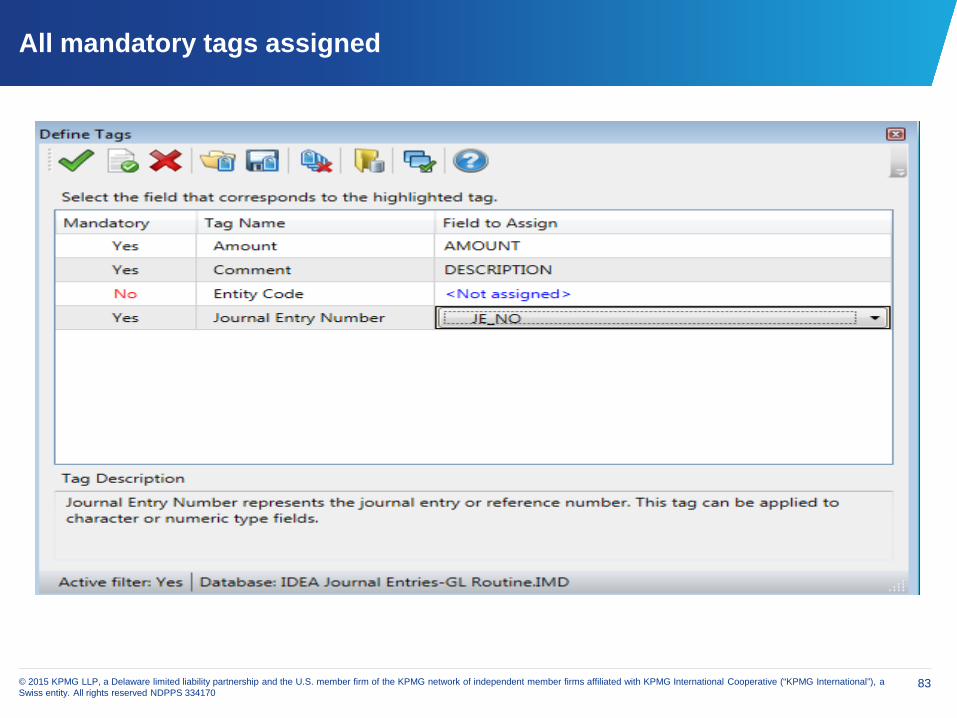
Making the actual assignment of the tags
83© 2015 KPMG LLP, a Delaware limited liability partnership and the U.S. member firm of the KPMG network of independent member firms affiliated with KPMG International Cooperative (“KPMG International”), a Swiss entity. All rights reserved NDPPS 334170
All mandatory tags assigned

Demonstration
Smart analyzer

Visualization
Alteryx and Qlikview

86© 2015 KPMG LLP, a Delaware limited liability partnership and the U.S. member firm of the KPMG network of independent member firms affiliated with KPMG International Cooperative (“KPMG International”), a Swiss entity. All rights reserved NDPPS 334170
Alteryx
87© 2015 KPMG LLP, a Delaware limited liability partnership and the U.S. member firm of the KPMG network of independent member firms affiliated with KPMG International Cooperative (“KPMG International”), a Swiss entity. All rights reserved NDPPS 334170
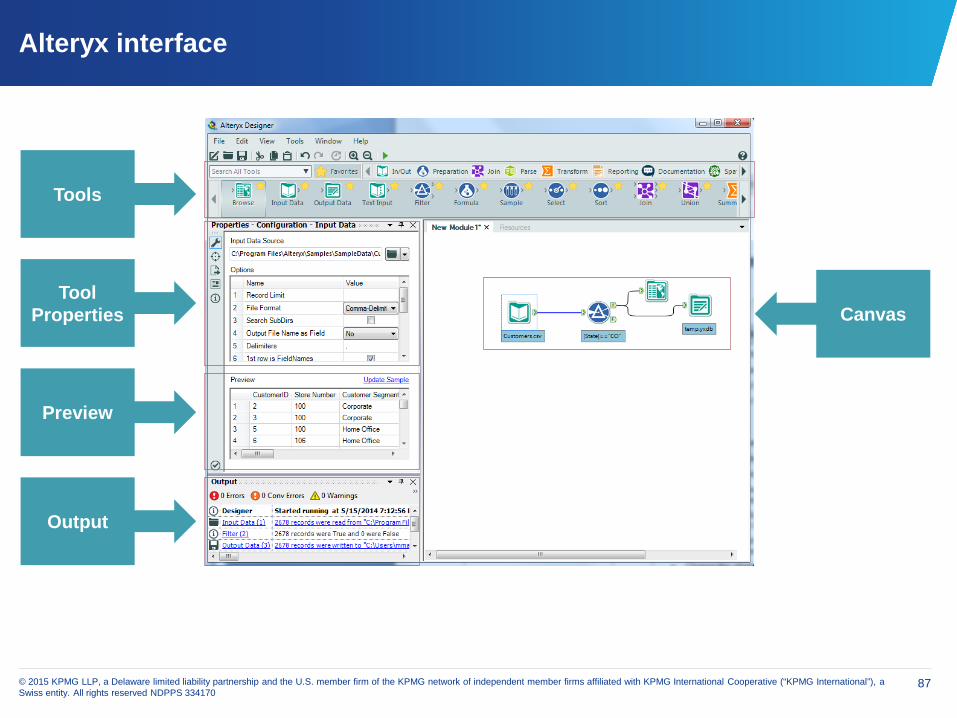
Alteryx interface
Tool Properties
Preview
Output
Tools
Canvas
88© 2015 KPMG LLP, a Delaware limited liability partnership and the U.S. member firm of the KPMG network of independent member firms affiliated with KPMG International Cooperative (“KPMG International”), a Swiss entity. All rights reserved NDPPS 334170
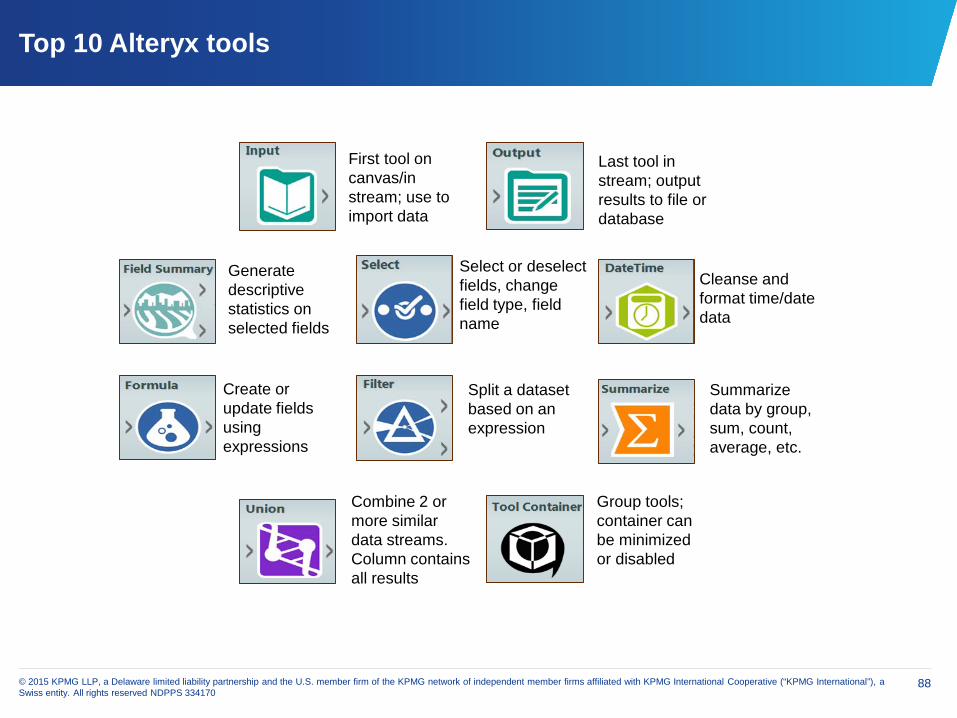
Top 10 Alteryx tools
First tool on canvas/in stream; use to import data
Split a dataset based on an expression
Group tools; container can be minimized or disabled
Generate descriptive statistics on selected fields
Summarize data by group, sum, count, average, etc.
Combine 2 or more similar data streams. Column contains all results
Last tool in stream; output results to file or database
Create or update fields using expressions
Cleanse and format time/date data
Select or deselect fields, change field type, field name

89© 2015 KPMG LLP, a Delaware limited liability partnership and the U.S. member firm of the KPMG network of independent member firms affiliated with KPMG International Cooperative (“KPMG International”), a Swiss entity. All rights reserved NDPPS 334170
QlikView

Demonstration
Visualization

91© 2015 KPMG LLP, a Delaware limited liability partnership and the U.S. member firm of the KPMG network of independent member firms affiliated with KPMG International Cooperative (“KPMG International”), a Swiss entity. All rights reserved NDPPS 334170
Presenter contact information
Micah Manquen
Senior Associate, Advisory ServicesInternal Audit, Risk, and Compliance
KPMG LLP | 550 S. Hope Street | Suite 1500Los Angeles, CA 90071
Mobile +1 (909)-561-4832 | [email protected]
Tim Smith
Associate Director, Global Services Centre, Audit Data and Analytics
KPMG LLP | 4747 Executive Drive | Suite 600 | San Diego, CA 92121
Direct +1 (858) 750-7196 |Mobile +1 (619) 721-9958 | [email protected]
Additional resources
User groups
Hints and tips
Planning considerations for data analytics
Notes for works cited
Reading about data and analytics
CAATs software comparison (Lanza 2004)

93© 2015 KPMG LLP, a Delaware limited liability partnership and the U.S. member firm of the KPMG network of independent member firms affiliated with KPMG International Cooperative (“KPMG International”), a Swiss entity. All rights reserved NDPPS 334170
CAATs User groups in Southern California
ACL
IDEA Independent User Groups

94© 2015 KPMG LLP, a Delaware limited liability partnership and the U.S. member firm of the KPMG network of independent member firms affiliated with KPMG International Cooperative (“KPMG International”), a Swiss entity. All rights reserved NDPPS 334170
Hints and tips
Planning the use of CAATs/Data Analytics
■ Audit Objective
■ Data needed (including fields)
■ Timeline for data
Practice run before year end
Testing validity of imported data
Use the routines build into your tools (i.e., macros, templates)
The more you use a tool more you will learn
If stuck, ask for help
When first doing analytics, try baby steps first before trying complex analysis
95© 2015 KPMG LLP, a Delaware limited liability partnership and the U.S. member firm of the KPMG network of independent member firms affiliated with KPMG International Cooperative (“KPMG International”), a Swiss entity. All rights reserved NDPPS 334170
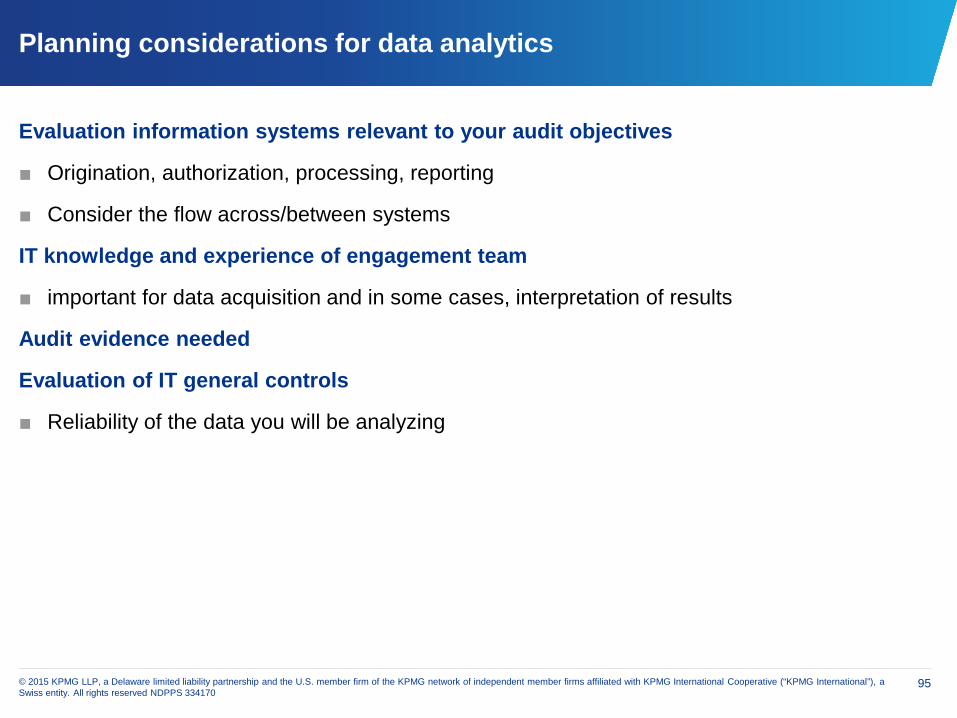
Planning considerations for data analytics
Evaluation information systems relevant to your audit objectives
■ Origination, authorization, processing, reporting
■ Consider the flow across/between systems
IT knowledge and experience of engagement team
■ important for data acquisition and in some cases, interpretation of results
Audit evidence needed
Evaluation of IT general controls
■ Reliability of the data you will be analyzing
96© 2015 KPMG LLP, a Delaware limited liability partnership and the U.S. member firm of the KPMG network of independent member firms affiliated with KPMG International Cooperative (“KPMG International”), a Swiss entity. All rights reserved NDPPS 334170
Notes for works cited
December 2014 Issue of “Internal Auditor” The Year Ahead by Russell Jackson. Quote 1 is from Mr. Jackson in the print edition. Quotes 2 and 3 are from Harold Silverman, Vice President, Internal Audit, at The Wendy’s Co. in Dublin, Ohio, The are from embedded interview clips in the online version of ‘Internal Auditor”
CAATs tool comparisons
Richard Lanza, Comparing Best Software for Fraud Examinations: Fraud Data Interrogation Tools, Nov – Dec 2004
Limits in Excel
http://office.microsoft.com/en-us/excel-help/excel-specifications-and-limits-HP010342495.aspx
Limits in Access
http://office.microsoft.com/en-us/access-help/access-2010-specifications-HA010341462.aspx

97© 2015 KPMG LLP, a Delaware limited liability partnership and the U.S. member firm of the KPMG network of independent member firms affiliated with KPMG International Cooperative (“KPMG International”), a Swiss entity. All rights reserved NDPPS 334170
Reading about data and analytics
Data and Analytics
Code – The Hidden Language of Computer Hardware and Software – Charles Petzold, Microsoft Press, 2000, ISBN-13: 978-0735611313
The Information: A History, A Theory, A Flood – James Gleick, Vintage 2012, ISBN-10: 1400096235 ISBN-13: 978-1400096237
Internal Audit: Efficiency Through Automation (IIA (Institute of Internal Auditors) Series) – David Coderre, IIA, 2008, ISBN-13: 978-0470392423 (author also of CAATs and other Beasts)
Statistics
Statistics in a Nutshell – Sarah Boslaugh (O’Reilly Press) ISBN-13: 978-1449316822

98© 2015 KPMG LLP, a Delaware limited liability partnership and the U.S. member firm of the KPMG network of independent member firms affiliated with KPMG International Cooperative (“KPMG International”), a Swiss entity. All rights reserved NDPPS 334170
CAATs Software comparison (Lanza 2004)
Data Analysis Features Description ACLTM
Active Data ForExcelTM
ExcelTM IDEATM AccessTM
Aging Produces aged summaries of data based on establish cutoff dates. ✔ ✔ ✔
Append/Merge
Combines two files with identical fields into a single file. An example would be to merge two years worth of accounts payable history into one file.
✔ ✔ ✔ ✔ ✔
Calculated Field/Functions
Creates a calculated field (which can use a Field/Function such as ABS for the absolute value of Functions the field) using data within the file. For example, the net payroll pay to an employee could be recalculated using the gross pay field and deducting any withholding/taxes.
✔ ✔ ✔ ✔ ✔
Cross Tabulate
Allows you to analyze character fields by setting them in rows and columns. By cross-tabulating character fields, you can produce various summaries, explore areas of interest, and accumulate numeric fields
✔ ✔ ✔ ✔
99© 2015 KPMG LLP, a Delaware limited liability partnership and the U.S. member firm of the KPMG network of independent member firms affiliated with KPMG International Cooperative (“KPMG International”), a Swiss entity. All rights reserved NDPPS 334170
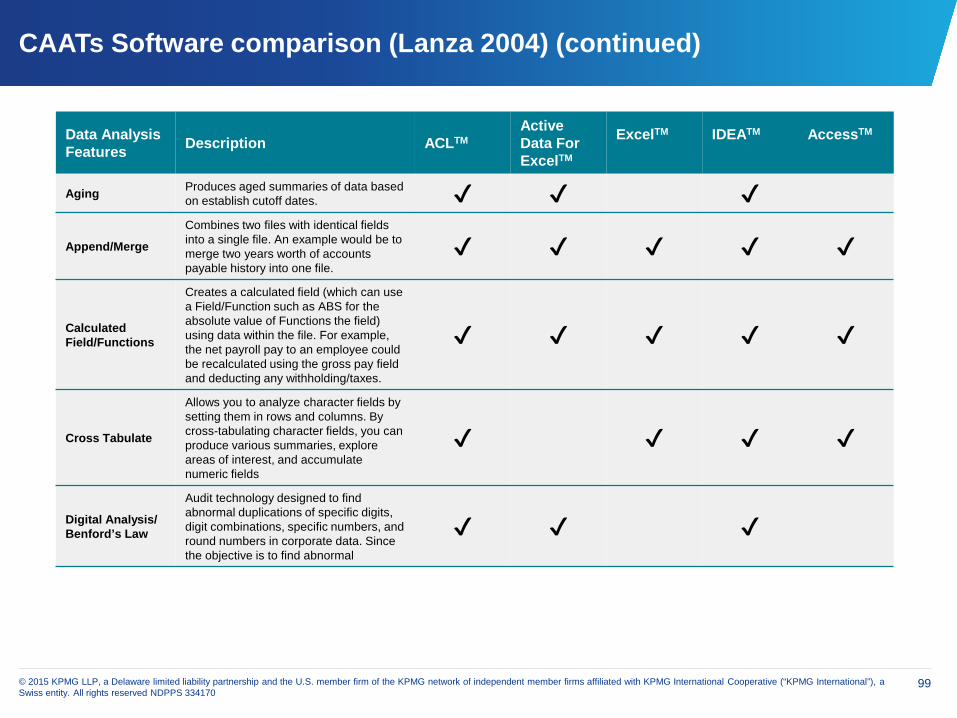
CAATs Software comparison (Lanza 2004) (continued)
Data Analysis Features Description ACLTM
Active Data ForExcelTM
ExcelTM IDEATM AccessTM
Aging Produces aged summaries of data based on establish cutoff dates. ✔ ✔ ✔
Append/Merge
Combines two files with identical fields into a single file. An example would be to merge two years worth of accounts payable history into one file.
✔ ✔ ✔ ✔ ✔
Calculated Field/Functions
Creates a calculated field (which can use a Field/Function such as ABS for the absolute value of Functions the field) using data within the file. For example, the net payroll pay to an employee could be recalculated using the gross pay field and deducting any withholding/taxes.
✔ ✔ ✔ ✔ ✔
Cross Tabulate
Allows you to analyze character fields by setting them in rows and columns. By cross-tabulating character fields, you can produce various summaries, explore areas of interest, and accumulate numeric fields
✔ ✔ ✔ ✔
Digital Analysis/Benford’s Law
Audit technology designed to find abnormal duplications of specific digits, digit combinations, specific numbers, and round numbers in corporate data. Since the objective is to find abnormal
✔ ✔ ✔

100© 2015 KPMG LLP, a Delaware limited liability partnership and the U.S. member firm of the KPMG network of independent member firms affiliated with KPMG International Cooperative (“KPMG International”), a Swiss entity. All rights reserved NDPPS 334170
CAATs Software comparison (Lanza 2004) (continued)
Data Analysis Features Description ACLTM
Active Data ForExcelTM
ExcelTM IDEATM AccessTM
Duplicates
Identifies duplicate items within a specified field in a file. For example, this report could be used to identify duplicate billings of invoices within the sales file.
✔ ✔ ✔ ✔
Export
Creates a file in another software format (for example, Excel, Word) for testing. An example would be to export customer address information to Word for “Mail Merge”ing to customer confirmation letters.
✔ ✔ ✔ ✔ ✔
Extract/Filter
Extracts specified items from one file and copies them to another file, normally using an “if” or “where” statement. Examples include extracting all balances over a predefined limit.
✔ ✔ ✔ ✔ ✔
GapsIdentifies gaps within a specified field in a file. For example, identify any gaps in check sequence.
✔ ✔ ✔
Index/Sort
Sorts a file in ascending or descending order. An example would be sorting a file by social security number to see if any blank or “999999999” numbers exist.
✔ ✔ ✔ ✔ ✔
Join/Relate
Combines specified fields from two different files into a single file using key fields. This function is used to create relational databases on key fields. It can also be done in an unmatched fashion to identify differences between data files.
✔ ✔ ✔
101© 2015 KPMG LLP, a Delaware limited liability partnership and the U.S. member firm of the KPMG network of independent member firms affiliated with KPMG International Cooperative (“KPMG International”), a Swiss entity. All rights reserved NDPPS 334170
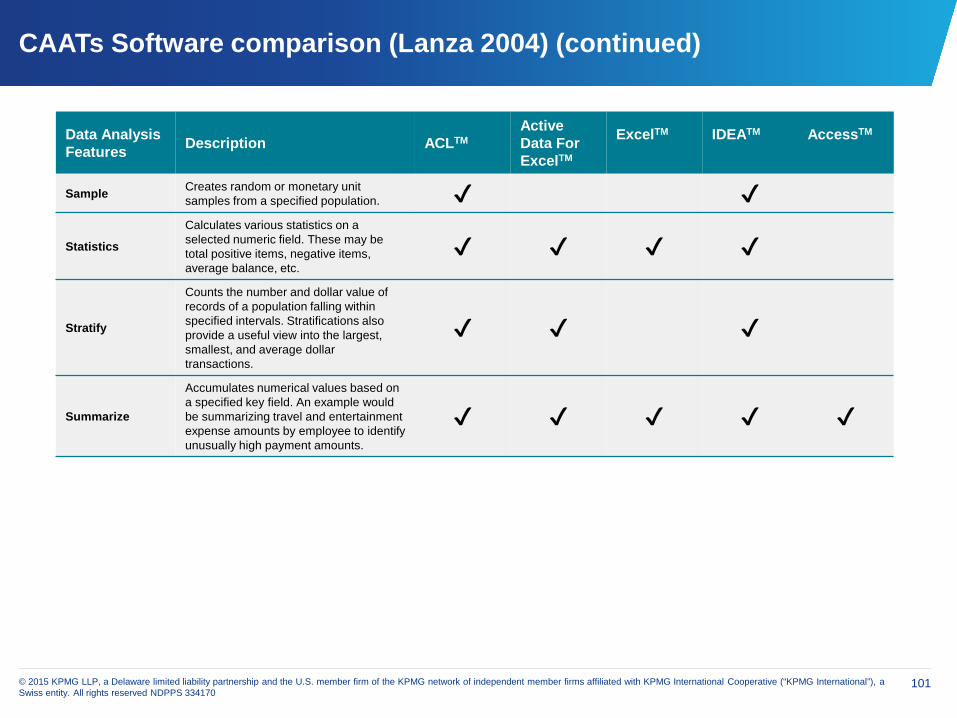
CAATs Software comparison (Lanza 2004) (continued)
Data Analysis Features Description ACLTM
Active Data ForExcelTM
ExcelTM IDEATM AccessTM
Sample Creates random or monetary unit samples from a specified population. ✔ ✔
Statistics
Calculates various statistics on a selected numeric field. These may be total positive items, negative items, average balance, etc.
✔ ✔ ✔ ✔
Stratify
Counts the number and dollar value of records of a population falling within specified intervals. Stratifications also provide a useful view into the largest, smallest, and average dollar transactions.
✔ ✔ ✔
Summarize
Accumulates numerical values based on a specified key field. An example would be summarizing travel and entertainment expense amounts by employee to identify unusually high payment amounts.
✔ ✔ ✔ ✔ ✔


